
hamzi zone
5 Beiträge

hamzi zone
Melden
Nutzer blockieren
Trade eröffnen
9.2 Monate
0 Following
0 Follower
0 Like gegeben
Beiträge
Portfolio
·
--
Artikel
Übersetzung ansehen
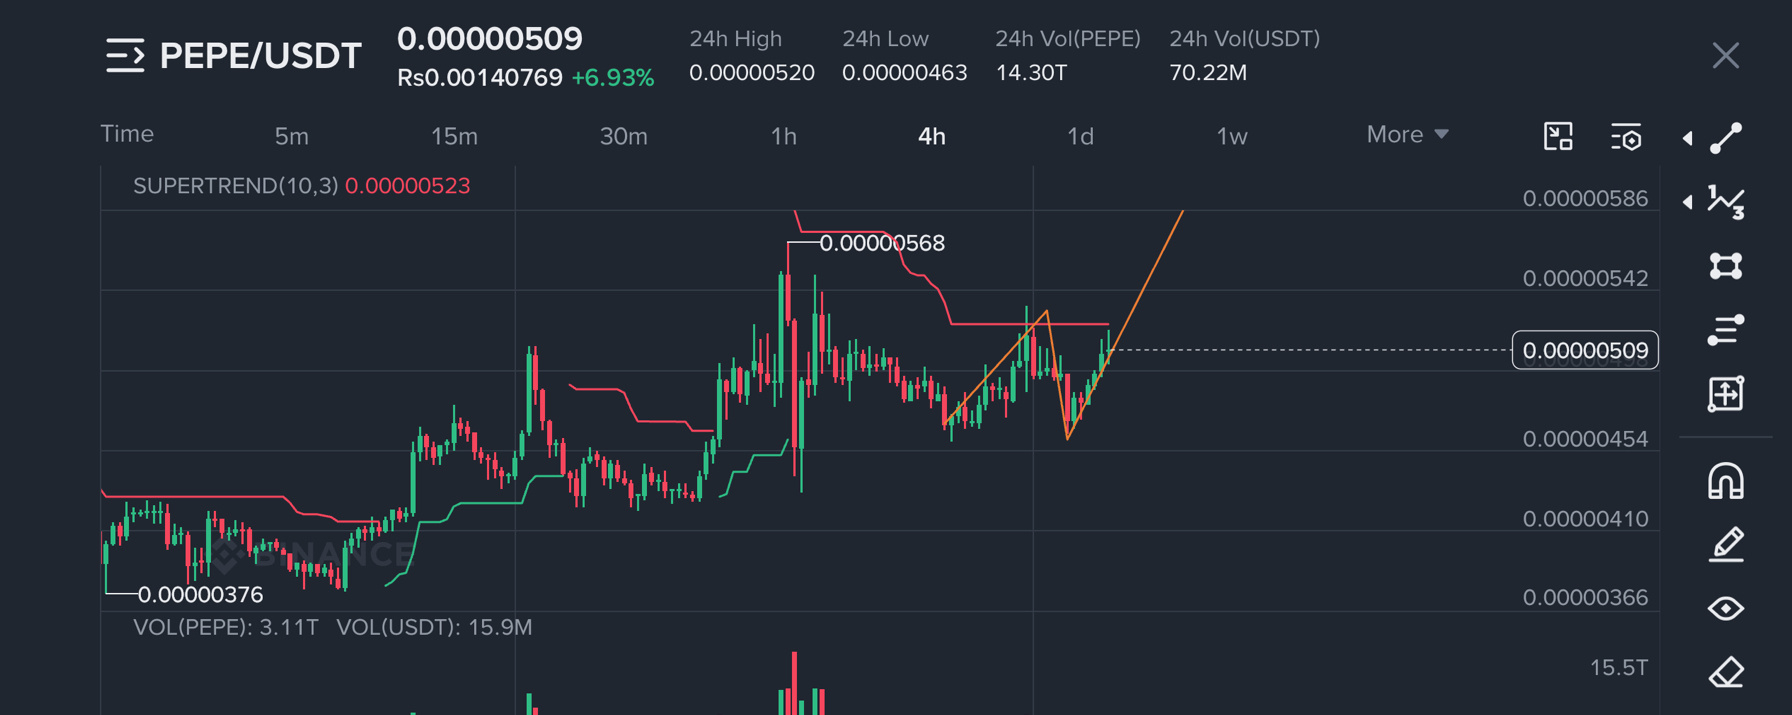
PEPE/USDT Complete Coin Analysis$PEPE Trading pair: PEPE/USDT Blockchain: Ethereum (ERC-20) Chart timeframe: 4 Hours (4H) Price in your screenshot: $0.00000508 24-hour change: +6.28% 24-hour high: $0.00000520 24-hour low: $0.00000463
1. Technical analysis of your chart
Based on your November 6 screenshot, PEPE is showing a short-term recovery after previously trading considerably lower.
Here are the important observations:
Price recovered from approximately $0.00000377.
Buyers pushed the price towards $0.00000568.
The market then experienced a correction.
Buyers have recently returned, pushing the price back towards $0.00000508.
The Supertrend indicator is still red at $0.00000523.
Important: The price is recovering, but the Supertrend has not confirmed a bullish trend reversal yet.
2. Important price levels
Price
Significance
$0.00000520
Immediate resistance
$0.00000523
Supertrend resistance
$0.00000542
Higher resistance
$0.00000568
Previous swing high
$0.00000483
Nearby support
$0.00000455
Important support
$0.00000411
Lower support
These are approximate chart levels, not guaranteed future prices.
3. Supertrend indicator analysis
Bearish signal
Supertrend: $0.00000523
Your current price is $0.00000508, which is below the Supertrend line.
This means:
The indicator has not confirmed a bullish trend.
The market is attempting to recover.
A move above $0.00000523 would be an important technical development.
Failure to move above resistance could lead to another pullback.
4. Three possible market scenarios
Scenario A: Bullish recovery
Positive scenario
Price moves above $0.00000520.
It establishes support above $0.00000523.
The next chart resistance is around $0.00000542.
The previous high is $0.00000568.
Scenario B: Sideways movement
Neutral scenario
Price remains between approximately $0.00000483 and $0.00000523.
Buyers and sellers remain relatively balanced.
The market needs stronger volume to establish direction.
Scenario C: Bearish correction
Negative scenario
Price loses $0.00000483.
Attention shifts towards $0.00000455.
Further weakness could bring $0.00000411 into focus.
These are conditional scenarios, not predictions.
5. Volume analysis
Your screenshot shows:
Volume information
Value
24-hour PEPE volume
14.34 trillion
24-hour USDT volume
$70.39 million
Latest displayed candle volume
3.02 trillion PEPE
Latest candle USDT volume
$15.4 million
Volume is important because price increases supported by stronger trading activity can indicate greater market participation.
However, high volume alone does not guarantee that the price will continue rising.
6. What is PEPE coin?
Pepe (PEPE)
Ethereum-based meme cryptocurrency
PEPE became popular through internet meme culture and community interest.
Some important characteristics:
It is an ERC-20 token on Ethereum.
Its popularity is strongly influenced by internet culture.
Its price can react to social-media attention.
It does not have the same fundamental use case as a major blockchain network.
Its market value can change dramatically.
PEPE belongs to the highly speculative meme-coin category. Cryptonews +1
7. What factors can move PEPE’s price?
Bitcoin’s overall market direction.
Ethereum market performance.
Meme-coin market sentiment.
Large-holder transactions.
Exchange trading volume.
Social-media attention.
Changes in market liquidity.
Major cryptocurrency market news.
8. Overall assessment
PEPE/USDT
Assessment based on your supplied 4H chart
Short-term price movement
Recovering
Supertrend
Bearish
Immediate resistance
$0.00000520–$0.00000523
Nearby support
$0.00000483
Overall uncertainty
High
My conclusion: PEPE is showing a recovery, but the chart does not yet confirm a complete bullish reversal. The $0.00000520–$0.00000523 region is particularly important to watch. A rejection there could weaken the recovery.
Remember that meme coins are extremely volatile, and this chart analysis is educational rather than a recommendation to buy or sell.
9. What additional information would improve this analysis?
The screenshot only provides a historical chart snapshot. A current chart and broader market data would help establish whether the recovery is continuing.
I can also explain PEPE’s tokenomics, circulating supply, market capitalization, and historical performance in a separate research report.
$PEPE
#BinanceReopensWithdrawalsForMoreAssets
{spot}(PEPEUSDT)
PEPE/USDT Complete Coin Analysis
$PEPE Trading pair: PEPE/USDT Blockchain: Ethereum (ERC-20) Chart timeframe: 4 Hours (4H) Price in your screenshot: $0.00000508 24-hour change: +6.28% 24-hour high: $0.00000520 24-hour low: $0.00000463
1. Technical analysis of your chart
Based on your November 6 screenshot, PEPE is showing a short-term recovery after previously trading considerably lower.
Here are the important observations:
Price recovered from approximately $0.00000377.
Buyers pushed the price towards $0.00000568.
The market then experienced a correction.
Buyers have recently returned, pushing the price back towards $0.00000508.
The Supertrend indicator is still red at $0.00000523.
Important: The price is recovering, but the Supertrend has not confirmed a bullish trend reversal yet.
2. Important price levels
Price
Significance
$0.00000520
Immediate resistance
$0.00000523
Supertrend resistance
$0.00000542
Higher resistance
$0.00000568
Previous swing high
$0.00000483
Nearby support
$0.00000455
Important support
$0.00000411
Lower support
These are approximate chart levels, not guaranteed future prices.
3. Supertrend indicator analysis
Bearish signal
Supertrend: $0.00000523
Your current price is $0.00000508, which is below the Supertrend line.
This means:
The indicator has not confirmed a bullish trend.
The market is attempting to recover.
A move above $0.00000523 would be an important technical development.
Failure to move above resistance could lead to another pullback.
4. Three possible market scenarios
Scenario A: Bullish recovery
Positive scenario
Price moves above $0.00000520.
It establishes support above $0.00000523.
The next chart resistance is around $0.00000542.
The previous high is $0.00000568.
Scenario B: Sideways movement
Neutral scenario
Price remains between approximately $0.00000483 and $0.00000523.
Buyers and sellers remain relatively balanced.
The market needs stronger volume to establish direction.
Scenario C: Bearish correction
Negative scenario
Price loses $0.00000483.
Attention shifts towards $0.00000455.
Further weakness could bring $0.00000411 into focus.
These are conditional scenarios, not predictions.
5. Volume analysis
Your screenshot shows:
Volume information
Value
24-hour PEPE volume
14.34 trillion
24-hour USDT volume
$70.39 million
Latest displayed candle volume
3.02 trillion PEPE
Latest candle USDT volume
$15.4 million
Volume is important because price increases supported by stronger trading activity can indicate greater market participation.
However, high volume alone does not guarantee that the price will continue rising.
6. What is PEPE coin?
Pepe (PEPE)
Ethereum-based meme cryptocurrency
PEPE became popular through internet meme culture and community interest.
Some important characteristics:
It is an ERC-20 token on Ethereum.
Its popularity is strongly influenced by internet culture.
Its price can react to social-media attention.
It does not have the same fundamental use case as a major blockchain network.
Its market value can change dramatically.
PEPE belongs to the highly speculative meme-coin category. Cryptonews +1
7. What factors can move PEPE’s price?
Bitcoin’s overall market direction.
Ethereum market performance.
Meme-coin market sentiment.
Large-holder transactions.
Exchange trading volume.
Social-media attention.
Changes in market liquidity.
Major cryptocurrency market news.
8. Overall assessment
PEPE/USDT
Assessment based on your supplied 4H chart
Short-term price movement
Recovering
Supertrend
Bearish
Immediate resistance
$0.00000520–$0.00000523
Nearby support
$0.00000483
Overall uncertainty
High
My conclusion: PEPE is showing a recovery, but the chart does not yet confirm a complete bullish reversal. The $0.00000520–$0.00000523 region is particularly important to watch. A rejection there could weaken the recovery.
Remember that meme coins are extremely volatile, and this chart analysis is educational rather than a recommendation to buy or sell.
9. What additional information would improve this analysis?
The screenshot only provides a historical chart snapshot. A current chart and broader market data would help establish whether the recovery is continuing.
I can also explain PEPE’s tokenomics, circulating supply, market capitalization, and historical performance in a separate research report.
$PEPE
#BinanceReopensWithdrawalsForMoreAssets
1. Technical analysis of your chart
Based on your November 6 screenshot, PEPE is showing a short-term recovery after previously trading considerably lower.
Here are the important observations:
Price recovered from approximately $0.00000377.
Buyers pushed the price towards $0.00000568.
The market then experienced a correction.
Buyers have recently returned, pushing the price back towards $0.00000508.
The Supertrend indicator is still red at $0.00000523.
Important: The price is recovering, but the Supertrend has not confirmed a bullish trend reversal yet.
2. Important price levels
Price
Significance
$0.00000520
Immediate resistance
$0.00000523
Supertrend resistance
$0.00000542
Higher resistance
$0.00000568
Previous swing high
$0.00000483
Nearby support
$0.00000455
Important support
$0.00000411
Lower support
These are approximate chart levels, not guaranteed future prices.
3. Supertrend indicator analysis
Bearish signal
Supertrend: $0.00000523
Your current price is $0.00000508, which is below the Supertrend line.
This means:
The indicator has not confirmed a bullish trend.
The market is attempting to recover.
A move above $0.00000523 would be an important technical development.
Failure to move above resistance could lead to another pullback.
4. Three possible market scenarios
Scenario A: Bullish recovery
Positive scenario
Price moves above $0.00000520.
It establishes support above $0.00000523.
The next chart resistance is around $0.00000542.
The previous high is $0.00000568.
Scenario B: Sideways movement
Neutral scenario
Price remains between approximately $0.00000483 and $0.00000523.
Buyers and sellers remain relatively balanced.
The market needs stronger volume to establish direction.
Scenario C: Bearish correction
Negative scenario
Price loses $0.00000483.
Attention shifts towards $0.00000455.
Further weakness could bring $0.00000411 into focus.
These are conditional scenarios, not predictions.
5. Volume analysis
Your screenshot shows:
Volume information
Value
24-hour PEPE volume
14.34 trillion
24-hour USDT volume
$70.39 million
Latest displayed candle volume
3.02 trillion PEPE
Latest candle USDT volume
$15.4 million
Volume is important because price increases supported by stronger trading activity can indicate greater market participation.
However, high volume alone does not guarantee that the price will continue rising.
6. What is PEPE coin?
Pepe (PEPE)
Ethereum-based meme cryptocurrency
PEPE became popular through internet meme culture and community interest.
Some important characteristics:
It is an ERC-20 token on Ethereum.
Its popularity is strongly influenced by internet culture.
Its price can react to social-media attention.
It does not have the same fundamental use case as a major blockchain network.
Its market value can change dramatically.
PEPE belongs to the highly speculative meme-coin category. Cryptonews +1
7. What factors can move PEPE’s price?
Bitcoin’s overall market direction.
Ethereum market performance.
Meme-coin market sentiment.
Large-holder transactions.
Exchange trading volume.
Social-media attention.
Changes in market liquidity.
Major cryptocurrency market news.
8. Overall assessment
PEPE/USDT
Assessment based on your supplied 4H chart
Short-term price movement
Recovering
Supertrend
Bearish
Immediate resistance
$0.00000520–$0.00000523
Nearby support
$0.00000483
Overall uncertainty
High
My conclusion: PEPE is showing a recovery, but the chart does not yet confirm a complete bullish reversal. The $0.00000520–$0.00000523 region is particularly important to watch. A rejection there could weaken the recovery.
Remember that meme coins are extremely volatile, and this chart analysis is educational rather than a recommendation to buy or sell.
9. What additional information would improve this analysis?
The screenshot only provides a historical chart snapshot. A current chart and broader market data would help establish whether the recovery is continuing.
I can also explain PEPE’s tokenomics, circulating supply, market capitalization, and historical performance in a separate research report.
$PEPE
#BinanceReopensWithdrawalsForMoreAssets
146
·
--
Artikel
Übersetzung ansehen
Gold (XAUUSDT) – Technical Analysis$XAU
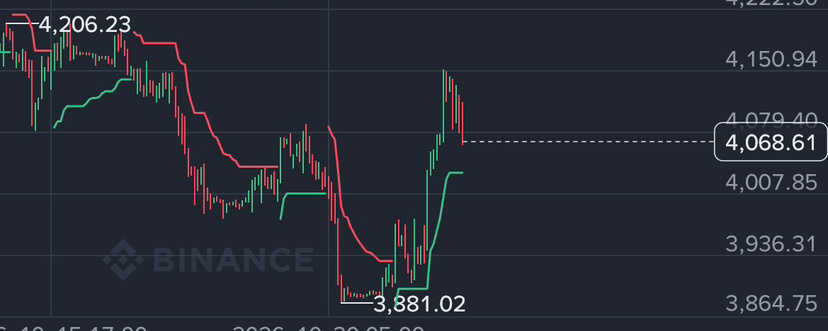
I have analyzed your Binance screenshot. It shows XAUUSDT Perpetual Futures on the 4-hour timeframe (4H).
Short-term recovery visible
1. Chart analysis
4,068.61 USDT
Price shown in your screenshot, not a live quote
Here is what the chart indicates:
Previous high: 4,206.23
Recent low: 3,881.02
Current price: 4,068.61
Supertrend: 4,032.52 (green)
Gold experienced a significant decline, found support around 3,881, and then recovered strongly.
However, the latest candles show some rejection after the move towards 4,150. This suggests that buyers and sellers are currently competing.
2. Important technical levels
Level
Price
Significance
Resistance 2
4,150
Strong resistance area
Resistance 1
4,079
Nearby resistance
Current price
4,068.61
Current chart price
Support 1
4,032
Supertrend support
Support 2
4,008
Further support
Support 3
3,936
Lower support
Major low
3,881
Previous swing low
Important: A move above resistance or below support needs candle confirmation. These levels are estimates from your screenshot, not guaranteed turning points.
3. Latest gold market updates – November 6, 2026
The latest reports indicate a strong recovery in gold after its recent sell-off.
Bullish recovery
Latest reported market developments
Important market developments:
US dollar weakness: The dollar weakened following US midterm election results, supporting gold prices.
Treasury yields: Lower US Treasury yields helped gold recover.
Central bank demand: Central banks purchased approximately 321 tonnes of gold in Q3 2026, according to the World Gold Council.
ETF demand: Gold ETF holdings also reached a reported record of 4,256 tonnes.
US employment data: The October US Non-Farm Payrolls report is a key event for November 6. Its results could influence gold through changes in interest-rate expectations. Reuters +3
4. What could happen next?
There are two important scenarios to understand:
Bullish scenario
Gold holds above the 4,032–4,008 support area shown in your chart.
It recovers above 4,079.
The 4,150 resistance becomes important.
A sustained move above 4,150 could indicate further recovery.
Recovery scenario
Bearish scenario
Gold loses the 4,032 support area.
Price moves below 4,008.
The next areas to watch are 3,936 and 3,881.
Downside risk
5. My overall assessment
The broader market has shown signs of recovery, supported by a weaker dollar and lower bond yields. However, the recovery is not yet proof that the previous downtrend has ended.
The most important upcoming event is US employment data. Also, remember that the screenshot shows a historical chart snapshot, not today’s live market.
Risk note: Your screenshot displays 20x leverage on perpetual futures. That can magnify losses as well as gains, so these levels are for educational chart analysis, not instructions to open a position.
6. Latest news sources
Reuters – Gold rises as dollar and yields weaken
FXEmpire – Gold technical forecast
World Gold Council – Gold market commentary
Wall Street Journal – Gold market update, November 6
I can also analyze your next XAUUSDT screenshot and explain the 15-minute, 1-hour and 4-hour chart trends in English.
#BinanceReopensWithdrawalsForMoreAssets #USStocksSlipandCryptoMarketUnderBroadPressure $XAU
{future}(XAUUSDT)
Gold (XAUUSDT) – Technical Analysis
$XAU
I have analyzed your Binance screenshot. It shows XAUUSDT Perpetual Futures on the 4-hour timeframe (4H).
Short-term recovery visible
1. Chart analysis
4,068.61 USDT
Price shown in your screenshot, not a live quote
Here is what the chart indicates:
Previous high: 4,206.23
Recent low: 3,881.02
Current price: 4,068.61
Supertrend: 4,032.52 (green)
Gold experienced a significant decline, found support around 3,881, and then recovered strongly.
However, the latest candles show some rejection after the move towards 4,150. This suggests that buyers and sellers are currently competing.
2. Important technical levels
Level
Price
Significance
Resistance 2
4,150
Strong resistance area
Resistance 1
4,079
Nearby resistance
Current price
4,068.61
Current chart price
Support 1
4,032
Supertrend support
Support 2
4,008
Further support
Support 3
3,936
Lower support
Major low
3,881
Previous swing low
Important: A move above resistance or below support needs candle confirmation. These levels are estimates from your screenshot, not guaranteed turning points.
3. Latest gold market updates – November 6, 2026
The latest reports indicate a strong recovery in gold after its recent sell-off.
Bullish recovery
Latest reported market developments
Important market developments:
US dollar weakness: The dollar weakened following US midterm election results, supporting gold prices.
Treasury yields: Lower US Treasury yields helped gold recover.
Central bank demand: Central banks purchased approximately 321 tonnes of gold in Q3 2026, according to the World Gold Council.
ETF demand: Gold ETF holdings also reached a reported record of 4,256 tonnes.
US employment data: The October US Non-Farm Payrolls report is a key event for November 6. Its results could influence gold through changes in interest-rate expectations. Reuters +3
4. What could happen next?
There are two important scenarios to understand:
Bullish scenario
Gold holds above the 4,032–4,008 support area shown in your chart.
It recovers above 4,079.
The 4,150 resistance becomes important.
A sustained move above 4,150 could indicate further recovery.
Recovery scenario
Bearish scenario
Gold loses the 4,032 support area.
Price moves below 4,008.
The next areas to watch are 3,936 and 3,881.
Downside risk
5. My overall assessment
The broader market has shown signs of recovery, supported by a weaker dollar and lower bond yields. However, the recovery is not yet proof that the previous downtrend has ended.
The most important upcoming event is US employment data. Also, remember that the screenshot shows a historical chart snapshot, not today’s live market.
Risk note: Your screenshot displays 20x leverage on perpetual futures. That can magnify losses as well as gains, so these levels are for educational chart analysis, not instructions to open a position.
6. Latest news sources
Reuters – Gold rises as dollar and yields weaken
FXEmpire – Gold technical forecast
World Gold Council – Gold market commentary
Wall Street Journal – Gold market update, November 6
I can also analyze your next XAUUSDT screenshot and explain the 15-minute, 1-hour and 4-hour chart trends in English.
#BinanceReopensWithdrawalsForMoreAssets #USStocksSlipandCryptoMarketUnderBroadPressure $XAU
I have analyzed your Binance screenshot. It shows XAUUSDT Perpetual Futures on the 4-hour timeframe (4H).
Short-term recovery visible
1. Chart analysis
4,068.61 USDT
Price shown in your screenshot, not a live quote
Here is what the chart indicates:
Previous high: 4,206.23
Recent low: 3,881.02
Current price: 4,068.61
Supertrend: 4,032.52 (green)
Gold experienced a significant decline, found support around 3,881, and then recovered strongly.
However, the latest candles show some rejection after the move towards 4,150. This suggests that buyers and sellers are currently competing.
2. Important technical levels
Level
Price
Significance
Resistance 2
4,150
Strong resistance area
Resistance 1
4,079
Nearby resistance
Current price
4,068.61
Current chart price
Support 1
4,032
Supertrend support
Support 2
4,008
Further support
Support 3
3,936
Lower support
Major low
3,881
Previous swing low
Important: A move above resistance or below support needs candle confirmation. These levels are estimates from your screenshot, not guaranteed turning points.
3. Latest gold market updates – November 6, 2026
The latest reports indicate a strong recovery in gold after its recent sell-off.
Bullish recovery
Latest reported market developments
Important market developments:
US dollar weakness: The dollar weakened following US midterm election results, supporting gold prices.
Treasury yields: Lower US Treasury yields helped gold recover.
Central bank demand: Central banks purchased approximately 321 tonnes of gold in Q3 2026, according to the World Gold Council.
ETF demand: Gold ETF holdings also reached a reported record of 4,256 tonnes.
US employment data: The October US Non-Farm Payrolls report is a key event for November 6. Its results could influence gold through changes in interest-rate expectations. Reuters +3
4. What could happen next?
There are two important scenarios to understand:
Bullish scenario
Gold holds above the 4,032–4,008 support area shown in your chart.
It recovers above 4,079.
The 4,150 resistance becomes important.
A sustained move above 4,150 could indicate further recovery.
Recovery scenario
Bearish scenario
Gold loses the 4,032 support area.
Price moves below 4,008.
The next areas to watch are 3,936 and 3,881.
Downside risk
5. My overall assessment
The broader market has shown signs of recovery, supported by a weaker dollar and lower bond yields. However, the recovery is not yet proof that the previous downtrend has ended.
The most important upcoming event is US employment data. Also, remember that the screenshot shows a historical chart snapshot, not today’s live market.
Risk note: Your screenshot displays 20x leverage on perpetual futures. That can magnify losses as well as gains, so these levels are for educational chart analysis, not instructions to open a position.
6. Latest news sources
Reuters – Gold rises as dollar and yields weaken
FXEmpire – Gold technical forecast
World Gold Council – Gold market commentary
Wall Street Journal – Gold market update, November 6
I can also analyze your next XAUUSDT screenshot and explain the 15-minute, 1-hour and 4-hour chart trends in English.
#BinanceReopensWithdrawalsForMoreAssets #USStocksSlipandCryptoMarketUnderBroadPressure $XAU
149
·
--
Verifiziert

Artikel
TRUMP-Coin (TRUMPUSDT) – Marktanalyse$TRUMP
Laut deinem Binance-Screenshot zeigt die Münze Official Trump (TRUMP) eine starke Abwärtsdynamik.
Aktuelle Chartdaten:
Preis: 1.121 USDT
Angezeigte 24-Stunden-Änderung: -11.02%
Zeitrahmen: 1 Stunde
Trend: Starker Abwärtstrend
Supertrend: Bärisch (Rot)
Der Chart zeigt, dass die Verkäufer die Käufer dominieren. Der Preis ist außerdem unter mehrere vorherige Unterstützungsniveaus gefallen, was auf einen schwachen Kaufdruck hindeutet.
Warum fällt der TRUMP-Coin?
1. Politische Nachrichten – Hauptgrund
Der wichtigste Auslöser scheinen die Ergebnisse der US-Zwischenwahlen zu sein. Die Demokraten gewannen die Mehrheit sowohl im Repräsentantenhaus als auch im Senat. Dadurch entstand Unsicherheit hinsichtlich Trumps politischem Einfluss und seiner kryptobezogenen Politik. Dies wirkte sich negativ auf das Vertrauen der Anleger in kryptobezogene Projekte aus, die mit Trump in Verbindung stehen. Yahoo Finance +1
TRUMP-Coin (TRUMPUSDT) – Marktanalyse
$TRUMP
Laut deinem Binance-Screenshot zeigt die Münze Official Trump (TRUMP) eine starke Abwärtsdynamik.
Aktuelle Chartdaten:
Preis: 1.121 USDT
Angezeigte 24-Stunden-Änderung: -11.02%
Zeitrahmen: 1 Stunde
Trend: Starker Abwärtstrend
Supertrend: Bärisch (Rot)
Der Chart zeigt, dass die Verkäufer die Käufer dominieren. Der Preis ist außerdem unter mehrere vorherige Unterstützungsniveaus gefallen, was auf einen schwachen Kaufdruck hindeutet.
Warum fällt der TRUMP-Coin?
1. Politische Nachrichten – Hauptgrund
Der wichtigste Auslöser scheinen die Ergebnisse der US-Zwischenwahlen zu sein. Die Demokraten gewannen die Mehrheit sowohl im Repräsentantenhaus als auch im Senat. Dadurch entstand Unsicherheit hinsichtlich Trumps politischem Einfluss und seiner kryptobezogenen Politik. Dies wirkte sich negativ auf das Vertrauen der Anleger in kryptobezogene Projekte aus, die mit Trump in Verbindung stehen. Yahoo Finance +1
Laut deinem Binance-Screenshot zeigt die Münze Official Trump (TRUMP) eine starke Abwärtsdynamik.
Aktuelle Chartdaten:
Preis: 1.121 USDT
Angezeigte 24-Stunden-Änderung: -11.02%
Zeitrahmen: 1 Stunde
Trend: Starker Abwärtstrend
Supertrend: Bärisch (Rot)
Der Chart zeigt, dass die Verkäufer die Käufer dominieren. Der Preis ist außerdem unter mehrere vorherige Unterstützungsniveaus gefallen, was auf einen schwachen Kaufdruck hindeutet.
Warum fällt der TRUMP-Coin?
1. Politische Nachrichten – Hauptgrund
Der wichtigste Auslöser scheinen die Ergebnisse der US-Zwischenwahlen zu sein. Die Demokraten gewannen die Mehrheit sowohl im Repräsentantenhaus als auch im Senat. Dadurch entstand Unsicherheit hinsichtlich Trumps politischem Einfluss und seiner kryptobezogenen Politik. Dies wirkte sich negativ auf das Vertrauen der Anleger in kryptobezogene Projekte aus, die mit Trump in Verbindung stehen. Yahoo Finance +1
1.1k
·
--
Übersetzung ansehen
$BTC Bitcoin (BTCUSDT) Price Drop Analysis
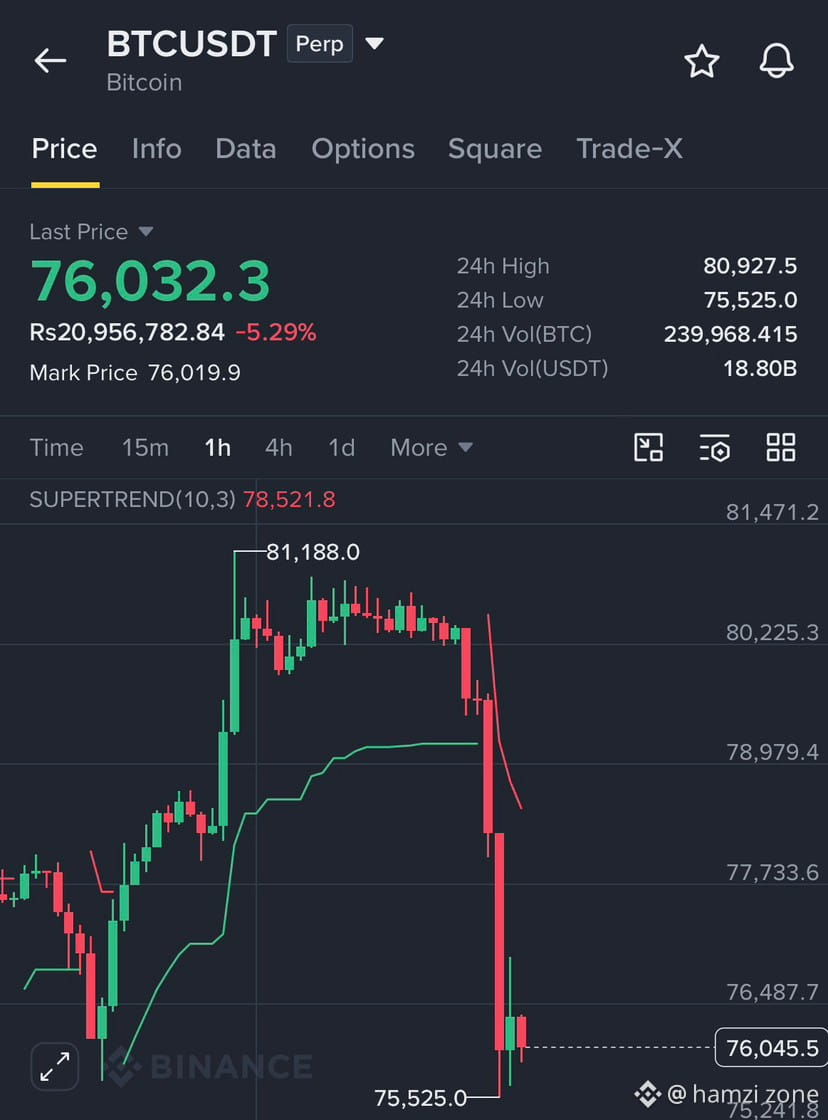
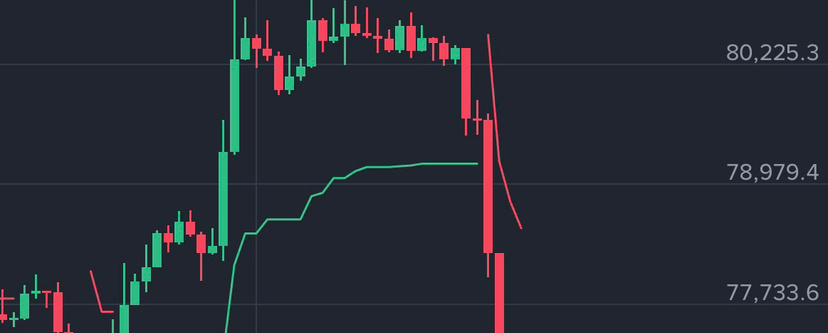
$BTC Bitcoin has experienced a significant price decline, falling from nearly $80,000 to approximately $76,032. The 24-hour loss is around 5.29%. The main reason behind this decline, according to the chart, is strong selling pressure. Large red candles indicate that sellers have taken control of the market. Bitcoin also broke important support levels around $80,225 and $78,979, increasing bearish momentum. Trading volume increased significantly during the crash, suggesting heavy market activity and possible liquidation of leveraged long positions. The Supertrend indicator is currently at $78,521, while Bitcoin is trading below it, confirming a bearish technical structure. The recent low is $75,525, which is an important support area to monitor. If selling pressure continues, Bitcoin could experience further weakness. However, a recovery is possible if buyers return with strong volume. Overall, the current chart shows a bearish trend, high volatility, and strong selling activity. Traders should carefully monitor support, resistance, volume, and market sentiment before making any decisions.
$BTC Bitcoin (BTCUSDT) Price Drop Analysis
$BTC Bitcoin has experienced a significant price decline, falling from nearly $80,000 to approximately $76,032. The 24-hour loss is around 5.29%. The main reason behind this decline, according to the chart, is strong selling pressure. Large red candles indicate that sellers have taken control of the market. Bitcoin also broke important support levels around $80,225 and $78,979, increasing bearish momentum. Trading volume increased significantly during the crash, suggesting heavy market activity and possible liquidation of leveraged long positions. The Supertrend indicator is currently at $78,521, while Bitcoin is trading below it, confirming a bearish technical structure. The recent low is $75,525, which is an important support area to monitor. If selling pressure continues, Bitcoin could experience further weakness. However, a recovery is possible if buyers return with strong volume. Overall, the current chart shows a bearish trend, high volatility, and strong selling activity. Traders should carefully monitor support, resistance, volume, and market sentiment before making any decisions.
$BTC Bitcoin has experienced a significant price decline, falling from nearly $80,000 to approximately $76,032. The 24-hour loss is around 5.29%. The main reason behind this decline, according to the chart, is strong selling pressure. Large red candles indicate that sellers have taken control of the market. Bitcoin also broke important support levels around $80,225 and $78,979, increasing bearish momentum. Trading volume increased significantly during the crash, suggesting heavy market activity and possible liquidation of leveraged long positions. The Supertrend indicator is currently at $78,521, while Bitcoin is trading below it, confirming a bearish technical structure. The recent low is $75,525, which is an important support area to monitor. If selling pressure continues, Bitcoin could experience further weakness. However, a recovery is possible if buyers return with strong volume. Overall, the current chart shows a bearish trend, high volatility, and strong selling activity. Traders should carefully monitor support, resistance, volume, and market sentiment before making any decisions.
129
·
--
Artikel
BTCUSDT – Analyse des Bitcoin-Kursrückgangs (1-Stunden-Chart)Auf Grundlage deines Binance-Screenshots zeigt Bitcoin eine starke Abwärtsdynamik.
1. Was ist mit $BTC Bitcoin passiert?
Hier sind die wichtigsten Zahlen aus deinem Chart:
Indikator
Preis / Wert
Aktueller BTC-Kurs
$76,032.3
24-Stunden-Hoch
$80,927.5
24-Stunden-Tief
$75,525
24-Stunden-Veränderung
-5.29%
Supertrend
$78,521.8
$BTC Bitcoin fiel von etwa $80,000 in Richtung $75,525. Das ist ein deutlicher Rückgang.
2. Warum ist BTC so stark gefallen?
Dein Chart deutet auf mehrere technische Gründe hin:
A. Starker Verkaufsdruck
Große rote Kerzen zeigen, dass die Verkäufer gegenüber den Käufern die Oberhand hatten. Die starke Abwärtsbewegung deutet auf aggressive Verkäufe hin.
BTCUSDT – Analyse des Bitcoin-Kursrückgangs (1-Stunden-Chart)
Auf Grundlage deines Binance-Screenshots zeigt Bitcoin eine starke Abwärtsdynamik.
1. Was ist mit $BTC Bitcoin passiert?
Hier sind die wichtigsten Zahlen aus deinem Chart:
Indikator
Preis / Wert
Aktueller BTC-Kurs
$76,032.3
24-Stunden-Hoch
$80,927.5
24-Stunden-Tief
$75,525
24-Stunden-Veränderung
-5.29%
Supertrend
$78,521.8
$BTC Bitcoin fiel von etwa $80,000 in Richtung $75,525. Das ist ein deutlicher Rückgang.
2. Warum ist BTC so stark gefallen?
Dein Chart deutet auf mehrere technische Gründe hin:
A. Starker Verkaufsdruck
Große rote Kerzen zeigen, dass die Verkäufer gegenüber den Käufern die Oberhand hatten. Die starke Abwärtsbewegung deutet auf aggressive Verkäufe hin.
1. Was ist mit $BTC Bitcoin passiert?
Hier sind die wichtigsten Zahlen aus deinem Chart:
Indikator
Preis / Wert
Aktueller BTC-Kurs
$76,032.3
24-Stunden-Hoch
$80,927.5
24-Stunden-Tief
$75,525
24-Stunden-Veränderung
-5.29%
Supertrend
$78,521.8
$BTC Bitcoin fiel von etwa $80,000 in Richtung $75,525. Das ist ein deutlicher Rückgang.
2. Warum ist BTC so stark gefallen?
Dein Chart deutet auf mehrere technische Gründe hin:
A. Starker Verkaufsdruck
Große rote Kerzen zeigen, dass die Verkäufer gegenüber den Käufern die Oberhand hatten. Die starke Abwärtsbewegung deutet auf aggressive Verkäufe hin.
1
973
Anmelden und weiter Inhalte entdecken
Krypto-Nutzer weltweit auf Binance Square kennenlernen
⚡️ Bleib in Sachen Krypto stets am Puls.
💬 Die weltgrößte Kryptobörse vertraut darauf.
👍 Erhalte verlässliche Einblicke von verifizierten Creators.
E-Mail-Adresse/Telefonnummer
Trendthemen
JobsReportRaisesHikeOdds
16,519 Aufrufe
341 Kommentare
TradFi-News | USA schaffen im Oktober 165.000 Stellen – mehr als doppelt so viele wie die prognostizierten 65.000 –, während die Arbeitslosenquote auf 4,1 % sinkt
Binance News
·12 Likes
·7.5k Aufrufe
US Data Center Rules May Constrain AI Expansion
2,727 Aufrufe
45 Kommentare
CanUSStocksReboundAfterNonfarmPayrolls?
21,815 Aufrufe
554 Kommentare