

NovatrixQ
4 Beiträge

NovatrixQ
Melden
Nutzer blockieren
0 Following
1 Follower
3 Like gegeben
Beiträge
·
--
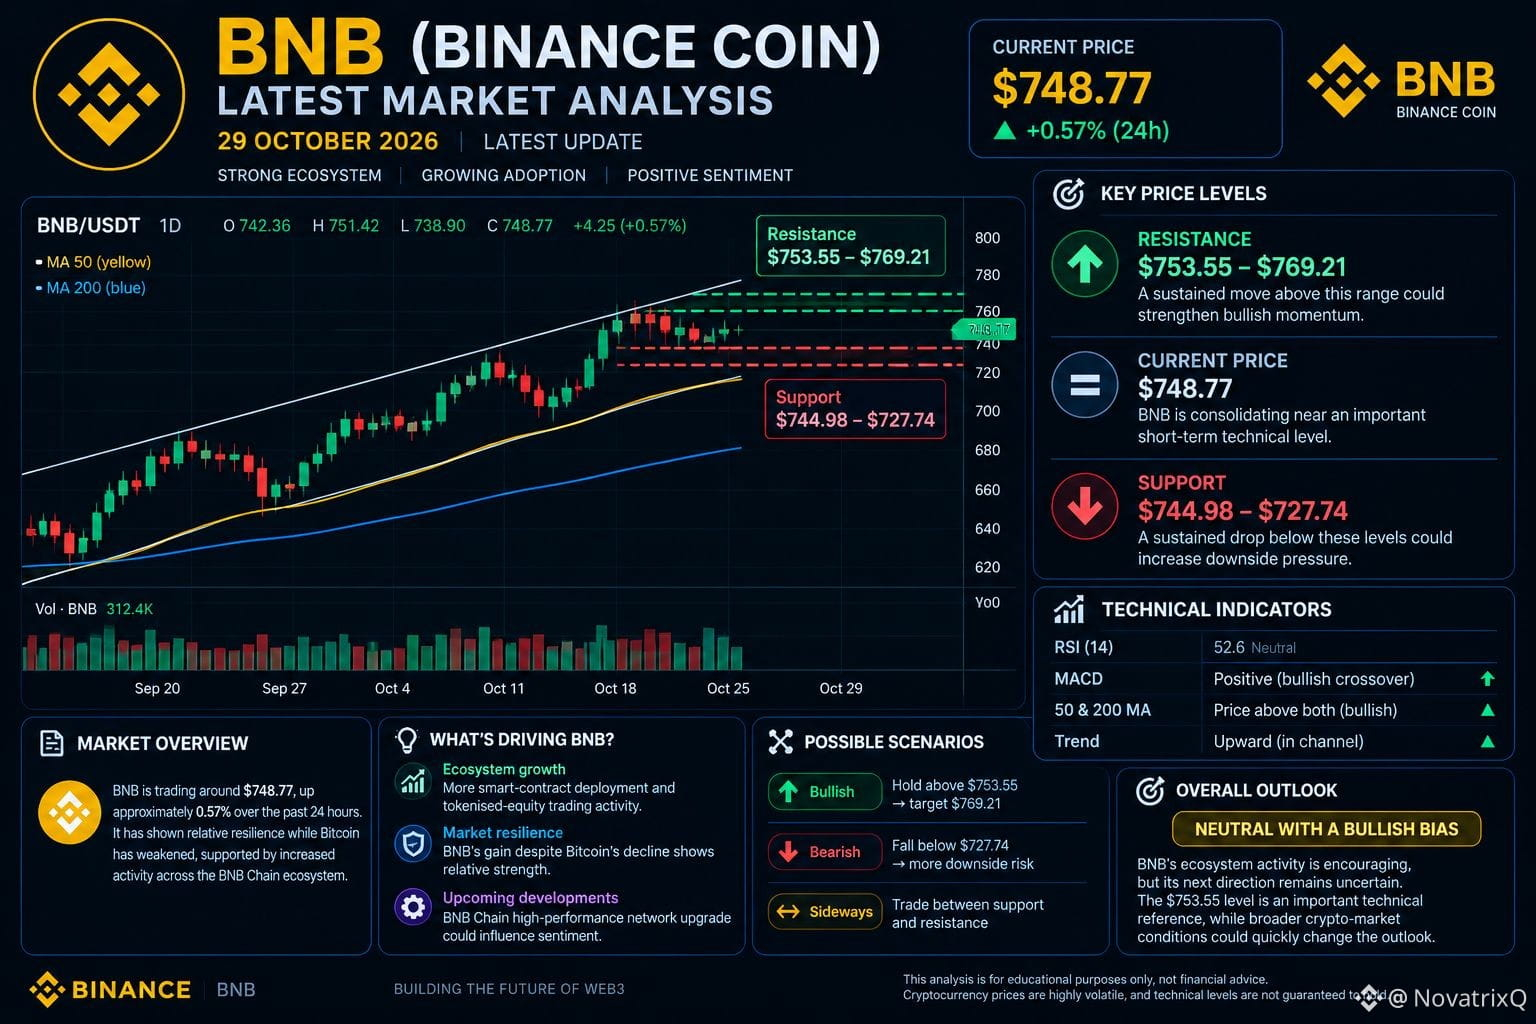
$BNB (Binance Coin) — Aktuelle Marktanalyse
29. Oktober 2026 · Letzte verfügbare Marktaktualisierung
Marktüberblick: BNB wird bei etwa 748,77 $ gehandelt und ist in den vergangenen 24 Stunden um ungefähr 0,57 % gestiegen. Während Bitcoin schwächer wurde, zeigte BNB relative Widerstandsfähigkeit, unterstützt durch die zunehmende Aktivität im gesamten BNB-Chain-Ökosystem.
Wichtige Kursniveaus
Widerstand: 753,55 $–769,21 $
Ein anhaltender Anstieg über diese Spanne könnte die bullische Dynamik stärken.
Aktueller Kurs: 748,77 $
BNB konsolidiert nahe einem wichtigen kurzfristigen technischen Niveau.
Unterstützung: 744,98 $ und 727,74 $
Ein anhaltender Rückgang unter diese Niveaus könnte den Abwärtsdruck verstärken.
Was bewegt BNB?
Ökosystemwachstum: Die verstärkte Bereitstellung von Smart Contracts und die zunehmende Handelsaktivität mit tokenisierten Aktien deuten auf eine wachsende Nutzung der BNB Chain hin.
Marktresilienz: Der geringe Kursanstieg von BNB trotz des Rückgangs von Bitcoin deutet in dieser Sitzung auf relative Stärke hin.
Bevorstehende Entwicklungen: Fortschritte bei dem geplanten leistungsstarken Netzwerk-Upgrade der BNB Chain könnten die Marktstimmung beeinflussen, auch wenn die Auswirkungen ungewiss sind.
Mögliche Szenarien
Bullisch: BNB hält sich über 753,55 $ und bewegt sich in Richtung 769,21 $.
Bärisch: BNB fällt unter 727,74 $, was auf eine schwächere kurzfristige Kursstruktur hindeutet.
Seitwärts: BNB schwankt weiterhin zwischen Unterstützung und Widerstand.
Gesamtausblick
Die Aktivität im BNB-Ökosystem ist ermutigend, doch die weitere Kursentwicklung bleibt ungewiss. Das Niveau von 753,55 $ ist ein wichtiger technischer Bezugspunkt, während die allgemeinen Bedingungen am Kryptomarkt den Ausblick rasch verändern könnten.
Dies ist ein informativer Marktkommentar und keine persönliche Finanzberatung. Kryptowährungskurse sind volatil, und es ist nicht garantiert, dass technische Niveaus Bestand haben.#FedWatch #Nasdaq100FuturesFall0.9% #BitcoinCore32.1RaisesPeerConnectionLimit
{spot}(BNBUSDT)
$BNB (Binance Coin) — Aktuelle Marktanalyse
29. Oktober 2026 · Letzte verfügbare Marktaktualisierung
Marktüberblick: BNB wird bei etwa 748,77 $ gehandelt und ist in den vergangenen 24 Stunden um ungefähr 0,57 % gestiegen. Während Bitcoin schwächer wurde, zeigte BNB relative Widerstandsfähigkeit, unterstützt durch die zunehmende Aktivität im gesamten BNB-Chain-Ökosystem.
Wichtige Kursniveaus
Widerstand: 753,55 $–769,21 $
Ein anhaltender Anstieg über diese Spanne könnte die bullische Dynamik stärken.
Aktueller Kurs: 748,77 $
BNB konsolidiert nahe einem wichtigen kurzfristigen technischen Niveau.
Unterstützung: 744,98 $ und 727,74 $
Ein anhaltender Rückgang unter diese Niveaus könnte den Abwärtsdruck verstärken.
Was bewegt BNB?
Ökosystemwachstum: Die verstärkte Bereitstellung von Smart Contracts und die zunehmende Handelsaktivität mit tokenisierten Aktien deuten auf eine wachsende Nutzung der BNB Chain hin.
Marktresilienz: Der geringe Kursanstieg von BNB trotz des Rückgangs von Bitcoin deutet in dieser Sitzung auf relative Stärke hin.
Bevorstehende Entwicklungen: Fortschritte bei dem geplanten leistungsstarken Netzwerk-Upgrade der BNB Chain könnten die Marktstimmung beeinflussen, auch wenn die Auswirkungen ungewiss sind.
Mögliche Szenarien
Bullisch: BNB hält sich über 753,55 $ und bewegt sich in Richtung 769,21 $.
Bärisch: BNB fällt unter 727,74 $, was auf eine schwächere kurzfristige Kursstruktur hindeutet.
Seitwärts: BNB schwankt weiterhin zwischen Unterstützung und Widerstand.
Gesamtausblick
Die Aktivität im BNB-Ökosystem ist ermutigend, doch die weitere Kursentwicklung bleibt ungewiss. Das Niveau von 753,55 $ ist ein wichtiger technischer Bezugspunkt, während die allgemeinen Bedingungen am Kryptomarkt den Ausblick rasch verändern könnten.
Dies ist ein informativer Marktkommentar und keine persönliche Finanzberatung. Kryptowährungskurse sind volatil, und es ist nicht garantiert, dass technische Niveaus Bestand haben.#FedWatch #Nasdaq100FuturesFall0.9% #BitcoinCore32.1RaisesPeerConnectionLimit
71
·
--
Übersetzung ansehen
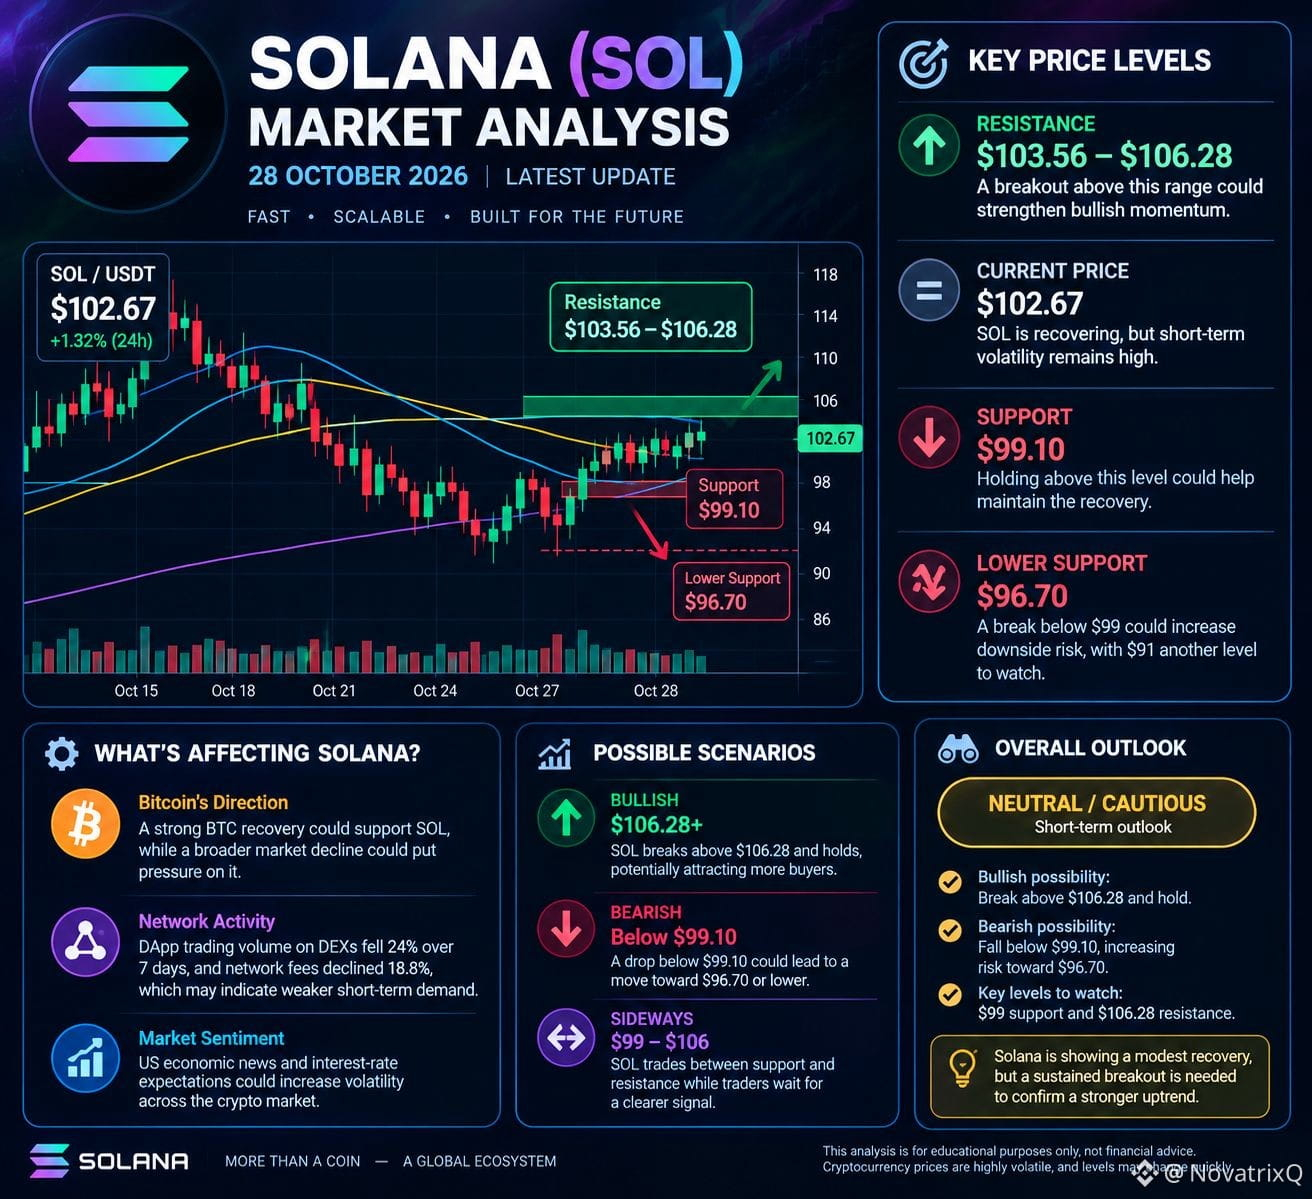
$SOL — Latest Market Analysis
28 October 2026 · Short-term outlook
Market overview: Solana (SOL) is trading around $102–$103, with a modest recovery. However, market volatility and uncertainty around US Federal Reserve policy could influence its next move.
Key price levels
Resistance: $103.56–$106.28 — a breakout above this zone could signal stronger bullish momentum.
Support: $99.10 — holding above this level could help SOL maintain its recovery.
Lower support: $96.70, followed by $91 if selling pressure increases.
These are indicative technical levels, not guaranteed price boundaries.
Market factors
Bitcoin's direction: A strong BTC recovery could support SOL, while a broader market decline could put pressure on it.
Network activity: Lower decentralised-exchange trading activity and network fees may indicate weaker short-term demand.
Market sentiment: US economic news and interest-rate expectations could increase volatility.
Possible scenarios
Bullish: SOL breaks above $106.28 and holds, potentially attracting more buyers.
Bearish: SOL falls below $99.10, increasing the risk of a move toward $96.70.
Sideways: SOL trades between support and resistance while traders wait for a clearer signal.
Overall outlook
Neutral to cautious. Solana's recovery is encouraging, but a sustained breakout above resistance is needed to strengthen the bullish case. Watch the $99 support and $106.28 resistance levels closely.
Educational analysis only, not financial advice. Cryptocurrency prices are volatile, and these levels should be verified against live market data before making trading decisions.#CanMicrosoftDeliverOnAI #CanGoogleDefindItsCore #EarningsSeason
{spot}(SOLUSDT)
$SOL — Latest Market Analysis
28 October 2026 · Short-term outlook
Market overview: Solana (SOL) is trading around $102–$103, with a modest recovery. However, market volatility and uncertainty around US Federal Reserve policy could influence its next move.
Key price levels
Resistance: $103.56–$106.28 — a breakout above this zone could signal stronger bullish momentum.
Support: $99.10 — holding above this level could help SOL maintain its recovery.
Lower support: $96.70, followed by $91 if selling pressure increases.
These are indicative technical levels, not guaranteed price boundaries.
Market factors
Bitcoin's direction: A strong BTC recovery could support SOL, while a broader market decline could put pressure on it.
Network activity: Lower decentralised-exchange trading activity and network fees may indicate weaker short-term demand.
Market sentiment: US economic news and interest-rate expectations could increase volatility.
Possible scenarios
Bullish: SOL breaks above $106.28 and holds, potentially attracting more buyers.
Bearish: SOL falls below $99.10, increasing the risk of a move toward $96.70.
Sideways: SOL trades between support and resistance while traders wait for a clearer signal.
Overall outlook
Neutral to cautious. Solana's recovery is encouraging, but a sustained breakout above resistance is needed to strengthen the bullish case. Watch the $99 support and $106.28 resistance levels closely.
Educational analysis only, not financial advice. Cryptocurrency prices are volatile, and these levels should be verified against live market data before making trading decisions.#CanMicrosoftDeliverOnAI #CanGoogleDefindItsCore #EarningsSeason
1
62
·
--
Übersetzung ansehen
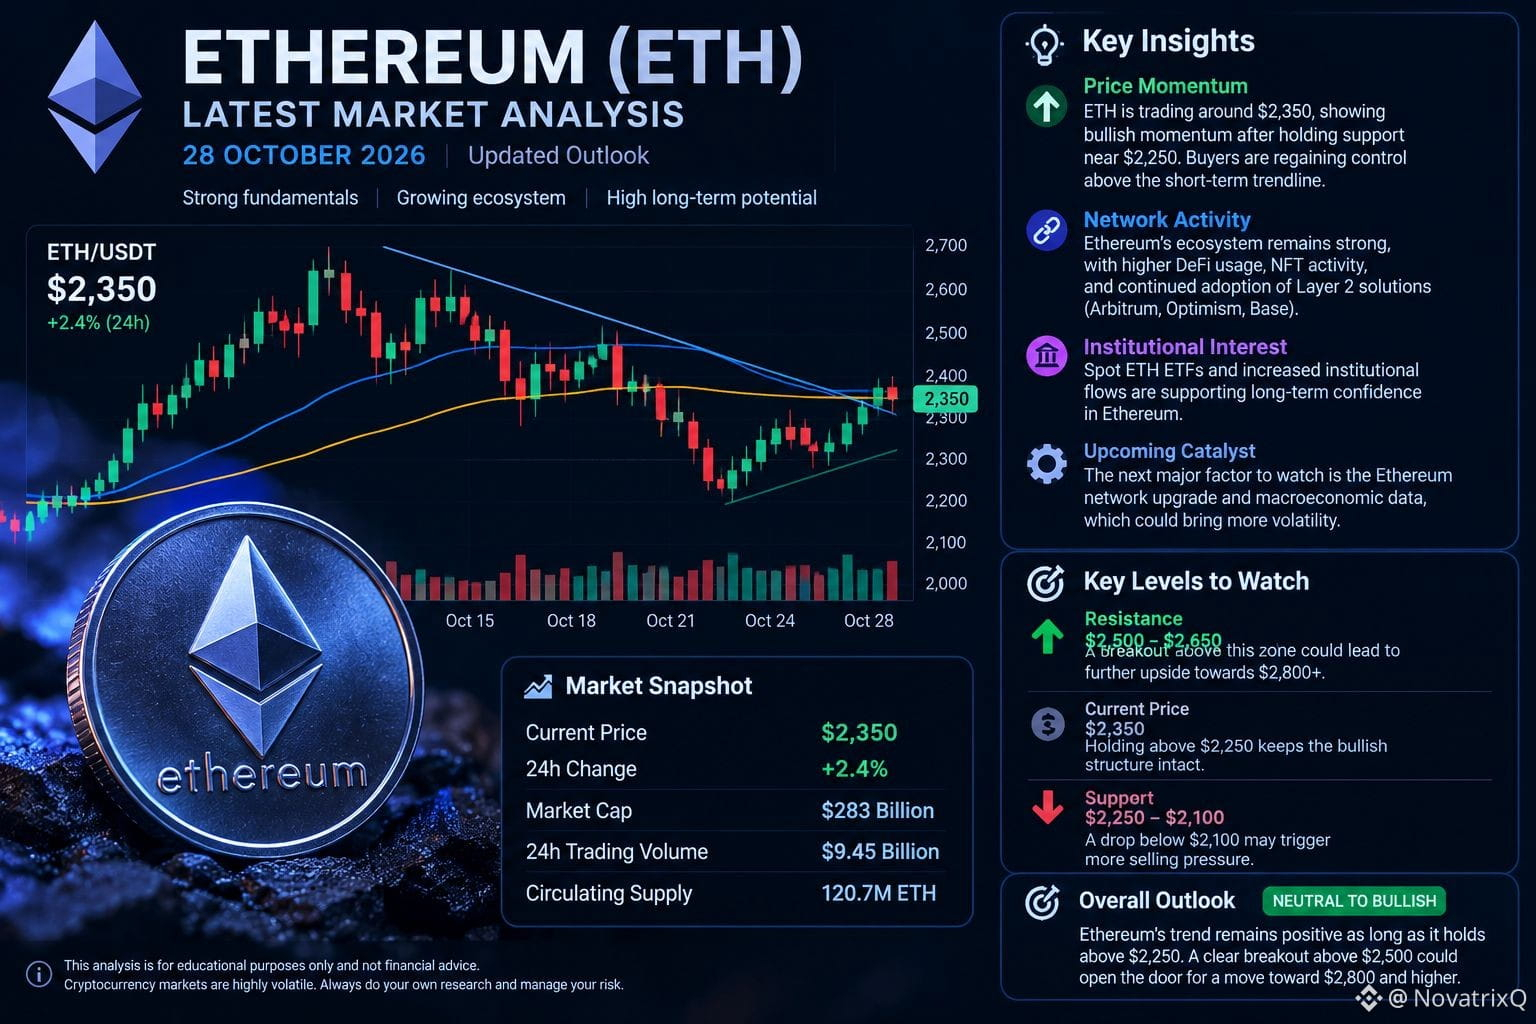
$ETH — Latest Market Analysis
28 October 2026 · Latest available market data
Ethereum is trading around $2,370, up approximately 1% over the previous close. The price has shown a modest recovery, but the broader short-term trend remains uncertain.
Key price levels
Resistance: $2,400
A sustained move above this level could strengthen the recovery.
Current price: approximately $2,370
ETH is attempting to recover after recent market weakness.
Support: $2,326–$2,292
A break below this area could increase downward pressure, with $2,250 as another level to watch.
What could happen next?
Bullish scenario: ETH moves above $2,400 and holds, potentially opening the way toward $2,466.
Bearish scenario: ETH falls below $2,292, increasing the risk of a deeper decline.
Main catalysts: Federal Reserve policy, broader crypto-market sentiment, and Ethereum network activity.
Overall outlook
Neutral to cautiously optimistic. Ethereum's recent recovery is encouraging, but a clear move above $2,400 would provide stronger evidence of improving momentum. Technical indicators are mixed, so either direction remains possible.
This analysis is for educational purposes only, not a guaranteed prediction or personalized financial advice. Cryptocurrency prices are highly volatile.#CanMicrosoftDeliverOnAI #CanGoogleDefindItsCore #EarningsSeason #RobinhoodFalls8.4%AfterItsResults
{spot}(ETHUSDT)
$ETH — Latest Market Analysis
28 October 2026 · Latest available market data
Ethereum is trading around $2,370, up approximately 1% over the previous close. The price has shown a modest recovery, but the broader short-term trend remains uncertain.
Key price levels
Resistance: $2,400
A sustained move above this level could strengthen the recovery.
Current price: approximately $2,370
ETH is attempting to recover after recent market weakness.
Support: $2,326–$2,292
A break below this area could increase downward pressure, with $2,250 as another level to watch.
What could happen next?
Bullish scenario: ETH moves above $2,400 and holds, potentially opening the way toward $2,466.
Bearish scenario: ETH falls below $2,292, increasing the risk of a deeper decline.
Main catalysts: Federal Reserve policy, broader crypto-market sentiment, and Ethereum network activity.
Overall outlook
Neutral to cautiously optimistic. Ethereum's recent recovery is encouraging, but a clear move above $2,400 would provide stronger evidence of improving momentum. Technical indicators are mixed, so either direction remains possible.
This analysis is for educational purposes only, not a guaranteed prediction or personalized financial advice. Cryptocurrency prices are highly volatile.#CanMicrosoftDeliverOnAI #CanGoogleDefindItsCore #EarningsSeason #RobinhoodFalls8.4%AfterItsResults
1
75
·
--
Übersetzung ansehen
{spot}(BTCUSDT)
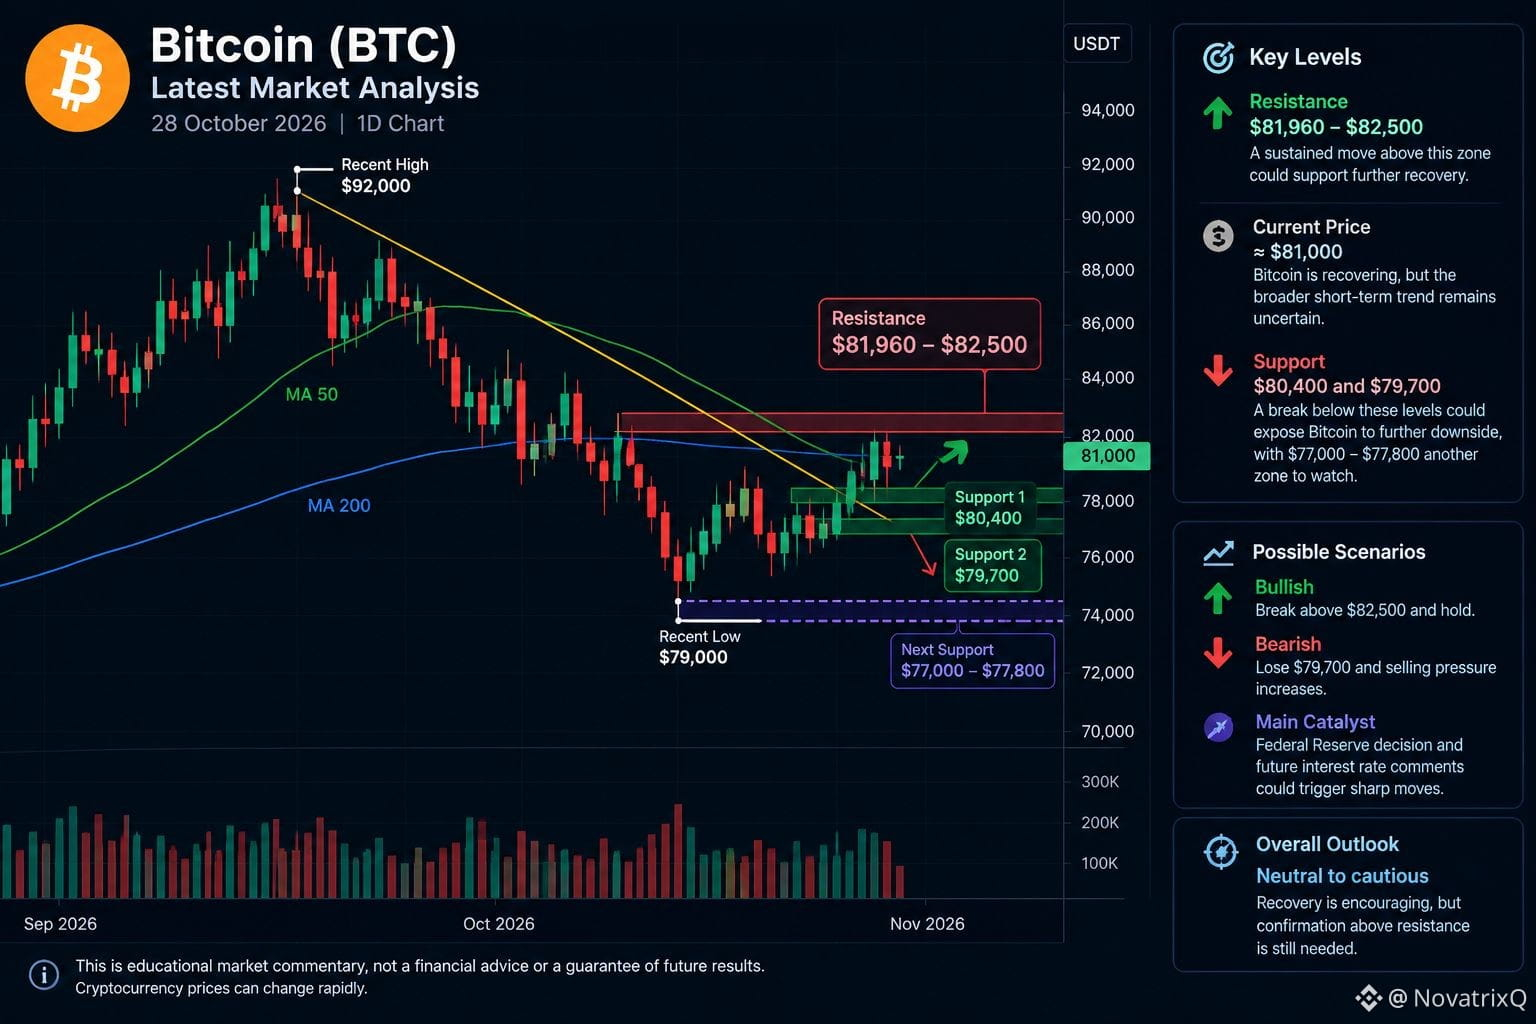
$BTC is trading near $81,000, recovering from its recent dip toward $79,000. The market is approaching an important turning point as investors await the US Federal Reserve's interest-rate decision.
Key market levels
Resistance: $81,960–$82,500
A sustained move above this zone could support further recovery.
Current price: around $81,000
Bitcoin is recovering, but the broader short-term trend remains uncertain.
Support: $80,400 and $79,700
A break below these levels could expose Bitcoin to further downside, with $77,000–$77,800 another zone to watch.
What happens next?
Bullish scenario: Bitcoin breaks above $82,500 and holds that level.
Bearish scenario: Bitcoin loses $79,700 and selling pressure increases.
Main catalyst: The Federal Reserve's decision and comments about future interest rates could trigger sharp price swings.
Overall outlook: Neutral to cautious in the short term. Bitcoin's recovery is encouraging, but confirmation above resistance is still needed.
This is educational market commentary, not a guaranteed prediction or personalized financial advice. Cryptocurrency prices can change rapidly.
#CanMicrosoftDeliverOnAI #CanGoogleDefindItsCore #EarningsSeason #FOMCWatch
1
65
Anmelden und weiter Inhalte entdecken
Krypto-Nutzer weltweit auf Binance Square kennenlernen
⚡️ Bleib in Sachen Krypto stets am Puls.
💬 Die weltgrößte Kryptobörse vertraut darauf.
👍 Erhalte verlässliche Einblicke von verifizierten Creators.
E-Mail-Adresse/Telefonnummer
Trendthemen
FedWatch
16.2M Aufrufe
38,067 Kommentare
US-Notenbank ließ den Leitzins unverändert, doch Warsh schließt eine Erhöhung im Dezember nicht aus
BorisBorissss
·3 Likes
·2.6k Aufrufe
SolidusLabsReportsSuspected$170MSpoofingOnHyperliquidOilContracts
0 Aufrufe
5 Kommentare
StanDruckenmillerBecomesInvestorInTradeXYZ
6 Aufrufe
18 Kommentare