

Michel Kaneshiro SzXF
13 Beiträge

Michel Kaneshiro SzXF
Melden
Nutzer blockieren
Trade eröffnen
2 Jahre
12 Following
17 Follower
14 Like gegeben
Beiträge
Portfolio
·
--
Bullisch
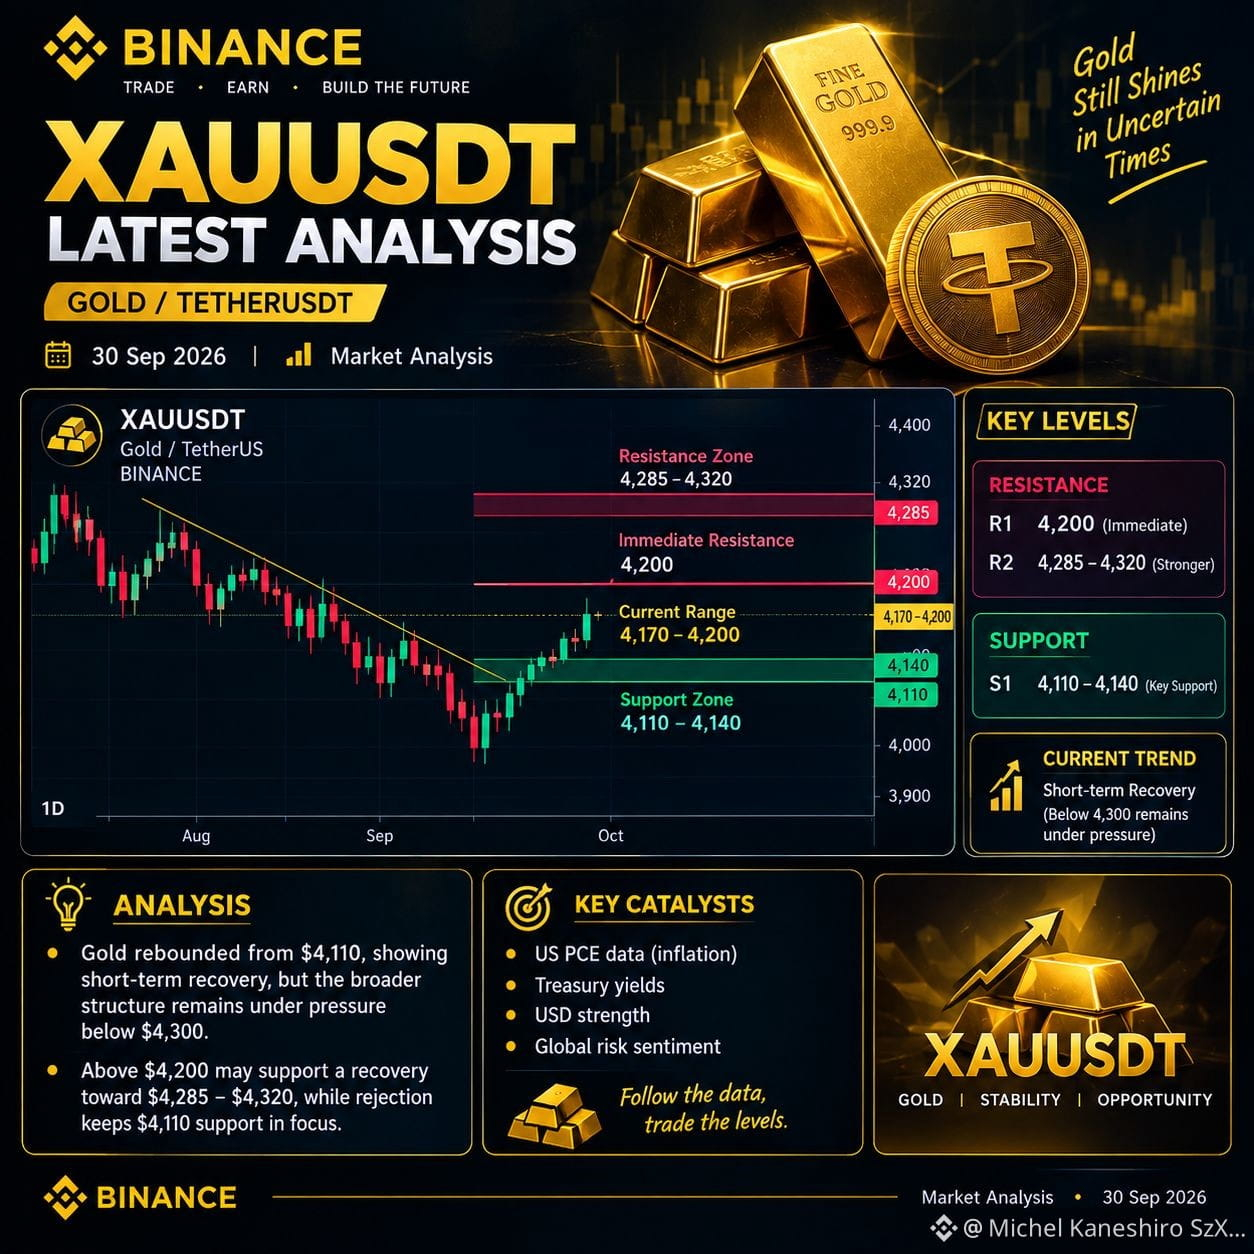
Gold zeigt nach dem Abprall von 4.110 $ eine kurzfristige Erholung.
$XAU
{future}(XAUUSDT)
📈 Widerstand: 4.230 $ → 4.300 $
📉 Unterstützung: 4.160 $ → 4.110 $
🔥 Über 4.230 $ = die Erholungsdynamik könnte sich verstärken.
⚠️ Unter 4.110 $ = der bärische Druck könnte zunehmen.
📊 Wichtige Treiber: US PCE, Fed-Zinsen, USD & Treasury-Renditen.
#XAUUSDT #GOLD #Binance #Crypto #Trading
Gold zeigt nach dem Abprall von 4.110 $ eine kurzfristige Erholung.
$XAU
📈 Widerstand: 4.230 $ → 4.300 $
📉 Unterstützung: 4.160 $ → 4.110 $
🔥 Über 4.230 $ = die Erholungsdynamik könnte sich verstärken.
⚠️ Unter 4.110 $ = der bärische Druck könnte zunehmen.
📊 Wichtige Treiber: US PCE, Fed-Zinsen, USD & Treasury-Renditen.
#XAUUSDT #GOLD #Binance #Crypto #Trading
$XAU
📈 Widerstand: 4.230 $ → 4.300 $
📉 Unterstützung: 4.160 $ → 4.110 $
🔥 Über 4.230 $ = die Erholungsdynamik könnte sich verstärken.
⚠️ Unter 4.110 $ = der bärische Druck könnte zunehmen.
📊 Wichtige Treiber: US PCE, Fed-Zinsen, USD & Treasury-Renditen.
#XAUUSDT #GOLD #Binance #Crypto #Trading
266
Übersetzung ansehen
[work together and earn reward](https://www.binance.com/referral/earn-together/refer2earn-usdc/claim?hl=en&ref=GRO_28502_B3OX3&utm_source=referral_entrance) [..](https://www.binance.com/referral/earn-together/refer2earn-usdc/claim?hl=en&ref=GRO_28502_B3OX3&utm_source=referral_entrance)
work together and earn reward ..
1
🔥 Aktueller Beitrag zum Kryptomarkt — 29. September 2026
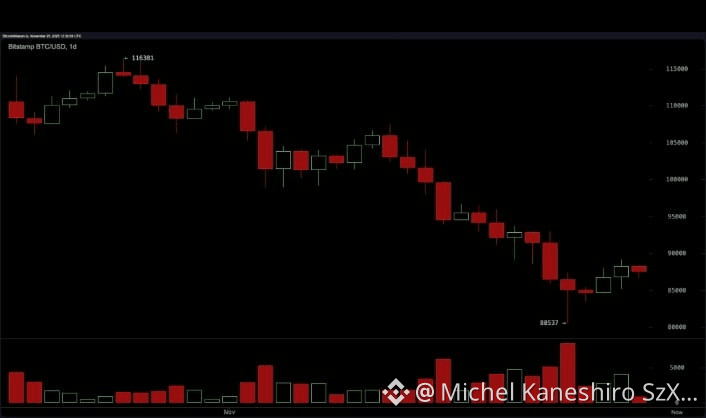
📉 $BTC Bitcoin: BTC liegt bei etwa 83.000–84.000 $, wobei 82.000–83.000 $ als wichtige Unterstützungszone fungieren. �
📊 Markt: Krypto konsolidiert derzeit nach der jüngsten Volatilität, während makroökonomische Faktoren und die Renditen von US-Staatsanleihen weiterhin wichtige Treiber sind. �
💰 ETF-Zuflüsse: BTC-, ETH-, SOL- und XRP-Spot-ETFs verzeichneten am 28. September alle Nettozuflüsse, insgesamt rund 65 Mio. $. �
⚡ Altcoins: Wichtige Alts zeigen eine gemischte Performance, daher beobachten Trader das Volumen und die nächste Bewegung von BTC genau. �
Moneycontrol +1
The Economic Times +1
TradingView
coinedition.com
$BTC
{future}(BTCUSDT)
Bildunterschrift:
🚀 Die Kryptomärkte heizen sich wieder auf. Bleib wachsam, steuere dein Risiko und beobachte die wichtigen Levels, bevor du einen Schritt machst. 📈
#BTC #BİNANCE #Write2Earn
🔥 Aktueller Beitrag zum Kryptomarkt — 29. September 2026
📉 $BTC Bitcoin: BTC liegt bei etwa 83.000–84.000 $, wobei 82.000–83.000 $ als wichtige Unterstützungszone fungieren. �
📊 Markt: Krypto konsolidiert derzeit nach der jüngsten Volatilität, während makroökonomische Faktoren und die Renditen von US-Staatsanleihen weiterhin wichtige Treiber sind. �
💰 ETF-Zuflüsse: BTC-, ETH-, SOL- und XRP-Spot-ETFs verzeichneten am 28. September alle Nettozuflüsse, insgesamt rund 65 Mio. $. �
⚡ Altcoins: Wichtige Alts zeigen eine gemischte Performance, daher beobachten Trader das Volumen und die nächste Bewegung von BTC genau. �
Moneycontrol +1
The Economic Times +1
TradingView
coinedition.com
$BTC
Bildunterschrift:
🚀 Die Kryptomärkte heizen sich wieder auf. Bleib wachsam, steuere dein Risiko und beobachte die wichtigen Levels, bevor du einen Schritt machst. 📈
#BTC #BİNANCE #Write2Earn
📉 $BTC Bitcoin: BTC liegt bei etwa 83.000–84.000 $, wobei 82.000–83.000 $ als wichtige Unterstützungszone fungieren. �
📊 Markt: Krypto konsolidiert derzeit nach der jüngsten Volatilität, während makroökonomische Faktoren und die Renditen von US-Staatsanleihen weiterhin wichtige Treiber sind. �
💰 ETF-Zuflüsse: BTC-, ETH-, SOL- und XRP-Spot-ETFs verzeichneten am 28. September alle Nettozuflüsse, insgesamt rund 65 Mio. $. �
⚡ Altcoins: Wichtige Alts zeigen eine gemischte Performance, daher beobachten Trader das Volumen und die nächste Bewegung von BTC genau. �
Moneycontrol +1
The Economic Times +1
TradingView
coinedition.com
$BTC
Bildunterschrift:
🚀 Die Kryptomärkte heizen sich wieder auf. Bleib wachsam, steuere dein Risiko und beobachte die wichtigen Levels, bevor du einen Schritt machst. 📈
#BTC #BİNANCE #Write2Earn

69
📊 Aktuelle Marktanalyse für Bitcoin (Januar 2026)
{spot}(BTCUSDT)
$BTC Bitcoin handelt derzeit in der Nähe der Marke von 90.000 USD, wobei sich kürzlich Volatilität zeigt, da der Kurs zwischen Unterstützung und Widerstand pendelt. �
CoinMarketCap +1
Nachdem BTC Höchststände nahe bei 95.000 USD erreicht hatte, gelang es dem Kurs nicht, diese Marke dauerhaft zu halten, und er korrigierte leicht. �
TradingView
Der entscheidende Widerstand bleibt in der Region von 92.000–94.000 USD, was eine Barriere für Käufer darstellt. �
MEXC
Falls Bitcoin diese Zone überwindet, könnte ein Anstieg in Richtung 98.000–100.000 USD erfolgen. �
MEXC
Umgekehrt birgt ein Ausfall der Unterstützung nahe bei 88.000–89.000 USD die Gefahr einer tieferen kurzfristigen Schwäche. �
CoinMarketCap
Daten zur Akkumulation durch Whale zeigen, dass große Halter kaufen, was historisch gesehen langfristig bullish ist. �
CoinMarketCap
Allerdings erzeugen ETF-Ausflüsse und makroökonomische Unsicherheit Druck und Vorsicht. �
Cryptonews
Händler beobachten die US-Arbeitsmarktdaten und makroökonomische Treiber für Richtungsindikatoren. �
The Economic Times
In der kurzen Frist könnte BTC seitwärts handeln, bis ein Durchbruch oder ein Rückgang erfolgt. �
MEXC
Insgesamt ist die Marktbewegung von Bitcoin neutral bis leicht bullisch, wenn er oberhalb der entscheidenden Unterstützung bleibt. �
CoinMarketCap
#WriteToEarnUpgrade #CPIWatch #USJobsData #FOMCMeeting #BTCVSGOLD
📊 Aktuelle Marktanalyse für Bitcoin (Januar 2026)
$BTC Bitcoin handelt derzeit in der Nähe der Marke von 90.000 USD, wobei sich kürzlich Volatilität zeigt, da der Kurs zwischen Unterstützung und Widerstand pendelt. �
CoinMarketCap +1
Nachdem BTC Höchststände nahe bei 95.000 USD erreicht hatte, gelang es dem Kurs nicht, diese Marke dauerhaft zu halten, und er korrigierte leicht. �
TradingView
Der entscheidende Widerstand bleibt in der Region von 92.000–94.000 USD, was eine Barriere für Käufer darstellt. �
MEXC
Falls Bitcoin diese Zone überwindet, könnte ein Anstieg in Richtung 98.000–100.000 USD erfolgen. �
MEXC
Umgekehrt birgt ein Ausfall der Unterstützung nahe bei 88.000–89.000 USD die Gefahr einer tieferen kurzfristigen Schwäche. �
CoinMarketCap
Daten zur Akkumulation durch Whale zeigen, dass große Halter kaufen, was historisch gesehen langfristig bullish ist. �
CoinMarketCap
Allerdings erzeugen ETF-Ausflüsse und makroökonomische Unsicherheit Druck und Vorsicht. �
Cryptonews
Händler beobachten die US-Arbeitsmarktdaten und makroökonomische Treiber für Richtungsindikatoren. �
The Economic Times
In der kurzen Frist könnte BTC seitwärts handeln, bis ein Durchbruch oder ein Rückgang erfolgt. �
MEXC
Insgesamt ist die Marktbewegung von Bitcoin neutral bis leicht bullisch, wenn er oberhalb der entscheidenden Unterstützung bleibt. �
CoinMarketCap
#WriteToEarnUpgrade #CPIWatch #USJobsData #FOMCMeeting #BTCVSGOLD
$BTC Bitcoin handelt derzeit in der Nähe der Marke von 90.000 USD, wobei sich kürzlich Volatilität zeigt, da der Kurs zwischen Unterstützung und Widerstand pendelt. �
CoinMarketCap +1
Nachdem BTC Höchststände nahe bei 95.000 USD erreicht hatte, gelang es dem Kurs nicht, diese Marke dauerhaft zu halten, und er korrigierte leicht. �
TradingView
Der entscheidende Widerstand bleibt in der Region von 92.000–94.000 USD, was eine Barriere für Käufer darstellt. �
MEXC
Falls Bitcoin diese Zone überwindet, könnte ein Anstieg in Richtung 98.000–100.000 USD erfolgen. �
MEXC
Umgekehrt birgt ein Ausfall der Unterstützung nahe bei 88.000–89.000 USD die Gefahr einer tieferen kurzfristigen Schwäche. �
CoinMarketCap
Daten zur Akkumulation durch Whale zeigen, dass große Halter kaufen, was historisch gesehen langfristig bullish ist. �
CoinMarketCap
Allerdings erzeugen ETF-Ausflüsse und makroökonomische Unsicherheit Druck und Vorsicht. �
Cryptonews
Händler beobachten die US-Arbeitsmarktdaten und makroökonomische Treiber für Richtungsindikatoren. �
The Economic Times
In der kurzen Frist könnte BTC seitwärts handeln, bis ein Durchbruch oder ein Rückgang erfolgt. �
MEXC
Insgesamt ist die Marktbewegung von Bitcoin neutral bis leicht bullisch, wenn er oberhalb der entscheidenden Unterstützung bleibt. �
CoinMarketCap
#WriteToEarnUpgrade #CPIWatch #USJobsData #FOMCMeeting #BTCVSGOLD
7
Übersetzung ansehen
{spot}(BNBUSDT)
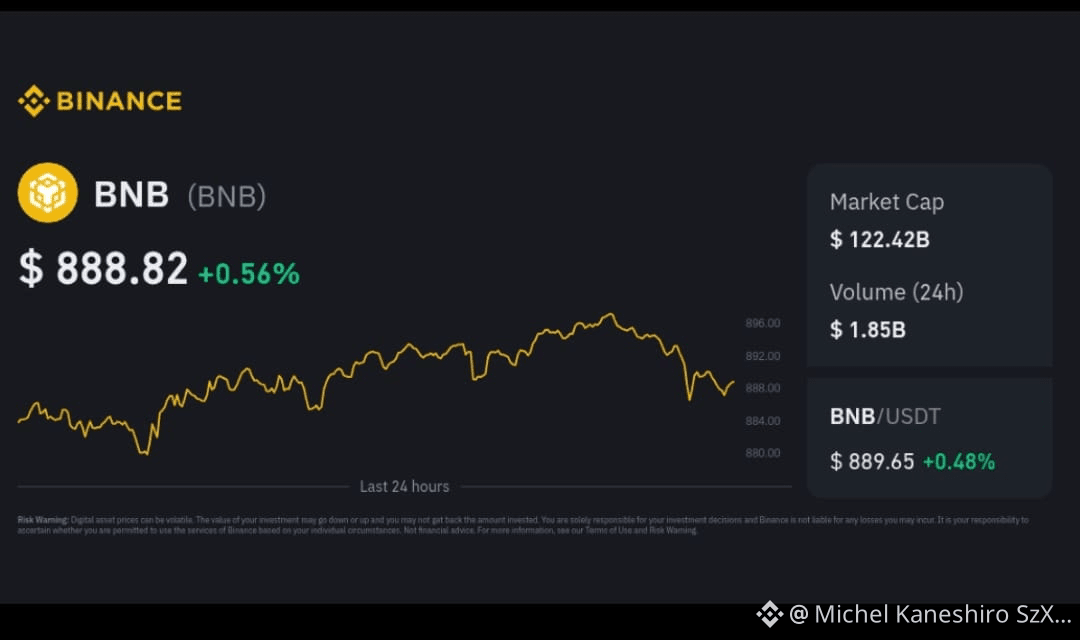
$BNB BNB’s price has shown volatility with sharp swings, recently dropping over 10% before staging recoveries — highlighting current market sensitivity. Key support is around $540-$550 with immediate resistance near $565-$570.
�CoinDesk
Short-term technicals (e.g., SMAs and RSI) suggest a neutral to slightly bullish bias, but overall sentiment remains cautious with a fear reading and modest momentum.
�CoinCheckup
On-chain activity (transactions and DEX volume) has been strong, which typically supports BNB’s price structure, though declining futures open interest hints at profit-taking or reduced leverage interest. �
BNB is trading in a consolidation phase with buyers defending key support levels.
Momentum is neutral to slightly bullish, suggesting limited downside for now.
A break above near-term resistance could trigger a short-term upside move.
On-chain activity and ecosystem utility continue to support long-term value.
Overall trend remains constructive, but volatility is still a risk.
$BNB BNB’s price has shown volatility with sharp swings, recently dropping over 10% before staging recoveries — highlighting current market sensitivity. Key support is around $540-$550 with immediate resistance near $565-$570.
�CoinDesk
Short-term technicals (e.g., SMAs and RSI) suggest a neutral to slightly bullish bias, but overall sentiment remains cautious with a fear reading and modest momentum.
�CoinCheckup
On-chain activity (transactions and DEX volume) has been strong, which typically supports BNB’s price structure, though declining futures open interest hints at profit-taking or reduced leverage interest. �
BNB is trading in a consolidation phase with buyers defending key support levels.
Momentum is neutral to slightly bullish, suggesting limited downside for now.
A break above near-term resistance could trigger a short-term upside move.
On-chain activity and ecosystem utility continue to support long-term value.
Overall trend remains constructive, but volatility is still a risk.
$BNB BNB’s price has shown volatility with sharp swings, recently dropping over 10% before staging recoveries — highlighting current market sensitivity. Key support is around $540-$550 with immediate resistance near $565-$570.
�CoinDesk
Short-term technicals (e.g., SMAs and RSI) suggest a neutral to slightly bullish bias, but overall sentiment remains cautious with a fear reading and modest momentum.
�CoinCheckup
On-chain activity (transactions and DEX volume) has been strong, which typically supports BNB’s price structure, though declining futures open interest hints at profit-taking or reduced leverage interest. �
BNB is trading in a consolidation phase with buyers defending key support levels.
Momentum is neutral to slightly bullish, suggesting limited downside for now.
A break above near-term resistance could trigger a short-term upside move.
On-chain activity and ecosystem utility continue to support long-term value.
Overall trend remains constructive, but volatility is still a risk.
3
Übersetzung ansehen
📊 ATOM Latest Market Analysis (2026)
$ATOM
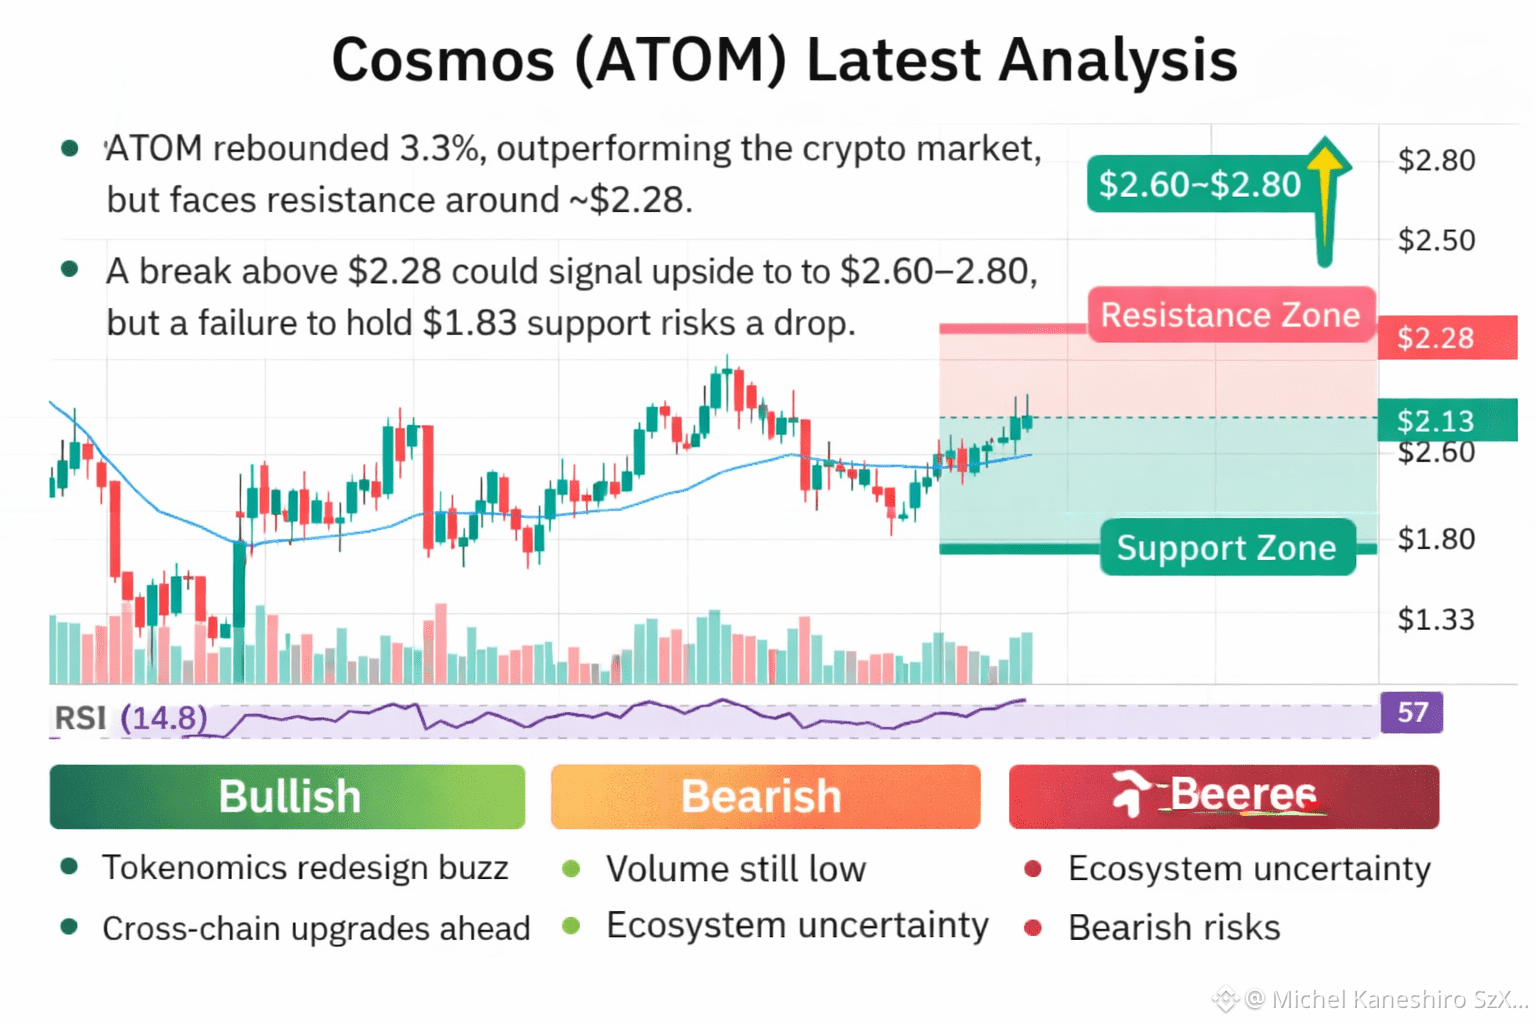
• ATOM has recently shown a 3%+ rebound in price, outperforming the broader crypto market as traders react to tokenomics redesign buzz and ecosystem upgrades. �
• Technicals suggest a break above resistance near ~$2.28 could lead to higher targets (~$2.60–$2.80), while failure to hold support around $1.83 may mean further downside risk. �
CoinMarketCap
MEXC
📈 Bullish Factors:
– Speculation around economic model overhaul and improved utility from cross-chain upgrades. �
– Recent moving average cross higher and positive momentum indicators. �
CoinMarketCap
CoinMarketCap
📉 Bearish Risks:
– Ecosystem uncertainty and selective project exits weaken investor sentiment. �
– Trading volume still modest, limiting strong directional moves. �
CoinMarketCap
CoinMarketCap
Summary: ATOM shows short-term strength but needs clear breakouts above key resistance to confirm a sustained uptrend.
{spot}(ATOMUSDT)
#WriteToEarnUpgrade #ATOM #CPIWatch #USJobsData #BTCVSGOLD
📊 ATOM Latest Market Analysis (2026)
$ATOM
• ATOM has recently shown a 3%+ rebound in price, outperforming the broader crypto market as traders react to tokenomics redesign buzz and ecosystem upgrades. �
• Technicals suggest a break above resistance near ~$2.28 could lead to higher targets (~$2.60–$2.80), while failure to hold support around $1.83 may mean further downside risk. �
CoinMarketCap
MEXC
📈 Bullish Factors:
– Speculation around economic model overhaul and improved utility from cross-chain upgrades. �
– Recent moving average cross higher and positive momentum indicators. �
CoinMarketCap
CoinMarketCap
📉 Bearish Risks:
– Ecosystem uncertainty and selective project exits weaken investor sentiment. �
– Trading volume still modest, limiting strong directional moves. �
CoinMarketCap
CoinMarketCap
Summary: ATOM shows short-term strength but needs clear breakouts above key resistance to confirm a sustained uptrend.
#WriteToEarnUpgrade #ATOM #CPIWatch #USJobsData #BTCVSGOLD
$ATOM
• ATOM has recently shown a 3%+ rebound in price, outperforming the broader crypto market as traders react to tokenomics redesign buzz and ecosystem upgrades. �
• Technicals suggest a break above resistance near ~$2.28 could lead to higher targets (~$2.60–$2.80), while failure to hold support around $1.83 may mean further downside risk. �
CoinMarketCap
MEXC
📈 Bullish Factors:
– Speculation around economic model overhaul and improved utility from cross-chain upgrades. �
– Recent moving average cross higher and positive momentum indicators. �
CoinMarketCap
CoinMarketCap
📉 Bearish Risks:
– Ecosystem uncertainty and selective project exits weaken investor sentiment. �
– Trading volume still modest, limiting strong directional moves. �
CoinMarketCap
CoinMarketCap
Summary: ATOM shows short-term strength but needs clear breakouts above key resistance to confirm a sustained uptrend.
#WriteToEarnUpgrade #ATOM #CPIWatch #USJobsData #BTCVSGOLD
1
1
83
ASR jüngste 10-Zeilen-Analyse (Januar 2026)
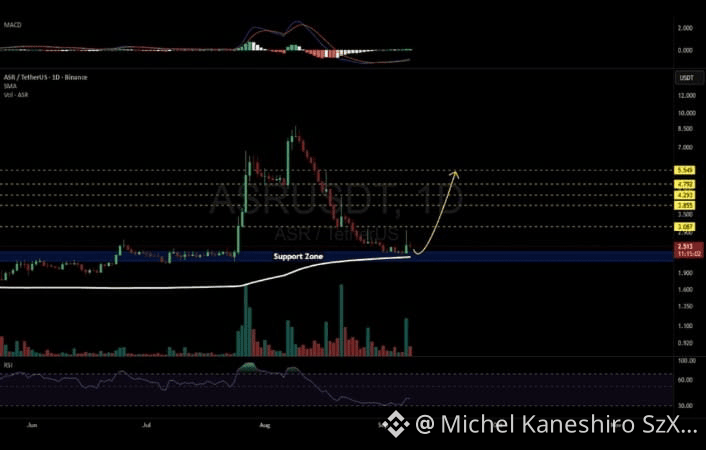
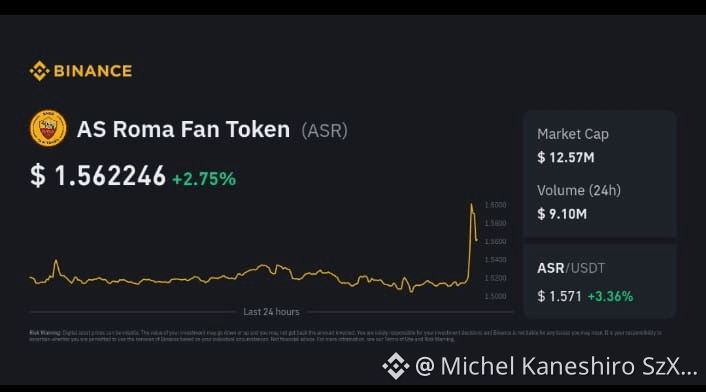
$ASR AS Roma Fan Token (ASR) wird derzeit um $1,50 – $1,55 gehandelt, wobei geringfügige tägliche Schwankungen auftreten. �
Binance
Der 24-Stunden-Preis ist gemischt verlaufen, mit leichten Gewinnen oder geringen Rückgängen je nach Börsendaten. �
CoinMarketCap
Das 24-Stunden-Handelsvolumen von ASR (~$5–6 Mio.) zeigt moderate Liquidität für einen Small-Cap-Token. �
CoinGecko
Die Marktkapitalisierung beträgt etwa $12 Mio., was auf einen relativ geringen Markteinfluss hindeutet. �
CoinMarketCap
Der Preis liegt deutlich unter seinem historischen Allzeithoch (~$26) und zeigt somit langfristigen Abwärtstrenddruck. �
CoinMarketCap
Rezenten wöchentlichen und monatlichen Daten zufolge besteht eine leichte Aufwärtsbewegung (7-Tage-Positiv). �
Gate.com
Technische Signale deuten auf einen Preisrutsch nahe dem Unterstützungsniveau hin, doch die Widerstandslinie darüber verlangsamt Fortschritte. �
CoinMarketCap
Hohe Hebelwirkung und schwankende Kurse im Futures-Markt erhöhen das Volatilitätsrisiko für Kurzfrist-Handelnde. �
CoinMarketCap
Der ASR-Preis ist empfindlich gegenüber Fan-Aktivitäten und Vereinsankündigungen, nicht nur allgemeinen Kryptotrends. �
CoinMarketCap
Ein Durchbruch über den entscheidenden Widerstand bei $1,60–$1,62 könnte Raum für größere Gewinne eröffnen, während ein Bruch unter $1,45 den Verkaufsdruck erhöhen könnte. �
CoinMarketCap
📌 Zusammenfassung: ASR befindet sich in einer volatilen Konsolidierung nahe ~$1,50, beeinflusst durch Liquiditätsfluktuationen, Derivate-Handel und die Stimmung rund um den Fan-Token – Achtung auf Unterstützung und Widerstand.
{spot}(ASRUSDT)
#WriteToEarnUpgrade #CPIWatch #USJobsData #BTCVSGOLD #asr
ASR jüngste 10-Zeilen-Analyse (Januar 2026)
$ASR AS Roma Fan Token (ASR) wird derzeit um $1,50 – $1,55 gehandelt, wobei geringfügige tägliche Schwankungen auftreten. �
Binance
Der 24-Stunden-Preis ist gemischt verlaufen, mit leichten Gewinnen oder geringen Rückgängen je nach Börsendaten. �
CoinMarketCap
Das 24-Stunden-Handelsvolumen von ASR (~$5–6 Mio.) zeigt moderate Liquidität für einen Small-Cap-Token. �
CoinGecko
Die Marktkapitalisierung beträgt etwa $12 Mio., was auf einen relativ geringen Markteinfluss hindeutet. �
CoinMarketCap
Der Preis liegt deutlich unter seinem historischen Allzeithoch (~$26) und zeigt somit langfristigen Abwärtstrenddruck. �
CoinMarketCap
Rezenten wöchentlichen und monatlichen Daten zufolge besteht eine leichte Aufwärtsbewegung (7-Tage-Positiv). �
Gate.com
Technische Signale deuten auf einen Preisrutsch nahe dem Unterstützungsniveau hin, doch die Widerstandslinie darüber verlangsamt Fortschritte. �
CoinMarketCap
Hohe Hebelwirkung und schwankende Kurse im Futures-Markt erhöhen das Volatilitätsrisiko für Kurzfrist-Handelnde. �
CoinMarketCap
Der ASR-Preis ist empfindlich gegenüber Fan-Aktivitäten und Vereinsankündigungen, nicht nur allgemeinen Kryptotrends. �
CoinMarketCap
Ein Durchbruch über den entscheidenden Widerstand bei $1,60–$1,62 könnte Raum für größere Gewinne eröffnen, während ein Bruch unter $1,45 den Verkaufsdruck erhöhen könnte. �
CoinMarketCap
📌 Zusammenfassung: ASR befindet sich in einer volatilen Konsolidierung nahe ~$1,50, beeinflusst durch Liquiditätsfluktuationen, Derivate-Handel und die Stimmung rund um den Fan-Token – Achtung auf Unterstützung und Widerstand.
#WriteToEarnUpgrade #CPIWatch #USJobsData #BTCVSGOLD #asr
$ASR AS Roma Fan Token (ASR) wird derzeit um $1,50 – $1,55 gehandelt, wobei geringfügige tägliche Schwankungen auftreten. �
Binance
Der 24-Stunden-Preis ist gemischt verlaufen, mit leichten Gewinnen oder geringen Rückgängen je nach Börsendaten. �
CoinMarketCap
Das 24-Stunden-Handelsvolumen von ASR (~$5–6 Mio.) zeigt moderate Liquidität für einen Small-Cap-Token. �
CoinGecko
Die Marktkapitalisierung beträgt etwa $12 Mio., was auf einen relativ geringen Markteinfluss hindeutet. �
CoinMarketCap
Der Preis liegt deutlich unter seinem historischen Allzeithoch (~$26) und zeigt somit langfristigen Abwärtstrenddruck. �
CoinMarketCap
Rezenten wöchentlichen und monatlichen Daten zufolge besteht eine leichte Aufwärtsbewegung (7-Tage-Positiv). �
Gate.com
Technische Signale deuten auf einen Preisrutsch nahe dem Unterstützungsniveau hin, doch die Widerstandslinie darüber verlangsamt Fortschritte. �
CoinMarketCap
Hohe Hebelwirkung und schwankende Kurse im Futures-Markt erhöhen das Volatilitätsrisiko für Kurzfrist-Handelnde. �
CoinMarketCap
Der ASR-Preis ist empfindlich gegenüber Fan-Aktivitäten und Vereinsankündigungen, nicht nur allgemeinen Kryptotrends. �
CoinMarketCap
Ein Durchbruch über den entscheidenden Widerstand bei $1,60–$1,62 könnte Raum für größere Gewinne eröffnen, während ein Bruch unter $1,45 den Verkaufsdruck erhöhen könnte. �
CoinMarketCap
📌 Zusammenfassung: ASR befindet sich in einer volatilen Konsolidierung nahe ~$1,50, beeinflusst durch Liquiditätsfluktuationen, Derivate-Handel und die Stimmung rund um den Fan-Token – Achtung auf Unterstützung und Widerstand.
#WriteToEarnUpgrade #CPIWatch #USJobsData #BTCVSGOLD #asr
1
14
Übersetzung ansehen
ASR Latest 10-Line Analysis (January 2026)
$ASR AS Roma Fan Token (ASR) is trading around $1.50 – $1.55 with small daily changes. �
Binance
The 24-hour price has been mixed, with slight gains or small declines depending on exchange data. �
CoinMarketCap
ASR’s 24 h trading volume (~$5–6M) shows moderate liquidity for a small-cap token. �
CoinGecko
The market cap is about $12 M, indicating a relatively small market influence. �
CoinMarketCap
Price remains well below its historical all-time high (~$26), showing long-term downtrend pressure. �
CoinMarketCap
Recent weekly and monthly data show slight upward momentum (7-day positives). �
Gate.com
Technical signals suggest price bouncing near support, but resistance above slows advances. �
CoinMarketCap
High leverage and trading swings in futures markets add volatility risk for short-term traders. �
CoinMarketCap
ASR price is sensitive to fan activity and club announcements, not just general crypto trends. �
CoinMarketCap
A break above key resistance near $1.60–$1.62 could open room for larger gains, while breach below $1.45 may increase selling pressure. �
CoinMarketCap
📌 Summary: ASR is in a volatile consolidation near ~$1.50, influenced by liquidity fluctuations, derivative trades, and fan token sentiment — watch support and resistance closely.
{spot}(ASRUSDT)
#BTCVSGOLD #USJobsData #CPIWatch #WriteToEarnUpgrade #ZTCBinanceTGE
ASR Latest 10-Line Analysis (January 2026)
$ASR AS Roma Fan Token (ASR) is trading around $1.50 – $1.55 with small daily changes. �
Binance
The 24-hour price has been mixed, with slight gains or small declines depending on exchange data. �
CoinMarketCap
ASR’s 24 h trading volume (~$5–6M) shows moderate liquidity for a small-cap token. �
CoinGecko
The market cap is about $12 M, indicating a relatively small market influence. �
CoinMarketCap
Price remains well below its historical all-time high (~$26), showing long-term downtrend pressure. �
CoinMarketCap
Recent weekly and monthly data show slight upward momentum (7-day positives). �
Gate.com
Technical signals suggest price bouncing near support, but resistance above slows advances. �
CoinMarketCap
High leverage and trading swings in futures markets add volatility risk for short-term traders. �
CoinMarketCap
ASR price is sensitive to fan activity and club announcements, not just general crypto trends. �
CoinMarketCap
A break above key resistance near $1.60–$1.62 could open room for larger gains, while breach below $1.45 may increase selling pressure. �
CoinMarketCap
📌 Summary: ASR is in a volatile consolidation near ~$1.50, influenced by liquidity fluctuations, derivative trades, and fan token sentiment — watch support and resistance closely.
#BTCVSGOLD #USJobsData #CPIWatch #WriteToEarnUpgrade #ZTCBinanceTGE
$ASR AS Roma Fan Token (ASR) is trading around $1.50 – $1.55 with small daily changes. �
Binance
The 24-hour price has been mixed, with slight gains or small declines depending on exchange data. �
CoinMarketCap
ASR’s 24 h trading volume (~$5–6M) shows moderate liquidity for a small-cap token. �
CoinGecko
The market cap is about $12 M, indicating a relatively small market influence. �
CoinMarketCap
Price remains well below its historical all-time high (~$26), showing long-term downtrend pressure. �
CoinMarketCap
Recent weekly and monthly data show slight upward momentum (7-day positives). �
Gate.com
Technical signals suggest price bouncing near support, but resistance above slows advances. �
CoinMarketCap
High leverage and trading swings in futures markets add volatility risk for short-term traders. �
CoinMarketCap
ASR price is sensitive to fan activity and club announcements, not just general crypto trends. �
CoinMarketCap
A break above key resistance near $1.60–$1.62 could open room for larger gains, while breach below $1.45 may increase selling pressure. �
CoinMarketCap
📌 Summary: ASR is in a volatile consolidation near ~$1.50, influenced by liquidity fluctuations, derivative trades, and fan token sentiment — watch support and resistance closely.
#BTCVSGOLD #USJobsData #CPIWatch #WriteToEarnUpgrade #ZTCBinanceTGE
1
279
Übersetzung ansehen
📊 Ethereum (ETH) Short-Term Price Analysis
$ETH
{spot}(ETHUSDT)
$BTC
{spot}(BTCUSDT)
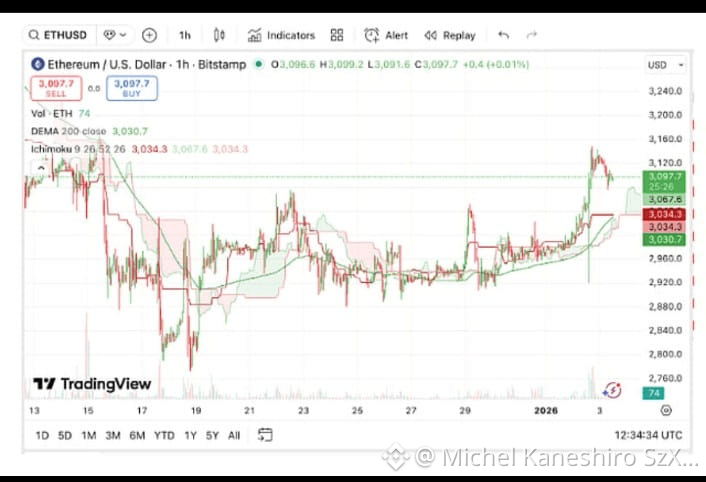
• ETH has climbed above key moving averages (50-day EMA) and is testing resistance near $3,260-$3,300, signaling bullish momentum if this level breaks with volume.
• The price is forming compressions that could precede a larger move; reclaiming overhead resistance decisively may push ETH toward $3,400-$3,600.
📌 Near-Term Structure
• Bullish if ETH closes above $3,260-$3,300 with strength — opens path to higher targets like $3,400–$3,600+ early in 2026.
• If rejection occurs here, consolidation or pullbacks to $3,000–$2,900 support can occur before trend re-acceleration.
📈 Momentum Signals
• RSI and moving averages indicate buying pressure increasing, though careful watch on resistance breakouts required.
• Some predictions and technical models anticipate potential for larger rallies if major resistance levels are cleared.
📰 Recent Market Context
• Ethereum price has been holding above the psychological $3,000 level amid broader crypto strength, suggesting resilient investor sentiment. �
• Technical reports suggest that next directional move will be defined by how ETH handles current compression near key levels — breakouts can signal new trends. �
Finance Magnates
CryptoPotato
#BTCVSGOLD #Ethereum #WriteToEarnUpgrade #BinanceAlphaAlert #CPIWatch
📊 Ethereum (ETH) Short-Term Price Analysis
$ETH
$BTC
• ETH has climbed above key moving averages (50-day EMA) and is testing resistance near $3,260-$3,300, signaling bullish momentum if this level breaks with volume.
• The price is forming compressions that could precede a larger move; reclaiming overhead resistance decisively may push ETH toward $3,400-$3,600.
📌 Near-Term Structure
• Bullish if ETH closes above $3,260-$3,300 with strength — opens path to higher targets like $3,400–$3,600+ early in 2026.
• If rejection occurs here, consolidation or pullbacks to $3,000–$2,900 support can occur before trend re-acceleration.
📈 Momentum Signals
• RSI and moving averages indicate buying pressure increasing, though careful watch on resistance breakouts required.
• Some predictions and technical models anticipate potential for larger rallies if major resistance levels are cleared.
📰 Recent Market Context
• Ethereum price has been holding above the psychological $3,000 level amid broader crypto strength, suggesting resilient investor sentiment. �
• Technical reports suggest that next directional move will be defined by how ETH handles current compression near key levels — breakouts can signal new trends. �
Finance Magnates
CryptoPotato
#BTCVSGOLD #Ethereum #WriteToEarnUpgrade #BinanceAlphaAlert #CPIWatch
$ETH
$BTC
• ETH has climbed above key moving averages (50-day EMA) and is testing resistance near $3,260-$3,300, signaling bullish momentum if this level breaks with volume.
• The price is forming compressions that could precede a larger move; reclaiming overhead resistance decisively may push ETH toward $3,400-$3,600.
📌 Near-Term Structure
• Bullish if ETH closes above $3,260-$3,300 with strength — opens path to higher targets like $3,400–$3,600+ early in 2026.
• If rejection occurs here, consolidation or pullbacks to $3,000–$2,900 support can occur before trend re-acceleration.
📈 Momentum Signals
• RSI and moving averages indicate buying pressure increasing, though careful watch on resistance breakouts required.
• Some predictions and technical models anticipate potential for larger rallies if major resistance levels are cleared.
📰 Recent Market Context
• Ethereum price has been holding above the psychological $3,000 level amid broader crypto strength, suggesting resilient investor sentiment. �
• Technical reports suggest that next directional move will be defined by how ETH handles current compression near key levels — breakouts can signal new trends. �
Finance Magnates
CryptoPotato
#BTCVSGOLD #Ethereum #WriteToEarnUpgrade #BinanceAlphaAlert #CPIWatch
1
71
Übersetzung ansehen
📊 Bitcoin (BTC) Latest Market Analysis – January 2026
$BTC
{spot}(BTCUSDT)
Current Trend:
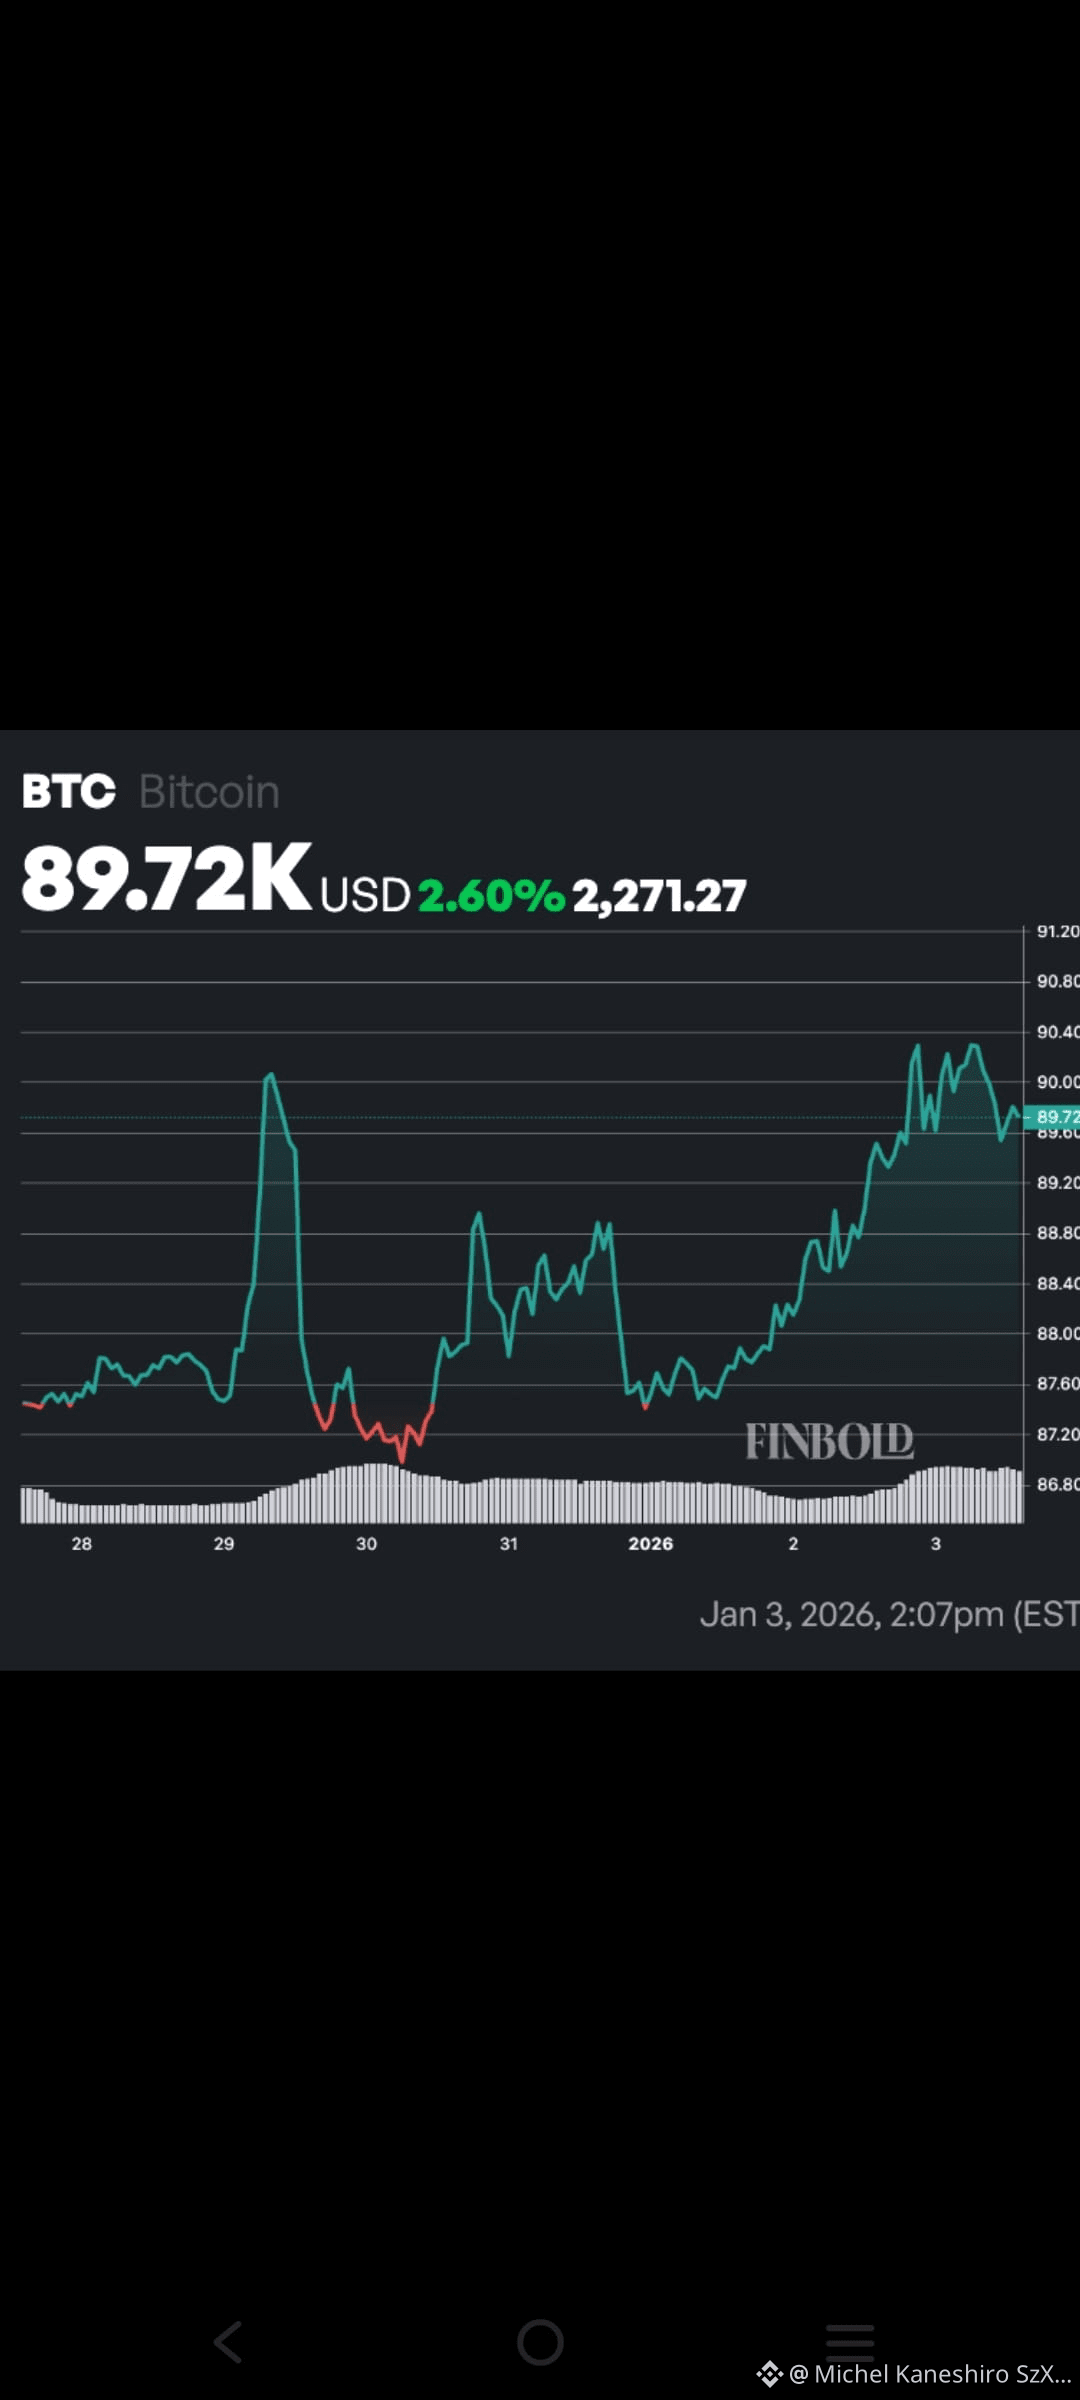
Bitcoin has been trading in a sideways to slightly bullish range around $85,000–$95,000, with recent consolidation near key resistance around the mid-$90K zone. �
FXStreet
Bullish Signals:
• Analysts see potential for upside if BTC breaks above immediate resistance — technically a move above $94K+ could open the door toward $100K+ and even higher targets later in 2026. �
• Some macro models suggest a strong recovery phase with higher probability of price gains in 2026, based on historical valuation metrics. �
• Longer-term forecasts by various price models and institutions show targets ranging from ~$150K to ~$250K+ by year-end 2026 on institutional adoption and supply constraints. �
MEXC
Cointelegraph
CoinGecko +1
Bearish / Risk Factors:
• Bitcoin experienced annual weakness in 2025 (its first yearly loss since 2022), showing sensitivity to macro headwinds and stock market correlations. �
• Technical analysts caution that failure to hold support around $84K–$80K could trigger deeper corrections toward lower levels like $74K or even $50K in extreme risk scenarios. �
Reuters
MEXC +1
Short-Term Range:
BTC may continue trading within a tight range, balancing between support near $84K–$88K and resistance around $92K–$96K before a breakout or breakdown sets overall direction. �
FXStreet
Summary:
👉 Overall, Bitcoin shows mixed signals — neutral to slightly bullish short-term, with significant upside potential if key levels are cleared, but also downside risk if support fails. Longer-term institutional and macro catalysts could drive strong gains through 2026. �
CoinGecko +1
⚠️ *Cryptocurrency markets are volatile — this is not financial advice. Always research further before making investment decisions.*
#CPIWatch #WriteToEarnUpgrade #BTCVSGOLD #BinanceAlphaAlert #StrategyBTCPurchase
📊 Bitcoin (BTC) Latest Market Analysis – January 2026
$BTC
Current Trend:
Bitcoin has been trading in a sideways to slightly bullish range around $85,000–$95,000, with recent consolidation near key resistance around the mid-$90K zone. �
FXStreet
Bullish Signals:
• Analysts see potential for upside if BTC breaks above immediate resistance — technically a move above $94K+ could open the door toward $100K+ and even higher targets later in 2026. �
• Some macro models suggest a strong recovery phase with higher probability of price gains in 2026, based on historical valuation metrics. �
• Longer-term forecasts by various price models and institutions show targets ranging from ~$150K to ~$250K+ by year-end 2026 on institutional adoption and supply constraints. �
MEXC
Cointelegraph
CoinGecko +1
Bearish / Risk Factors:
• Bitcoin experienced annual weakness in 2025 (its first yearly loss since 2022), showing sensitivity to macro headwinds and stock market correlations. �
• Technical analysts caution that failure to hold support around $84K–$80K could trigger deeper corrections toward lower levels like $74K or even $50K in extreme risk scenarios. �
Reuters
MEXC +1
Short-Term Range:
BTC may continue trading within a tight range, balancing between support near $84K–$88K and resistance around $92K–$96K before a breakout or breakdown sets overall direction. �
FXStreet
Summary:
👉 Overall, Bitcoin shows mixed signals — neutral to slightly bullish short-term, with significant upside potential if key levels are cleared, but also downside risk if support fails. Longer-term institutional and macro catalysts could drive strong gains through 2026. �
CoinGecko +1
⚠️ *Cryptocurrency markets are volatile — this is not financial advice. Always research further before making investment decisions.*
#CPIWatch #WriteToEarnUpgrade #BTCVSGOLD #BinanceAlphaAlert #StrategyBTCPurchase
$BTC
Current Trend:
Bitcoin has been trading in a sideways to slightly bullish range around $85,000–$95,000, with recent consolidation near key resistance around the mid-$90K zone. �
FXStreet
Bullish Signals:
• Analysts see potential for upside if BTC breaks above immediate resistance — technically a move above $94K+ could open the door toward $100K+ and even higher targets later in 2026. �
• Some macro models suggest a strong recovery phase with higher probability of price gains in 2026, based on historical valuation metrics. �
• Longer-term forecasts by various price models and institutions show targets ranging from ~$150K to ~$250K+ by year-end 2026 on institutional adoption and supply constraints. �
MEXC
Cointelegraph
CoinGecko +1
Bearish / Risk Factors:
• Bitcoin experienced annual weakness in 2025 (its first yearly loss since 2022), showing sensitivity to macro headwinds and stock market correlations. �
• Technical analysts caution that failure to hold support around $84K–$80K could trigger deeper corrections toward lower levels like $74K or even $50K in extreme risk scenarios. �
Reuters
MEXC +1
Short-Term Range:
BTC may continue trading within a tight range, balancing between support near $84K–$88K and resistance around $92K–$96K before a breakout or breakdown sets overall direction. �
FXStreet
Summary:
👉 Overall, Bitcoin shows mixed signals — neutral to slightly bullish short-term, with significant upside potential if key levels are cleared, but also downside risk if support fails. Longer-term institutional and macro catalysts could drive strong gains through 2026. �
CoinGecko +1
⚠️ *Cryptocurrency markets are volatile — this is not financial advice. Always research further before making investment decisions.*
#CPIWatch #WriteToEarnUpgrade #BTCVSGOLD #BinanceAlphaAlert #StrategyBTCPurchase
3
Übersetzung ansehen
📊 Bitcoin (BTC) Latest Market Analysis – January 2026
$BTC
{spot}(BTCUSDT)
Current Trend:
Bitcoin has been trading in a sideways to slightly bullish range around $85,000–$95,000, with recent consolidation near key resistance around the mid-$90K zone. �
FXStreet
Bullish Signals:
• Analysts see potential for upside if BTC breaks above immediate resistance — technically a move above $94K+ could open the door toward $100K+ and even higher targets later in 2026. �
• Some macro models suggest a strong recovery phase with higher probability of price gains in 2026, based on historical valuation metrics. �
• Longer-term forecasts by various price models and institutions show targets ranging from ~$150K to ~$250K+ by year-end 2026 on institutional adoption and supply constraints. �
MEXC
Cointelegraph
CoinGecko +1
Bearish / Risk Factors:
• Bitcoin experienced annual weakness in 2025 (its first yearly loss since 2022), showing sensitivity to macro headwinds and stock market correlations. �
• Technical analysts caution that failure to hold support around $84K–$80K could trigger deeper corrections toward lower levels like $74K or even $50K in extreme risk scenarios. �
Reuters
MEXC +1
Short-Term Range:
BTC may continue trading within a tight range, balancing between support near $84K–$88K and resistance around $92K–$96K before a breakout or breakdown sets overall direction. �
FXStreet
Summary:
👉 Overall, Bitcoin shows mixed signals — neutral to slightly bullish short-term, with significant upside potential if key levels are cleared, but also downside risk if support fails. Longer-term institutional and macro catalysts could drive strong gains through 2026. �
CoinGecko +1
⚠️ *Cryptocurrency markets are volatile — this is not financial advice. Always research further before making investment decisions.*
#USJobsData #WriteToEarnUpgrade #BinanceAlphaAlert #StrategyBTCPurchase #BTCVSGOLD
📊 Bitcoin (BTC) Latest Market Analysis – January 2026
$BTC
Current Trend:
Bitcoin has been trading in a sideways to slightly bullish range around $85,000–$95,000, with recent consolidation near key resistance around the mid-$90K zone. �
FXStreet
Bullish Signals:
• Analysts see potential for upside if BTC breaks above immediate resistance — technically a move above $94K+ could open the door toward $100K+ and even higher targets later in 2026. �
• Some macro models suggest a strong recovery phase with higher probability of price gains in 2026, based on historical valuation metrics. �
• Longer-term forecasts by various price models and institutions show targets ranging from ~$150K to ~$250K+ by year-end 2026 on institutional adoption and supply constraints. �
MEXC
Cointelegraph
CoinGecko +1
Bearish / Risk Factors:
• Bitcoin experienced annual weakness in 2025 (its first yearly loss since 2022), showing sensitivity to macro headwinds and stock market correlations. �
• Technical analysts caution that failure to hold support around $84K–$80K could trigger deeper corrections toward lower levels like $74K or even $50K in extreme risk scenarios. �
Reuters
MEXC +1
Short-Term Range:
BTC may continue trading within a tight range, balancing between support near $84K–$88K and resistance around $92K–$96K before a breakout or breakdown sets overall direction. �
FXStreet
Summary:
👉 Overall, Bitcoin shows mixed signals — neutral to slightly bullish short-term, with significant upside potential if key levels are cleared, but also downside risk if support fails. Longer-term institutional and macro catalysts could drive strong gains through 2026. �
CoinGecko +1
⚠️ *Cryptocurrency markets are volatile — this is not financial advice. Always research further before making investment decisions.*
#USJobsData #WriteToEarnUpgrade #BinanceAlphaAlert #StrategyBTCPurchase #BTCVSGOLD
$BTC
Current Trend:
Bitcoin has been trading in a sideways to slightly bullish range around $85,000–$95,000, with recent consolidation near key resistance around the mid-$90K zone. �
FXStreet
Bullish Signals:
• Analysts see potential for upside if BTC breaks above immediate resistance — technically a move above $94K+ could open the door toward $100K+ and even higher targets later in 2026. �
• Some macro models suggest a strong recovery phase with higher probability of price gains in 2026, based on historical valuation metrics. �
• Longer-term forecasts by various price models and institutions show targets ranging from ~$150K to ~$250K+ by year-end 2026 on institutional adoption and supply constraints. �
MEXC
Cointelegraph
CoinGecko +1
Bearish / Risk Factors:
• Bitcoin experienced annual weakness in 2025 (its first yearly loss since 2022), showing sensitivity to macro headwinds and stock market correlations. �
• Technical analysts caution that failure to hold support around $84K–$80K could trigger deeper corrections toward lower levels like $74K or even $50K in extreme risk scenarios. �
Reuters
MEXC +1
Short-Term Range:
BTC may continue trading within a tight range, balancing between support near $84K–$88K and resistance around $92K–$96K before a breakout or breakdown sets overall direction. �
FXStreet
Summary:
👉 Overall, Bitcoin shows mixed signals — neutral to slightly bullish short-term, with significant upside potential if key levels are cleared, but also downside risk if support fails. Longer-term institutional and macro catalysts could drive strong gains through 2026. �
CoinGecko +1
⚠️ *Cryptocurrency markets are volatile — this is not financial advice. Always research further before making investment decisions.*
#USJobsData #WriteToEarnUpgrade #BinanceAlphaAlert #StrategyBTCPurchase #BTCVSGOLD
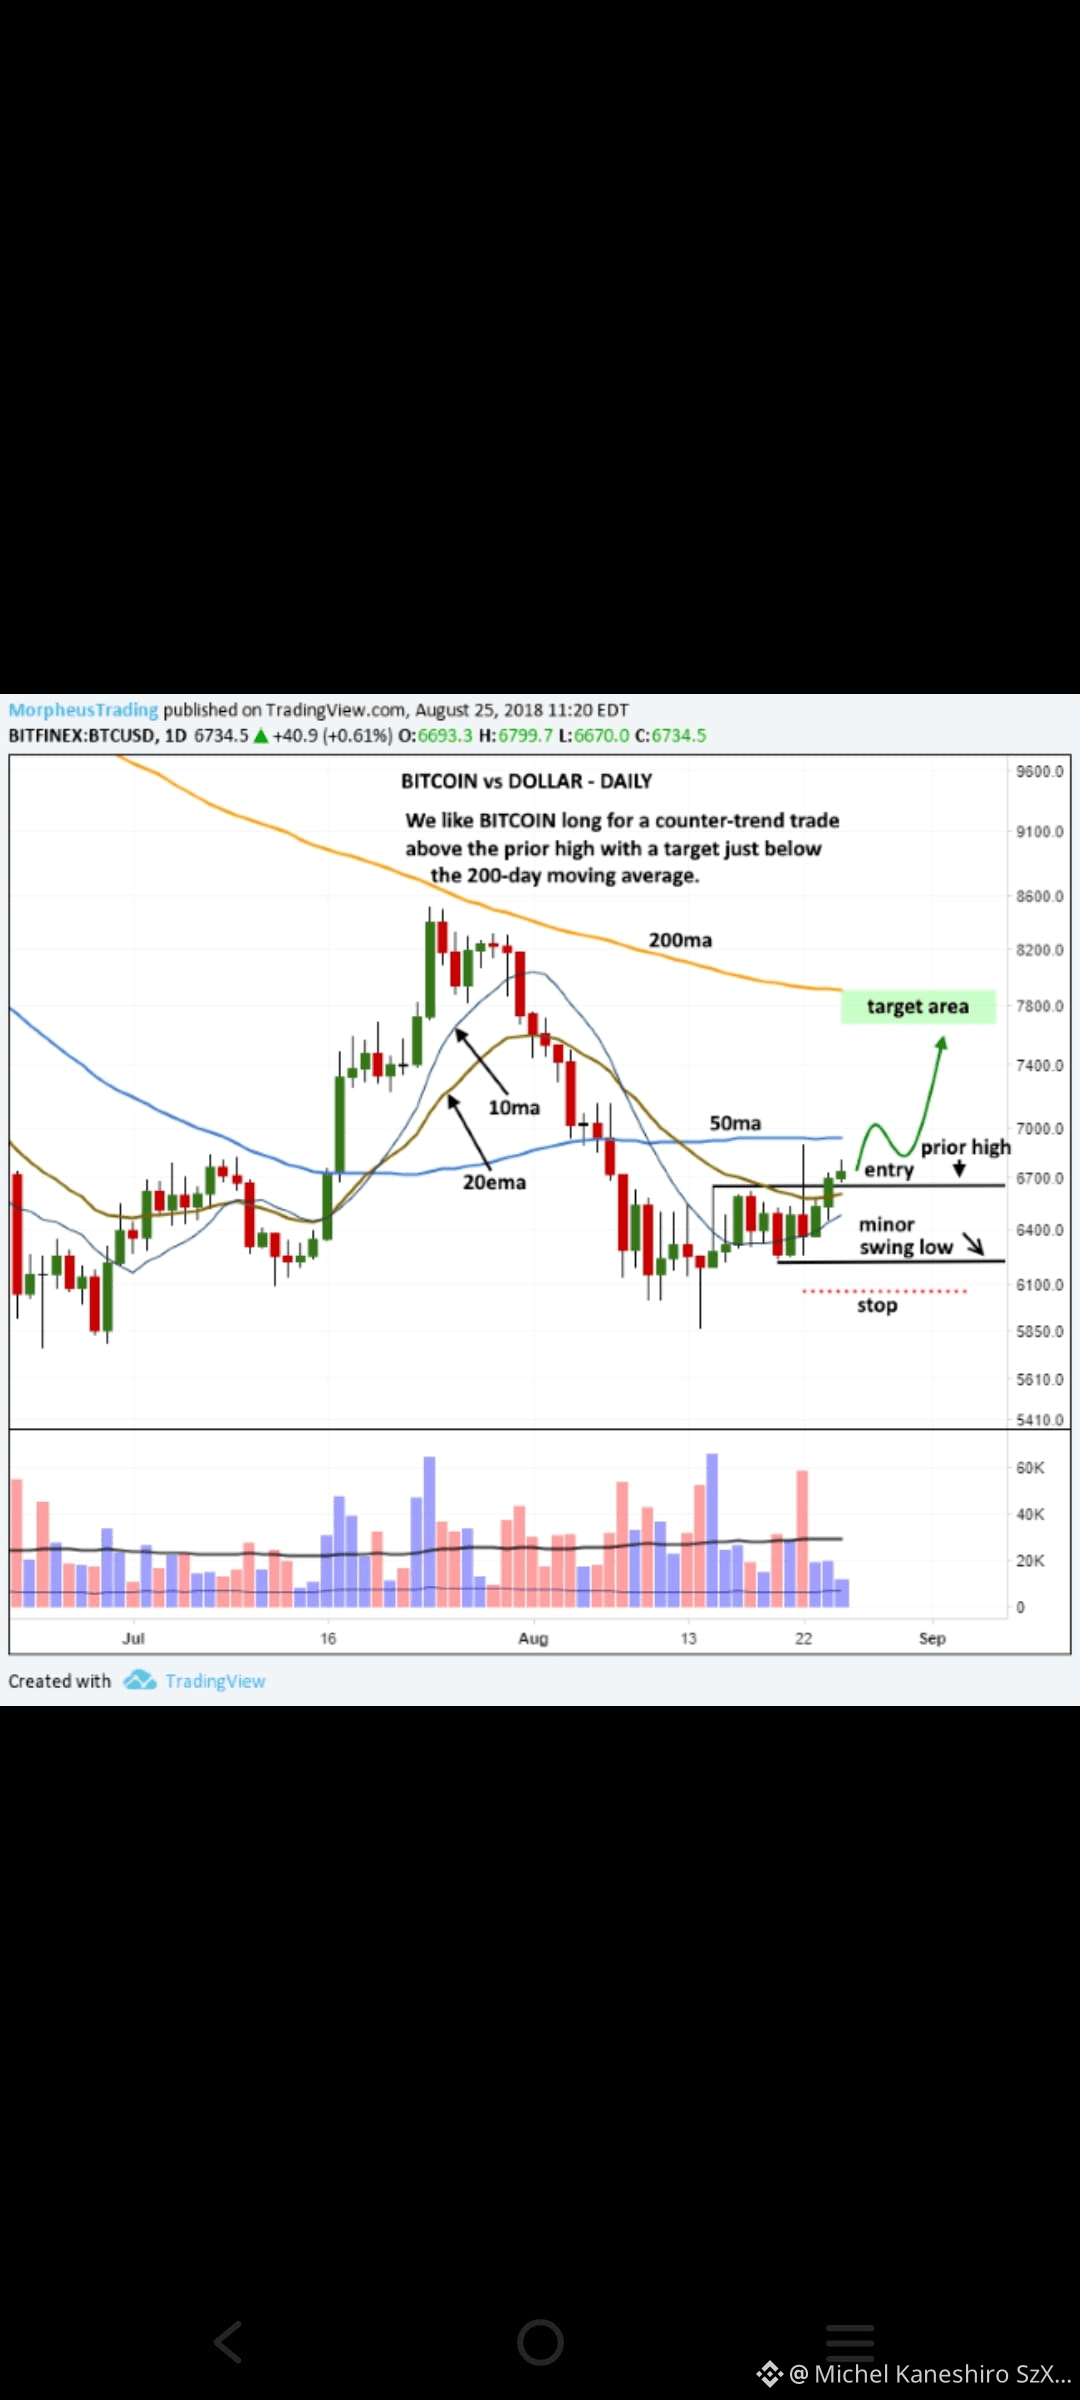
75
Übersetzung ansehen
📊 Bitcoin (BTC) Latest Market Analysis – January 2026
$BTC Current Trend:
Bitcoin has been trading in a sideways to slightly bullish range around $85,000–$95,000, with recent consolidation near key resistance around the mid-$90K zone. �
FXStreet
Bullish Signals:
• Analysts see potential for upside if BTC breaks above immediate resistance — technically a move above $94K+ could open the door toward $100K+ and even higher targets later in 2026. �
• Some macro models suggest a strong recovery phase with higher probability of price gains in 2026, based on historical valuation metrics. �
• Longer-term forecasts by various price models and institutions show targets ranging from ~$150K to ~$250K+ by year-end 2026 on institutional adoption and supply constraints. �
MEXC
Cointelegraph
CoinGecko +1
Bearish / Risk Factors:
• Bitcoin experienced annual weakness in 2025 (its first yearly loss since 2022), showing sensitivity to macro headwinds and stock market correlations. �
• Technical analysts caution that failure to hold support around $84K–$80K could trigger deeper corrections toward lower levels like $74K or even $50K in extreme risk scenarios. �
Reuters
MEXC +1
Short-Term Range:
BTC may continue trading within a tight range, balancing between support near $84K–$88K and resistance around $92K–$96K before a breakout or breakdown sets overall direction. �
FXStreet
Summary:
👉 Overall, Bitcoin shows mixed signals — neutral to slightly bullish short-term, with significant upside potential if key levels are cleared, but also downside risk if support fails. Longer-term institutional and macro catalysts could drive strong gains through 2026. �
CoinGecko +1
⚠️ *Cryptocurrency markets are volatile — this is not financial advice. Always research further before making investment decisions.*
#USJobsData #WriteToEarnUpgrade #CPIWatch #StrategyBTCPurchase #BinanceAlphaAlert
{spot}(BTCUSDT)
📊 Bitcoin (BTC) Latest Market Analysis – January 2026
$BTC Current Trend:
Bitcoin has been trading in a sideways to slightly bullish range around $85,000–$95,000, with recent consolidation near key resistance around the mid-$90K zone. �
FXStreet
Bullish Signals:
• Analysts see potential for upside if BTC breaks above immediate resistance — technically a move above $94K+ could open the door toward $100K+ and even higher targets later in 2026. �
• Some macro models suggest a strong recovery phase with higher probability of price gains in 2026, based on historical valuation metrics. �
• Longer-term forecasts by various price models and institutions show targets ranging from ~$150K to ~$250K+ by year-end 2026 on institutional adoption and supply constraints. �
MEXC
Cointelegraph
CoinGecko +1
Bearish / Risk Factors:
• Bitcoin experienced annual weakness in 2025 (its first yearly loss since 2022), showing sensitivity to macro headwinds and stock market correlations. �
• Technical analysts caution that failure to hold support around $84K–$80K could trigger deeper corrections toward lower levels like $74K or even $50K in extreme risk scenarios. �
Reuters
MEXC +1
Short-Term Range:
BTC may continue trading within a tight range, balancing between support near $84K–$88K and resistance around $92K–$96K before a breakout or breakdown sets overall direction. �
FXStreet
Summary:
👉 Overall, Bitcoin shows mixed signals — neutral to slightly bullish short-term, with significant upside potential if key levels are cleared, but also downside risk if support fails. Longer-term institutional and macro catalysts could drive strong gains through 2026. �
CoinGecko +1
⚠️ *Cryptocurrency markets are volatile — this is not financial advice. Always research further before making investment decisions.*
#USJobsData #WriteToEarnUpgrade #CPIWatch #StrategyBTCPurchase #BinanceAlphaAlert
$BTC Current Trend:
Bitcoin has been trading in a sideways to slightly bullish range around $85,000–$95,000, with recent consolidation near key resistance around the mid-$90K zone. �
FXStreet
Bullish Signals:
• Analysts see potential for upside if BTC breaks above immediate resistance — technically a move above $94K+ could open the door toward $100K+ and even higher targets later in 2026. �
• Some macro models suggest a strong recovery phase with higher probability of price gains in 2026, based on historical valuation metrics. �
• Longer-term forecasts by various price models and institutions show targets ranging from ~$150K to ~$250K+ by year-end 2026 on institutional adoption and supply constraints. �
MEXC
Cointelegraph
CoinGecko +1
Bearish / Risk Factors:
• Bitcoin experienced annual weakness in 2025 (its first yearly loss since 2022), showing sensitivity to macro headwinds and stock market correlations. �
• Technical analysts caution that failure to hold support around $84K–$80K could trigger deeper corrections toward lower levels like $74K or even $50K in extreme risk scenarios. �
Reuters
MEXC +1
Short-Term Range:
BTC may continue trading within a tight range, balancing between support near $84K–$88K and resistance around $92K–$96K before a breakout or breakdown sets overall direction. �
FXStreet
Summary:
👉 Overall, Bitcoin shows mixed signals — neutral to slightly bullish short-term, with significant upside potential if key levels are cleared, but also downside risk if support fails. Longer-term institutional and macro catalysts could drive strong gains through 2026. �
CoinGecko +1
⚠️ *Cryptocurrency markets are volatile — this is not financial advice. Always research further before making investment decisions.*
#USJobsData #WriteToEarnUpgrade #CPIWatch #StrategyBTCPurchase #BinanceAlphaAlert
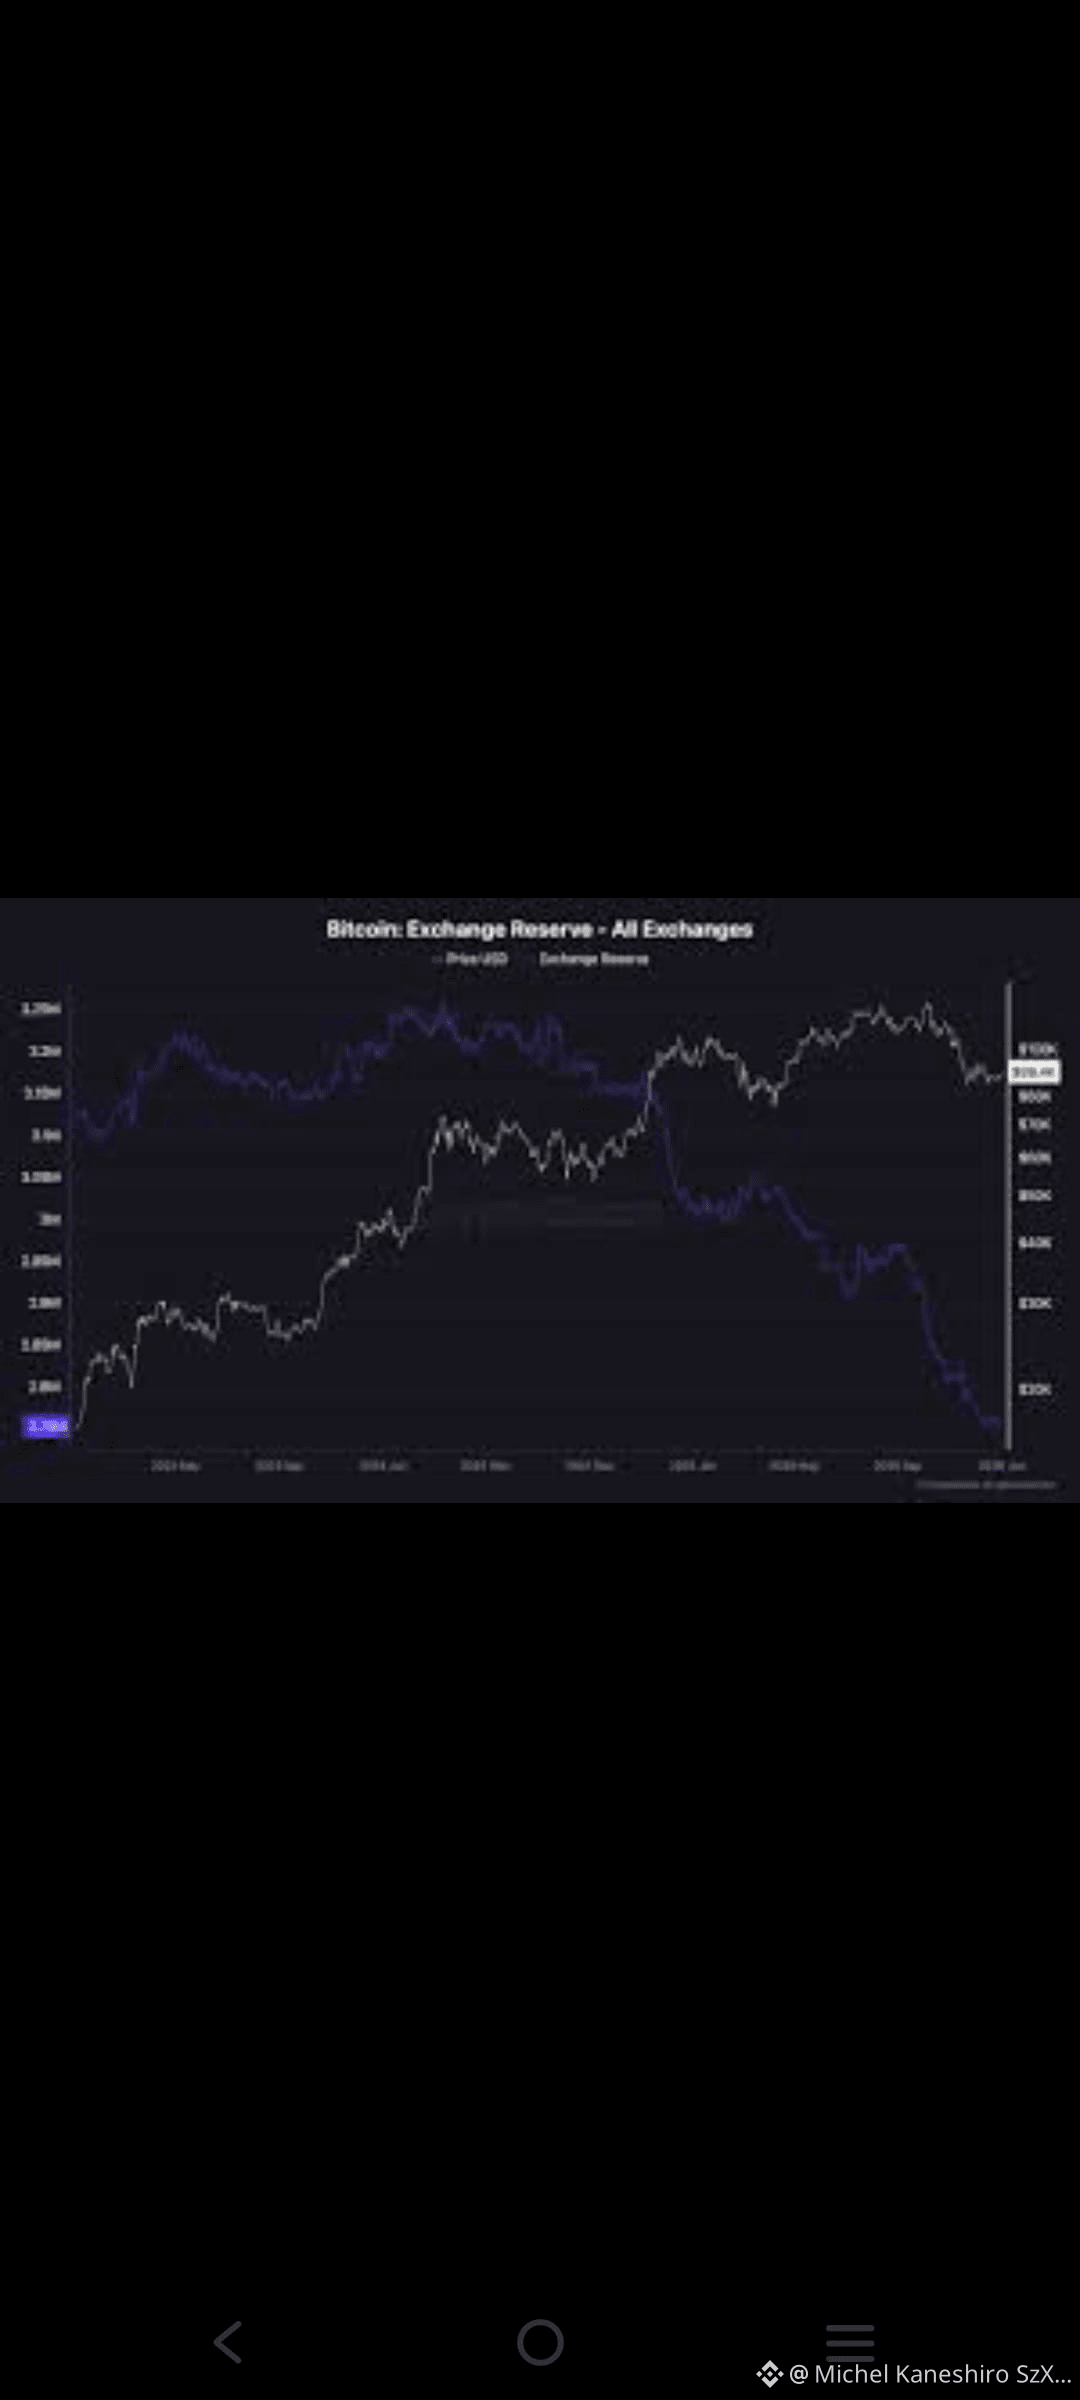
5
5
Übersetzung ansehen
📊 Bitcoin (BTC) Latest Market Analysis – January 2026
$BTC Current Trend:
Bitcoin has been trading in a sideways to slightly bullish range around $85,000–$95,000, with recent consolidation near key resistance around the mid-$90K zone. �
FXStreet
Bullish Signals:
• Analysts see potential for upside if BTC breaks above immediate resistance — technically a move above $94K+ could open the door toward $100K+ and even higher targets later in 2026. �
• Some macro models suggest a strong recovery phase with higher probability of price gains in 2026, based on historical valuation metrics. �
• Longer-term forecasts by various price models and institutions show targets ranging from ~$150K to ~$250K+ by year-end 2026 on institutional adoption and supply constraints. �
MEXC
Cointelegraph
CoinGecko +1
Bearish / Risk Factors:
• Bitcoin experienced annual weakness in 2025 (its first yearly loss since 2022), showing sensitivity to macro headwinds and stock market correlations. �
• Technical analysts caution that failure to hold support around $84K–$80K could trigger deeper corrections toward lower levels like $74K or even $50K in extreme risk scenarios. �
Reuters
MEXC +1
Short-Term Range:
BTC may continue trading within a tight range, balancing between support near $84K–$88K and resistance around $92K–$96K before a breakout or breakdown sets overall direction. �
FXStreet
Summary:
👉 Overall, Bitcoin shows mixed signals — neutral to slightly bullish short-term, with significant upside potential if key levels are cleared, but also downside risk if support fails. Longer-term institutional and macro catalysts could drive strong gains through 2026. �
CoinGecko +1
⚠️ *Cryptocurrency markets are volatile — this is not financial advice. Always research further before making investment decisions.*
#BTC90kChristmas #BTCVSGOLD #USJobsData #WriteToEarnUpgrade #BinanceAlphaAlert
{spot}(BTCUSDT)
📊 Bitcoin (BTC) Latest Market Analysis – January 2026
$BTC Current Trend:
Bitcoin has been trading in a sideways to slightly bullish range around $85,000–$95,000, with recent consolidation near key resistance around the mid-$90K zone. �
FXStreet
Bullish Signals:
• Analysts see potential for upside if BTC breaks above immediate resistance — technically a move above $94K+ could open the door toward $100K+ and even higher targets later in 2026. �
• Some macro models suggest a strong recovery phase with higher probability of price gains in 2026, based on historical valuation metrics. �
• Longer-term forecasts by various price models and institutions show targets ranging from ~$150K to ~$250K+ by year-end 2026 on institutional adoption and supply constraints. �
MEXC
Cointelegraph
CoinGecko +1
Bearish / Risk Factors:
• Bitcoin experienced annual weakness in 2025 (its first yearly loss since 2022), showing sensitivity to macro headwinds and stock market correlations. �
• Technical analysts caution that failure to hold support around $84K–$80K could trigger deeper corrections toward lower levels like $74K or even $50K in extreme risk scenarios. �
Reuters
MEXC +1
Short-Term Range:
BTC may continue trading within a tight range, balancing between support near $84K–$88K and resistance around $92K–$96K before a breakout or breakdown sets overall direction. �
FXStreet
Summary:
👉 Overall, Bitcoin shows mixed signals — neutral to slightly bullish short-term, with significant upside potential if key levels are cleared, but also downside risk if support fails. Longer-term institutional and macro catalysts could drive strong gains through 2026. �
CoinGecko +1
⚠️ *Cryptocurrency markets are volatile — this is not financial advice. Always research further before making investment decisions.*
#BTC90kChristmas #BTCVSGOLD #USJobsData #WriteToEarnUpgrade #BinanceAlphaAlert
$BTC Current Trend:
Bitcoin has been trading in a sideways to slightly bullish range around $85,000–$95,000, with recent consolidation near key resistance around the mid-$90K zone. �
FXStreet
Bullish Signals:
• Analysts see potential for upside if BTC breaks above immediate resistance — technically a move above $94K+ could open the door toward $100K+ and even higher targets later in 2026. �
• Some macro models suggest a strong recovery phase with higher probability of price gains in 2026, based on historical valuation metrics. �
• Longer-term forecasts by various price models and institutions show targets ranging from ~$150K to ~$250K+ by year-end 2026 on institutional adoption and supply constraints. �
MEXC
Cointelegraph
CoinGecko +1
Bearish / Risk Factors:
• Bitcoin experienced annual weakness in 2025 (its first yearly loss since 2022), showing sensitivity to macro headwinds and stock market correlations. �
• Technical analysts caution that failure to hold support around $84K–$80K could trigger deeper corrections toward lower levels like $74K or even $50K in extreme risk scenarios. �
Reuters
MEXC +1
Short-Term Range:
BTC may continue trading within a tight range, balancing between support near $84K–$88K and resistance around $92K–$96K before a breakout or breakdown sets overall direction. �
FXStreet
Summary:
👉 Overall, Bitcoin shows mixed signals — neutral to slightly bullish short-term, with significant upside potential if key levels are cleared, but also downside risk if support fails. Longer-term institutional and macro catalysts could drive strong gains through 2026. �
CoinGecko +1
⚠️ *Cryptocurrency markets are volatile — this is not financial advice. Always research further before making investment decisions.*
#BTC90kChristmas #BTCVSGOLD #USJobsData #WriteToEarnUpgrade #BinanceAlphaAlert
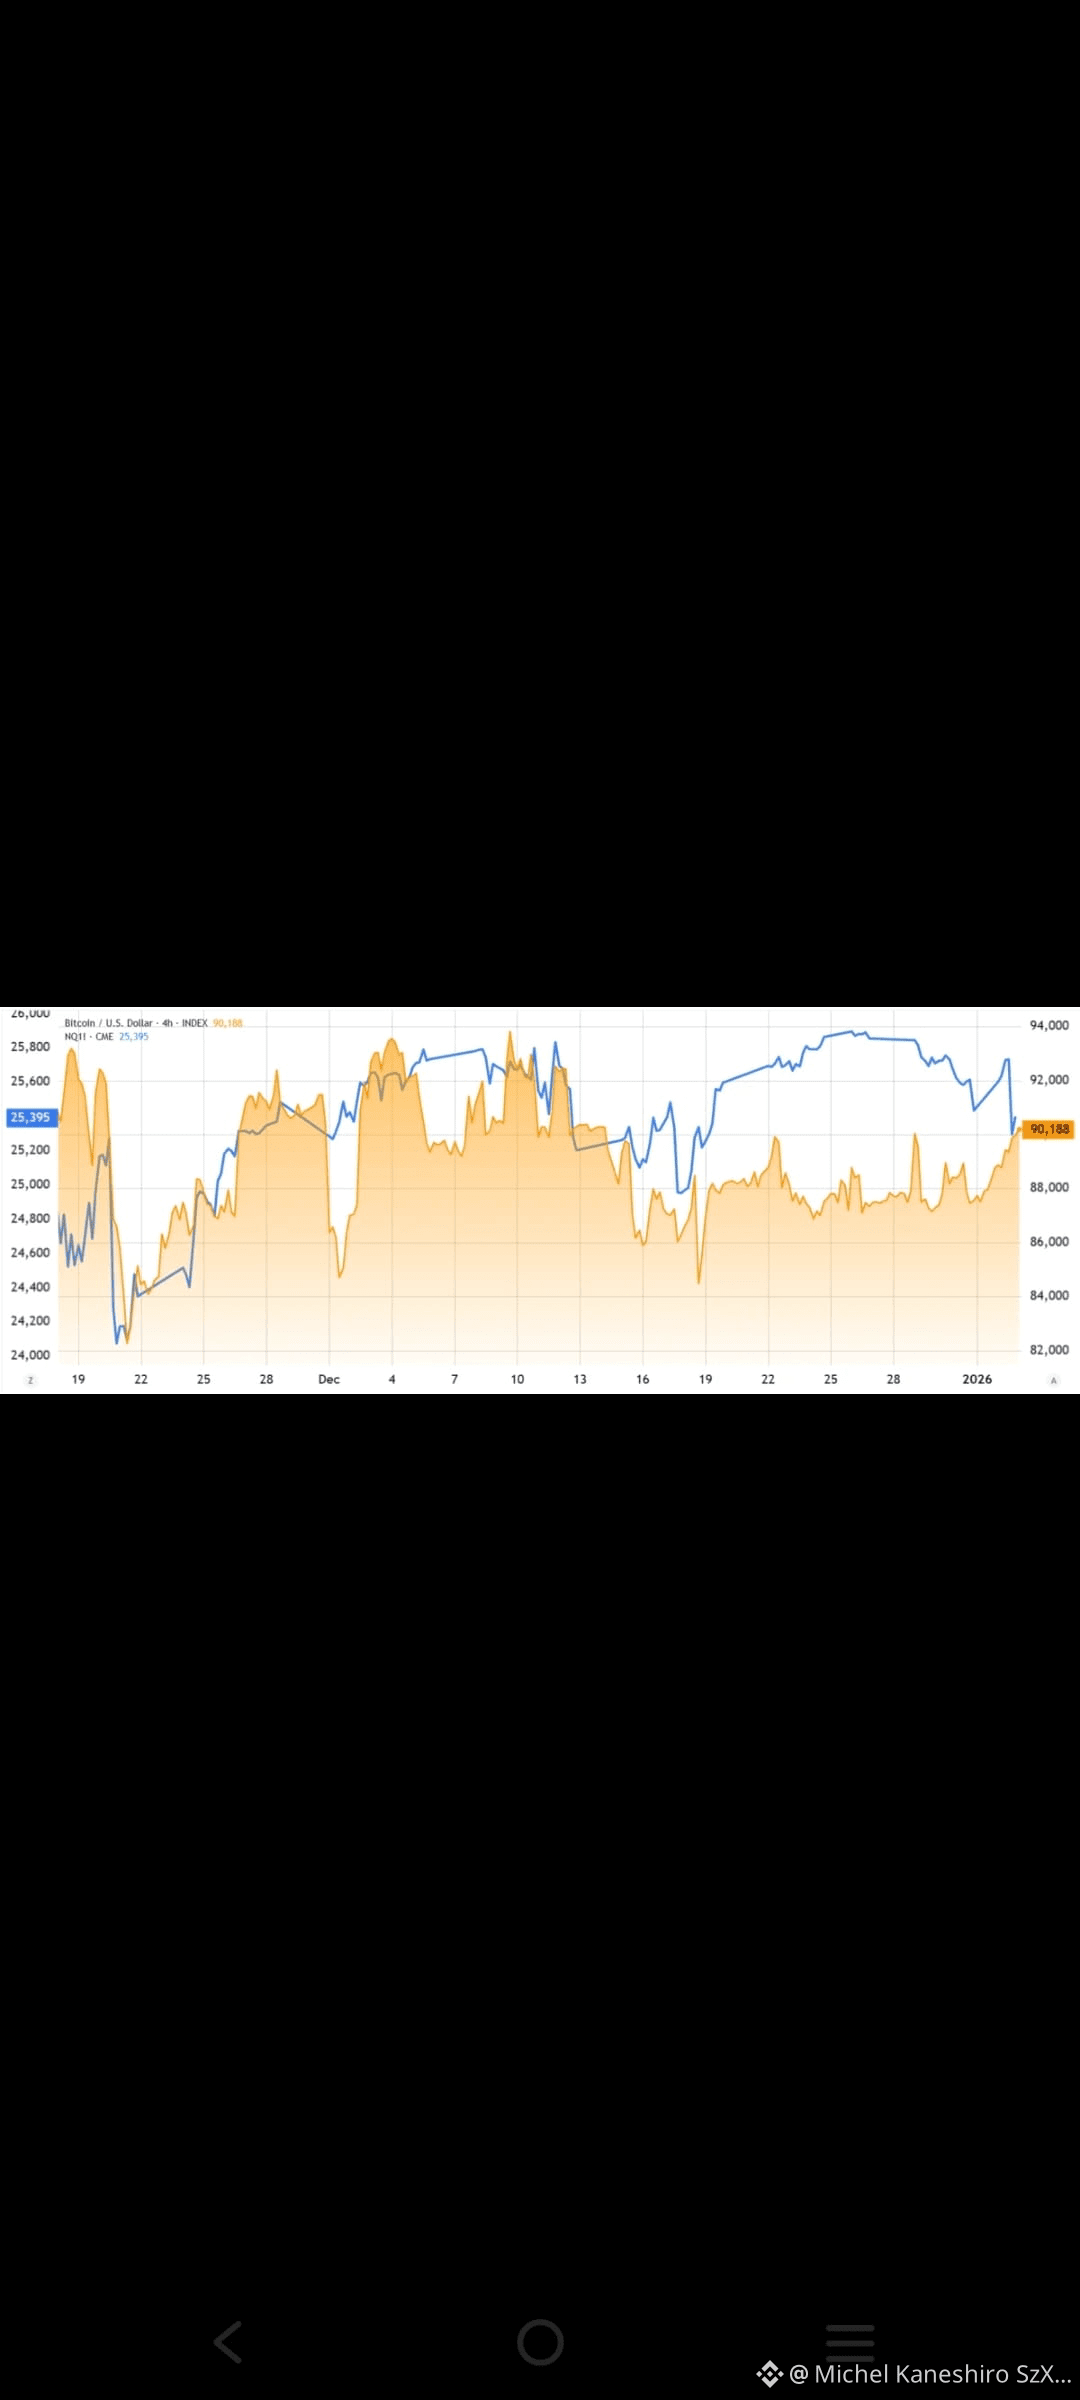
5
21
Anmelden und weiter Inhalte entdecken
Krypto-Nutzer weltweit auf Binance Square kennenlernen
⚡️ Bleib in Sachen Krypto stets am Puls.
💬 Die weltgrößte Kryptobörse vertraut darauf.
👍 Erhalte verlässliche Einblicke von verifizierten Creators.
E-Mail-Adresse/Telefonnummer
Trendthemen
EtherGains70.9%InQ3
28,051 Aufrufe
393 Kommentare
Eines der besten dritten Quartale der Geschichte 💰
September beendete gestern den Handel – und damit auch das Quartal. Im Quartal ist BTC um 42% gestiegen – das zweitbeste Q3, das es je gab. ETH hatte insgesamt ein Rekord-Q3 und stieg um 70%.
Schaut man sich den Chart an, sieht es weiterhin gut aus: Wir halten die Unterstützung, testen sie aber immer öfter. Außerdem lässt die ETF-Dynamik nach – die Zuflüsse gehen allmählich zurück, und gestern gab es zum ersten Mal seit langer Zeit Abflüsse.
Ja, historisch gesehen war Oktober ein guter Monat für Krypto – nicht ohne Grund nennt man ihn „Uptober“. Aber es ist auch einer der volatilsten Monate. Letztes Jahr konnten wir zum Beispiel ein neues Allzeithoch (ATH) erreichen und gleichzeitig einen Flash-Crash erleben.
🚀 Hochpräzise Trades.
$BTC
$ETH
$SOL
#EtherGains70.9%InQ3 #DollarIndexHitsHighestSinceMay2025 #CFTCSubmitsTwoEventContractRulesToWhiteHouse #MicronBeatsEarningsLiftsGuidance
Knowledge is Power
·0 Likes
·84 Aufrufe
TreasuryLetsStatesFileStablecoinCertificationsEarly
302 Aufrufe
16 Kommentare
US10YearYieldNears5.3%
67,651 Aufrufe
605 Kommentare