

AYAN CHINTAPATRA
11 Beiträge

AYAN CHINTAPATRA
Melden
Nutzer blockieren
Trade eröffnen
Regelmäßiger Trader
2.1 Jahre
4 Following
26 Follower
27 Like gegeben
Beiträge
Portfolio
·
--
Übersetzung ansehen
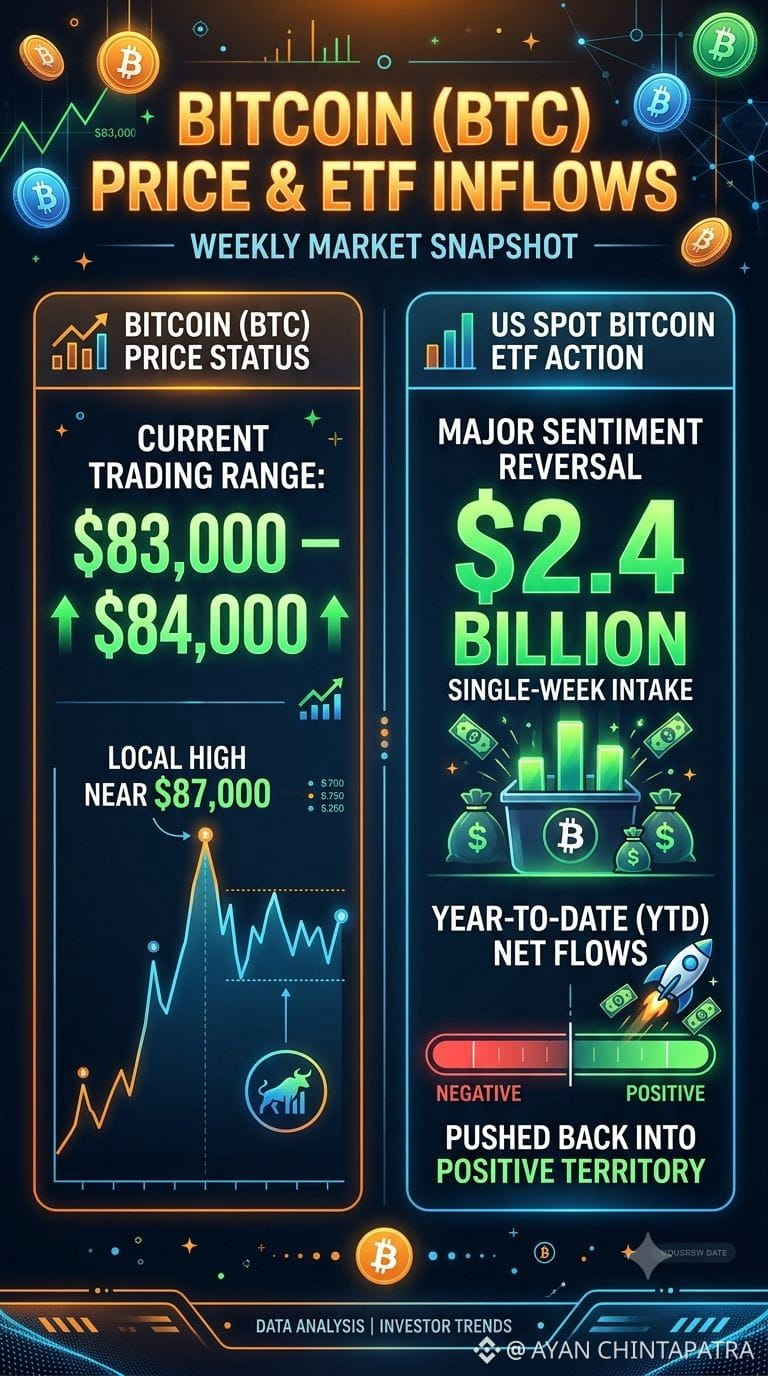
Bitcoin (#BTC ) Price & ETF Inflows
Market Status: Bitcoin is trading in the $83,000–$84,000 range after touching a local high near $87,000.
ETF Action: US spot Bitcoin ETFs experienced a major reversal in sentiment with a single-week intake of $2.4 billion, pushing year-to-date net flows back into positive territory.
Market Status: Bitcoin is trading in the $83,000–$84,000 range after touching a local high near $87,000.
ETF Action: US spot Bitcoin ETFs experienced a major reversal in sentiment with a single-week intake of $2.4 billion, pushing year-to-date net flows back into positive territory.
1
50
·
--
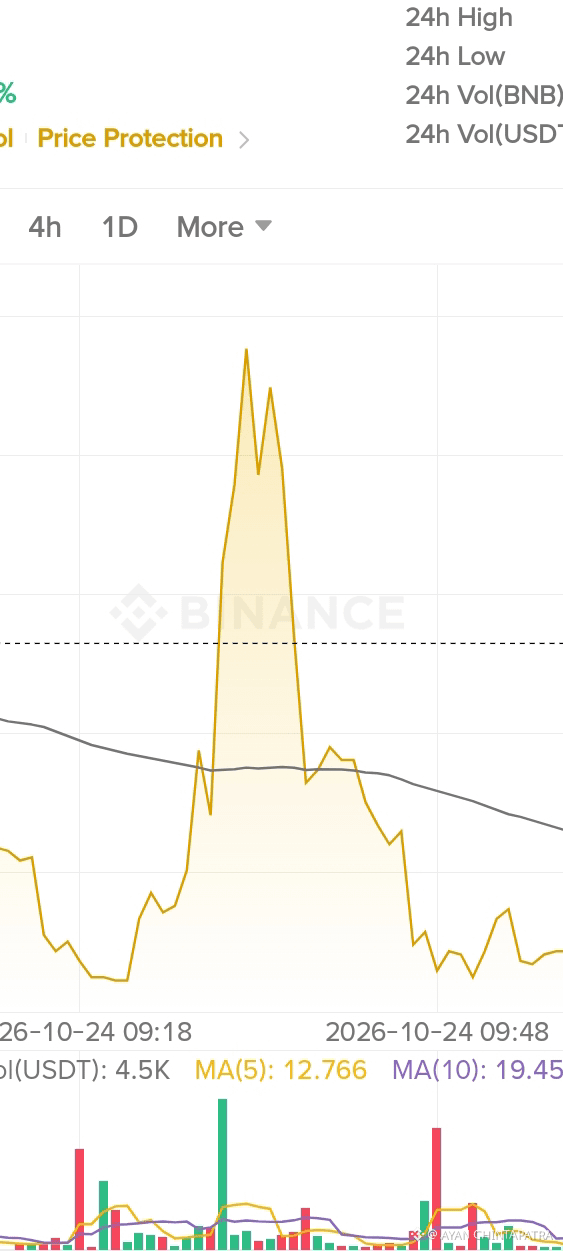
#SUI🔥 I Price Action:
Derzeit wird eine wichtige strukturelle Unterstützung in der Nähe kritischer Zonen (Bereich um 0,75 $) getestet. Volumenprofile deuten auf Akkumulationsphasen hin und schaffen die Voraussetzungen für mögliche Umkehr-Setups für Swingtrader.
#SUI🔥 I Price Action:
Derzeit wird eine wichtige strukturelle Unterstützung in der Nähe kritischer Zonen (Bereich um 0,75 $) getestet. Volumenprofile deuten auf Akkumulationsphasen hin und schaffen die Voraussetzungen für mögliche Umkehr-Setups für Swingtrader.
Derzeit wird eine wichtige strukturelle Unterstützung in der Nähe kritischer Zonen (Bereich um 0,75 $) getestet. Volumenprofile deuten auf Akkumulationsphasen hin und schaffen die Voraussetzungen für mögliche Umkehr-Setups für Swingtrader.
1
80
·
--
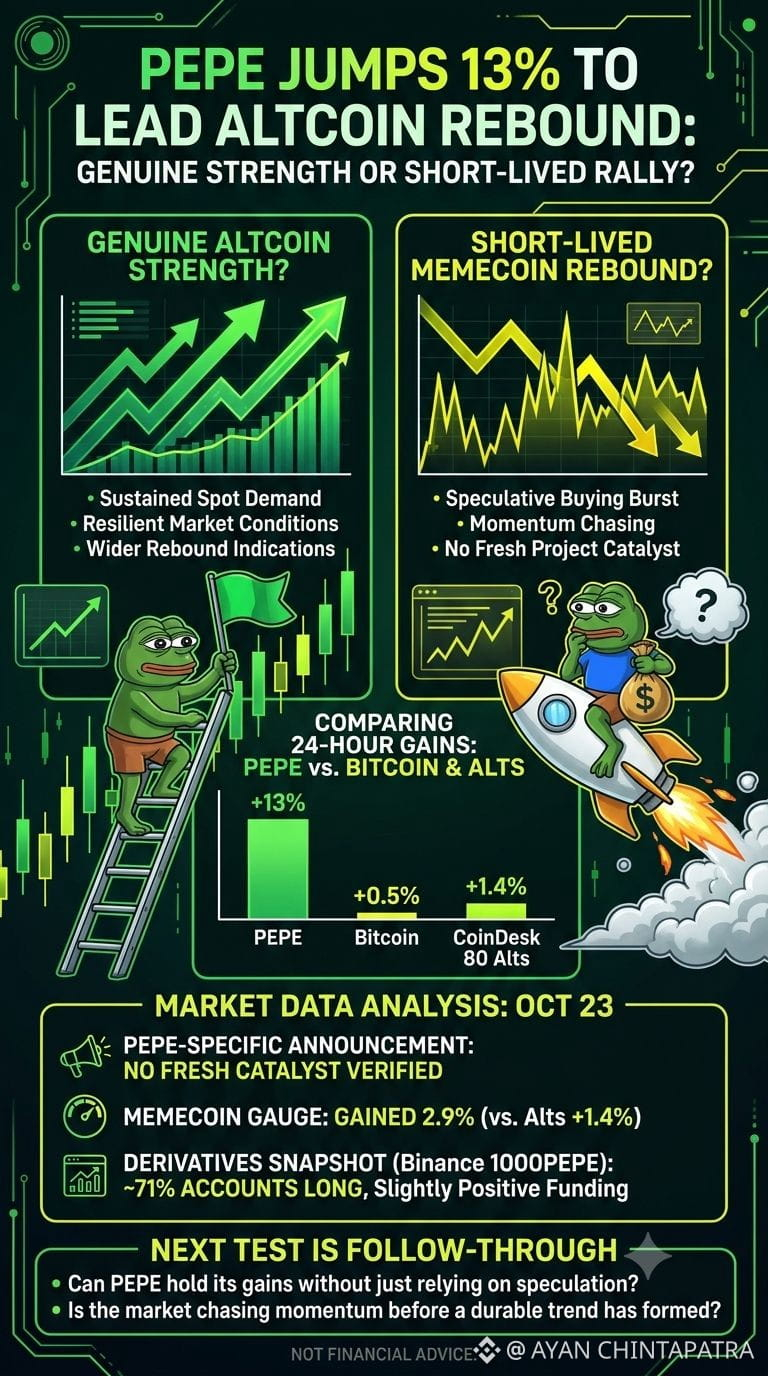
🚨 PEPE legte innerhalb von 24 Stunden um rund 13 % zu, während Bitcoin gerade einmal 0,5 % gewann. Ist das echte Stärke bei Altcoins – oder nur eine kurzlebige Erholung eines Meme-Coins?
#pepejumps14%toleadaltcoinrebound
Der Gesamtmarkt liefert einen gewissen Kontext.
Am 23. Oktober stieg der CoinDesk-80-Altcoin-Index um 1,4 %, während der Memecoin-Index um 2,9 % zulegte.
PEPE führte die Bewegung an.
Ich konnte jedoch keine neue PEPE-spezifische Ankündigung finden, die die Rally erklärt. Die Hinweise sprechen eher für eine breitere Erholung als für einen bestätigten projektspezifischen Auslöser.
Ein weiteres Detail sollte man im Auge behalten.
Eine Momentaufnahme des Derivatemarkts vom 23. Oktober zeigte, dass rund 71 % der Binance-Konten mit 1000PEPE-Futures Long-Positionen hielten; die Funding-Rate war leicht positiv.
Das beweist nicht, dass der Markt gefährlich stark fremdfinanziert ist, und die Anzahl der Konten entspricht nicht dem eingesetzten Kapital. Es zeigt jedoch, dass die bullischen Positionen bereits deutlich in eine Richtung tendierten.
Der nächste Test ist, ob die Entwicklung anhält: anhaltende Nachfrage am Spotmarkt, widerstandsfähige Marktbedingungen und die Frage, ob PEPE seine Gewinne halten kann, ohne auf einen weiteren Schub spekulativer Käufe angewiesen zu sein.
Führt PEPE eine breitere Erholung an – oder jagt der Markt einer Dynamik hinterher, bevor sich ein nachhaltiger Trend herausgebildet hat?
Keine Finanzberatung.
#PEPE #BTC
1
61
·
--
Übersetzung ansehen
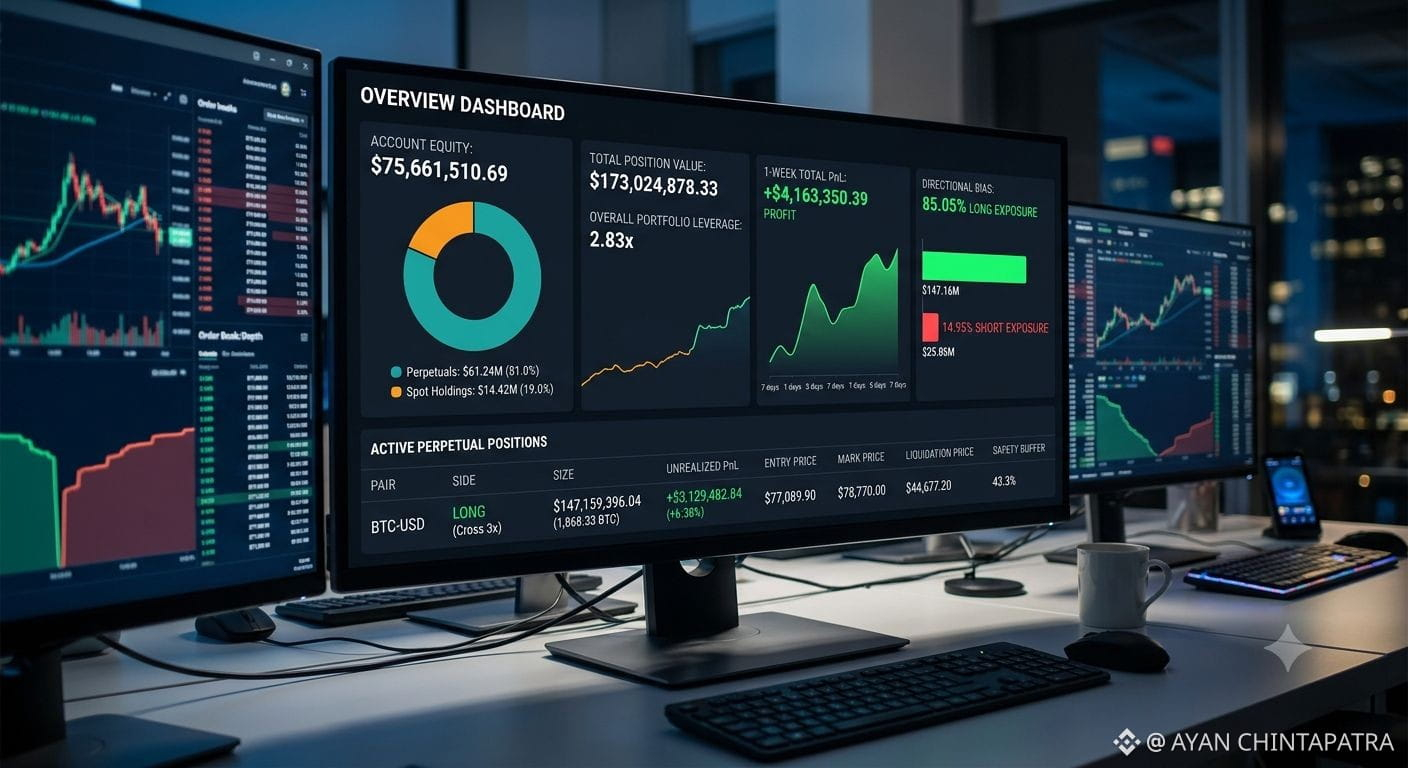
#XRPLeadsCryptoPullbackDropsNearly7% Account Equity: $75,661,510.69 (split between $61.24M in Perpetuals and $14.42M in Spot holdings).
Total Position Value: $173,024,878.33 using 2.83x overall portfolio leverage.
1-Week Total PnL: +$4,163,350.39 profit over a 7-day period, shown via a green area chart.
Directional Bias: Heavily tilted long (85.05% Long Exposure vs 14.95% Short Exposure), amounting to $147.16M long value vs $25.86M short value.
Active Positions Breakdown
The lower table details active open perpetual futures positions:
Primary Position: BTC Long (Cross 3x)
Position Size: $147,159,396.04 (~1,868.33 BTC)
Unrealized PnL: +$3,129,482.84 (+6.38%)
Entry Average Price: $77,089.90
Mark Price: $78,770.00
Liquidation Price: $44,677.20 (providing a safety buffer of ~43% against downside risk)
Strategy Analysis & Takeaways
Controlled Leverage: Despite carrying a massive $173M+ position value, the trader maintains a conservative 2.83x leverage, keeping the liquidation threshold well below current spot prices.
Risk Management: Holding a massive position at $77k BTC entry indicates strong directional confidence during market continuation phases, backed by substantial spot equity acting as margin collateral.
1
93
·
--
Übersetzung ansehen
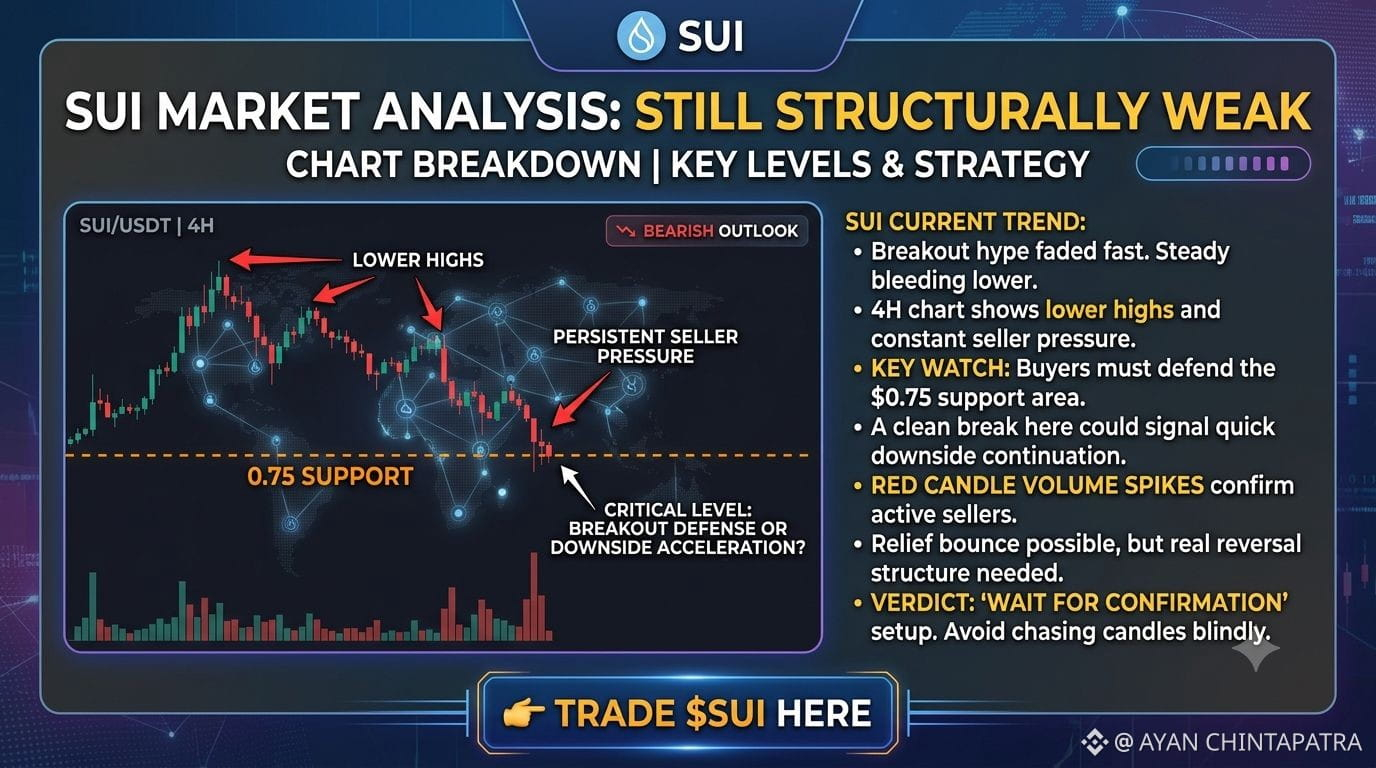
$SUI still looks structurally weak on the chart.
The initial breakout hype faded rapidly, and the price has been steadily bleeding lower—characterized by a series of lower highs and persistent seller pressure on the 4H timeframe.
Right now, the critical level to watch is the 0.75 area. If buyers fail to defend this support and it breaks cleanly, downside continuation could accelerate quickly. This bearish sentiment is further confirmed by volume spikes on red candles, indicating that sellers remain firmly in control.
While a relief bounce is entirely possible after a selloff of this magnitude, the chart needs to print a definitive reversal structure before flipping structurally bullish again. For now, the smartest play is patience—this is a "wait for confirmation" setup rather than one for chasing candles blindly.
👉 Trade $SUI here
1
34
·
--
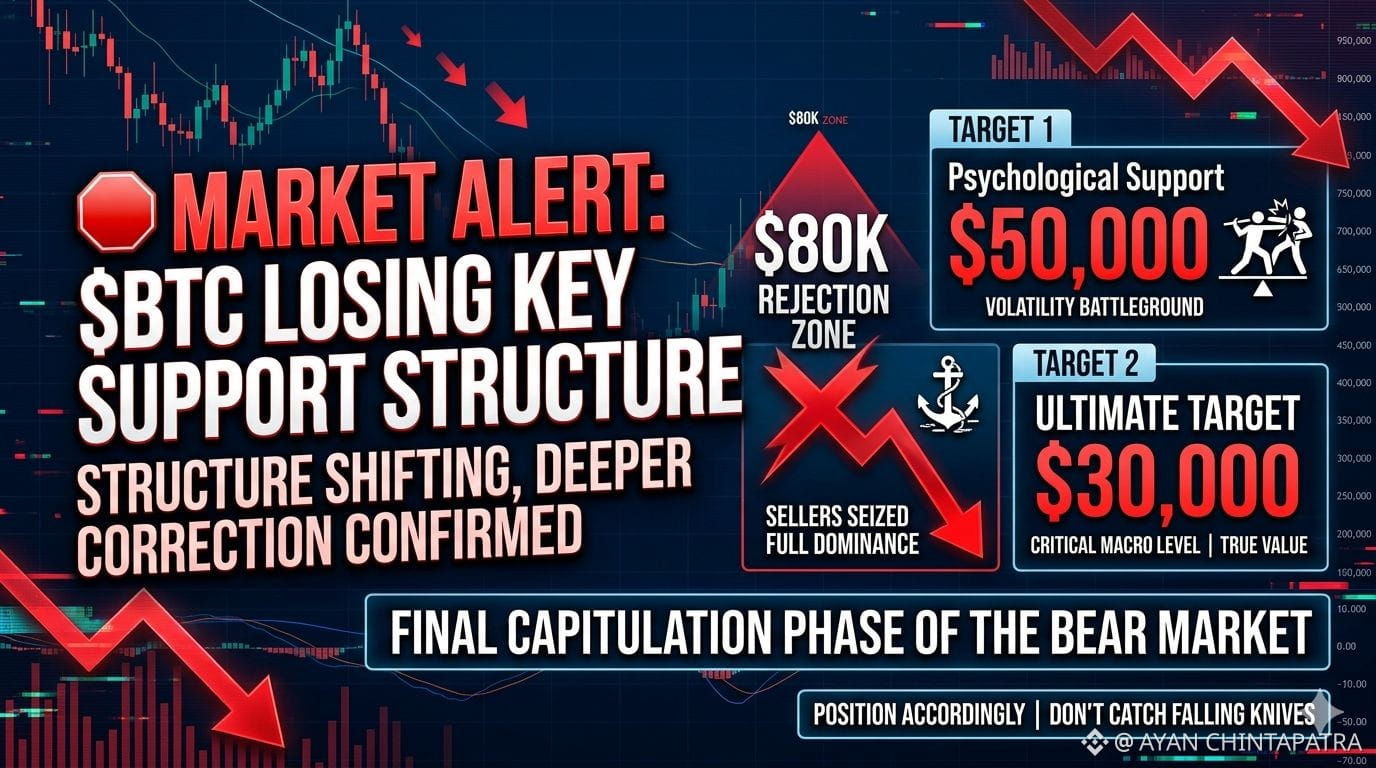
📉 Marktalarm: $BTC BTC verliert Schlüsselunterstützungsstruktur
Es passiert. Die Struktur verändert sich, und die technischen Indikatoren deuten auf eine viel tiefere Korrektur hin.
Nach einer heftigen Ablehnung nahe der Widerstandszone von $80K haben die Verkäufer die volle Kontrolle über das Orderbuch übernommen. Der Momentum hat sich komplett zugunsten der Bären gedreht.
🔍 Die technischen Ziele:
Psychologische Unterstützung: $50.000 — Erwarten Sie massive Volatilität und ein vorübergehendes Schlachtfeld hier, während der Einzelhandel versucht, die runde Zahl zu verteidigen.
Das ultimative Ziel: $30.000 — Die kritische Makroebene, wo der wahre Wert liegt.
Das große Bild: Wir treten offiziell in die finale, Kapitulationsphase dieses Bärenmarktes ein. Die schwachen Hände werden herausgespült.
Positionieren Sie sich entsprechend. Bleiben Sie diszipliniert und fangen Sie keine fallenden Messer. 📉
✍️ Warum dieses Format härter trifft:
Fette Preisniveaus: Hebt die entscheidenden Zahlen hervor ($80K, $50K, $30K), sodass die Leser die makro Ziele sofort aufnehmen.
Sauberes Layout: Das Aufteilen der These in klare Abschnitte (Die Ablehnung, Die Ziele, Das große Bild) verleiht ihr die Autorität einer institutionellen Forschungsnotiz.
Strategische Emojis: Die Abwärtstrend-Emojis umhüllen das Stück mit einem kohärenten bärischen Sentiment, ohne überladen zu wirken.
1
252
·
--
Übersetzung ansehen
🛑 Stop Funding a Whale's Next Mansion!
Everyone telling you to "buy the dip" right now is setting you up to be exit liquidity. Don't fall for the trap. Look at the actual data:
The Big Players: 947 massive whales have locked in $1.44 BILLION in short positions.
The Reality: They are already up over $210 MILLION in pure, realized profit.
The Retail Trap: Meanwhile, a tiny group of 194 stubborn buyers are sitting on an $84 million loss, praying for a miracle that isn't coming.
The smart money isn’t waiting around. The long/short ratio has utterly collapsed to a brutal 24.97%.
Bottom line: Personally, I am riding with the whales and aggressively adding to my short positions before the floor completely drops out.
Don't be the liquidity they exit on. Tick-tock. ⏳
✍️ Why this works better:
Bullet Points: Breaking down the numbers makes the raw data hit much harder and faster for someone scrolling.
Visual Structure: Bolded text highlights the stark contrast between the winning whales and the losing buyers.
The Hook: Keeping your strong opening ensures people don't just scroll past.
Good luck with the post—let's see if the market plays out exactly how you're anticipating!
1
78
·
--
👌🏼Eine tiefgehende Analyse des "Vitalik-Effekts": Fokussierung darauf, wie ein einzelner Influencer die Märkte bewegen kann.
Eine Analyse von Memecoins als führenden Indikator: Diskussion darüber, ob dieser Anstieg wirklich ein breiteres Altcoin-Rallye signalisiert.#USJobsData
Ein Vergleich der besten Performer: Aufschlüsselung, warum #BTCVSGOLD PEPE, BONK, DOGE und PENGU die Spitze anführen.
Eine warnende Geschichte: Hervorhebung der Risiken und der Volatilität trotz der Gewinne.
Ein allgemeiner Marktüberblick: Zusammenfassung des Ereignisses und seiner potenziellen Auswirkungen.
Lass mich wissen, welchen Blickwinkel du bevorzugst, und ich lege los!
👌🏼
Eine tiefgehende Analyse des "Vitalik-Effekts": Fokussierung darauf, wie ein einzelner Influencer die Märkte bewegen kann.
Eine Analyse von Memecoins als führenden Indikator: Diskussion darüber, ob dieser Anstieg wirklich ein breiteres Altcoin-Rallye signalisiert.#USJobsData
Ein Vergleich der besten Performer: Aufschlüsselung, warum #BTCVSGOLD PEPE, BONK, DOGE und PENGU die Spitze anführen.
Eine warnende Geschichte: Hervorhebung der Risiken und der Volatilität trotz der Gewinne.
Ein allgemeiner Marktüberblick: Zusammenfassung des Ereignisses und seiner potenziellen Auswirkungen.
Lass mich wissen, welchen Blickwinkel du bevorzugst, und ich lege los!
9
208
Anmelden und weiter Inhalte entdecken
Krypto-Nutzer weltweit auf Binance Square kennenlernen
⚡️ Bleib in Sachen Krypto stets am Puls.
💬 Die weltgrößte Kryptobörse vertraut darauf.
👍 Erhalte verlässliche Einblicke von verifizierten Creators.
E-Mail-Adresse/Telefonnummer