

MrDollarBiswa
8 Beiträge

MrDollarBiswa
Melden
Nutzer blockieren
7 Following
1 Follower
0 Like gegeben
Beiträge
Übersetzung ansehen
🚀 PEPE COIN IS BACK IN THE SPOTLIGHT! 🐸
$PEPE The PEPE cryptocurrency market is attracting renewed attention as whale activity, rising trading volume, and institutional interest create fresh excitement among investors.
🔥 LATEST PEPE MARKET UPDATES
Whale Accumulation: Wallets reportedly linked to Justin Sun hold approximately $51 million worth of PEPE, representing around 2.8% of the total supply. However, this wallet attribution remains unconfirmed.
ETF Developments: Canary Capital has amended its proposed PEPE ETF filing. This could represent a major step toward institutional exposure, although SEC approval has not yet been granted.
Trading Volume Surge: PEPE has experienced increased derivatives activity, with future volume reportedly reaching approximately $587.9 million.
Market Momentum: PEPE recently recovered above the $0.000005 level during its October rally, attracting renewed attention from traders.
📊 MARKET SNAPSHOT — OCTOBER 30
Current price: Approximately $0.000004866
Market capitalization: Approximately $2.04 billion
24-hour price change: +0.8%
7-day performance: +9.1%
24-hour trading volume: Approximately $787 million
📈 WHAT'S NEXT FOR PEPE?
The $0.000005 level is an important psychological price area to watch. A sustained move above this level could strengthen bullish sentiment, while rejection may lead to another correction.
Whale movements, exchange inflows, Bitcoin's direction, and overall market sentiment will be important factors in determining PEPE's next move.
⚠️ IMPORTANT RISK FACTOR
PEPE remains a highly speculative meme coin. Large holders can influence price movements, and ETF developments do not guarantee approval or future gains.
🐸 FINAL THOUGHT
PEPE is once again capturing the crypto community's attention. Will the frog coin surprise the market with another major rally, or will sellers take control?
🔥 What is your PEPE target for November 2026?
Comment below!
#PEPE✈ #PEPECoin #CryptoNews #MemeCoin #Altcoins #Binance #CryptoMarket #WhaleActivity #Bullish #CryptoTrading
113
·
--
Bärisch
Übersetzung ansehen
🚨 BNB PRICE UPDATE: Binance Coin Drops Below $750!
$BNB BNB is facing fresh market pressure as its price slips below the important $750 level.
According to the Binance market data provided, on October 29, 2026, at 01:49 AM UTC, BNB was trading at approximately $747.91 USDT, following a decline below the psychological $750 support zone.
Despite the pullback, BNB is still showing a reported 0.28% increase over the past 24 hours, suggesting that the broader daily performance remains slightly positive.
📊 Key Market Highlights
Cryptocurrency: Binance Coin (BNB)
Reported Price: $747.91 USDT
Important Level: $750
24-Hour Change: +0.28%
Market Sentiment: Cautious
🔍 What Happens Next?
Traders are closely watching whether BNB can reclaim the $750 level. A successful recovery above this zone could strengthen bullish sentiment and potentially open the door for another upward move.
However, if selling pressure continues, BNB could face further downside and test lower support levels.
📈 Bullish or Bearish?
The next major move will depend on buying pressure, trading volume, and the broader cryptocurrency market.
The key question is simple: Can BNB reclaim $750, or are we about to see another correction?
⚠️ Always manage your risk and do your own research before making trading decisions.
#BNB #BinanceCoin #CryptoNews #BNBUSDT #Binance #CryptoMarket #Bitcoin #Altcoins #TradingUpdate $BNB

73
·
--
Bullisch
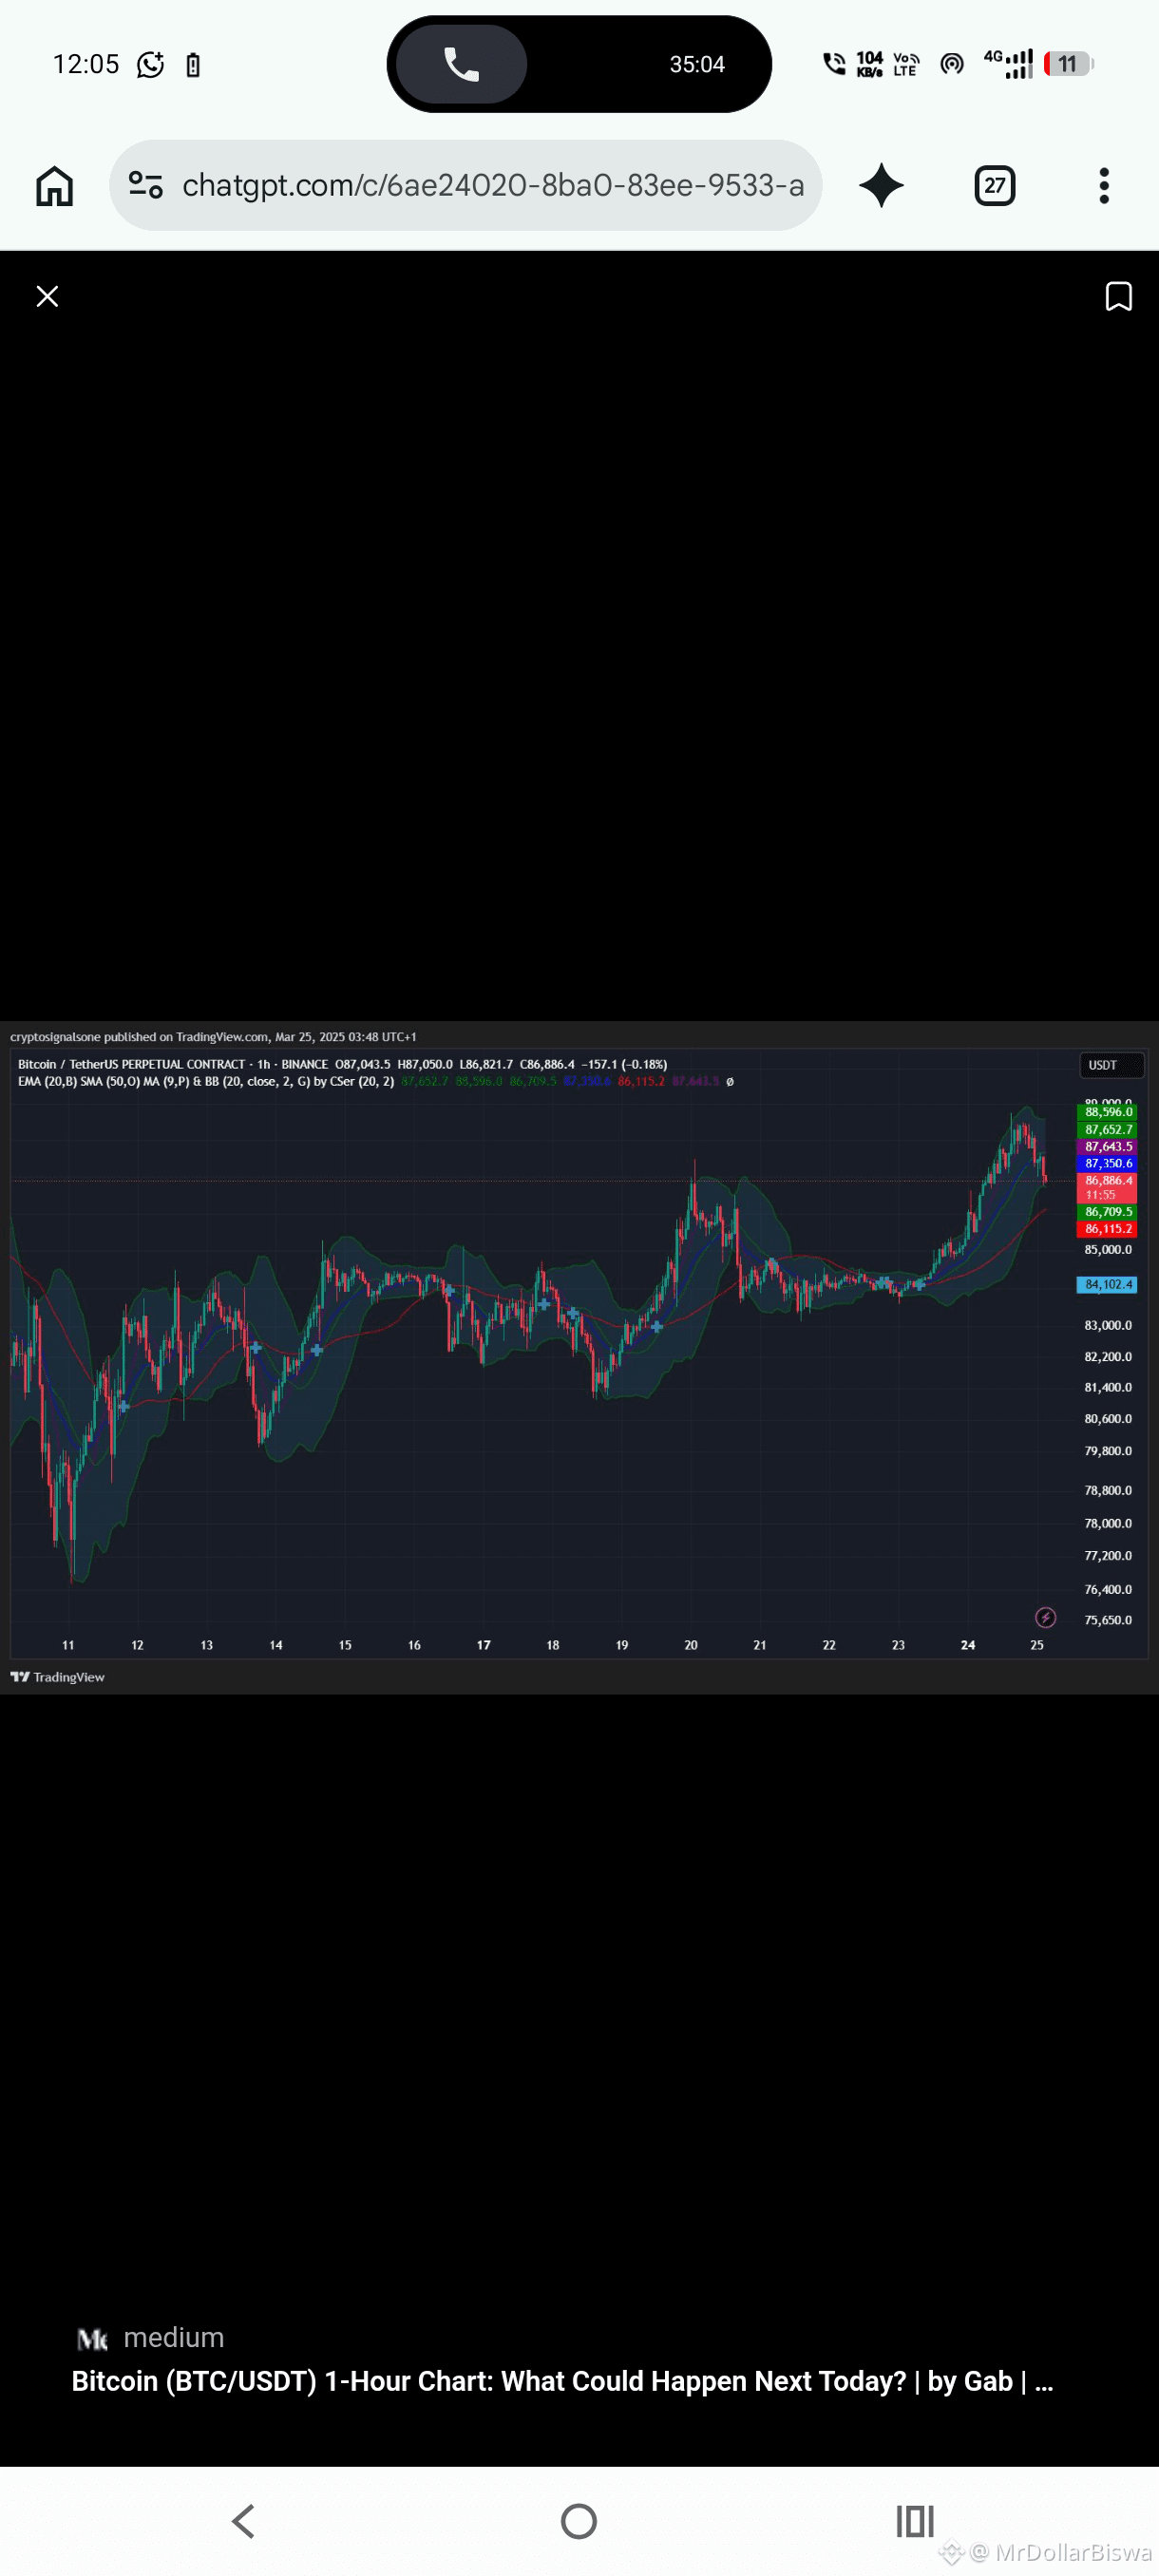
#BTC-Live-Chart und technische Analyse für BTC/USDT im 1-Stunden-Zeitrahmen.
BTC/USDT – Technische Analyse im 1-Stunden-Zeitrahmen
Live-Marktbeobachtung
1-Stunden-Zeitrahmen
Bei BTC/USDT eignet sich der 1-Stunden-Chart dazu, kurzfristige Trends, Ausbruchsmöglichkeiten, Unterstützungs- und Widerstandsniveaus sowie mögliche Umkehrsignale zu erkennen.
Live-Chart: Hier kannst du den interaktiven Bitcoin-Chart öffnen:

BTC/USDT – TradingView
Live-BTC-Chart im 1-Stunden-Zeitrahmen öffnen
Wähle im Menü für den Chart-Zeitrahmen die Option 1H aus.
Indikatorenanalyse im 1-Stunden-Zeitrahmen
Der jüngste strukturierte technische Überblick, den ich abrufen konnte, stammt vom 28. Oktober 2026 um 12:07 UTC und ist daher kein verifizierter Live-Kerzenstand.
Indikator
Zuletzt gemeldeter Wert
Signal
EMA 20
$80,981.86
Bullisch
EMA 50
$80,664.95
Bullisch
EMA 200
$81,058.10
Widerstand
RSI (14)
62.7
Positives Momentum
MACD
Positives Histogramm
Bullisch
ADX
38.4
Starker Trend
Volumen
Unter dem Durchschnitt
Vorsicht
Quelle:

MakeEA+1
Wichtige Handelsniveaus
Basierend auf diesem historischen Indikatorenüberblick:
Unterstützung: $80,858 und $80,400
Widerstand: $81,565 und $81,823
Bullisches Szenario: Ein bestätigter Ausbruch über $81,823 könnte weitere Kursgewinne begünstigen.
Bärisches Szenario: Ein Unterschreiten von $80,858 könnte die kurzfristige Struktur schwächen.
Vor dem Handel müssen diese Niveaus anhand des aktuellen Charts aktualisiert werden.
Meine Markteinschätzung
Kurzfristige Tendenz
Bullisch, aber mit Vorsicht
Der gemeldete RSI und MACD sprechen für Käufer, aber das unterdurchschnittliche Volumen und widersprüchliche Signale zur Marktstruktur bedeuten, dass ein Ausbruch noch nicht garantiert ist.
Meine Empfehlung: Warte vor dem Einstieg auf den bestätigten Schluss einer 1-Stunden-Kerze. Verwende immer einen Stop-Loss, besonders beim Handel mit Hebel.
Eine Frage: Soll ich auch ein BTC/USDT-Handelsszenario mit Einstiegskurs, Stop-Loss, Take-Profit 1, Take-Profit 2 und Take-Profit 3 für LONG und SHORT vorbereiten?
90
·
--
Bullisch
# 🚨 $BTC Bitcoin (BTC) LIVE-MARKTUPDATE – 28. OKTOBER 2026
## $BTC Kämpft darum, die Marke von 80.000 $ zu halten! Übernehmen die Bullen wieder die Kontrolle? 📈
Bitcoin ($BTC) zeigt wieder mehr Marktaktivität, während Händler die Unterstützungszone bei 80.000 $ genau beobachten. Nachdem sich BTC von seinem jüngsten Rückgang in Richtung 79.000 $ erholt hatte, stieg der Kurs wieder in Richtung 81.000 $ und lenkte die Aufmerksamkeit auf die nächsten wichtigen Widerstandsniveaus.
### 📊 Aktuelle BTC-Marktlage
* **BTC-Kurs:** etwa 80.600 $
* **24-Stunden-Hoch:** etwa 81.773 $
* **24-Stunden-Tief:** etwa 80.425 $
* **Marktrichtung:** Konsolidierung mit kurzfristiger Unsicherheit
* **Wichtige Unterstützung:** 80.000 $
* **Wichtiger Widerstand:** 82.500 $
*Die Preise sind ungefähre Momentaufnahmen des Marktes und können sich schnell ändern.*
### 🐂 Bullishes Szenario
Wenn Bitcoin die Marke von 82.500 $ erfolgreich überwindet und ein starkes Kaufvolumen beibehält, könnte sich die Aufwärtsdynamik verstärken.
Mögliche Kursziele auf der Oberseite:
* 83.500 $
* 85.000 $
* 88.000 $
### 🐻 Bearishes Szenario
Sollte BTC die Unterstützung bei 80.000 $ verlieren, könnte der Verkaufsdruck zunehmen.
Mögliche Kursziele auf der Unterseite:
* 79.000 $
* 77.500 $
* 75.000 $
### 🌍 Was bewegt den Markt?
Anleger beobachten die Zinsentscheidung der US-Notenbank Federal Reserve und deren mögliche Auswirkungen auf die globalen Finanzmärkte. Auch die Stimmung institutioneller Anleger, das Handelsvolumen und die Liquidität werden für die nächste Kursbewegung von Bitcoin eine wichtige Rolle spielen.
### 🔥 Abschließende Gedanken
Bitcoin nähert sich einer wichtigen Entscheidungszone. Ein starker Ausbruch über den Widerstand könnte eine weitere Aufwärtsbewegung begünstigen, während ein Durchbruch unter die Unterstützung eine weitere Korrektur auslösen könnte.
Die nächsten Handelssitzungen könnten entscheidend für die kurzfristige Richtung von BTC sein.
**Behalte die Kursniveaus im Blick. Achte auf das Volumen. Vernachlässige niemals das Risikomanagement.**
🚀 Bist du bei Bitcoin BULLISH oder BEARISH?
#Bitcoin #BTC #KryptoNews #BitcoinAnalyse #Kryptomarkt #BTCUSDT #TradingSignals
# 🚨 $BTC Bitcoin (BTC) LIVE-MARKTUPDATE – 28. OKTOBER 2026
## $BTC Kämpft darum, die Marke von 80.000 $ zu halten! Übernehmen die Bullen wieder die Kontrolle? 📈
Bitcoin ($BTC ) zeigt wieder mehr Marktaktivität, während Händler die Unterstützungszone bei 80.000 $ genau beobachten. Nachdem sich BTC von seinem jüngsten Rückgang in Richtung 79.000 $ erholt hatte, stieg der Kurs wieder in Richtung 81.000 $ und lenkte die Aufmerksamkeit auf die nächsten wichtigen Widerstandsniveaus.
### 📊 Aktuelle BTC-Marktlage
* **BTC-Kurs:** etwa 80.600 $
* **24-Stunden-Hoch:** etwa 81.773 $
* **24-Stunden-Tief:** etwa 80.425 $
* **Marktrichtung:** Konsolidierung mit kurzfristiger Unsicherheit
* **Wichtige Unterstützung:** 80.000 $
* **Wichtiger Widerstand:** 82.500 $
*Die Preise sind ungefähre Momentaufnahmen des Marktes und können sich schnell ändern.*
### 🐂 Bullishes Szenario
Wenn Bitcoin die Marke von 82.500 $ erfolgreich überwindet und ein starkes Kaufvolumen beibehält, könnte sich die Aufwärtsdynamik verstärken.
Mögliche Kursziele auf der Oberseite:
* 83.500 $
* 85.000 $
* 88.000 $
### 🐻 Bearishes Szenario
Sollte BTC die Unterstützung bei 80.000 $ verlieren, könnte der Verkaufsdruck zunehmen.
Mögliche Kursziele auf der Unterseite:
* 79.000 $
* 77.500 $
* 75.000 $
### 🌍 Was bewegt den Markt?
Anleger beobachten die Zinsentscheidung der US-Notenbank Federal Reserve und deren mögliche Auswirkungen auf die globalen Finanzmärkte. Auch die Stimmung institutioneller Anleger, das Handelsvolumen und die Liquidität werden für die nächste Kursbewegung von Bitcoin eine wichtige Rolle spielen.
### 🔥 Abschließende Gedanken
Bitcoin nähert sich einer wichtigen Entscheidungszone. Ein starker Ausbruch über den Widerstand könnte eine weitere Aufwärtsbewegung begünstigen, während ein Durchbruch unter die Unterstützung eine weitere Korrektur auslösen könnte.
Die nächsten Handelssitzungen könnten entscheidend für die kurzfristige Richtung von BTC sein.
**Behalte die Kursniveaus im Blick. Achte auf das Volumen. Vernachlässige niemals das Risikomanagement.**
🚀 Bist du bei Bitcoin BULLISH oder BEARISH?
#Bitcoin #BTC #KryptoNews #BitcoinAnalyse #Kryptomarkt #BTCUSDT #TradingSignals
89
Übersetzung ansehen
# 🐸 PEPE COIN: Is the Next Big Meme Coin Rally Coming?
$PEPE
The meme coin market continues to attract attention, and **PEPE ($PEPE)** remains one of the most recognizable names in the crypto community.
Built around internet meme culture, PEPE has developed a strong community and become a popular speculative asset among crypto traders.
### 🚀 Why PEPE Is Still on Traders' Watchlists
**1. Strong Community Power**
PEPE benefits from an active online community. In the meme coin market, community engagement and social media attention can play an important role in market momentum.
**2. Potential for a Market Recovery**
If Bitcoin and the broader crypto market regain bullish momentum, speculative assets like PEPE could attract renewed interest. However, a recovery is not guaranteed.
**3. Exchange Accessibility**
PEPE's availability across major crypto trading platforms helps traders access the token and contributes to its market visibility.
### 📊 What Could Drive the Next PEPE Rally?
* Increased trading volume and buying pressure.
* Renewed interest in meme coins.
* Positive overall crypto market sentiment.
* Strong community engagement.
* A sustained breakout above important resistance levels.
### ⚠️ Important Risks
PEPE is a highly volatile cryptocurrency. Sudden price movements, large-holder selling, declining market interest, and broader market corrections can lead to significant losses.
Investors should avoid buying simply because of social media hype.
### 🔥 Final Thoughts
PEPE remains an interesting meme coin to watch during the next crypto market cycle. If market sentiment improves and buying momentum returns, it could attract fresh attention from speculative traders.
The key is to watch volume, market structure, and Bitcoin's direction rather than blindly following hype.
**Keep PEPE on your watchlist. The next major move could bring opportunities, but risk management should always come first.**
#PEPE #PepeCoin #Crypto #MemeCoins #Altcoins #Bitcoin #CryptoTrading $PEPE
# 🐸 PEPE COIN: Is the Next Big Meme Coin Rally Coming?
$PEPE
The meme coin market continues to attract attention, and **PEPE ($PEPE )** remains one of the most recognizable names in the crypto community.
Built around internet meme culture, PEPE has developed a strong community and become a popular speculative asset among crypto traders.
### 🚀 Why PEPE Is Still on Traders' Watchlists
**1. Strong Community Power**
PEPE benefits from an active online community. In the meme coin market, community engagement and social media attention can play an important role in market momentum.
**2. Potential for a Market Recovery**
If Bitcoin and the broader crypto market regain bullish momentum, speculative assets like PEPE could attract renewed interest. However, a recovery is not guaranteed.
**3. Exchange Accessibility**
PEPE's availability across major crypto trading platforms helps traders access the token and contributes to its market visibility.
### 📊 What Could Drive the Next PEPE Rally?
* Increased trading volume and buying pressure.
* Renewed interest in meme coins.
* Positive overall crypto market sentiment.
* Strong community engagement.
* A sustained breakout above important resistance levels.
### ⚠️ Important Risks
PEPE is a highly volatile cryptocurrency. Sudden price movements, large-holder selling, declining market interest, and broader market corrections can lead to significant losses.
Investors should avoid buying simply because of social media hype.
### 🔥 Final Thoughts
PEPE remains an interesting meme coin to watch during the next crypto market cycle. If market sentiment improves and buying momentum returns, it could attract fresh attention from speculative traders.
The key is to watch volume, market structure, and Bitcoin's direction rather than blindly following hype.
**Keep PEPE on your watchlist. The next major move could bring opportunities, but risk management should always come first.**
#PEPE #PepeCoin #Crypto #MemeCoins #Altcoins #Bitcoin #CryptoTrading $PEPE
87
Artikel
Übersetzung ansehen
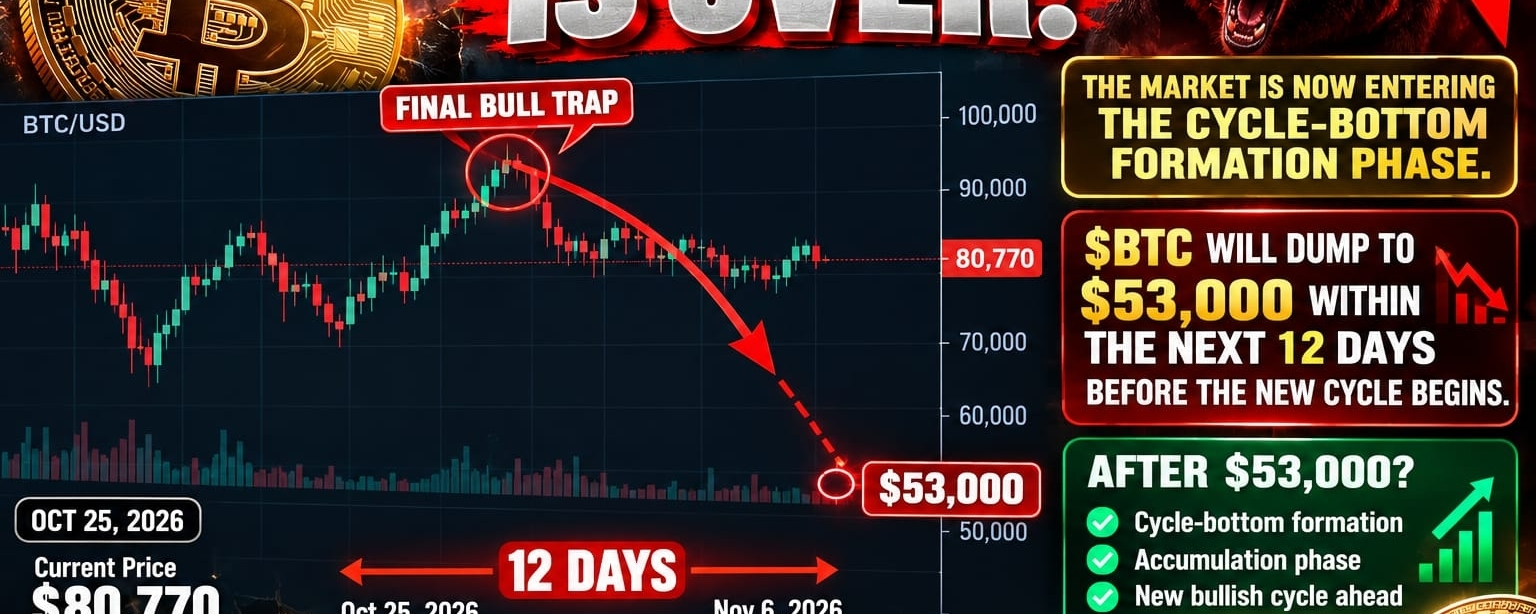
BITCOIN FINAL BULL TRAP IS OVER! IS $53,000 THE NEXT TARGET?
📉🔥$BTC | Bitcoin Market Analysis | October 2026
🚨 WARNING TO ALL BITCOIN INVESTORS AND CRYPTO TRADERS!
Bitcoin may be entering one of the most critical phases of its market cycle. After a period of bullish optimism, the possibility of a final bull trap is raising concerns about another major correction.
The big question is no longer just how high Bitcoin can go. It's whether the market needs one final shakeout before the next major accumulation phase begins.
📉 1. The Final Bull Trap Theory
A bull trap happens when Bitcoin moves higher, attracting buyers who believe a new rally has started, only for the price to reverse sharply.
If the latest recovery was a bull trap, several warning signals could emerge:
⚠️ Repeated rejection at major resistance levels.📊 Weak buying volume during price recoveries.💰 Large holders transferring BTC to exchanges.📉 Increasing selling pressure and liquidation risk.🔻 Bitcoin failing to maintain important support levels.
These signals would strengthen the bearish scenario, although none alone confirms that the cycle has peaked.
🎯 2. Bitcoin's Potential $53,000 Target
My bearish scenario: Bitcoin could fall toward $53,000 within the next 12 days, by approximately November 6, 2026.
This is an aggressive downside projection, not a guaranteed outcome.
A move toward $53,000 could become more plausible if Bitcoin breaks important support levels, selling volume increases, and leveraged long positions are liquidated.
However, if buyers defend support and Bitcoin reclaims resistance with strong volume, the bearish outlook could be invalidated.
🔥 3. Why a Major Bitcoin Correction Could Happen
Bitcoin markets often experience sharp corrections driven by several factors:
🔹 Liquidity pressure: Large liquidations can accelerate downward price movements.
🔹 Institutional activity: Changes in ETF flows and institutional demand can influence market sentiment.
🔹 Market psychology: Fear, panic selling, and excessive leverage can amplify volatility.
🔹 Macroeconomic uncertainty: Interest rates, global liquidity, and investor risk appetite can affect demand for Bitcoin.
🔹 Cycle-bottom formation: A prolonged correction may eventually create opportunities for long-term investors, but identifying the exact bottom is extremely difficult.
🚀 4. What Happens After $53,000?
If Bitcoin reaches the projected downside zone, traders should watch for evidence of genuine accumulation rather than assuming the bottom is automatically confirmed.
Potential recovery signals include:
✅ Strong buying volume near major support.
✅ A sustained reduction in selling pressure.
✅ Higher lows forming on the daily chart.
✅ Improving institutional demand.
✅ A confirmed breakout above resistance.
A new bullish cycle could follow a bottoming process, but the recovery might take weeks or months rather than happen immediately.
⚠️ 5. What Should Bitcoin Investors Do?
This is a market where risk management matters more than emotional decisions.
Avoid excessive leverage, watch critical support levels, and prepare for both bearish and bullish outcomes.
Remember: The biggest opportunities often appear during periods of extreme fear, but not every major decline marks the final bottom.
🚨 FINAL BITCOIN WARNING
THE FINAL BULL TRAP MAY BE OVER. THE NEXT 12 DAYS COULD BE CRITICAL FOR $BTC!
🎯 Bearish target: $53,000
⏳ Time window: 12 days
📉 Market outlook: Potential cycle-bottom formation
🚀 Long-term possibility: A new accumulation phase followed by recovery
📌 SAVE THIS CHART! We'll compare Bitcoin's price action again in a few weeks to see whether the $53,000 prediction was accurate.
🔔 TURN ON NOTIFICATIONS!
🔥 FOLLOW BEFORE YOU'RE LATE!
🚨 I'll post every major Bitcoin market update here first!
💬 WHAT DO YOU THINK?
Will Bitcoin crash toward $53,000, or will the bulls surprise everyone with another rally?
👇 Drop your BTC price prediction in the comments!
#Bitcoin #BTC #Crypto #BitcoinCrash #BullTrap #CryptoMarket #BTCAnalysis #BitcoinPrediction #CryptoTrading #BitcoinNews #BearMarket #BullRun #HODL #BinanceSquare
Disclaimer: This article presents a speculative market scenario, not financial advice or a confirmed price forecast.$BTC $BTC
BITCOIN FINAL BULL TRAP IS OVER! IS $53,000 THE NEXT TARGET? 📉🔥
$BTC | Bitcoin Market Analysis | October 2026
🚨 WARNING TO ALL BITCOIN INVESTORS AND CRYPTO TRADERS!
Bitcoin may be entering one of the most critical phases of its market cycle. After a period of bullish optimism, the possibility of a final bull trap is raising concerns about another major correction.
The big question is no longer just how high Bitcoin can go. It's whether the market needs one final shakeout before the next major accumulation phase begins.
📉 1. The Final Bull Trap Theory
A bull trap happens when Bitcoin moves higher, attracting buyers who believe a new rally has started, only for the price to reverse sharply.
If the latest recovery was a bull trap, several warning signals could emerge:
⚠️ Repeated rejection at major resistance levels.📊 Weak buying volume during price recoveries.💰 Large holders transferring BTC to exchanges.📉 Increasing selling pressure and liquidation risk.🔻 Bitcoin failing to maintain important support levels.
These signals would strengthen the bearish scenario, although none alone confirms that the cycle has peaked.
🎯 2. Bitcoin's Potential $53,000 Target
My bearish scenario: Bitcoin could fall toward $53,000 within the next 12 days, by approximately November 6, 2026.
This is an aggressive downside projection, not a guaranteed outcome.
A move toward $53,000 could become more plausible if Bitcoin breaks important support levels, selling volume increases, and leveraged long positions are liquidated.
However, if buyers defend support and Bitcoin reclaims resistance with strong volume, the bearish outlook could be invalidated.
🔥 3. Why a Major Bitcoin Correction Could Happen
Bitcoin markets often experience sharp corrections driven by several factors:
🔹 Liquidity pressure: Large liquidations can accelerate downward price movements.
🔹 Institutional activity: Changes in ETF flows and institutional demand can influence market sentiment.
🔹 Market psychology: Fear, panic selling, and excessive leverage can amplify volatility.
🔹 Macroeconomic uncertainty: Interest rates, global liquidity, and investor risk appetite can affect demand for Bitcoin.
🔹 Cycle-bottom formation: A prolonged correction may eventually create opportunities for long-term investors, but identifying the exact bottom is extremely difficult.
🚀 4. What Happens After $53,000?
If Bitcoin reaches the projected downside zone, traders should watch for evidence of genuine accumulation rather than assuming the bottom is automatically confirmed.
Potential recovery signals include:
✅ Strong buying volume near major support.
✅ A sustained reduction in selling pressure.
✅ Higher lows forming on the daily chart.
✅ Improving institutional demand.
✅ A confirmed breakout above resistance.
A new bullish cycle could follow a bottoming process, but the recovery might take weeks or months rather than happen immediately.
⚠️ 5. What Should Bitcoin Investors Do?
This is a market where risk management matters more than emotional decisions.
Avoid excessive leverage, watch critical support levels, and prepare for both bearish and bullish outcomes.
Remember: The biggest opportunities often appear during periods of extreme fear, but not every major decline marks the final bottom.
🚨 FINAL BITCOIN WARNING
THE FINAL BULL TRAP MAY BE OVER. THE NEXT 12 DAYS COULD BE CRITICAL FOR $BTC !
🎯 Bearish target: $53,000
⏳ Time window: 12 days
📉 Market outlook: Potential cycle-bottom formation
🚀 Long-term possibility: A new accumulation phase followed by recovery
📌 SAVE THIS CHART! We'll compare Bitcoin's price action again in a few weeks to see whether the $53,000 prediction was accurate.
🔔 TURN ON NOTIFICATIONS!
🔥 FOLLOW BEFORE YOU'RE LATE!
🚨 I'll post every major Bitcoin market update here first!
💬 WHAT DO YOU THINK?
Will Bitcoin crash toward $53,000, or will the bulls surprise everyone with another rally?
👇 Drop your BTC price prediction in the comments!
#Bitcoin #BTC #Crypto #BitcoinCrash #BullTrap #CryptoMarket #BTCAnalysis #BitcoinPrediction #CryptoTrading #BitcoinNews #BearMarket #BullRun #HODL #BinanceSquare
Disclaimer: This article presents a speculative market scenario, not financial advice or a confirmed price forecast.$BTC $BTC
76
Verifiziert

Artikel
Übersetzung ansehen
IRYS Market🚀 IRYS Crypto: The Next Big Opportunity in Web3 and AI? 🔥
$IRYS S | Crypto Market Insights 2026
The cryptocurrency market is constantly evolving, and Irys (IRYS) is a project worth watching as blockchain technology expands beyond simple payments and trading.
🔥 What Makes IRYS Special?
Irys is building a programmable data blockchain designed to make on-chain data more useful for decentralized applications.
Unlike traditional blockchains that primarily focus on financial transactions, Irys aims to combine data storage with programmable functionality.
💎 Why Could IRYS Attract Investor Attention?
✅ Growing Web3 Adoption: Decentralized applications need reliable data infrastructure.
✅ AI and Blockchain Integration: Programmable data could support emerging AI-powered applications.
✅ Long-Term Utility: Demand for accessible, verifiable blockchain data may increase as the ecosystem develops.
✅ Ecosystem Expansion: New developers, applications, and integrations could strengthen demand for the network.
⚠️ What Are the Risks?
Despite its potential, IRYS faces challenges, including competition, token volatility, adoption uncertainty, and broader cryptocurrency market conditions.
Investors should also monitor token supply, unlock schedules, and actual network usage.
🚀 Can IRYS Become a Major Crypto Project?
The long-term outlook depends on whether Irys can attract developers, grow its ecosystem, and turn its technology into real-world adoption.
The big question: Is $IRYS an undervalued Web3 opportunity, or does it still have much to prove? 👀
💬 Are you bullish or bearish on IRYS?
#IRYS #Irys #Crypto #Web3 #Blockchain #Altcoins #CryptoNews #BinanceSquare #AI
IRYS Market
🚀 IRYS Crypto: The Next Big Opportunity in Web3 and AI? 🔥
$IRYS S | Crypto Market Insights 2026
The cryptocurrency market is constantly evolving, and Irys (IRYS) is a project worth watching as blockchain technology expands beyond simple payments and trading.
🔥 What Makes IRYS Special?
Irys is building a programmable data blockchain designed to make on-chain data more useful for decentralized applications.
Unlike traditional blockchains that primarily focus on financial transactions, Irys aims to combine data storage with programmable functionality.
💎 Why Could IRYS Attract Investor Attention?
✅ Growing Web3 Adoption: Decentralized applications need reliable data infrastructure.
✅ AI and Blockchain Integration: Programmable data could support emerging AI-powered applications.
✅ Long-Term Utility: Demand for accessible, verifiable blockchain data may increase as the ecosystem develops.
✅ Ecosystem Expansion: New developers, applications, and integrations could strengthen demand for the network.
⚠️ What Are the Risks?
Despite its potential, IRYS faces challenges, including competition, token volatility, adoption uncertainty, and broader cryptocurrency market conditions.
Investors should also monitor token supply, unlock schedules, and actual network usage.
🚀 Can IRYS Become a Major Crypto Project?
The long-term outlook depends on whether Irys can attract developers, grow its ecosystem, and turn its technology into real-world adoption.
The big question: Is $IRYS an undervalued Web3 opportunity, or does it still have much to prove? 👀
💬 Are you bullish or bearish on IRYS?
#IRYS #Irys #Crypto #Web3 #Blockchain #Altcoins #CryptoNews #BinanceSquare #AI
317
Artikel
Übersetzung ansehen
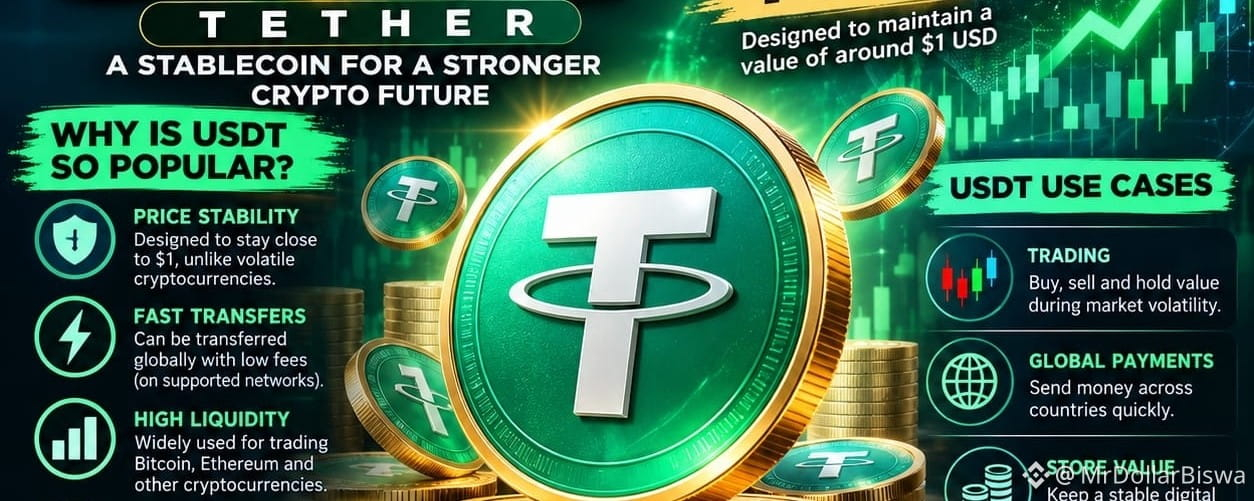
USDT Insights 2026: Is Tether the Backbone of the Crypto Market? 🚀$USDT
$USDT Crypto Market Analysis | October 24, 2026
USDT (Tether) is one of the most important stablecoins in cryptocurrency, designed to maintain a value close to $1 USD.
Unlike Bitcoin and Ethereum, which experience significant price fluctuations, USDT aims to provide stability for traders, investors, and businesses.
🔥 Why USDT Matters
💵 Price Stability: USDT targets a 1:1 value with the US dollar.🌍 Global Transactions: Enables international crypto transfers across supported blockchain networks.📈 Crypto Trading: Widely used as a trading pair on cryptocurrency exchanges.⚡ Fast Transfers: Networks such as TRON and Ethereum support USDT transactions, with different fees and speeds.🏦 Dollar Exposure: Provides access to a dollar-linked digital asset without directly holding dollars in a bank account.
⚠️ Is USDT Safe?
USDT is designed to be stable, but it is not risk-free. Investors should understand reserve transparency, issuer risk, potential depegging, exchange security, and changing cryptocurrency regulations.
Important: Holding USDT does not guarantee profits, and its $1 peg is a target rather than an absolute guarantee.
📊 Latest USDT Market Insights
USDT Price
$1.00
Near target peg
Market Capitalization
$182.4B
Reported snapshot
24-Hour Trading Volume
$47.48B
Stablecoin Market Share
62.9%
Market snapshot reported October 24, 2026. Figures may change.
CryptoSlate
🔍 What Investors Should Watch
Recent reports highlight USDT liquidity movements on Binance, higher borrowing costs on Aave, and regulatory scrutiny involving Tether. These developments deserve attention, but they do not automatically mean USDT will lose its dollar peg.
CoinMarketCap
+1
💡 Market Outlook: USDT remains a major source of liquidity for cryptocurrency markets. Its future strength will depend on confidence in reserves, redemption reliability, regulatory developments, and continued adoption.
🔥 Final Question: Can USDT maintain its dominance as stablecoin competition grows, or will investors increasingly move toward alternatives like USDC?
#USDT #Tether #CryptoInsights #Stablecoin #CryptoNews #Blockchain #CryptoTrading #USDC #Binance
I can also monitor major USDT developments and send you updates when important news breaks. Want me to set that up?
USDT Insights 2026: Is Tether the Backbone of the Crypto Market? 🚀
$USDT
$USDT Crypto Market Analysis | October 24, 2026
USDT (Tether) is one of the most important stablecoins in cryptocurrency, designed to maintain a value close to $1 USD.
Unlike Bitcoin and Ethereum, which experience significant price fluctuations, USDT aims to provide stability for traders, investors, and businesses.
🔥 Why USDT Matters
💵 Price Stability: USDT targets a 1:1 value with the US dollar.🌍 Global Transactions: Enables international crypto transfers across supported blockchain networks.📈 Crypto Trading: Widely used as a trading pair on cryptocurrency exchanges.⚡ Fast Transfers: Networks such as TRON and Ethereum support USDT transactions, with different fees and speeds.🏦 Dollar Exposure: Provides access to a dollar-linked digital asset without directly holding dollars in a bank account.
⚠️ Is USDT Safe?
USDT is designed to be stable, but it is not risk-free. Investors should understand reserve transparency, issuer risk, potential depegging, exchange security, and changing cryptocurrency regulations.
Important: Holding USDT does not guarantee profits, and its $1 peg is a target rather than an absolute guarantee.
📊 Latest USDT Market Insights
USDT Price
$1.00
Near target peg
Market Capitalization
$182.4B
Reported snapshot
24-Hour Trading Volume
$47.48B
Stablecoin Market Share
62.9%
Market snapshot reported October 24, 2026. Figures may change.
CryptoSlate
🔍 What Investors Should Watch
Recent reports highlight USDT liquidity movements on Binance, higher borrowing costs on Aave, and regulatory scrutiny involving Tether. These developments deserve attention, but they do not automatically mean USDT will lose its dollar peg.
CoinMarketCap
+1
💡 Market Outlook: USDT remains a major source of liquidity for cryptocurrency markets. Its future strength will depend on confidence in reserves, redemption reliability, regulatory developments, and continued adoption.
🔥 Final Question: Can USDT maintain its dominance as stablecoin competition grows, or will investors increasingly move toward alternatives like USDC?
#USDT #Tether #CryptoInsights #Stablecoin #CryptoNews #Blockchain #CryptoTrading #USDC #Binance
I can also monitor major USDT developments and send you updates when important news breaks. Want me to set that up?
58
Anmelden und weiter Inhalte entdecken
Krypto-Nutzer weltweit auf Binance Square kennenlernen
⚡️ Bleib in Sachen Krypto stets am Puls.
💬 Die weltgrößte Kryptobörse vertraut darauf.
👍 Erhalte verlässliche Einblicke von verifizierten Creators.
E-Mail-Adresse/Telefonnummer
Trendthemen
FedWatch
16.3M Aufrufe
39,438 Kommentare
🚨 🇺🇸 PETER SCHIFF HAT SOEBEN EINE DEUTLICHE WARNUNG AN DIE FED GERICHTET!
Peter Schiff bezeichnet Kevin Warshs harte Rhetorik zur Inflation als „Bluff“, und seine Prognose könnte erhebliche Auswirkungen auf die Märkte haben.
Schiff glaubt, dass die Fed irgendwann wieder zur Geldschöpfung durch quantitative Lockerung (QE) zurückkehren und sogar im nächsten Jahr die Zinsen senken könnte, obwohl die Inflation weiter steigt.
Denk einen Moment darüber nach.
🔥 Die Inflation könnte weiterhin ein Problem bleiben. 🔥 Die Fed könnte trotzdem auf eine lockerere Geldpolitik zusteuern. 🔥 Mehr Liquidität könnte in die Finanzmärkte fließen.
Sollte dieses Szenario eintreten, könnte das für Aktien, Gold, Bitcoin und den gesamten Kryptomarkt ein völlig anderes Marktumfeld schaffen.
Doch es gibt einen Haken: Bleibt die Inflation hoch, könnte die Fed vor der schwierigen Entscheidung stehen, ob sie steigende Preise bekämpfen oder die Wirtschaft stützen soll.
Wird Warsh an einer strikten Inflationspolitik festhalten, oder wird die Fed irgendwann ihren Kurs ändern?
Der nächste Schritt könnte für Anleger sehr wichtig sein.
#FedWatch #EarningsSeason #USMidtermElections #BrazilCryptoExchangesMustApplyForLicensesByFriday #StanDruckenmillerBecomesInvestorInTradeXYZ
Jackson Liam
·4 Likes
·8.5k Aufrufe
EarningsSeason
6.5M Aufrufe
32,141 Kommentare
USMidtermElections
45,540 Aufrufe
642 Kommentare