
mOST_1398
20 Beiträge

mOST_1398
Melden
Nutzer blockieren
Trade eröffnen
Gelegenheitstrader
4 Jahre
11 Following
39 Follower
25 Like gegeben
Beiträge
Portfolio
·
--
BStocks 101: So erkundest du US-Aktien bei Binance – EinsteigerleitfadenFür viele Menschen wirken Investitionen in US-Aktien kompliziert – insbesondere, wenn sie neu in traditionellen Finanzmärkten sind. Wenn du bereits Binance für Krypto nutzt, könnte es dich außerdem interessieren, mehr über Aktien und BStocks zu erfahren – als weiteren Teil deiner Investment-Reise.
Was sollten Einsteiger also wissen?
1. Verstehe, worin du investierst
Bevor du in eine Aktie investierst, nimm dir Zeit, um das Unternehmen, sein Geschäftsmodell, die Branche, die finanzielle Entwicklung sowie die Faktoren zu verstehen, die seinen Preis beeinflussen können. Ein beliebtes Unternehmen ist nicht automatisch für jeden als Investition geeignet.
BStocks 101: So erkundest du US-Aktien bei Binance – Einsteigerleitfaden
Für viele Menschen wirken Investitionen in US-Aktien kompliziert – insbesondere, wenn sie neu in traditionellen Finanzmärkten sind. Wenn du bereits Binance für Krypto nutzt, könnte es dich außerdem interessieren, mehr über Aktien und BStocks zu erfahren – als weiteren Teil deiner Investment-Reise.
Was sollten Einsteiger also wissen?
1. Verstehe, worin du investierst
Bevor du in eine Aktie investierst, nimm dir Zeit, um das Unternehmen, sein Geschäftsmodell, die Branche, die finanzielle Entwicklung sowie die Faktoren zu verstehen, die seinen Preis beeinflussen können. Ein beliebtes Unternehmen ist nicht automatisch für jeden als Investition geeignet.
Was sollten Einsteiger also wissen?
1. Verstehe, worin du investierst
Bevor du in eine Aktie investierst, nimm dir Zeit, um das Unternehmen, sein Geschäftsmodell, die Branche, die finanzielle Entwicklung sowie die Faktoren zu verstehen, die seinen Preis beeinflussen können. Ein beliebtes Unternehmen ist nicht automatisch für jeden als Investition geeignet.
62
·
--
Wie können Einsteiger mit US-Aktien Vermögen aufbauen? Ein einfacher Leitfaden für den StartViele Menschen möchten sich eine zusätzliche Einkommensquelle aufbauen, wissen aber möglicherweise nicht, wo sie anfangen sollen. US-Aktien können eine Option sein, die man in Betracht zieht – insbesondere für Menschen, die etwas über das Investieren lernen und möglicherweise langfristigen Wohlstand aufbauen möchten.
Für Einsteiger ist das Wichtigste, nicht zu versuchen, schnell Geld zu verdienen. Es geht darum zu verstehen, wie der Aktienmarkt funktioniert, einen Ansatz zu wählen, der zu deinen Zielen passt, und das Risiko sorgfältig zu managen.
1. Was bedeutet „Geld verdienen mit Aktien“?
Im Allgemeinen gibt es zwei Wege, wie Anleger möglicherweise von Aktien profitieren können:
Wie können Einsteiger mit US-Aktien Vermögen aufbauen? Ein einfacher Leitfaden für den Start
Viele Menschen möchten sich eine zusätzliche Einkommensquelle aufbauen, wissen aber möglicherweise nicht, wo sie anfangen sollen. US-Aktien können eine Option sein, die man in Betracht zieht – insbesondere für Menschen, die etwas über das Investieren lernen und möglicherweise langfristigen Wohlstand aufbauen möchten.
Für Einsteiger ist das Wichtigste, nicht zu versuchen, schnell Geld zu verdienen. Es geht darum zu verstehen, wie der Aktienmarkt funktioniert, einen Ansatz zu wählen, der zu deinen Zielen passt, und das Risiko sorgfältig zu managen.
1. Was bedeutet „Geld verdienen mit Aktien“?
Im Allgemeinen gibt es zwei Wege, wie Anleger möglicherweise von Aktien profitieren können:
Für Einsteiger ist das Wichtigste, nicht zu versuchen, schnell Geld zu verdienen. Es geht darum zu verstehen, wie der Aktienmarkt funktioniert, einen Ansatz zu wählen, der zu deinen Zielen passt, und das Risiko sorgfältig zu managen.
1. Was bedeutet „Geld verdienen mit Aktien“?
Im Allgemeinen gibt es zwei Wege, wie Anleger möglicherweise von Aktien profitieren können:
92
·
--

Artikel
So starten Sie mit dem Investieren in US-Aktien: Eine Checkliste für EinsteigerSo starten Sie mit dem Investieren in US-Aktien: Eine Checkliste für Einsteiger
In US-Aktien zu investieren kann eine interessante Möglichkeit sein, am globalen Wirtschaftsgeschehen teilzunehmen und langfristigen Wohlstand aufzubauen. Der US-Aktienmarkt umfasst viele bekannte Unternehmen aus den Bereichen Technologie, Gesundheitswesen, Finanzen, Konsumgüter, Energie und weiteren Branchen.
Allerdings sollte der Einstieg nicht einfach darin bestehen, nur eine beliebte Aktie zu kaufen. Einsteiger sollten zuerst verstehen, wie der Markt funktioniert, eine passende Investment-Plattform auswählen, Risiken managen und einen klaren Anlageplan erstellen.
So starten Sie mit dem Investieren in US-Aktien: Eine Checkliste für Einsteiger
So starten Sie mit dem Investieren in US-Aktien: Eine Checkliste für Einsteiger
In US-Aktien zu investieren kann eine interessante Möglichkeit sein, am globalen Wirtschaftsgeschehen teilzunehmen und langfristigen Wohlstand aufzubauen. Der US-Aktienmarkt umfasst viele bekannte Unternehmen aus den Bereichen Technologie, Gesundheitswesen, Finanzen, Konsumgüter, Energie und weiteren Branchen.
Allerdings sollte der Einstieg nicht einfach darin bestehen, nur eine beliebte Aktie zu kaufen. Einsteiger sollten zuerst verstehen, wie der Markt funktioniert, eine passende Investment-Plattform auswählen, Risiken managen und einen klaren Anlageplan erstellen.
In US-Aktien zu investieren kann eine interessante Möglichkeit sein, am globalen Wirtschaftsgeschehen teilzunehmen und langfristigen Wohlstand aufzubauen. Der US-Aktienmarkt umfasst viele bekannte Unternehmen aus den Bereichen Technologie, Gesundheitswesen, Finanzen, Konsumgüter, Energie und weiteren Branchen.
Allerdings sollte der Einstieg nicht einfach darin bestehen, nur eine beliebte Aktie zu kaufen. Einsteiger sollten zuerst verstehen, wie der Markt funktioniert, eine passende Investment-Plattform auswählen, Risiken managen und einen klaren Anlageplan erstellen.
27
·
--
Übersetzung ansehen
BStocks 101: How to Access and Explore US Stocks Through BinanceBStocks 101: How to Access and Explore US Stocks Through Binance
Introduction
The US stock market is one of the most well-known and widely followed financial markets in the world. Many leading global companies, such as Apple, Microsoft, Amazon, and Tesla, are listed on US stock exchanges and attract investors from different countries.
For people who are already familiar with Binance and cryptocurrency trading, exploring stock-related products through the platform can be an interesting way to learn more about traditional financial markets. BStocks 101 is designed as a simple introduction for beginners who want to understand how to access and explore US stock-related products through Binance.
However, it is important to understand exactly what product is being offered. A stock-related product on a cryptocurrency platform may not be the same as directly owning shares through a traditional stockbroker. Depending on the product, it may represent a tokenized asset, a derivative, or another financial product linked to the price of a stock.
1. What Is BStocks?
BStocks can refer to stock-related products or services available through Binance. These products may allow users to gain exposure to the price movements of selected US stocks without necessarily purchasing traditional shares through a conventional brokerage account.
Before using any stock-related product, users should carefully check the product description, issuer, trading conditions, fees, and available services.
It is also important to understand the difference between owning an actual stock and holding a token or financial product that tracks the price of a stock. These products may have different rights, fees, risks, and conditions.
Availability can also depend on the user's country or region because financial products are subject to local regulations and restrictions.
2. Getting Started
Before exploring US stock-related products on Binance, users should make sure their account is properly set up.
First, create or log in to a Binance account and complete the required identity verification process. Users should also make sure that the relevant service is legally and officially available in their location.
It is recommended to keep the Binance application updated to the latest version and activate strong account-security features, such as two-factor authentication (2FA).
Users should never share their password, verification codes, private keys, or other sensitive account information with anyone.
3. How to Access and Explore US Stocks
The exact menu names and available features may vary depending on the user's location, account type, and Binance application version. In general, the process can be approached as follows:
Step 1: Open the Binance application and log in to your account.
Step 2: Go to the relevant market, trading, or investment section available on your account.
Step 3: Use the search function to look for the stock or stock-related product you are interested in. For example, users may search for well-known stock symbols such as AAPL, MSFT, or TSLA if those products are available.
Step 4: Select the relevant product and review its information carefully.
Step 5: Check the product type. Make sure you understand whether it represents an actual stock, a tokenized stock, a derivative, or another type of financial product.
Never assume that a product with the name of a US company automatically means that you own the underlying shares.
4. What Information Should You Check?
Before considering any investment, users should examine several important pieces of information.
Current Price: Check the current price and how much it has changed over different periods.
Price Chart: Review the historical price chart to understand previous price movements. Different timeframes can help users observe short-term and long-term trends.
Market Capitalization: Market capitalization provides an indication of the overall size of a company.
Trading Volume: Trading volume shows how actively an asset is being traded and can provide additional market information.
Company Information: Learn what the company does, how it generates revenue, its financial performance, and the major risks associated with its business.
Charts can be useful for analysis, but historical price movements do not guarantee future performance.
5. Fees and Risks
Before making a transaction, users should carefully review all applicable fees and conditions. These may include trading fees, conversion fees, withdrawal fees, spreads, or other charges depending on the product.
Users should also understand the risks associated with market volatility. Stock prices can move significantly because of company earnings, economic conditions, interest rates, market sentiment, and major news events.
If a product involves leverage or derivatives, the potential risks can be significantly higher. Users should understand how the product works before using it and should never invest money that they cannot afford to lose.
6. Start With Education
For beginners, the best starting point is education. Learn the basics of stock markets, company financial statements, valuation, technical analysis, and risk management before making real investments.
It can also be useful to create a watchlist and observe selected stocks without immediately investing money. This allows beginners to understand how prices react to company news and market conditions.
Investors should separate investment money from essential living expenses and avoid making decisions based only on social-media recommendations, short-term price movements, or fear of missing out (FOMO).
Conclusion
BStocks 101 provides a starting point for anyone interested in exploring US stock-related products through Binance. The most important step is not simply learning how to find a stock, but understanding what product you are actually buying, how it works, what fees apply, and what risks are involved.
Before making any investment, always check the latest information from official sources and carefully consider your own financial situation and risk tolerance.
Learn first. Check the product. Understand the risks. Then make your own decision.
BStocks 101: How to Access and Explore US Stocks Through Binance
BStocks 101: How to Access and Explore US Stocks Through Binance
Introduction
The US stock market is one of the most well-known and widely followed financial markets in the world. Many leading global companies, such as Apple, Microsoft, Amazon, and Tesla, are listed on US stock exchanges and attract investors from different countries.
For people who are already familiar with Binance and cryptocurrency trading, exploring stock-related products through the platform can be an interesting way to learn more about traditional financial markets. BStocks 101 is designed as a simple introduction for beginners who want to understand how to access and explore US stock-related products through Binance.
However, it is important to understand exactly what product is being offered. A stock-related product on a cryptocurrency platform may not be the same as directly owning shares through a traditional stockbroker. Depending on the product, it may represent a tokenized asset, a derivative, or another financial product linked to the price of a stock.
1. What Is BStocks?
BStocks can refer to stock-related products or services available through Binance. These products may allow users to gain exposure to the price movements of selected US stocks without necessarily purchasing traditional shares through a conventional brokerage account.
Before using any stock-related product, users should carefully check the product description, issuer, trading conditions, fees, and available services.
It is also important to understand the difference between owning an actual stock and holding a token or financial product that tracks the price of a stock. These products may have different rights, fees, risks, and conditions.
Availability can also depend on the user's country or region because financial products are subject to local regulations and restrictions.
2. Getting Started
Before exploring US stock-related products on Binance, users should make sure their account is properly set up.
First, create or log in to a Binance account and complete the required identity verification process. Users should also make sure that the relevant service is legally and officially available in their location.
It is recommended to keep the Binance application updated to the latest version and activate strong account-security features, such as two-factor authentication (2FA).
Users should never share their password, verification codes, private keys, or other sensitive account information with anyone.
3. How to Access and Explore US Stocks
The exact menu names and available features may vary depending on the user's location, account type, and Binance application version. In general, the process can be approached as follows:
Step 1: Open the Binance application and log in to your account.
Step 2: Go to the relevant market, trading, or investment section available on your account.
Step 3: Use the search function to look for the stock or stock-related product you are interested in. For example, users may search for well-known stock symbols such as AAPL, MSFT, or TSLA if those products are available.
Step 4: Select the relevant product and review its information carefully.
Step 5: Check the product type. Make sure you understand whether it represents an actual stock, a tokenized stock, a derivative, or another type of financial product.
Never assume that a product with the name of a US company automatically means that you own the underlying shares.
4. What Information Should You Check?
Before considering any investment, users should examine several important pieces of information.
Current Price: Check the current price and how much it has changed over different periods.
Price Chart: Review the historical price chart to understand previous price movements. Different timeframes can help users observe short-term and long-term trends.
Market Capitalization: Market capitalization provides an indication of the overall size of a company.
Trading Volume: Trading volume shows how actively an asset is being traded and can provide additional market information.
Company Information: Learn what the company does, how it generates revenue, its financial performance, and the major risks associated with its business.
Charts can be useful for analysis, but historical price movements do not guarantee future performance.
5. Fees and Risks
Before making a transaction, users should carefully review all applicable fees and conditions. These may include trading fees, conversion fees, withdrawal fees, spreads, or other charges depending on the product.
Users should also understand the risks associated with market volatility. Stock prices can move significantly because of company earnings, economic conditions, interest rates, market sentiment, and major news events.
If a product involves leverage or derivatives, the potential risks can be significantly higher. Users should understand how the product works before using it and should never invest money that they cannot afford to lose.
6. Start With Education
For beginners, the best starting point is education. Learn the basics of stock markets, company financial statements, valuation, technical analysis, and risk management before making real investments.
It can also be useful to create a watchlist and observe selected stocks without immediately investing money. This allows beginners to understand how prices react to company news and market conditions.
Investors should separate investment money from essential living expenses and avoid making decisions based only on social-media recommendations, short-term price movements, or fear of missing out (FOMO).
Conclusion
BStocks 101 provides a starting point for anyone interested in exploring US stock-related products through Binance. The most important step is not simply learning how to find a stock, but understanding what product you are actually buying, how it works, what fees apply, and what risks are involved.
Before making any investment, always check the latest information from official sources and carefully consider your own financial situation and risk tolerance.
Learn first. Check the product. Understand the risks. Then make your own decision.
Introduction
The US stock market is one of the most well-known and widely followed financial markets in the world. Many leading global companies, such as Apple, Microsoft, Amazon, and Tesla, are listed on US stock exchanges and attract investors from different countries.
For people who are already familiar with Binance and cryptocurrency trading, exploring stock-related products through the platform can be an interesting way to learn more about traditional financial markets. BStocks 101 is designed as a simple introduction for beginners who want to understand how to access and explore US stock-related products through Binance.
However, it is important to understand exactly what product is being offered. A stock-related product on a cryptocurrency platform may not be the same as directly owning shares through a traditional stockbroker. Depending on the product, it may represent a tokenized asset, a derivative, or another financial product linked to the price of a stock.
1. What Is BStocks?
BStocks can refer to stock-related products or services available through Binance. These products may allow users to gain exposure to the price movements of selected US stocks without necessarily purchasing traditional shares through a conventional brokerage account.
Before using any stock-related product, users should carefully check the product description, issuer, trading conditions, fees, and available services.
It is also important to understand the difference between owning an actual stock and holding a token or financial product that tracks the price of a stock. These products may have different rights, fees, risks, and conditions.
Availability can also depend on the user's country or region because financial products are subject to local regulations and restrictions.
2. Getting Started
Before exploring US stock-related products on Binance, users should make sure their account is properly set up.
First, create or log in to a Binance account and complete the required identity verification process. Users should also make sure that the relevant service is legally and officially available in their location.
It is recommended to keep the Binance application updated to the latest version and activate strong account-security features, such as two-factor authentication (2FA).
Users should never share their password, verification codes, private keys, or other sensitive account information with anyone.
3. How to Access and Explore US Stocks
The exact menu names and available features may vary depending on the user's location, account type, and Binance application version. In general, the process can be approached as follows:
Step 1: Open the Binance application and log in to your account.
Step 2: Go to the relevant market, trading, or investment section available on your account.
Step 3: Use the search function to look for the stock or stock-related product you are interested in. For example, users may search for well-known stock symbols such as AAPL, MSFT, or TSLA if those products are available.
Step 4: Select the relevant product and review its information carefully.
Step 5: Check the product type. Make sure you understand whether it represents an actual stock, a tokenized stock, a derivative, or another type of financial product.
Never assume that a product with the name of a US company automatically means that you own the underlying shares.
4. What Information Should You Check?
Before considering any investment, users should examine several important pieces of information.
Current Price: Check the current price and how much it has changed over different periods.
Price Chart: Review the historical price chart to understand previous price movements. Different timeframes can help users observe short-term and long-term trends.
Market Capitalization: Market capitalization provides an indication of the overall size of a company.
Trading Volume: Trading volume shows how actively an asset is being traded and can provide additional market information.
Company Information: Learn what the company does, how it generates revenue, its financial performance, and the major risks associated with its business.
Charts can be useful for analysis, but historical price movements do not guarantee future performance.
5. Fees and Risks
Before making a transaction, users should carefully review all applicable fees and conditions. These may include trading fees, conversion fees, withdrawal fees, spreads, or other charges depending on the product.
Users should also understand the risks associated with market volatility. Stock prices can move significantly because of company earnings, economic conditions, interest rates, market sentiment, and major news events.
If a product involves leverage or derivatives, the potential risks can be significantly higher. Users should understand how the product works before using it and should never invest money that they cannot afford to lose.
6. Start With Education
For beginners, the best starting point is education. Learn the basics of stock markets, company financial statements, valuation, technical analysis, and risk management before making real investments.
It can also be useful to create a watchlist and observe selected stocks without immediately investing money. This allows beginners to understand how prices react to company news and market conditions.
Investors should separate investment money from essential living expenses and avoid making decisions based only on social-media recommendations, short-term price movements, or fear of missing out (FOMO).
Conclusion
BStocks 101 provides a starting point for anyone interested in exploring US stock-related products through Binance. The most important step is not simply learning how to find a stock, but understanding what product you are actually buying, how it works, what fees apply, and what risks are involved.
Before making any investment, always check the latest information from official sources and carefully consider your own financial situation and risk tolerance.
Learn first. Check the product. Understand the risks. Then make your own decision.
43
·
--
🇺🇸 *FED- WATCH*
Die Fed hat soeben die Zinsen angehoben.
Die Märkte sehen nun mit mehr als 50% Wahrscheinlichkeit, dass sie sie im Oktober NOCH EINMAL anheben.
Goldman Sachs stimmt zu.
🇺🇸 *FED- WATCH*
Die Fed hat soeben die Zinsen angehoben.
Die Märkte sehen nun mit mehr als 50% Wahrscheinlichkeit, dass sie sie im Oktober NOCH EINMAL anheben.
Goldman Sachs stimmt zu.
Die Fed hat soeben die Zinsen angehoben.
Die Märkte sehen nun mit mehr als 50% Wahrscheinlichkeit, dass sie sie im Oktober NOCH EINMAL anheben.
Goldman Sachs stimmt zu.

51
·
--
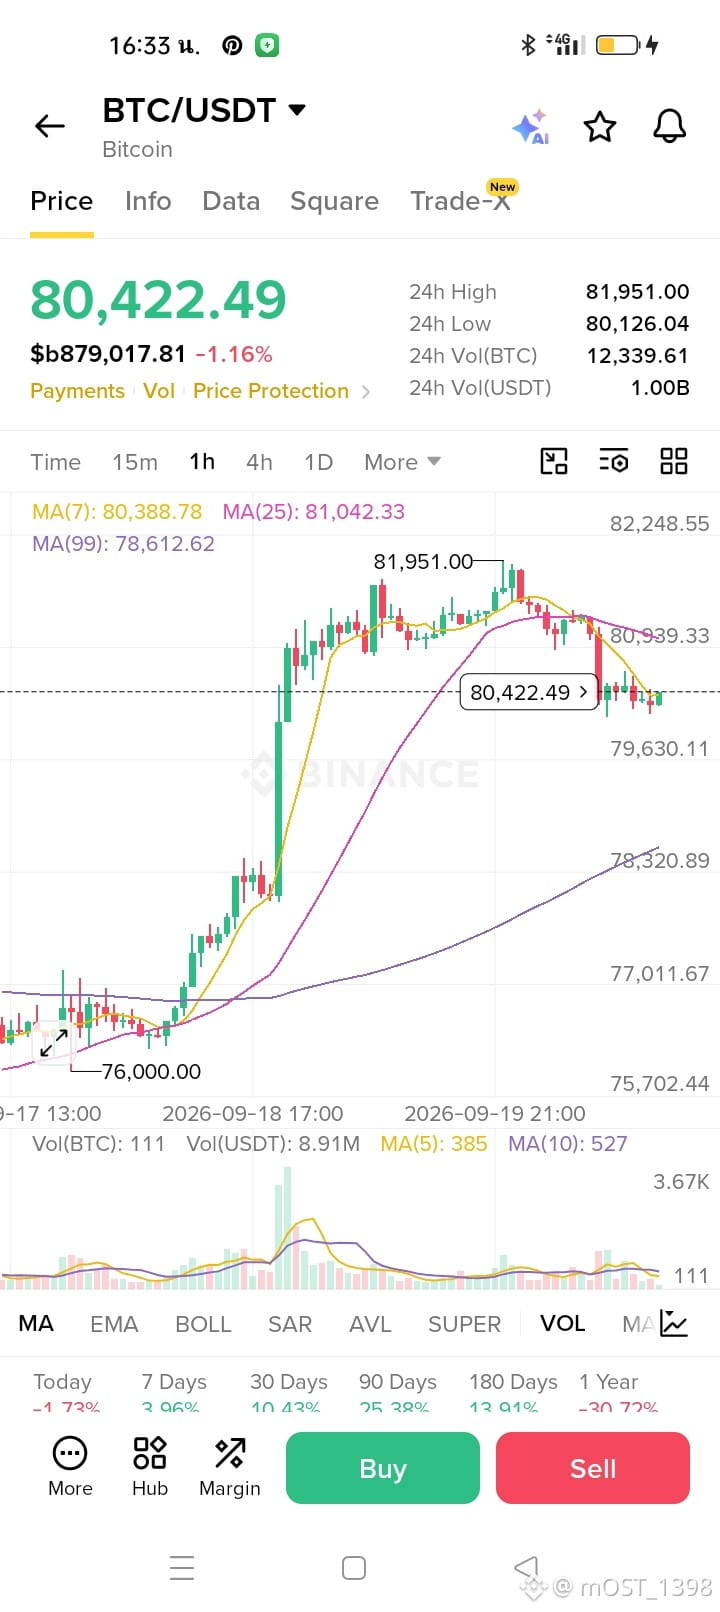
💰🚨 Bitcoin hielt stand und pumpte trotz 4–5 großer bärischer Schlagzeilen, die den Markt trafen.
Aber wenn ein größerer bärischer Auslöser einsetzt, könnte die aktuelle Stärke nicht halten.
$BTC wirkt auf manchen Zeitebenen auch überkauft, während sich gleichzeitig erhebliches Downside-Leverage aufgebaut hat. Wenn das beginnt sich abzuwickeln, könnte die Bewegung scharf ausfallen.
Vor diesem Hintergrund sind wir aktuell im Swing-Short auf BTC, ETH, SOL & BNB.
💰🚨 Bitcoin hielt stand und pumpte trotz 4–5 großer bärischer Schlagzeilen, die den Markt trafen.
Aber wenn ein größerer bärischer Auslöser einsetzt, könnte die aktuelle Stärke nicht halten.
$BTC wirkt auf manchen Zeitebenen auch überkauft, während sich gleichzeitig erhebliches Downside-Leverage aufgebaut hat. Wenn das beginnt sich abzuwickeln, könnte die Bewegung scharf ausfallen.
Vor diesem Hintergrund sind wir aktuell im Swing-Short auf BTC, ETH, SOL & BNB.
Aber wenn ein größerer bärischer Auslöser einsetzt, könnte die aktuelle Stärke nicht halten.
$BTC wirkt auf manchen Zeitebenen auch überkauft, während sich gleichzeitig erhebliches Downside-Leverage aufgebaut hat. Wenn das beginnt sich abzuwickeln, könnte die Bewegung scharf ausfallen.
Vor diesem Hintergrund sind wir aktuell im Swing-Short auf BTC, ETH, SOL & BNB.
55
·
--
*HANDELSWARNUNG – $ETH/USDT*
*Position:* Long(Kaufen)
*Hebelwirkung:* 50x
*Einstiegszone:*
$2397 – $2350
*Ziele:*
$2445
$2486
$2545
*Stop Loss:*
$2310
⚠️ Bleib diszipliniert, kontrolliere das Risiko und erwäge, unterwegs Teilgewinne mitzunehmen.
*HANDELSWARNUNG – $ETH/USDT*
*Position:* Long(Kaufen)
*Hebelwirkung:* 50x
*Einstiegszone:*
$2397 – $2350
*Ziele:*
$2445
$2486
$2545
*Stop Loss:*
$2310
⚠️ Bleib diszipliniert, kontrolliere das Risiko und erwäge, unterwegs Teilgewinne mitzunehmen.
*Position:* Long(Kaufen)
*Hebelwirkung:* 50x
*Einstiegszone:*
$2397 – $2350
*Ziele:*
$2445
$2486
$2545
*Stop Loss:*
$2310
⚠️ Bleib diszipliniert, kontrolliere das Risiko und erwäge, unterwegs Teilgewinne mitzunehmen.
71
·
--
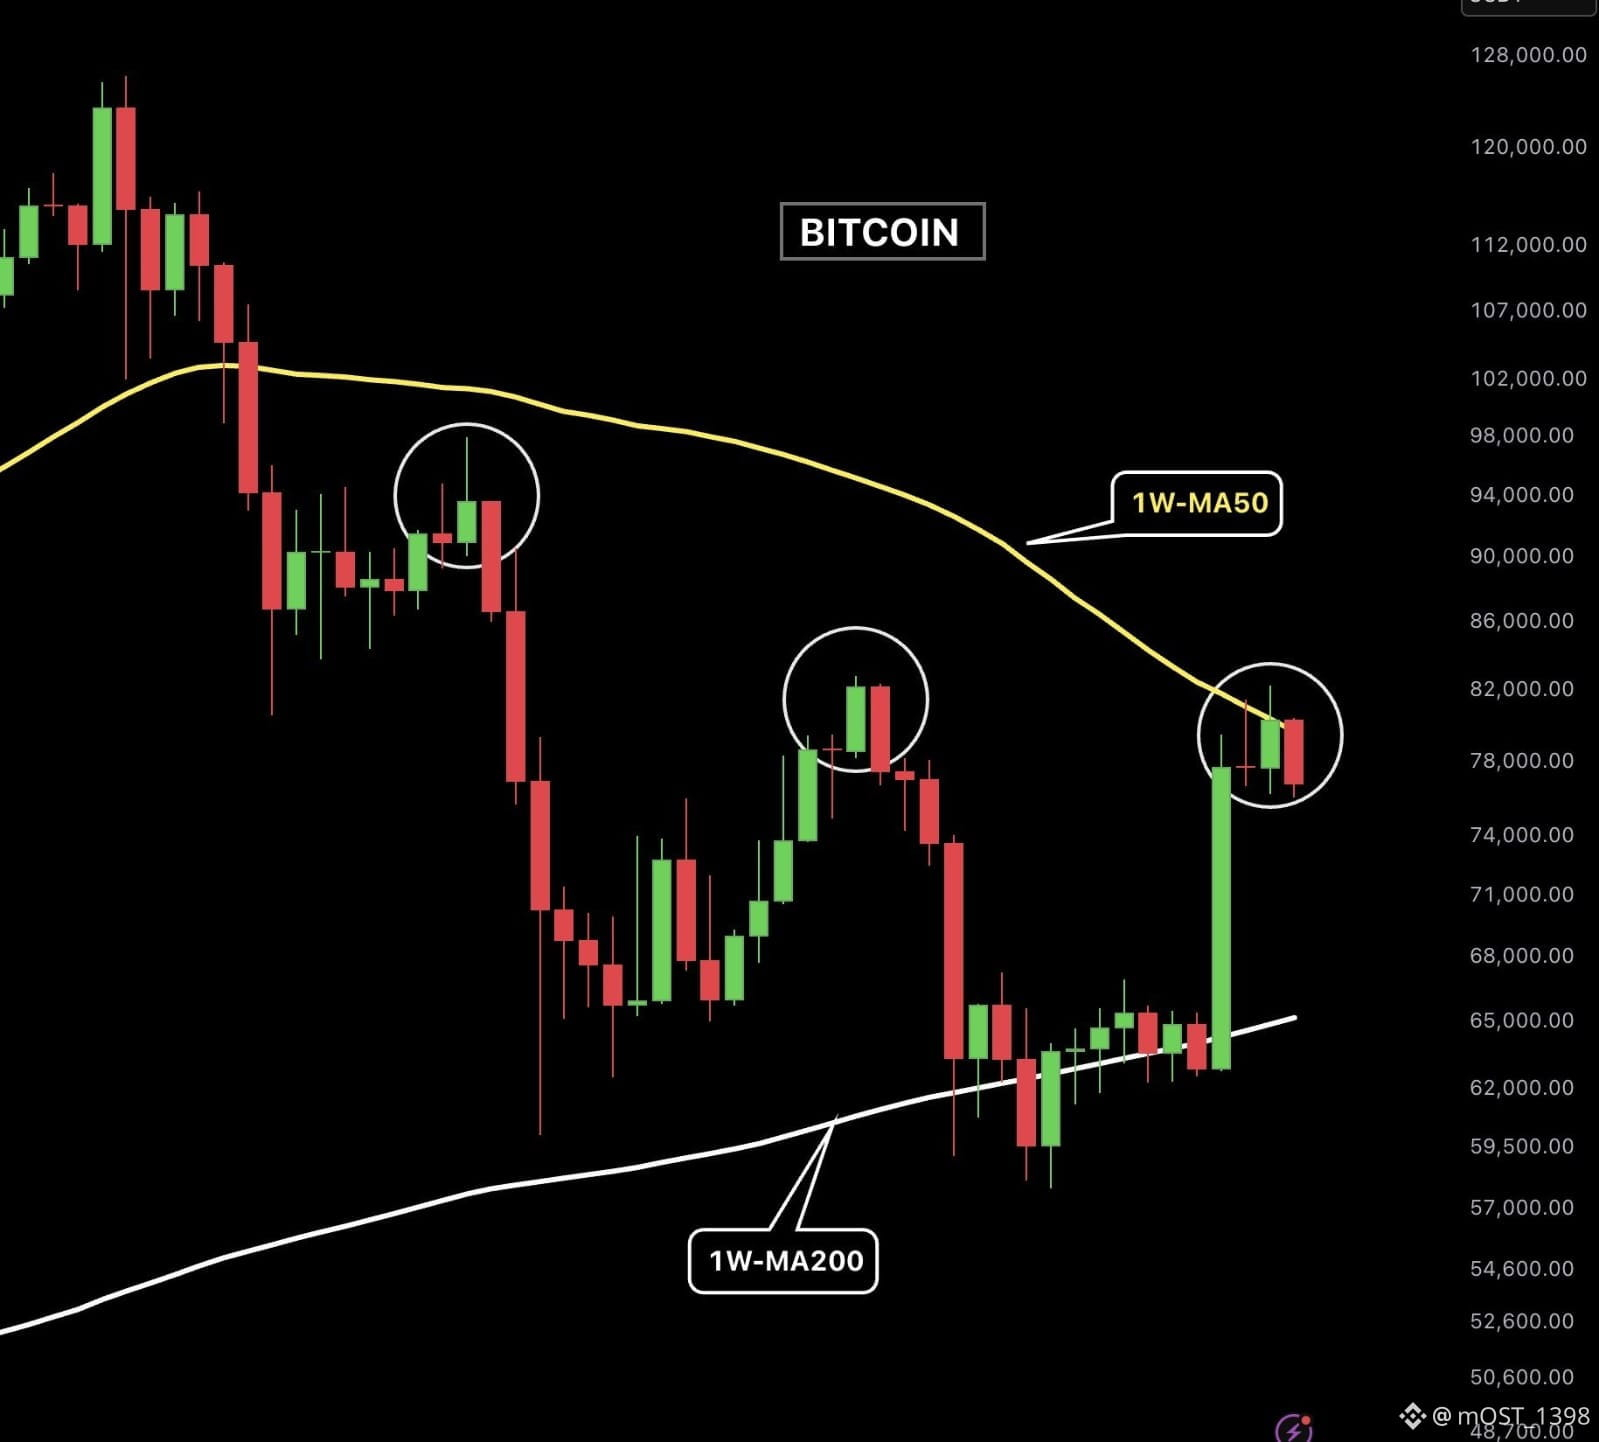
Das sieht nicht gut aus, Jungs.
Bitcoin wurde von der 50W MA abgewiesen. Wir müssen die wöchentliche Kerze wieder darüber schließen, um zu bestätigen, dass $57K der Boden war und der echte Bullenmarkt begonnen hat.
Was beunruhigend ist: Bei den letzten beiden Malen, als Bitcoin hier abgewiesen wurde, folgte anschließend ein großer Crash.
Wenn $BTC unter die 50W MA fällt, ist $75.500 die nächste Unterstützung. Wenn das durchbrochen wird, ist die nächste wichtige Marke, auf die man achten sollte, die 200W MA, derzeit bei etwa $65K.
Das sieht nicht gut aus, Jungs.
Bitcoin wurde von der 50W MA abgewiesen. Wir müssen die wöchentliche Kerze wieder darüber schließen, um zu bestätigen, dass $57K der Boden war und der echte Bullenmarkt begonnen hat.
Was beunruhigend ist: Bei den letzten beiden Malen, als Bitcoin hier abgewiesen wurde, folgte anschließend ein großer Crash.
Wenn $BTC unter die 50W MA fällt, ist $75.500 die nächste Unterstützung. Wenn das durchbrochen wird, ist die nächste wichtige Marke, auf die man achten sollte, die 200W MA, derzeit bei etwa $65K.
Bitcoin wurde von der 50W MA abgewiesen. Wir müssen die wöchentliche Kerze wieder darüber schließen, um zu bestätigen, dass $57K der Boden war und der echte Bullenmarkt begonnen hat.
Was beunruhigend ist: Bei den letzten beiden Malen, als Bitcoin hier abgewiesen wurde, folgte anschließend ein großer Crash.
Wenn $BTC unter die 50W MA fällt, ist $75.500 die nächste Unterstützung. Wenn das durchbrochen wird, ist die nächste wichtige Marke, auf die man achten sollte, die 200W MA, derzeit bei etwa $65K.
66
·
--
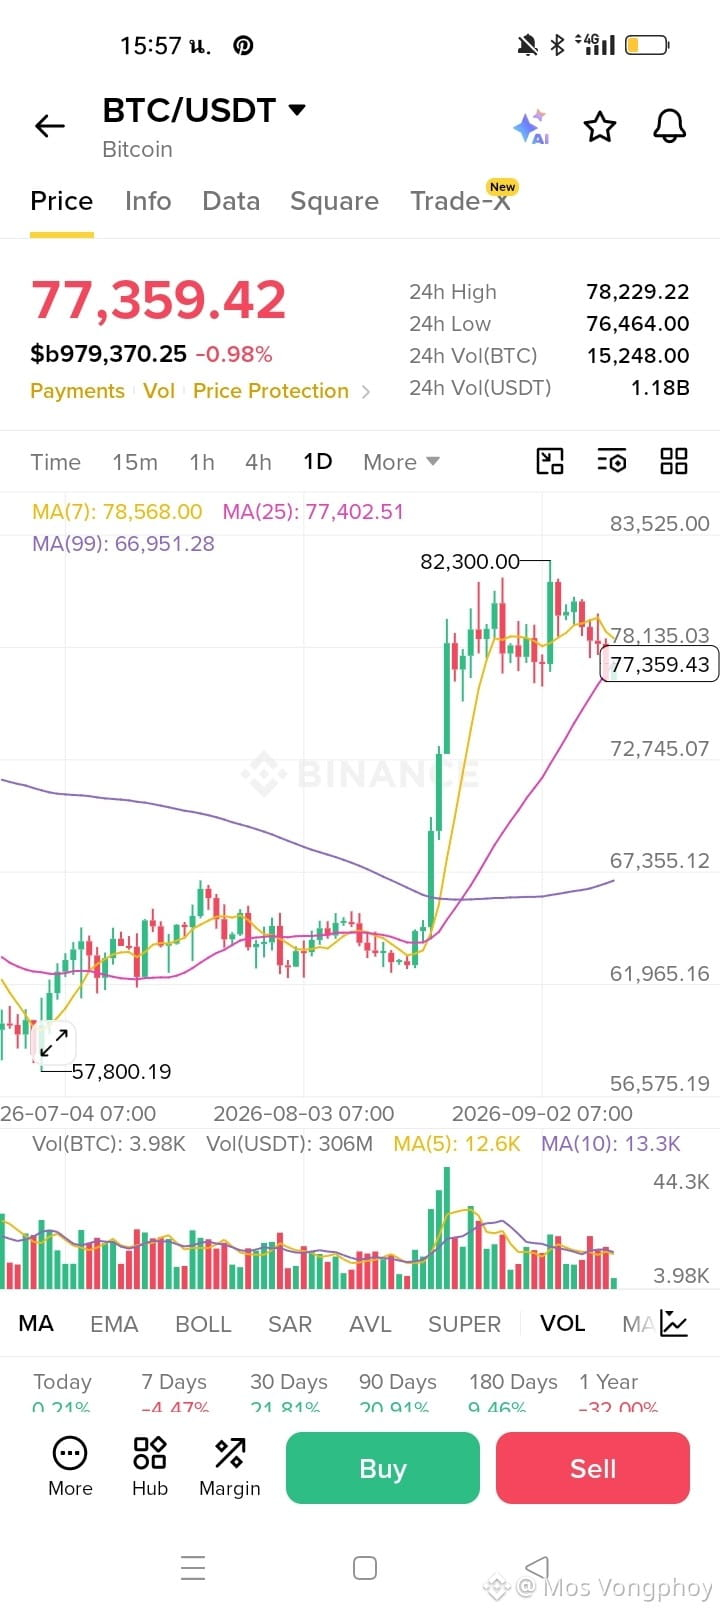
Spot BTC-Insights 2026-09-11 08:00 UTC
TLDR
1. BTC steht unter Abwärtsdruck um $77,2K, angetrieben durch steigende US-Treasury-Renditen und $282 Mio. an taktischen Abflüssen aus dem ETF-Bereich.
Wichtige Treiber
1. - **Makroökonomischer Druck (Hoch)**: Steigende Renditen bei US-Treasuries (30 Jahre) auf 5,37% und hohe PPI-Daten (5,4%) lenken Anleger in risikoarme Anlagen und drücken die Preise nach unten.
- **Institutionelles De-Risking (Hoch)**: Spot-ETFs verzeichneten täglich $282,7 Mio. an Nettoabflüssen, was auf taktische institutionelle Verschiebungen vor den wichtigen Inflationsdaten hindeutet.
- **Korporative Akkumulation (Mittel)**: Fortgesetzte Unternehmenskäufe und erweiterter institutioneller Zugang über asiatische Liquiditätspools bieten eine grundlegende strukturelle Unterstützung.
Risikobewertung
1. - **Volatilität bei Inflationsdaten (Hoch)**: Die bevorstehende US-CPI-Veröffentlichung sowie steigende Ölpreise aufgrund geopolitischer Spannungen könnten höhere Zinsen festigen und weitere Rückgänge auslösen.
- **Technische Verwundbarkeit (Mittel)**: Ein jüngster starker Rückgang auf $76,8K bei massivem Volumen (634M USDT) zeigt eine fragile Unterstützung, obwohl es kurzfristig zu einem RSI-„Bounce“ aus dem überverkauften Bereich kam.
- **Sicherheitsbedenken (Niedrig)**: Sinkende Kosten für Angriffe mit Quantencomputern schaffen langfristige theoretische Verwundbarkeiten.
Makro-Gegenwinde und ETF-Abflüsse schaffen ein heikles Umfeld vor dem CPI-Release.
Installiere die Binance-App, um die neuesten BTC-Insights zu erhalten unter https://app.binance.com/uni-qr/token-ai-report?token=BTC&symbol=BTCUSDT&product=spot&reportAt=1789113600000"eToken=USDT&utm_term=BTC&ref=514701768&utm_source=Brm8cLnPPfw7BoYTCqg55k&utm_medium=spot_insight®isterChannel=trading_insight
Spot BTC-Insights 2026-09-11 08:00 UTC
TLDR
1. BTC steht unter Abwärtsdruck um $77,2K, angetrieben durch steigende US-Treasury-Renditen und $282 Mio. an taktischen Abflüssen aus dem ETF-Bereich.
Wichtige Treiber
1. - **Makroökonomischer Druck (Hoch)**: Steigende Renditen bei US-Treasuries (30 Jahre) auf 5,37% und hohe PPI-Daten (5,4%) lenken Anleger in risikoarme Anlagen und drücken die Preise nach unten.
- **Institutionelles De-Risking (Hoch)**: Spot-ETFs verzeichneten täglich $282,7 Mio. an Nettoabflüssen, was auf taktische institutionelle Verschiebungen vor den wichtigen Inflationsdaten hindeutet.
- **Korporative Akkumulation (Mittel)**: Fortgesetzte Unternehmenskäufe und erweiterter institutioneller Zugang über asiatische Liquiditätspools bieten eine grundlegende strukturelle Unterstützung.
Risikobewertung
1. - **Volatilität bei Inflationsdaten (Hoch)**: Die bevorstehende US-CPI-Veröffentlichung sowie steigende Ölpreise aufgrund geopolitischer Spannungen könnten höhere Zinsen festigen und weitere Rückgänge auslösen.
- **Technische Verwundbarkeit (Mittel)**: Ein jüngster starker Rückgang auf $76,8K bei massivem Volumen (634M USDT) zeigt eine fragile Unterstützung, obwohl es kurzfristig zu einem RSI-„Bounce“ aus dem überverkauften Bereich kam.
- **Sicherheitsbedenken (Niedrig)**: Sinkende Kosten für Angriffe mit Quantencomputern schaffen langfristige theoretische Verwundbarkeiten.
Makro-Gegenwinde und ETF-Abflüsse schaffen ein heikles Umfeld vor dem CPI-Release.
Installiere die Binance-App, um die neuesten BTC-Insights zu erhalten unter https://app.binance.com/uni-qr/token-ai-report?token=BTC&symbol=BTCUSDT&product=spot&reportAt=1789113600000"eToken=USDT&utm_term=BTC&ref=514701768&utm_source=Brm8cLnPPfw7BoYTCqg55k&utm_medium=spot_insight®isterChannel=trading_insight
TLDR
1. BTC steht unter Abwärtsdruck um $77,2K, angetrieben durch steigende US-Treasury-Renditen und $282 Mio. an taktischen Abflüssen aus dem ETF-Bereich.
Wichtige Treiber
1. - **Makroökonomischer Druck (Hoch)**: Steigende Renditen bei US-Treasuries (30 Jahre) auf 5,37% und hohe PPI-Daten (5,4%) lenken Anleger in risikoarme Anlagen und drücken die Preise nach unten.
- **Institutionelles De-Risking (Hoch)**: Spot-ETFs verzeichneten täglich $282,7 Mio. an Nettoabflüssen, was auf taktische institutionelle Verschiebungen vor den wichtigen Inflationsdaten hindeutet.
- **Korporative Akkumulation (Mittel)**: Fortgesetzte Unternehmenskäufe und erweiterter institutioneller Zugang über asiatische Liquiditätspools bieten eine grundlegende strukturelle Unterstützung.
Risikobewertung
1. - **Volatilität bei Inflationsdaten (Hoch)**: Die bevorstehende US-CPI-Veröffentlichung sowie steigende Ölpreise aufgrund geopolitischer Spannungen könnten höhere Zinsen festigen und weitere Rückgänge auslösen.
- **Technische Verwundbarkeit (Mittel)**: Ein jüngster starker Rückgang auf $76,8K bei massivem Volumen (634M USDT) zeigt eine fragile Unterstützung, obwohl es kurzfristig zu einem RSI-„Bounce“ aus dem überverkauften Bereich kam.
- **Sicherheitsbedenken (Niedrig)**: Sinkende Kosten für Angriffe mit Quantencomputern schaffen langfristige theoretische Verwundbarkeiten.
Makro-Gegenwinde und ETF-Abflüsse schaffen ein heikles Umfeld vor dem CPI-Release.
Installiere die Binance-App, um die neuesten BTC-Insights zu erhalten unter https://app.binance.com/uni-qr/token-ai-report?token=BTC&symbol=BTCUSDT&product=spot&reportAt=1789113600000"eToken=USDT&utm_term=BTC&ref=514701768&utm_source=Brm8cLnPPfw7BoYTCqg55k&utm_medium=spot_insight®isterChannel=trading_insight
67
·
--
Übersetzung ansehen
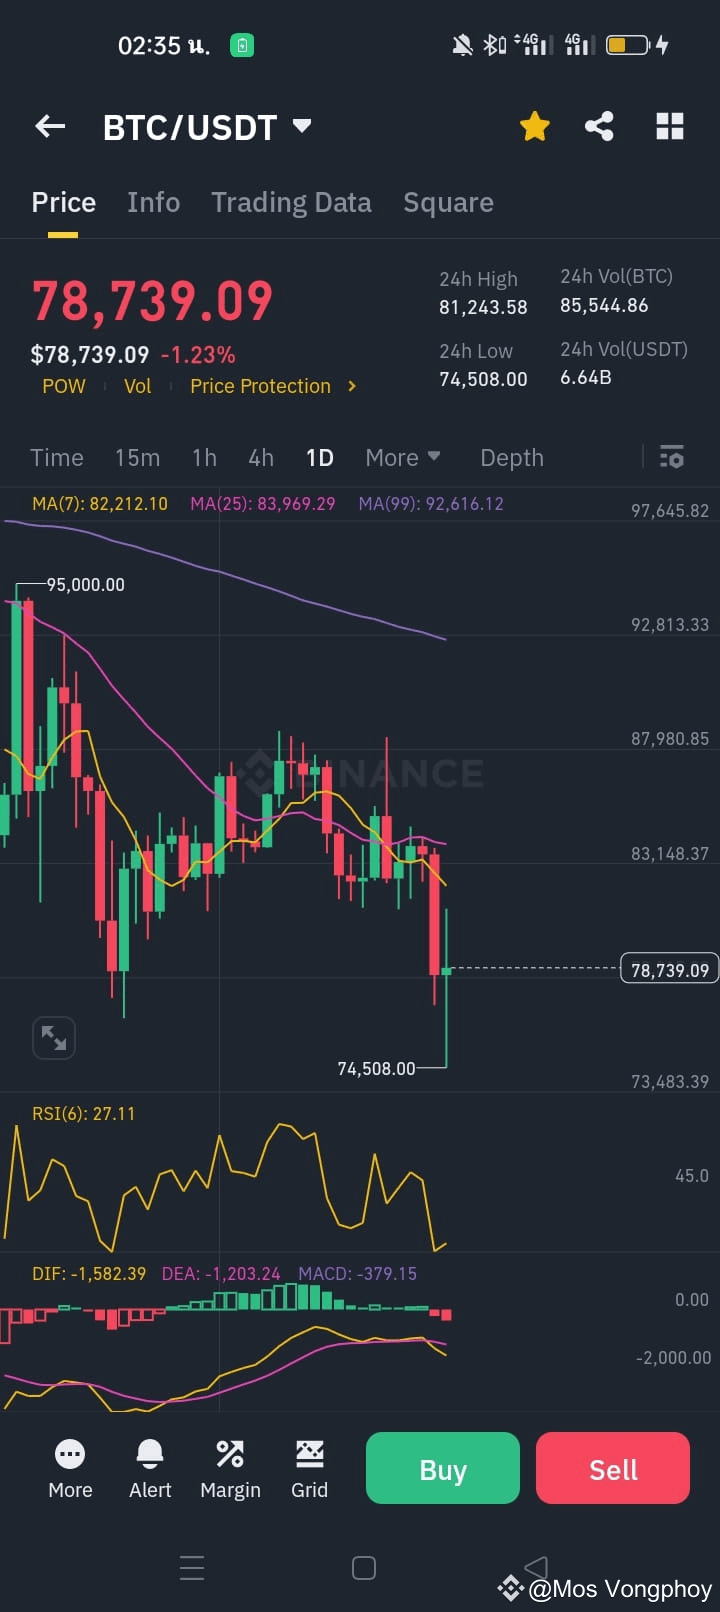
From the BTC/USDT daily chart you provided:
Current price is around 78,739 USDT, down -1.23%
Recently dropped to a low of 74,508 USDT before a small rebound
RSI is at 27.11, in the oversold zone (a short-term rebound is possible but no clear reversal signal yet)
MACD is negative and DIF is below DEA, indicating the bearish trend is still ongoing
The price is below all key moving averages (MA7, MA25, MA99), which confirms a bearish outlook
Conclusion for tomorrow:
There is a chance the price could drop further, especially if it breaks below the 74,500 support level.
However, due to the low RSI, a short-term bounce might also occur.
From the BTC/USDT daily chart you provided:
Current price is around 78,739 USDT, down -1.23%
Recently dropped to a low of 74,508 USDT before a small rebound
RSI is at 27.11, in the oversold zone (a short-term rebound is possible but no clear reversal signal yet)
MACD is negative and DIF is below DEA, indicating the bearish trend is still ongoing
The price is below all key moving averages (MA7, MA25, MA99), which confirms a bearish outlook
Conclusion for tomorrow:
There is a chance the price could drop further, especially if it breaks below the 74,500 support level.
However, due to the low RSI, a short-term bounce might also occur.
Current price is around 78,739 USDT, down -1.23%
Recently dropped to a low of 74,508 USDT before a small rebound
RSI is at 27.11, in the oversold zone (a short-term rebound is possible but no clear reversal signal yet)
MACD is negative and DIF is below DEA, indicating the bearish trend is still ongoing
The price is below all key moving averages (MA7, MA25, MA99), which confirms a bearish outlook
Conclusion for tomorrow:
There is a chance the price could drop further, especially if it breaks below the 74,500 support level.
However, due to the low RSI, a short-term bounce might also occur.
4
·
--
Übersetzung ansehen
$BTC From the BTC/USDT daily chart you provided:
Current price is around 78,739 USDT, down -1.23%
Recently dropped to a low of 74,508 USDT before a small rebound
RSI is at 27.11, in the oversold zone (a short-term rebound is possible but no clear reversal signal yet)
MACD is negative and DIF is below DEA, indicating the bearish trend is still ongoing
The price is below all key moving averages (MA7, MA25, MA99), which confirms a bearish outlook
Conclusion for tomorrow:
There is a chance the price could drop further, especially if it breaks below the 74,500 support level.
However, due to the low RSI, a short-term bounce might also occur.
$BTC From the BTC/USDT daily chart you provided:
Current price is around 78,739 USDT, down -1.23%
Recently dropped to a low of 74,508 USDT before a small rebound
RSI is at 27.11, in the oversold zone (a short-term rebound is possible but no clear reversal signal yet)
MACD is negative and DIF is below DEA, indicating the bearish trend is still ongoing
The price is below all key moving averages (MA7, MA25, MA99), which confirms a bearish outlook
Conclusion for tomorrow:
There is a chance the price could drop further, especially if it breaks below the 74,500 support level.
However, due to the low RSI, a short-term bounce might also occur.
Current price is around 78,739 USDT, down -1.23%
Recently dropped to a low of 74,508 USDT before a small rebound
RSI is at 27.11, in the oversold zone (a short-term rebound is possible but no clear reversal signal yet)
MACD is negative and DIF is below DEA, indicating the bearish trend is still ongoing
The price is below all key moving averages (MA7, MA25, MA99), which confirms a bearish outlook
Conclusion for tomorrow:
There is a chance the price could drop further, especially if it breaks below the 74,500 support level.
However, due to the low RSI, a short-term bounce might also occur.
3
·
--
Übersetzung ansehen
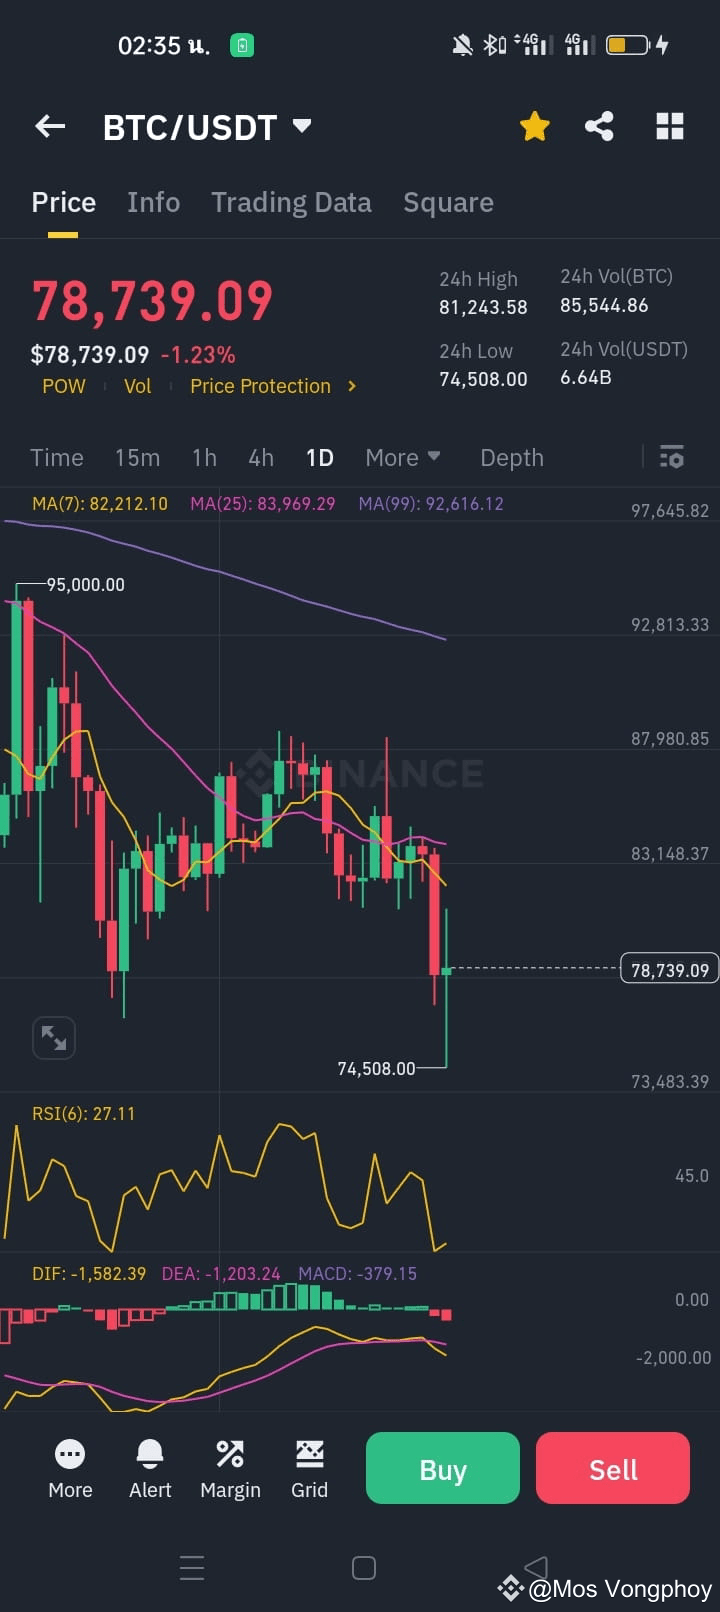
#BTCBelow80K From the BTC/USDT daily chart you provided:
Current price is around 78,739 USDT, down -1.23%
Recently dropped to a low of 74,508 USDT before a small rebound
RSI is at 27.11, in the oversold zone (a short-term rebound is possible but no clear reversal signal yet)
MACD is negative and DIF is below DEA, indicating the bearish trend is still ongoing
The price is below all key moving averages (MA7, MA25, MA99), which confirms a bearish outlook
Conclusion for tomorrow:
There is a chance the price could drop further, especially if it breaks below the 74,500 support level.
However, due to the low RSI, a short-term bounce might also occur.
#BTCBelow80K From the BTC/USDT daily chart you provided:
Current price is around 78,739 USDT, down -1.23%
Recently dropped to a low of 74,508 USDT before a small rebound
RSI is at 27.11, in the oversold zone (a short-term rebound is possible but no clear reversal signal yet)
MACD is negative and DIF is below DEA, indicating the bearish trend is still ongoing
The price is below all key moving averages (MA7, MA25, MA99), which confirms a bearish outlook
Conclusion for tomorrow:
There is a chance the price could drop further, especially if it breaks below the 74,500 support level.
However, due to the low RSI, a short-term bounce might also occur.
Current price is around 78,739 USDT, down -1.23%
Recently dropped to a low of 74,508 USDT before a small rebound
RSI is at 27.11, in the oversold zone (a short-term rebound is possible but no clear reversal signal yet)
MACD is negative and DIF is below DEA, indicating the bearish trend is still ongoing
The price is below all key moving averages (MA7, MA25, MA99), which confirms a bearish outlook
Conclusion for tomorrow:
There is a chance the price could drop further, especially if it breaks below the 74,500 support level.
However, due to the low RSI, a short-term bounce might also occur.
2
·
--
Übersetzung ansehen
#BTCBelow80K From the BTC/USDT daily chart you provided:
Current price is around 78,739 USDT, down -1.23%
Recently dropped to a low of 74,508 USDT before a small rebound
RSI is at 27.11, in the oversold zone (a short-term rebound is possible but no clear reversal signal yet)
MACD is negative and DIF is below DEA, indicating the bearish trend is still ongoing
The price is below all key moving averages (MA7, MA25, MA99), which confirms a bearish outlook
Conclusion for tomorrow:
There is a chance the price could drop further, especially if it breaks below the 74,500 support level.
However, due to the low RSI, a short-term bounce might also occur.
#BTCBelow80K From the BTC/USDT daily chart you provided:
Current price is around 78,739 USDT, down -1.23%
Recently dropped to a low of 74,508 USDT before a small rebound
RSI is at 27.11, in the oversold zone (a short-term rebound is possible but no clear reversal signal yet)
MACD is negative and DIF is below DEA, indicating the bearish trend is still ongoing
The price is below all key moving averages (MA7, MA25, MA99), which confirms a bearish outlook
Conclusion for tomorrow:
There is a chance the price could drop further, especially if it breaks below the 74,500 support level.
However, due to the low RSI, a short-term bounce might also occur.
Current price is around 78,739 USDT, down -1.23%
Recently dropped to a low of 74,508 USDT before a small rebound
RSI is at 27.11, in the oversold zone (a short-term rebound is possible but no clear reversal signal yet)
MACD is negative and DIF is below DEA, indicating the bearish trend is still ongoing
The price is below all key moving averages (MA7, MA25, MA99), which confirms a bearish outlook
Conclusion for tomorrow:
There is a chance the price could drop further, especially if it breaks below the 74,500 support level.
However, due to the low RSI, a short-term bounce might also occur.
248
·
--
Übersetzung ansehen
$BTC Based on the current chart for BTC/USDT, here’s an analysis to help you decide whether to BUY or SELL:
Key Observations:
Current Price: $84,123.79
24h High: $84,720
24h Low: $81,659
Price is near a short-term resistance level.
Moving Averages:
MA(7) (Short-Term): $83,228.58 (Price is above this, showing slight bullish momentum)
MA(25) (Mid-Term): $84,259.52 (Price is just below this, indicating resistance)
MA(99) (Long-Term): $93,049.09 (Far above current price, meaning the long-term trend is still bearish)
RSI (6): 50.79
RSI is neutral, meaning no clear overbought or oversold signal.
MACD Indicator:
MACD is slightly positive (92.87), showing that buying pressure is increasing, but still uncertain.
Decision Guide:
BUY if:
BTC breaks above $84,720 resistance with strong volume.
MACD continues upward and RSI moves above 60 (indicating strong bullish momentum).
BTC maintains price above MA(25) ($84,259) for confirmation.
SELL if:
BTC drops below $81,659, indicating a bearish breakdown.
RSI falls below 40 (showing increasing selling pressure).
MACD crosses downward, showing trend reversal to bearish.
Recommendation:
Short-term traders: Wait for BTC to confirm a breakout above $84,720 before buying.
Long-term investors: If BTC drops near $81,659 - $80,000, it might be a better buying opportunity.
If you already hold BTC: Consider taking partial profit if it struggles to break $84,720.
$BTC Based on the current chart for BTC/USDT, here’s an analysis to help you decide whether to BUY or SELL:
Key Observations:
Current Price: $84,123.79
24h High: $84,720
24h Low: $81,659
Price is near a short-term resistance level.
Moving Averages:
MA(7) (Short-Term): $83,228.58 (Price is above this, showing slight bullish momentum)
MA(25) (Mid-Term): $84,259.52 (Price is just below this, indicating resistance)
MA(99) (Long-Term): $93,049.09 (Far above current price, meaning the long-term trend is still bearish)
RSI (6): 50.79
RSI is neutral, meaning no clear overbought or oversold signal.
MACD Indicator:
MACD is slightly positive (92.87), showing that buying pressure is increasing, but still uncertain.
Decision Guide:
BUY if:
BTC breaks above $84,720 resistance with strong volume.
MACD continues upward and RSI moves above 60 (indicating strong bullish momentum).
BTC maintains price above MA(25) ($84,259) for confirmation.
SELL if:
BTC drops below $81,659, indicating a bearish breakdown.
RSI falls below 40 (showing increasing selling pressure).
MACD crosses downward, showing trend reversal to bearish.
Recommendation:
Short-term traders: Wait for BTC to confirm a breakout above $84,720 before buying.
Long-term investors: If BTC drops near $81,659 - $80,000, it might be a better buying opportunity.
If you already hold BTC: Consider taking partial profit if it struggles to break $84,720.
Key Observations:
Current Price: $84,123.79
24h High: $84,720
24h Low: $81,659
Price is near a short-term resistance level.
Moving Averages:
MA(7) (Short-Term): $83,228.58 (Price is above this, showing slight bullish momentum)
MA(25) (Mid-Term): $84,259.52 (Price is just below this, indicating resistance)
MA(99) (Long-Term): $93,049.09 (Far above current price, meaning the long-term trend is still bearish)
RSI (6): 50.79
RSI is neutral, meaning no clear overbought or oversold signal.
MACD Indicator:
MACD is slightly positive (92.87), showing that buying pressure is increasing, but still uncertain.
Decision Guide:
BUY if:
BTC breaks above $84,720 resistance with strong volume.
MACD continues upward and RSI moves above 60 (indicating strong bullish momentum).
BTC maintains price above MA(25) ($84,259) for confirmation.
SELL if:
BTC drops below $81,659, indicating a bearish breakdown.
RSI falls below 40 (showing increasing selling pressure).
MACD crosses downward, showing trend reversal to bearish.
Recommendation:
Short-term traders: Wait for BTC to confirm a breakout above $84,720 before buying.
Long-term investors: If BTC drops near $81,659 - $80,000, it might be a better buying opportunity.
If you already hold BTC: Consider taking partial profit if it struggles to break $84,720.
264
·
--
Übersetzung ansehen
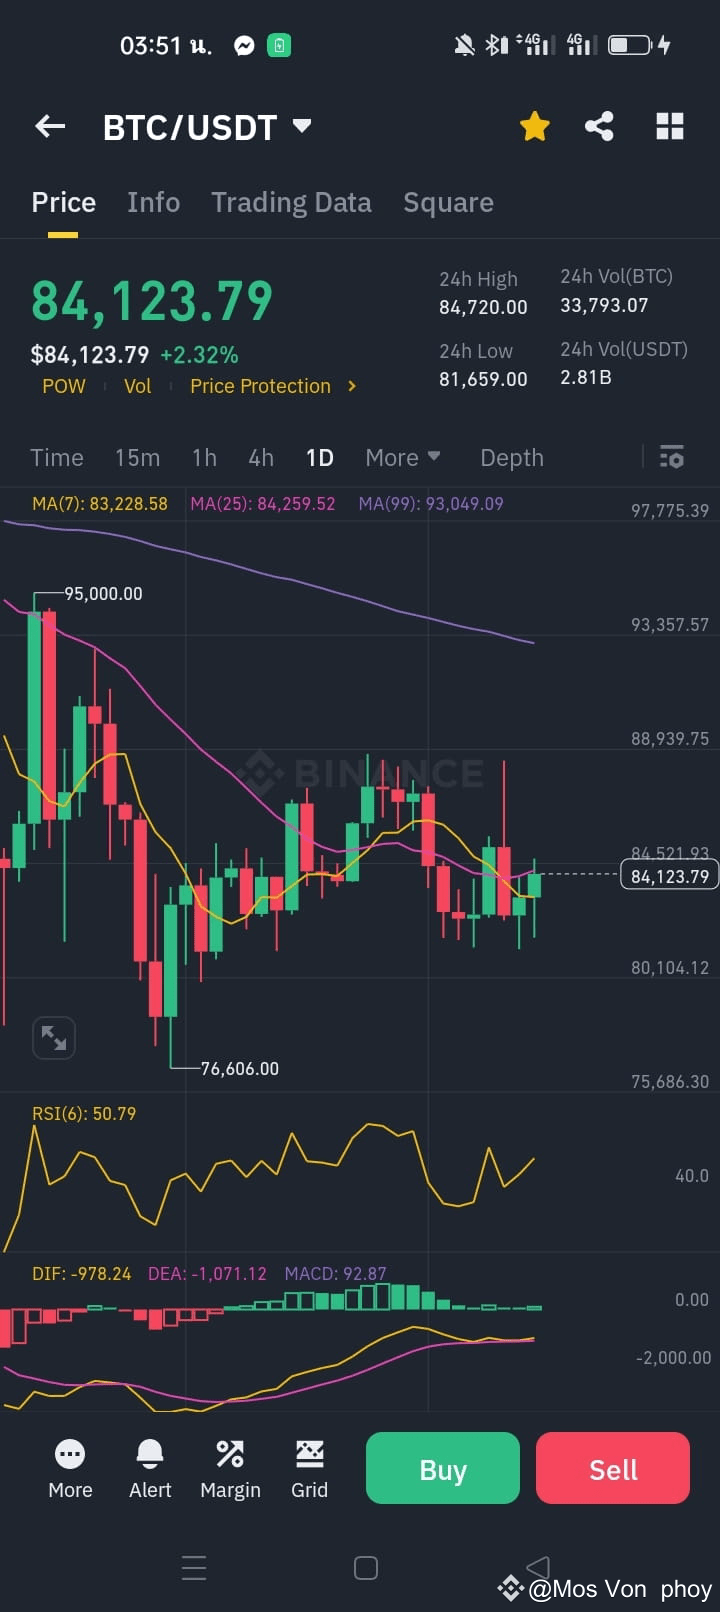
#BinanceEarnYieldArena Based on the current chart for BTC/USDT, here’s an analysis to help you decide whether to BUY or SELL:
Key Observations:
Current Price: $84,123.79
24h High: $84,720
24h Low: $81,659
Price is near a short-term resistance level.
Moving Averages:
MA(7) (Short-Term): $83,228.58 (Price is above this, showing slight bullish momentum)
MA(25) (Mid-Term): $84,259.52 (Price is just below this, indicating resistance)
MA(99) (Long-Term): $93,049.09 (Far above current price, meaning the long-term trend is still bearish)
RSI (6): 50.79
RSI is neutral, meaning no clear overbought or oversold signal.
MACD Indicator:
MACD is slightly positive (92.87), showing that buying pressure is increasing, but still uncertain.
Decision Guide:
BUY if:
BTC breaks above $84,720 resistance with strong volume.
MACD continues upward and RSI moves above 60 (indicating strong bullish momentum).
BTC maintains price above MA(25) ($84,259) for confirmation.
SELL if:
BTC drops below $81,659, indicating a bearish breakdown.
RSI falls below 40 (showing increasing selling pressure).
MACD crosses downward, showing trend reversal to bearish.
Recommendation:
Short-term traders: Wait for BTC to confirm a breakout above $84,720 before buying.
Long-term investors: If BTC drops near $81,659 - $80,000, it might be a better buying opportunity.
If you already hold BTC: Consider taking partial profit if it struggles to break $84,720.
#BinanceEarnYieldArena Based on the current chart for BTC/USDT, here’s an analysis to help you decide whether to BUY or SELL:
Key Observations:
Current Price: $84,123.79
24h High: $84,720
24h Low: $81,659
Price is near a short-term resistance level.
Moving Averages:
MA(7) (Short-Term): $83,228.58 (Price is above this, showing slight bullish momentum)
MA(25) (Mid-Term): $84,259.52 (Price is just below this, indicating resistance)
MA(99) (Long-Term): $93,049.09 (Far above current price, meaning the long-term trend is still bearish)
RSI (6): 50.79
RSI is neutral, meaning no clear overbought or oversold signal.
MACD Indicator:
MACD is slightly positive (92.87), showing that buying pressure is increasing, but still uncertain.
Decision Guide:
BUY if:
BTC breaks above $84,720 resistance with strong volume.
MACD continues upward and RSI moves above 60 (indicating strong bullish momentum).
BTC maintains price above MA(25) ($84,259) for confirmation.
SELL if:
BTC drops below $81,659, indicating a bearish breakdown.
RSI falls below 40 (showing increasing selling pressure).
MACD crosses downward, showing trend reversal to bearish.
Recommendation:
Short-term traders: Wait for BTC to confirm a breakout above $84,720 before buying.
Long-term investors: If BTC drops near $81,659 - $80,000, it might be a better buying opportunity.
If you already hold BTC: Consider taking partial profit if it struggles to break $84,720.
Key Observations:
Current Price: $84,123.79
24h High: $84,720
24h Low: $81,659
Price is near a short-term resistance level.
Moving Averages:
MA(7) (Short-Term): $83,228.58 (Price is above this, showing slight bullish momentum)
MA(25) (Mid-Term): $84,259.52 (Price is just below this, indicating resistance)
MA(99) (Long-Term): $93,049.09 (Far above current price, meaning the long-term trend is still bearish)
RSI (6): 50.79
RSI is neutral, meaning no clear overbought or oversold signal.
MACD Indicator:
MACD is slightly positive (92.87), showing that buying pressure is increasing, but still uncertain.
Decision Guide:
BUY if:
BTC breaks above $84,720 resistance with strong volume.
MACD continues upward and RSI moves above 60 (indicating strong bullish momentum).
BTC maintains price above MA(25) ($84,259) for confirmation.
SELL if:
BTC drops below $81,659, indicating a bearish breakdown.
RSI falls below 40 (showing increasing selling pressure).
MACD crosses downward, showing trend reversal to bearish.
Recommendation:
Short-term traders: Wait for BTC to confirm a breakout above $84,720 before buying.
Long-term investors: If BTC drops near $81,659 - $80,000, it might be a better buying opportunity.
If you already hold BTC: Consider taking partial profit if it struggles to break $84,720.
396
·
--
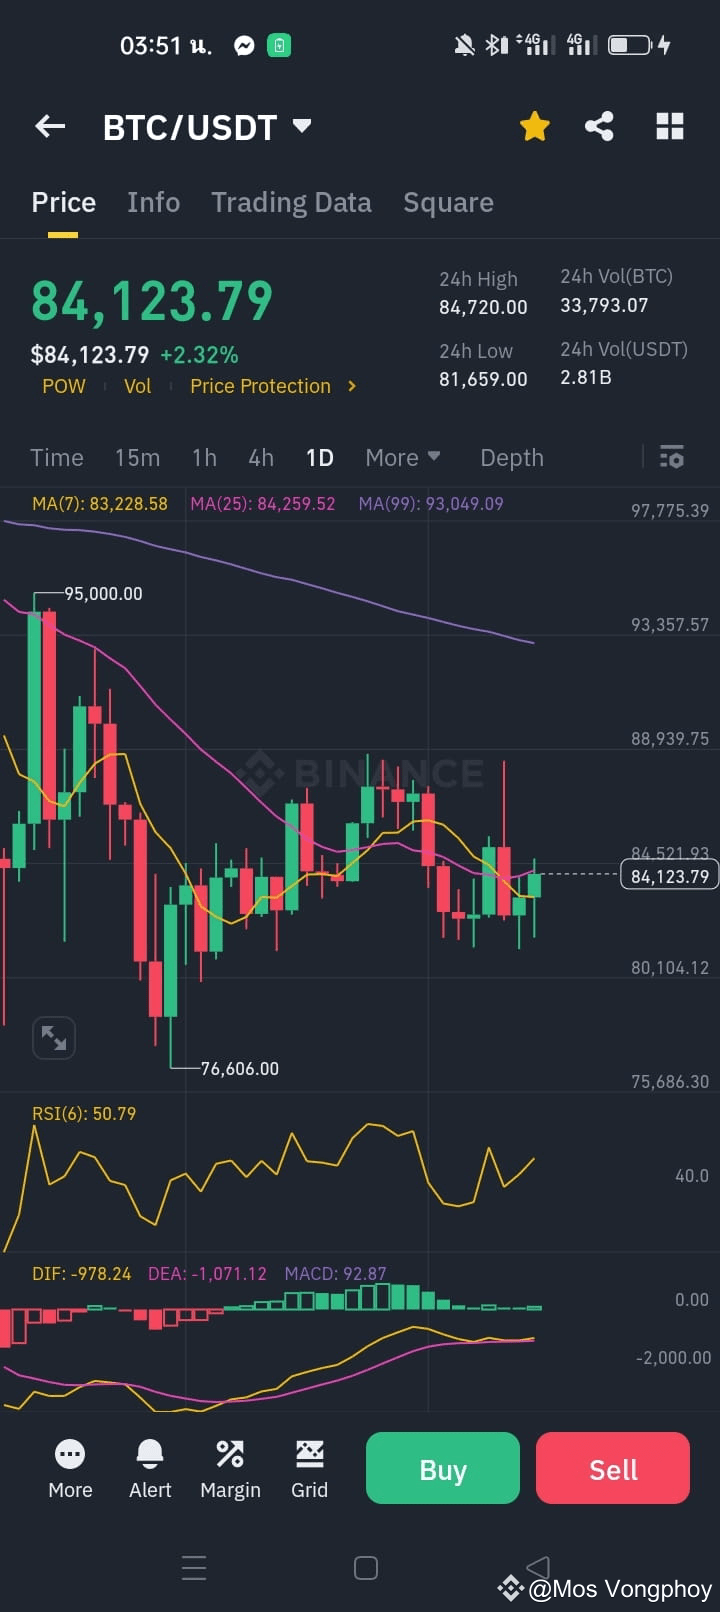
Basierend auf dem aktuellen Chart für BTC/USDT, hier ist eine Analyse, die Ihnen helfen soll, zu entscheiden, ob Sie KAUFEN oder VERKAUFEN sollen:
Wesentliche Beobachtungen:
1. Aktueller Preis: $84,123.79
24h Hoch: $84,720
24h Tief: $81,659
Der Preis liegt nahe einem kurzfristigen Widerstandsniveau.
2. Gleitende Durchschnitte:
MA(7) (Kurzfristig): $83,228.58 (Der Preis liegt darüber, was eine leichte bullische Tendenz zeigt)
MA(25) (Mittelfristig): $84,259.52 (Der Preis liegt knapp darunter, was auf Widerstand hinweist)
MA(99) (Langfristig): $93,049.09 (Weit über dem aktuellen Preis, was bedeutet, dass der langfristige Trend weiterhin bärisch ist)
3. RSI (6): 50.79
RSI ist neutral, was bedeutet, dass es kein klares Signal für Überkauft oder Überverkauft gibt.
4. MACD-Indikator:
MACD ist leicht positiv (92.87), was zeigt, dass der Kaufdruck zunimmt, aber immer noch unsicher ist.
Entscheidungsleitfaden:
KAUFEN, wenn:
BTC über die Widerstandsmarke von $84,720 mit starkem Volumen ausbricht.
MACD weiterhin nach oben zeigt und RSI über 60 steigt (was auf starke bullische Tendenz hinweist).
BTC den Preis über MA(25) ($84,259) zur Bestätigung hält.
VERKAUFEN, wenn:
BTC unter $81,659 fällt, was auf einen bärischen Ausbruch hinweist.
RSI unter 40 fällt (was auf zunehmenden Verkaufsdruck hinweist).
MACD nach unten kreuzt und einen Trendwechsel zu bärisch zeigt.
Empfehlung:
Kurzfristige Trader: Warten Sie darauf, dass BTC einen Ausbruch über $84,720 bestätigt, bevor Sie kaufen.
Langfristige Investoren: Wenn BTC in die Nähe von $81,659 - $80,000 fällt, könnte das eine bessere Kaufgelegenheit sein.
Wenn Sie bereits BTC besitzen: Erwägen Sie, Teilgewinne mitzunehmen, wenn es Schwierigkeiten hat, $84,720 zu durchbrechen.
Basierend auf dem aktuellen Chart für BTC/USDT, hier ist eine Analyse, die Ihnen helfen soll, zu entscheiden, ob Sie KAUFEN oder VERKAUFEN sollen:
Wesentliche Beobachtungen:
1. Aktueller Preis: $84,123.79
24h Hoch: $84,720
24h Tief: $81,659
Der Preis liegt nahe einem kurzfristigen Widerstandsniveau.
2. Gleitende Durchschnitte:
MA(7) (Kurzfristig): $83,228.58 (Der Preis liegt darüber, was eine leichte bullische Tendenz zeigt)
MA(25) (Mittelfristig): $84,259.52 (Der Preis liegt knapp darunter, was auf Widerstand hinweist)
MA(99) (Langfristig): $93,049.09 (Weit über dem aktuellen Preis, was bedeutet, dass der langfristige Trend weiterhin bärisch ist)
3. RSI (6): 50.79
RSI ist neutral, was bedeutet, dass es kein klares Signal für Überkauft oder Überverkauft gibt.
4. MACD-Indikator:
MACD ist leicht positiv (92.87), was zeigt, dass der Kaufdruck zunimmt, aber immer noch unsicher ist.
Entscheidungsleitfaden:
KAUFEN, wenn:
BTC über die Widerstandsmarke von $84,720 mit starkem Volumen ausbricht.
MACD weiterhin nach oben zeigt und RSI über 60 steigt (was auf starke bullische Tendenz hinweist).
BTC den Preis über MA(25) ($84,259) zur Bestätigung hält.
VERKAUFEN, wenn:
BTC unter $81,659 fällt, was auf einen bärischen Ausbruch hinweist.
RSI unter 40 fällt (was auf zunehmenden Verkaufsdruck hinweist).
MACD nach unten kreuzt und einen Trendwechsel zu bärisch zeigt.
Empfehlung:
Kurzfristige Trader: Warten Sie darauf, dass BTC einen Ausbruch über $84,720 bestätigt, bevor Sie kaufen.
Langfristige Investoren: Wenn BTC in die Nähe von $81,659 - $80,000 fällt, könnte das eine bessere Kaufgelegenheit sein.
Wenn Sie bereits BTC besitzen: Erwägen Sie, Teilgewinne mitzunehmen, wenn es Schwierigkeiten hat, $84,720 zu durchbrechen.
Wesentliche Beobachtungen:
1. Aktueller Preis: $84,123.79
24h Hoch: $84,720
24h Tief: $81,659
Der Preis liegt nahe einem kurzfristigen Widerstandsniveau.
2. Gleitende Durchschnitte:
MA(7) (Kurzfristig): $83,228.58 (Der Preis liegt darüber, was eine leichte bullische Tendenz zeigt)
MA(25) (Mittelfristig): $84,259.52 (Der Preis liegt knapp darunter, was auf Widerstand hinweist)
MA(99) (Langfristig): $93,049.09 (Weit über dem aktuellen Preis, was bedeutet, dass der langfristige Trend weiterhin bärisch ist)
3. RSI (6): 50.79
RSI ist neutral, was bedeutet, dass es kein klares Signal für Überkauft oder Überverkauft gibt.
4. MACD-Indikator:
MACD ist leicht positiv (92.87), was zeigt, dass der Kaufdruck zunimmt, aber immer noch unsicher ist.
Entscheidungsleitfaden:
KAUFEN, wenn:
BTC über die Widerstandsmarke von $84,720 mit starkem Volumen ausbricht.
MACD weiterhin nach oben zeigt und RSI über 60 steigt (was auf starke bullische Tendenz hinweist).
BTC den Preis über MA(25) ($84,259) zur Bestätigung hält.
VERKAUFEN, wenn:
BTC unter $81,659 fällt, was auf einen bärischen Ausbruch hinweist.
RSI unter 40 fällt (was auf zunehmenden Verkaufsdruck hinweist).
MACD nach unten kreuzt und einen Trendwechsel zu bärisch zeigt.
Empfehlung:
Kurzfristige Trader: Warten Sie darauf, dass BTC einen Ausbruch über $84,720 bestätigt, bevor Sie kaufen.
Langfristige Investoren: Wenn BTC in die Nähe von $81,659 - $80,000 fällt, könnte das eine bessere Kaufgelegenheit sein.
Wenn Sie bereits BTC besitzen: Erwägen Sie, Teilgewinne mitzunehmen, wenn es Schwierigkeiten hat, $84,720 zu durchbrechen.
2
282
·
--
Artikel
Übersetzung ansehen
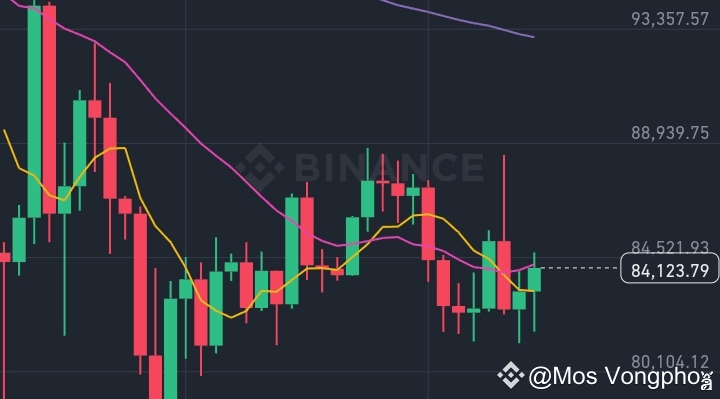
Bitcoin to dayจากกราฟที่แสดงในแอป Binance และปัจจัยทางเทคนิค มีหลายจุดที่น่าสนใจ:
แนวโน้มระยะสั้นของ BTC/USDT
เส้นค่าเฉลี่ยเคลื่อนที่ (MA)
MA(7) = 83,228.58 (เส้นค่าเฉลี่ยระยะสั้น)
MA(25) = 84,259.52 (เส้นค่าเฉลี่ยระยะกลาง)
MA(99) = 93,049.09 (เส้นค่าเฉลี่ยระยะยาว)
ราคาปัจจุบัน (84,123.79) อยู่ใกล้ MA(25) ซึ่งหมายความว่าแนวต้านสำคัญอาจอยู่ที่ 84,259.52 และถ้าสามารถทะลุผ่านไปได้ อาจมีโอกาสขึ้นต่อไปใกล้ MA(99)
แนวรับและแนวต้าน
แนวรับที่สำคัญ: 81,659.00 (จุดต่ำสุดใน 24 ชั่วโมง)
แนวต้านที่สำคัญ: 84,720.00 (จุดสูงสุดใน 24 ชั่วโมง)
หากราคาสามารถยืนเหนือ 84,720 ได้ อาจมีแนวโน้มขาขึ้น
ตัวบ่งชี้ทางเทคนิค
RSI (6) = 50.79 -> ค่ากลาง แสดงว่าตลาดไม่มีภาวะซื้อมากเกินไปหรือขายมากเกินไป
MACD -> มีการตัดกันของเส้น DIF และ DEA ซึ่งอาจบ่งชี้ถึงแนวโน้มขาขึ้นหรือแรงซื้อที่เริ่มกลับมา
Volume -> ปริมาณการซื้อขายยังคงสูง แสดงให้เห็นถึงความสนใจของนักลงทุน
ปัจจัยเศรษฐกิจที่อาจมีผลต่อราคา BTC ในเดือนนี้
ตัวเลขเงินเฟ้อและการตัดสินใจของ Fed
หากธนาคารกลางสหรัฐ (Fed) มีแนวโน้มชะลอการขึ้นดอกเบี้ย อาจส่งผลบวกต่อ BTC เพราะนักลงทุนจะกลับเข้าสู่สินทรัพย์เสี่ยง
ตลาดหุ้นและเศรษฐกิจโลก
หากตลาดหุ้นปรับตัวดีขึ้นและเศรษฐกิจเริ่มฟื้นตัว อาจมีแรงหนุนให้ BTC ปรับขึ้น
เหตุการณ์สำคัญในวงการคริปโต
เช่น การอนุมัติ Bitcoin ETF เพิ่มเติม หรือเหตุการณ์การลดอัตราการขุด (Halving) ที่ใกล้เข้ามา อาจทำให้เกิดแรงซื้อเพิ่มขึ้น
สรุปแนวโน้ม
หาก BTC สามารถทะลุแนวต้าน 84,720 ได้ มีโอกาสขึ้นไปทดสอบระดับ 88,000 - 90,000
ถ้าหลุด 81,659 อาจลงไปทดสอบแนวรับที่ 80,000
Bitcoin to day
จากกราฟที่แสดงในแอป Binance และปัจจัยทางเทคนิค มีหลายจุดที่น่าสนใจ:
แนวโน้มระยะสั้นของ BTC/USDT
เส้นค่าเฉลี่ยเคลื่อนที่ (MA)
MA(7) = 83,228.58 (เส้นค่าเฉลี่ยระยะสั้น)
MA(25) = 84,259.52 (เส้นค่าเฉลี่ยระยะกลาง)
MA(99) = 93,049.09 (เส้นค่าเฉลี่ยระยะยาว)
ราคาปัจจุบัน (84,123.79) อยู่ใกล้ MA(25) ซึ่งหมายความว่าแนวต้านสำคัญอาจอยู่ที่ 84,259.52 และถ้าสามารถทะลุผ่านไปได้ อาจมีโอกาสขึ้นต่อไปใกล้ MA(99)
แนวรับและแนวต้าน
แนวรับที่สำคัญ: 81,659.00 (จุดต่ำสุดใน 24 ชั่วโมง)
แนวต้านที่สำคัญ: 84,720.00 (จุดสูงสุดใน 24 ชั่วโมง)
หากราคาสามารถยืนเหนือ 84,720 ได้ อาจมีแนวโน้มขาขึ้น
ตัวบ่งชี้ทางเทคนิค
RSI (6) = 50.79 -> ค่ากลาง แสดงว่าตลาดไม่มีภาวะซื้อมากเกินไปหรือขายมากเกินไป
MACD -> มีการตัดกันของเส้น DIF และ DEA ซึ่งอาจบ่งชี้ถึงแนวโน้มขาขึ้นหรือแรงซื้อที่เริ่มกลับมา
Volume -> ปริมาณการซื้อขายยังคงสูง แสดงให้เห็นถึงความสนใจของนักลงทุน
ปัจจัยเศรษฐกิจที่อาจมีผลต่อราคา BTC ในเดือนนี้
ตัวเลขเงินเฟ้อและการตัดสินใจของ Fed
หากธนาคารกลางสหรัฐ (Fed) มีแนวโน้มชะลอการขึ้นดอกเบี้ย อาจส่งผลบวกต่อ BTC เพราะนักลงทุนจะกลับเข้าสู่สินทรัพย์เสี่ยง
ตลาดหุ้นและเศรษฐกิจโลก
หากตลาดหุ้นปรับตัวดีขึ้นและเศรษฐกิจเริ่มฟื้นตัว อาจมีแรงหนุนให้ BTC ปรับขึ้น
เหตุการณ์สำคัญในวงการคริปโต
เช่น การอนุมัติ Bitcoin ETF เพิ่มเติม หรือเหตุการณ์การลดอัตราการขุด (Halving) ที่ใกล้เข้ามา อาจทำให้เกิดแรงซื้อเพิ่มขึ้น
สรุปแนวโน้ม
หาก BTC สามารถทะลุแนวต้าน 84,720 ได้ มีโอกาสขึ้นไปทดสอบระดับ 88,000 - 90,000
ถ้าหลุด 81,659 อาจลงไปทดสอบแนวรับที่ 80,000
แนวโน้มระยะสั้นของ BTC/USDT
เส้นค่าเฉลี่ยเคลื่อนที่ (MA)
MA(7) = 83,228.58 (เส้นค่าเฉลี่ยระยะสั้น)
MA(25) = 84,259.52 (เส้นค่าเฉลี่ยระยะกลาง)
MA(99) = 93,049.09 (เส้นค่าเฉลี่ยระยะยาว)
ราคาปัจจุบัน (84,123.79) อยู่ใกล้ MA(25) ซึ่งหมายความว่าแนวต้านสำคัญอาจอยู่ที่ 84,259.52 และถ้าสามารถทะลุผ่านไปได้ อาจมีโอกาสขึ้นต่อไปใกล้ MA(99)
แนวรับและแนวต้าน
แนวรับที่สำคัญ: 81,659.00 (จุดต่ำสุดใน 24 ชั่วโมง)
แนวต้านที่สำคัญ: 84,720.00 (จุดสูงสุดใน 24 ชั่วโมง)
หากราคาสามารถยืนเหนือ 84,720 ได้ อาจมีแนวโน้มขาขึ้น
ตัวบ่งชี้ทางเทคนิค
RSI (6) = 50.79 -> ค่ากลาง แสดงว่าตลาดไม่มีภาวะซื้อมากเกินไปหรือขายมากเกินไป
MACD -> มีการตัดกันของเส้น DIF และ DEA ซึ่งอาจบ่งชี้ถึงแนวโน้มขาขึ้นหรือแรงซื้อที่เริ่มกลับมา
Volume -> ปริมาณการซื้อขายยังคงสูง แสดงให้เห็นถึงความสนใจของนักลงทุน
ปัจจัยเศรษฐกิจที่อาจมีผลต่อราคา BTC ในเดือนนี้
ตัวเลขเงินเฟ้อและการตัดสินใจของ Fed
หากธนาคารกลางสหรัฐ (Fed) มีแนวโน้มชะลอการขึ้นดอกเบี้ย อาจส่งผลบวกต่อ BTC เพราะนักลงทุนจะกลับเข้าสู่สินทรัพย์เสี่ยง
ตลาดหุ้นและเศรษฐกิจโลก
หากตลาดหุ้นปรับตัวดีขึ้นและเศรษฐกิจเริ่มฟื้นตัว อาจมีแรงหนุนให้ BTC ปรับขึ้น
เหตุการณ์สำคัญในวงการคริปโต
เช่น การอนุมัติ Bitcoin ETF เพิ่มเติม หรือเหตุการณ์การลดอัตราการขุด (Halving) ที่ใกล้เข้ามา อาจทำให้เกิดแรงซื้อเพิ่มขึ้น
สรุปแนวโน้ม
หาก BTC สามารถทะลุแนวต้าน 84,720 ได้ มีโอกาสขึ้นไปทดสอบระดับ 88,000 - 90,000
ถ้าหลุด 81,659 อาจลงไปทดสอบแนวรับที่ 80,000
1
100
·
--
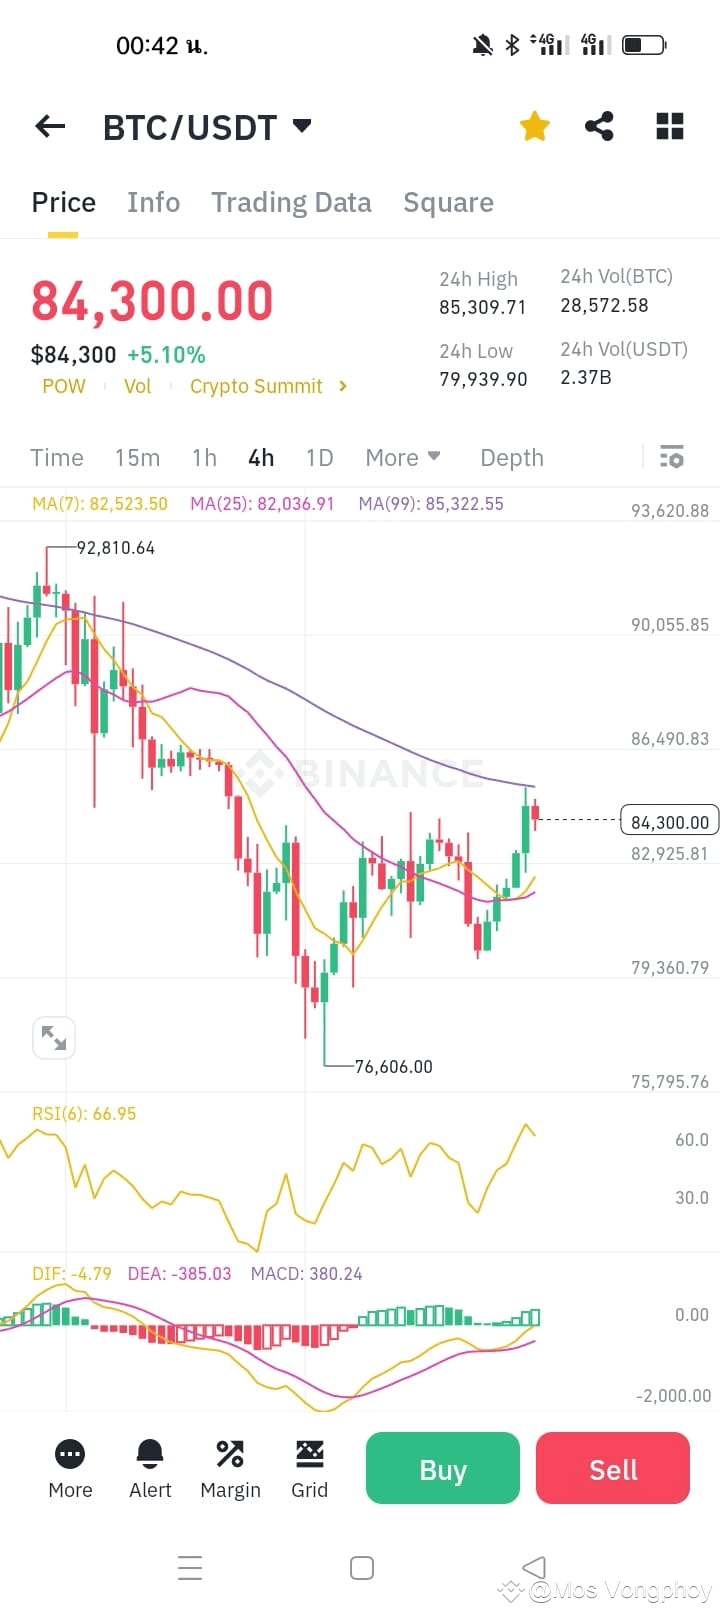
Basierend auf dem Diagramm befindet sich Bitcoin (BTC) derzeit bei 84.300 $, mit einem Aufwärtstrend von 5,10 %. Das 24-Stunden-Hoch liegt bei 85.309,71 $ und das Tief bei 79.939,90 $. Technische Indikatoren wie der RSI (66,95) deuten auf einen starken Momentum hin, während der Preis sich dem 99-Perioden gleitenden Durchschnitt (85.322,55 $) nähert.
Damit Bitcoin 100.000 $ erreicht, muss es wichtige Widerstandsniveaus um 86.500 $ und 90.000 $ durchbrechen. Wenn der bullische Momentum anhält und BTC die Unterstützung über 80.000 $ aufrechterhält, hat es das Potenzial, neue Höchststände zu testen. Allerdings werden die Marktbedingungen und externe Faktoren wie makroökonomische Trends und die Anlegerstimmung eine entscheidende Rolle spielen.#BTC #Binance
Basierend auf dem Diagramm befindet sich Bitcoin (BTC) derzeit bei 84.300 $, mit einem Aufwärtstrend von 5,10 %. Das 24-Stunden-Hoch liegt bei 85.309,71 $ und das Tief bei 79.939,90 $. Technische Indikatoren wie der RSI (66,95) deuten auf einen starken Momentum hin, während der Preis sich dem 99-Perioden gleitenden Durchschnitt (85.322,55 $) nähert.
Damit Bitcoin 100.000 $ erreicht, muss es wichtige Widerstandsniveaus um 86.500 $ und 90.000 $ durchbrechen. Wenn der bullische Momentum anhält und BTC die Unterstützung über 80.000 $ aufrechterhält, hat es das Potenzial, neue Höchststände zu testen. Allerdings werden die Marktbedingungen und externe Faktoren wie makroökonomische Trends und die Anlegerstimmung eine entscheidende Rolle spielen.#BTC #Binance
Damit Bitcoin 100.000 $ erreicht, muss es wichtige Widerstandsniveaus um 86.500 $ und 90.000 $ durchbrechen. Wenn der bullische Momentum anhält und BTC die Unterstützung über 80.000 $ aufrechterhält, hat es das Potenzial, neue Höchststände zu testen. Allerdings werden die Marktbedingungen und externe Faktoren wie makroökonomische Trends und die Anlegerstimmung eine entscheidende Rolle spielen.#BTC #Binance
7
246
·
--
Bärisch
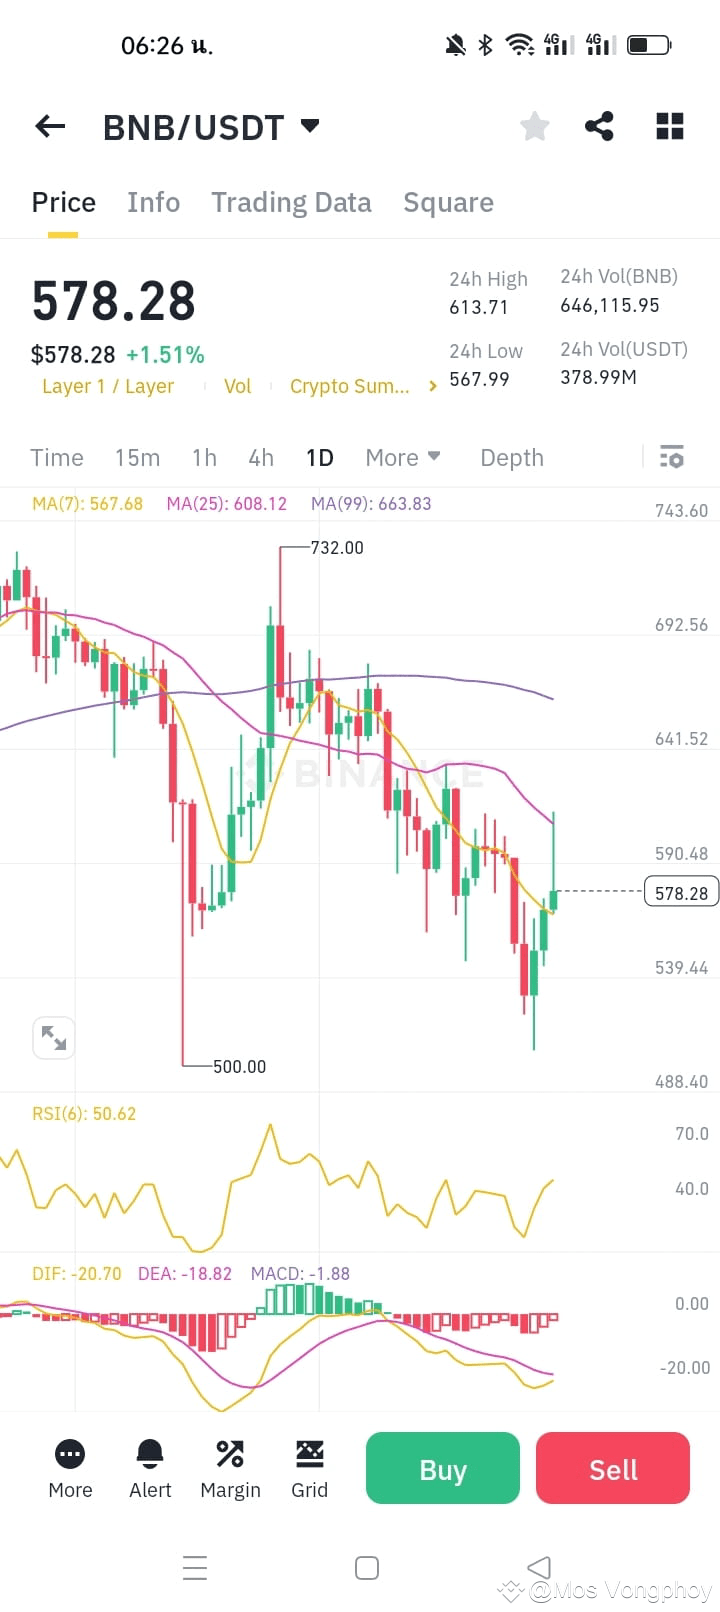
BNB/USDT Preis Trendanalyse
Basierend auf dem Diagramm und den Indikatoren sind hier wichtige Faktoren zu beachten:
Preistrend und gleitende Durchschnitte (MA)
Der aktuelle Preis beträgt 578,28 USDT
Der 7-Tage MA (567,68) liegt unter dem Preis, was auf eine mögliche Erholung hinweist
Allerdings liegen der 25-Tage MA (608,12) und der 99-Tage MA (663,83) höher, was darauf hindeutet, dass der Abwärtstrend weiterhin intakt ist
Unterstützungs- und Widerstandsniveaus
Unterstützung: Etwa 567,99 USDT
Widerstand: Zuerst bei 590,48 USDT, dann bei 608,12 USDT
RSI (Relative Strength Index)
RSI(6) liegt bei 50,62, was neutral ist und keinen starken Kauf- oder Verkaufsdruck anzeigt
MACD (Gleitender Durchschnitt Konvergenz Divergenz)
DIF (-20,70) und DEA (-18,82) liegen unter null, was auf einen langfristigen Abwärtstrend hinweist
MACD (-1,88) beginnt nach oben zu drehen, was auf eine mögliche kurzfristige Erholung hindeutet
Fazit
Es gibt Anzeichen für eine kurzfristige Erholung, da der Preis über den MA7 steigt
Allerdings bleibt der langfristige Trend aufgrund höherer MAs, die nach unten zeigen, bärisch
RSI deutet auf einen neutralen Markt ohne starken Druck hin
Wenn der Preis über 590,48 USDT und MA25 (608,12 USDT) ausbricht, sind weitere Anstiege möglich
Wenn er unter 567,99 USDT fällt, könnte er die Unterstützung um 500 USDT erneut testen$BNB
BNB/USDT Preis Trendanalyse
Basierend auf dem Diagramm und den Indikatoren sind hier wichtige Faktoren zu beachten:
Preistrend und gleitende Durchschnitte (MA)
Der aktuelle Preis beträgt 578,28 USDT
Der 7-Tage MA (567,68) liegt unter dem Preis, was auf eine mögliche Erholung hinweist
Allerdings liegen der 25-Tage MA (608,12) und der 99-Tage MA (663,83) höher, was darauf hindeutet, dass der Abwärtstrend weiterhin intakt ist
Unterstützungs- und Widerstandsniveaus
Unterstützung: Etwa 567,99 USDT
Widerstand: Zuerst bei 590,48 USDT, dann bei 608,12 USDT
RSI (Relative Strength Index)
RSI(6) liegt bei 50,62, was neutral ist und keinen starken Kauf- oder Verkaufsdruck anzeigt
MACD (Gleitender Durchschnitt Konvergenz Divergenz)
DIF (-20,70) und DEA (-18,82) liegen unter null, was auf einen langfristigen Abwärtstrend hinweist
MACD (-1,88) beginnt nach oben zu drehen, was auf eine mögliche kurzfristige Erholung hindeutet
Fazit
Es gibt Anzeichen für eine kurzfristige Erholung, da der Preis über den MA7 steigt
Allerdings bleibt der langfristige Trend aufgrund höherer MAs, die nach unten zeigen, bärisch
RSI deutet auf einen neutralen Markt ohne starken Druck hin
Wenn der Preis über 590,48 USDT und MA25 (608,12 USDT) ausbricht, sind weitere Anstiege möglich
Wenn er unter 567,99 USDT fällt, könnte er die Unterstützung um 500 USDT erneut testen$BNB
Basierend auf dem Diagramm und den Indikatoren sind hier wichtige Faktoren zu beachten:
Preistrend und gleitende Durchschnitte (MA)
Der aktuelle Preis beträgt 578,28 USDT
Der 7-Tage MA (567,68) liegt unter dem Preis, was auf eine mögliche Erholung hinweist
Allerdings liegen der 25-Tage MA (608,12) und der 99-Tage MA (663,83) höher, was darauf hindeutet, dass der Abwärtstrend weiterhin intakt ist
Unterstützungs- und Widerstandsniveaus
Unterstützung: Etwa 567,99 USDT
Widerstand: Zuerst bei 590,48 USDT, dann bei 608,12 USDT
RSI (Relative Strength Index)
RSI(6) liegt bei 50,62, was neutral ist und keinen starken Kauf- oder Verkaufsdruck anzeigt
MACD (Gleitender Durchschnitt Konvergenz Divergenz)
DIF (-20,70) und DEA (-18,82) liegen unter null, was auf einen langfristigen Abwärtstrend hinweist
MACD (-1,88) beginnt nach oben zu drehen, was auf eine mögliche kurzfristige Erholung hindeutet
Fazit
Es gibt Anzeichen für eine kurzfristige Erholung, da der Preis über den MA7 steigt
Allerdings bleibt der langfristige Trend aufgrund höherer MAs, die nach unten zeigen, bärisch
RSI deutet auf einen neutralen Markt ohne starken Druck hin
Wenn der Preis über 590,48 USDT und MA25 (608,12 USDT) ausbricht, sind weitere Anstiege möglich
Wenn er unter 567,99 USDT fällt, könnte er die Unterstützung um 500 USDT erneut testen$BNB
6
334
·
--
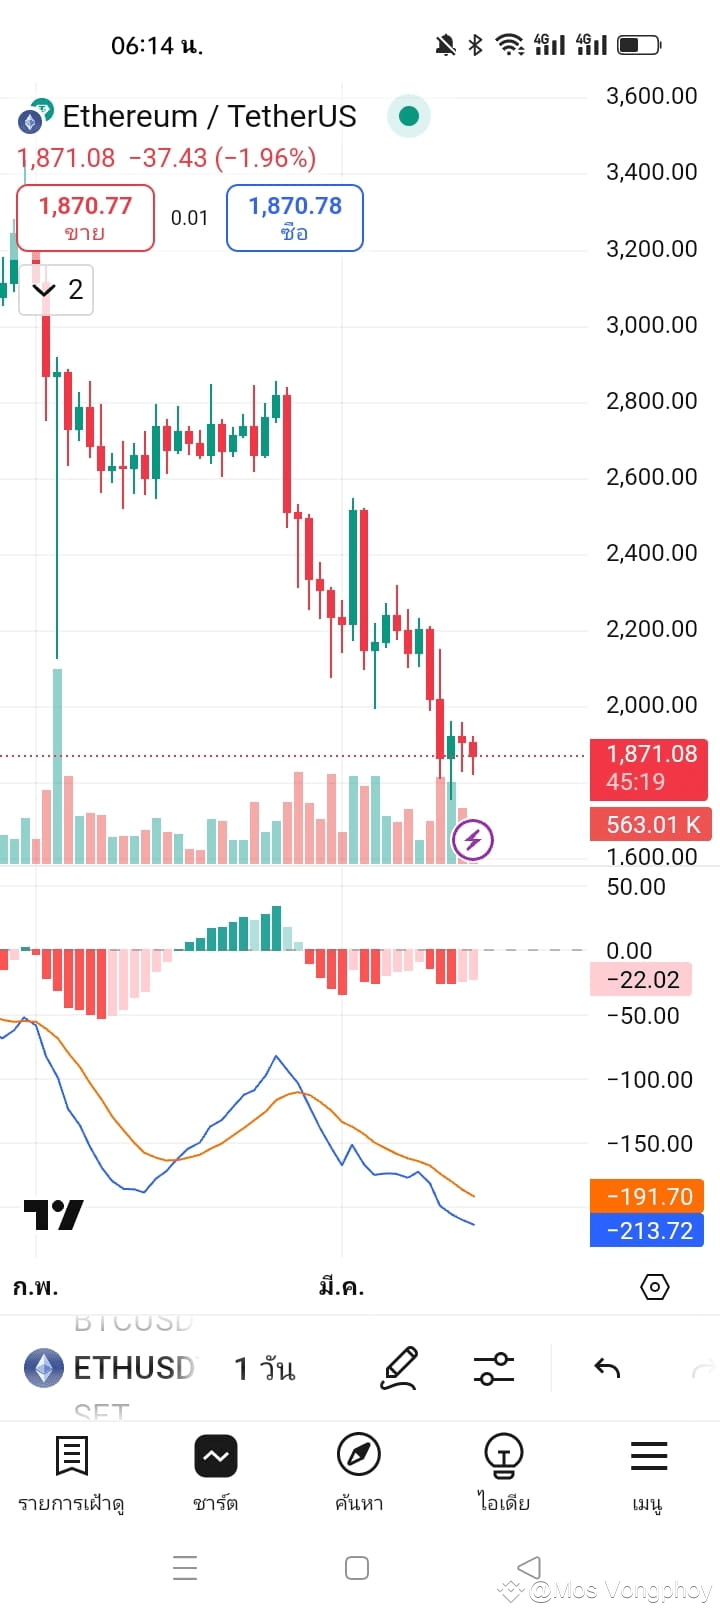
Ethereum (ETH/USDT) Chartanalyse
Wichtige Informationen aus dem Chart:
Preis: $1,871.08 (-1.96%)
Trend: Abwärtstrend (Bärisch)
Wichtige Unterstützungsstufe: Etwa $1,800
Wichtige Widerstandsstufe: Etwa $2,000
Details zur Chartanalyse:
Kerzenchart:
Der Preis ist kontinuierlich gefallen.
Es gibt viele rote Kerzen, die starken Verkaufsdruck anzeigen.
Handelsvolumen:
Das Volumen ist während der Preisrückgänge gestiegen, was auf starken Verkaufsdruck hinweist.
MACD-Indikator:
Die MACD-Linie (blau) liegt unter der Signallinie (orange).
Das Histogramm ist negativ und fällt, was einen bärischen Momentum bestätigt.
Gesamttrend:
Der Preis befindet sich in einem klaren Abwärtstrend.
Es besteht die Möglichkeit, die Unterstützung bei $1,800 zu testen.
Wenn der Preis es nicht schafft, über diesem Niveau zu bleiben, könnte er weiter auf $1,700 oder sogar $1,600 fallen.
Dies deutet auf einen vorsichtigen Ansatz hin, da der Markt starke bärische Signale zeigt.#FollowTheLeadTrader
Ethereum (ETH/USDT) Chartanalyse
Wichtige Informationen aus dem Chart:
Preis: $1,871.08 (-1.96%)
Trend: Abwärtstrend (Bärisch)
Wichtige Unterstützungsstufe: Etwa $1,800
Wichtige Widerstandsstufe: Etwa $2,000
Details zur Chartanalyse:
Kerzenchart:
Der Preis ist kontinuierlich gefallen.
Es gibt viele rote Kerzen, die starken Verkaufsdruck anzeigen.
Handelsvolumen:
Das Volumen ist während der Preisrückgänge gestiegen, was auf starken Verkaufsdruck hinweist.
MACD-Indikator:
Die MACD-Linie (blau) liegt unter der Signallinie (orange).
Das Histogramm ist negativ und fällt, was einen bärischen Momentum bestätigt.
Gesamttrend:
Der Preis befindet sich in einem klaren Abwärtstrend.
Es besteht die Möglichkeit, die Unterstützung bei $1,800 zu testen.
Wenn der Preis es nicht schafft, über diesem Niveau zu bleiben, könnte er weiter auf $1,700 oder sogar $1,600 fallen.
Dies deutet auf einen vorsichtigen Ansatz hin, da der Markt starke bärische Signale zeigt.#FollowTheLeadTrader
Wichtige Informationen aus dem Chart:
Preis: $1,871.08 (-1.96%)
Trend: Abwärtstrend (Bärisch)
Wichtige Unterstützungsstufe: Etwa $1,800
Wichtige Widerstandsstufe: Etwa $2,000
Details zur Chartanalyse:
Kerzenchart:
Der Preis ist kontinuierlich gefallen.
Es gibt viele rote Kerzen, die starken Verkaufsdruck anzeigen.
Handelsvolumen:
Das Volumen ist während der Preisrückgänge gestiegen, was auf starken Verkaufsdruck hinweist.
MACD-Indikator:
Die MACD-Linie (blau) liegt unter der Signallinie (orange).
Das Histogramm ist negativ und fällt, was einen bärischen Momentum bestätigt.
Gesamttrend:
Der Preis befindet sich in einem klaren Abwärtstrend.
Es besteht die Möglichkeit, die Unterstützung bei $1,800 zu testen.
Wenn der Preis es nicht schafft, über diesem Niveau zu bleiben, könnte er weiter auf $1,700 oder sogar $1,600 fallen.
Dies deutet auf einen vorsichtigen Ansatz hin, da der Markt starke bärische Signale zeigt.#FollowTheLeadTrader
9
232
Anmelden und weiter Inhalte entdecken
Krypto-Nutzer weltweit auf Binance Square kennenlernen
⚡️ Bleib in Sachen Krypto stets am Puls.
💬 Die weltgrößte Kryptobörse vertraut darauf.
👍 Erhalte verlässliche Einblicke von verifizierten Creators.
E-Mail-Adresse/Telefonnummer
Trendthemen
AIStocksWhatNext
956,762 Aufrufe
6,875 Kommentare
Teile & gewinne Traffic-Rewards in unserer angesagten Hashtag-Kampagne
✨Thema: Welche anderen Investitionsmöglichkeiten gibt es noch, während KI-Aktien weiter steigen?
👉So machst du mit:
Veröffentliche einen kurzen Beitrag oder Artikel mit dem Hashtag #AIStocksWhatNext
Teile, ob du bullisch oder bärisch bist, und poste deine KI-Aktienbestände oder Trades – die Nutzung des Trade-Widgets kann deine Berechtigung verbessern.
Du kannst deinen Beitrag auch stärken, indem du Daten oder Diagramme teilst und KI-generierte Bilder vermeidest.
✍️Erstelle Inhalte basierend auf den folgenden Blickwinkeln:
- Nvidia sagt, dass sich der Chip-Umsatz im nächsten Jahr verdoppeln wird, und die führenden KI-Unternehmen erreichen weiterhin Rekordumsätze – der Rechenaufwand dahinter ist ebenso beeindruckend. Verläuft die Nachfrage nach KI wirklich gerade erst so richtig, oder geht es nur noch eine Weile weiter? KI-Aktien steigen derzeit branchenweit. Ist das ein echter Ausbruch oder nur ein kurzfristiger Rückprall?
- Branchenführer fordern dazu auf, die Entwicklung von KI zu verlangsamen, während Trump plant, eine „AI Force“ aufzubauen, und behauptet, KI könne in der Zukunft 25% des US-BIP ausmachen. Auf welcher Seite stehst du? Wird staatliche Unterstützung ein langfristiger Gewinn für KI-Aktien sein?
- Kaufst du KI-Aktien? Teile deinen KI-bezogenen Trade/deine Bestände mit unserem Trade-Sharing-Widget.
⏰Kampagnenzeitraum:
- 2026-09-22 7:00 - 2026-09-24 4:00 UTC
🎁Belohnung:
- Qualifizierte Beiträge, die die oben genannten Richtlinien einhalten und mehr als 100 Wörter enthalten, werden überprüft und können möglicherweise einen zufälligen Traffic-Boost von 500 bis 3.000 Views erhalten. Du erhältst eine Benachrichtigung von deiner Feed-Sekretärin, wenn dein Beitrag ausgewählt wurde.
- Erhalte die Chance, dass dein Artikel auf Binance Square Official vorgestellt wird
Brauchst du Ideen für deinen Beitrag? Besuche die Thema-Seite #AIStocksWhatNext oder die Square Guide on How to Post for Better Reach.
Binance Square Official
·603 Likes
·1.7M Aufrufe
BitcoinRejectedAt$87,300Twice
0 Aufrufe
0 Kommentare
BCHJumps28%OnCMEFuturesListing
18,435 Aufrufe
616 Kommentare