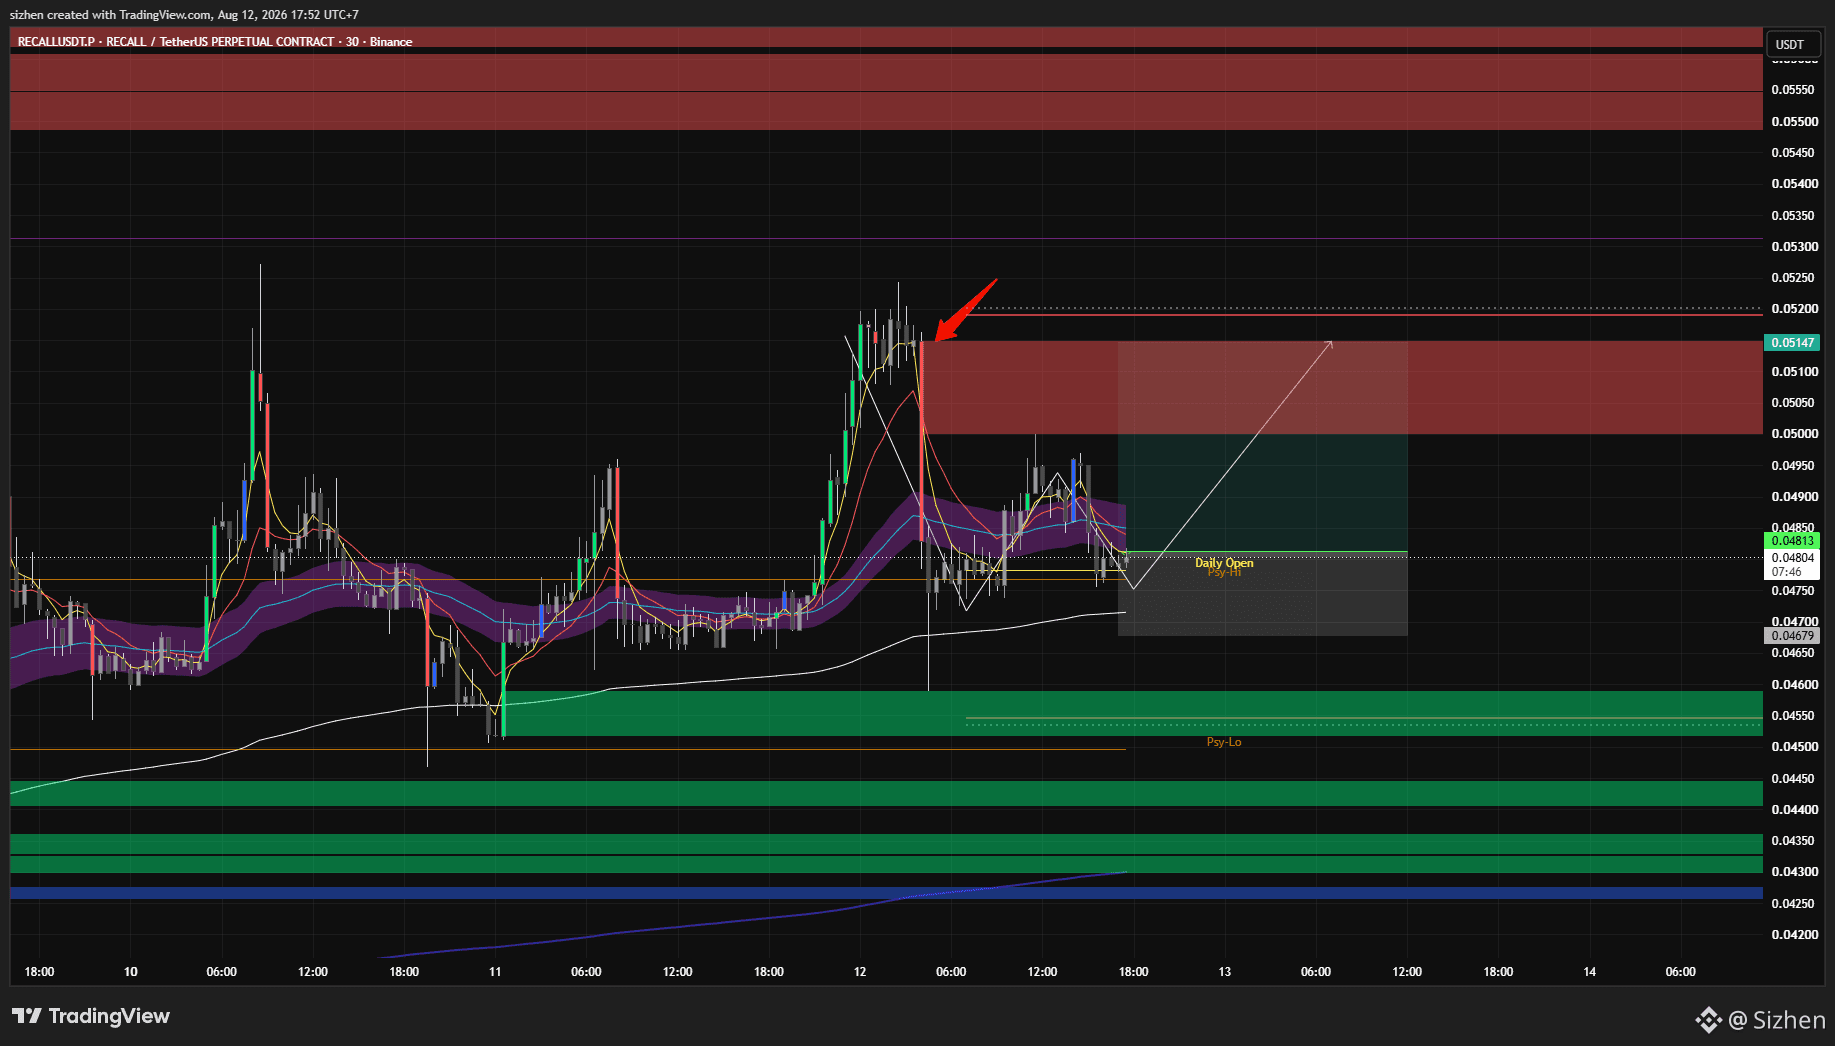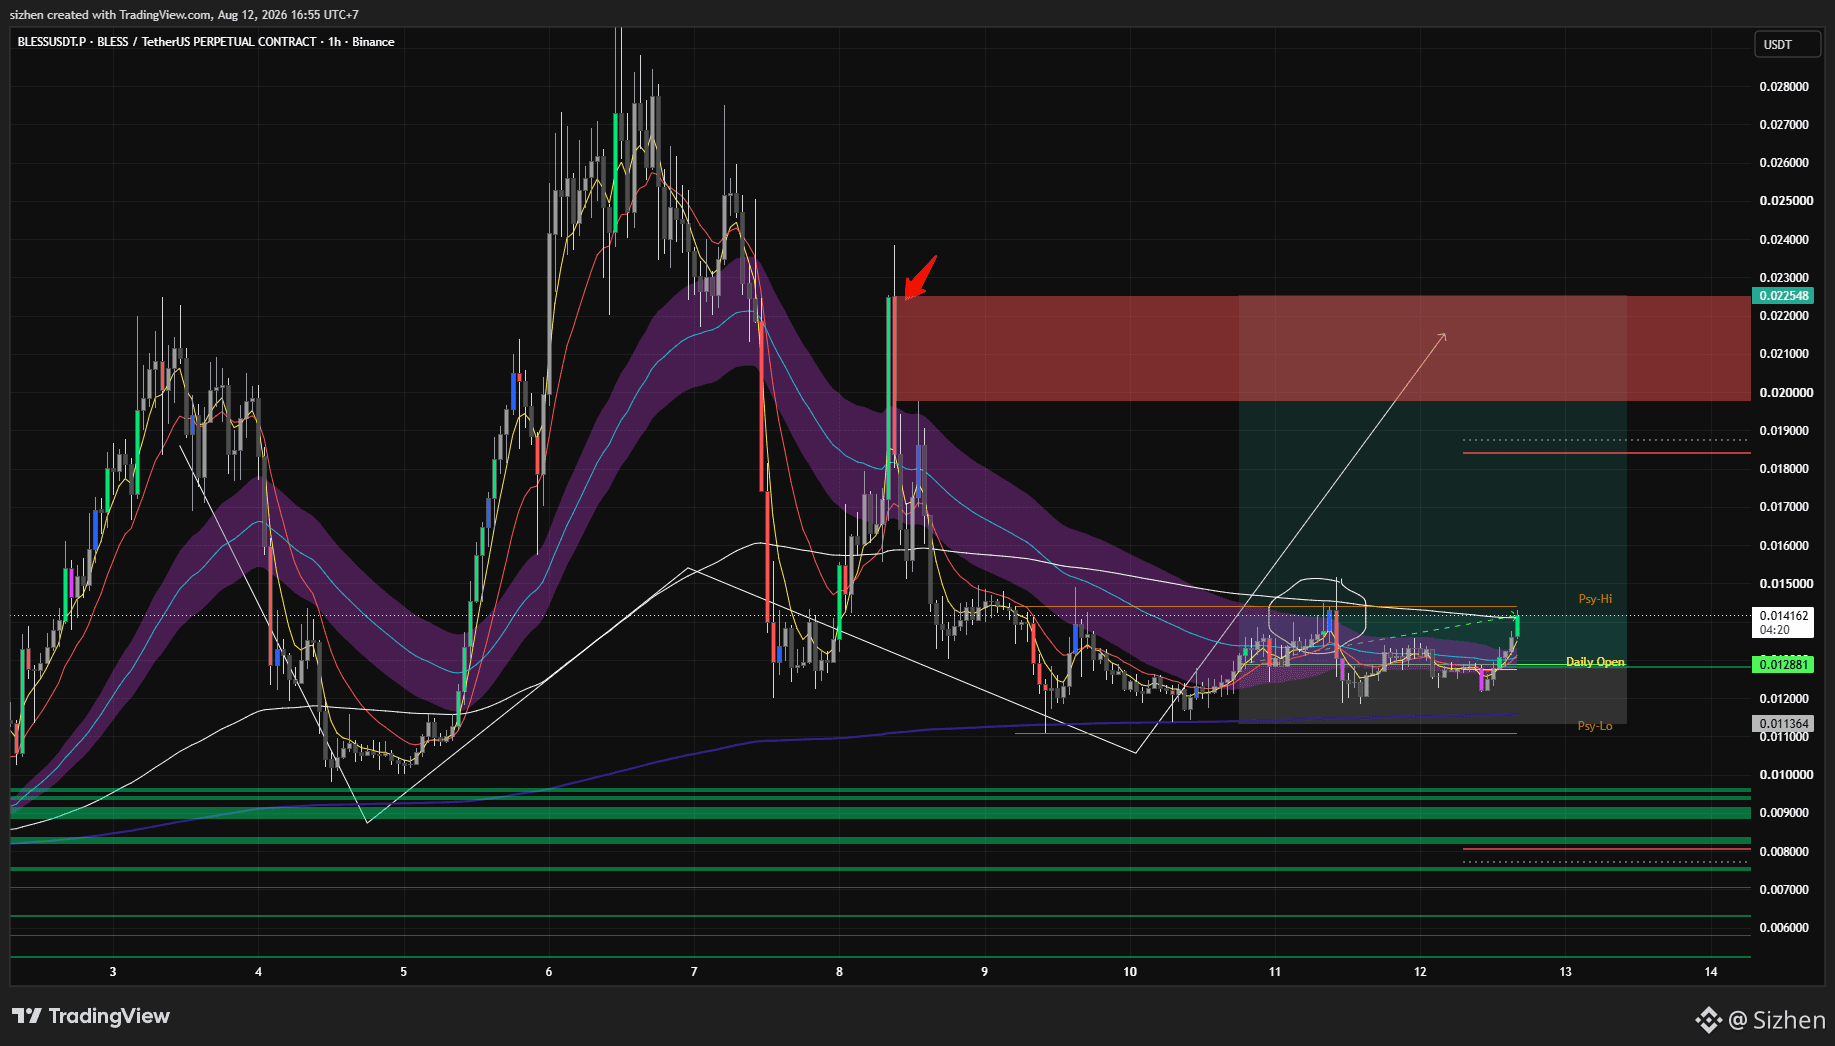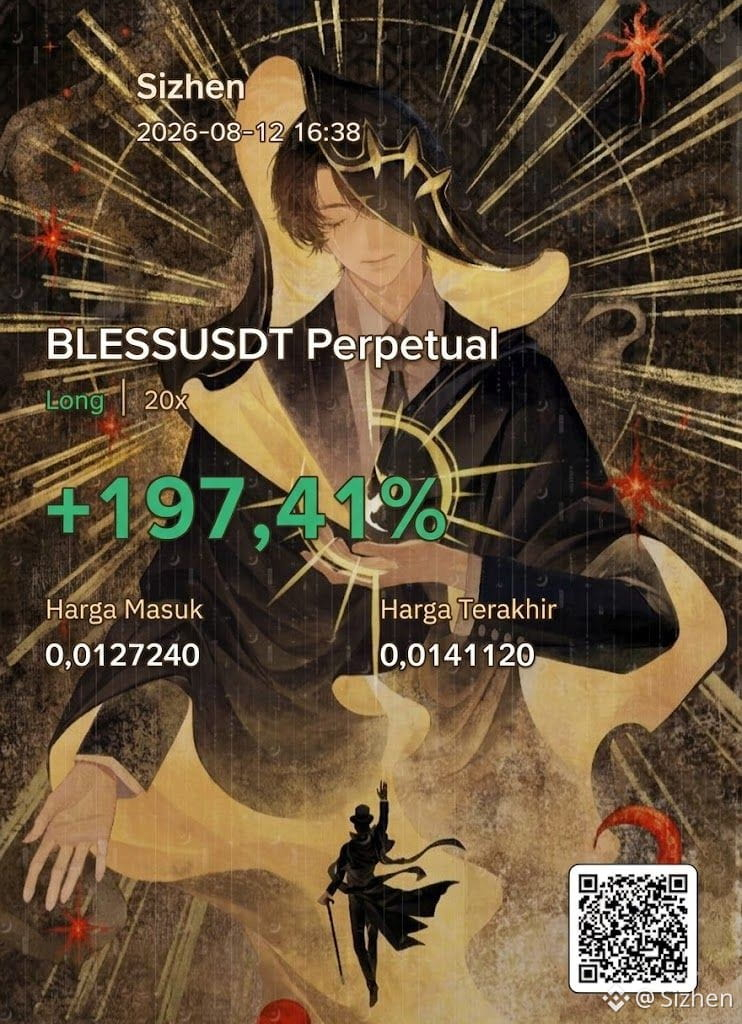
After I closed my long position on $RECALL , the price continued to rise by 8% and almost reached the full take-profit level. Congratulations to those who made a profit from this analysis
Sizhen
·
--
$RECALL is almost at its target on the violet vector; from here, I’ll be closing the position. If anyone is still holding it, simply move the stop-loss to the entry point
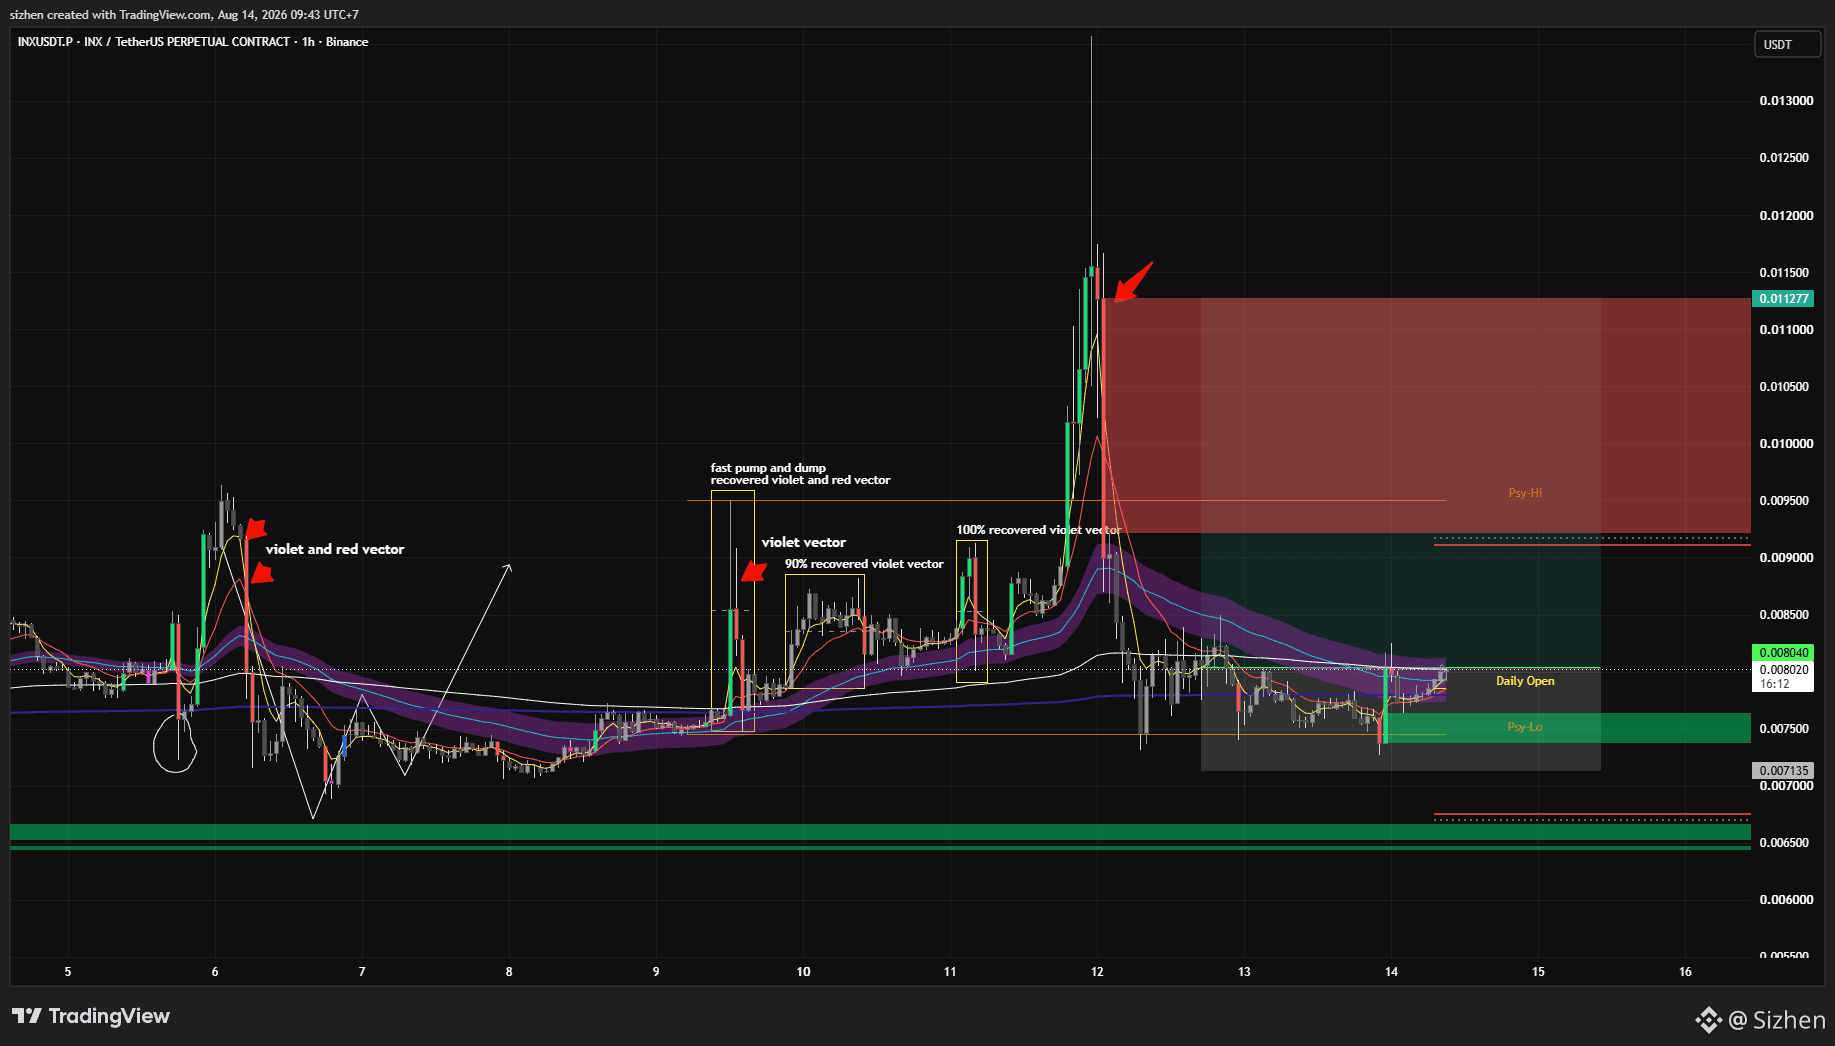
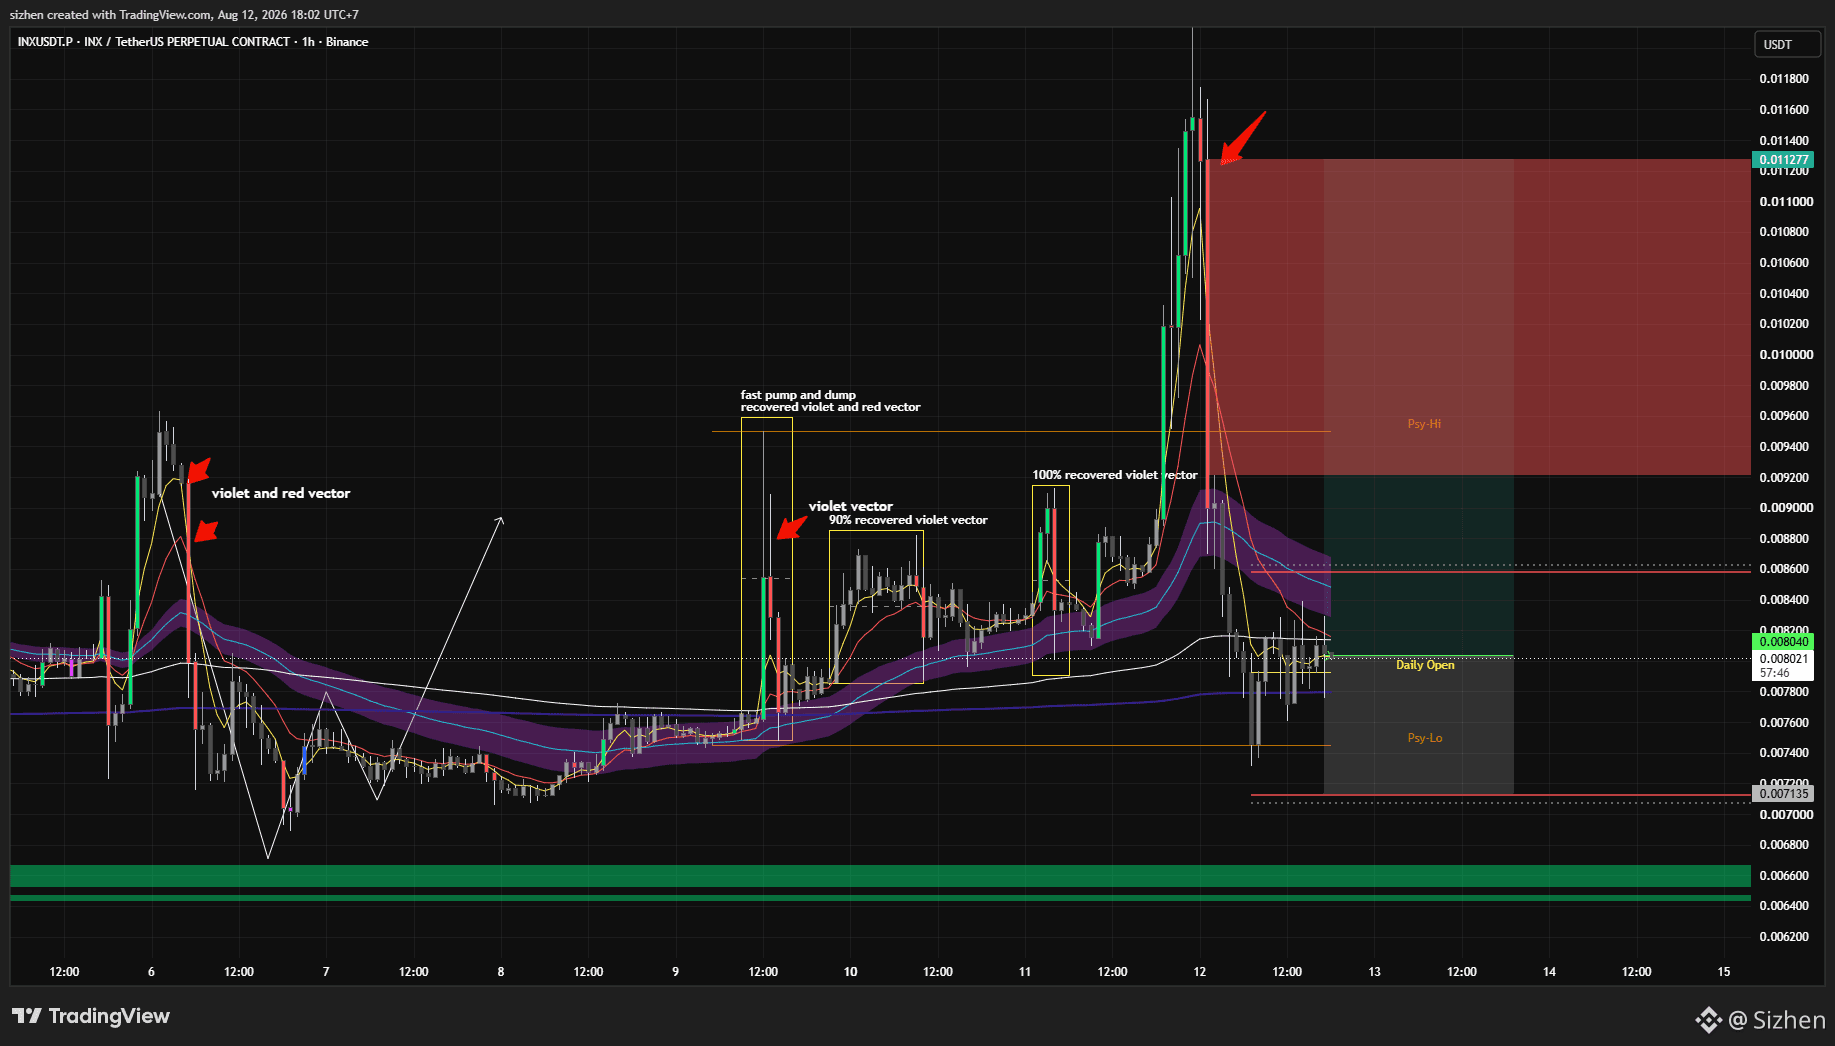
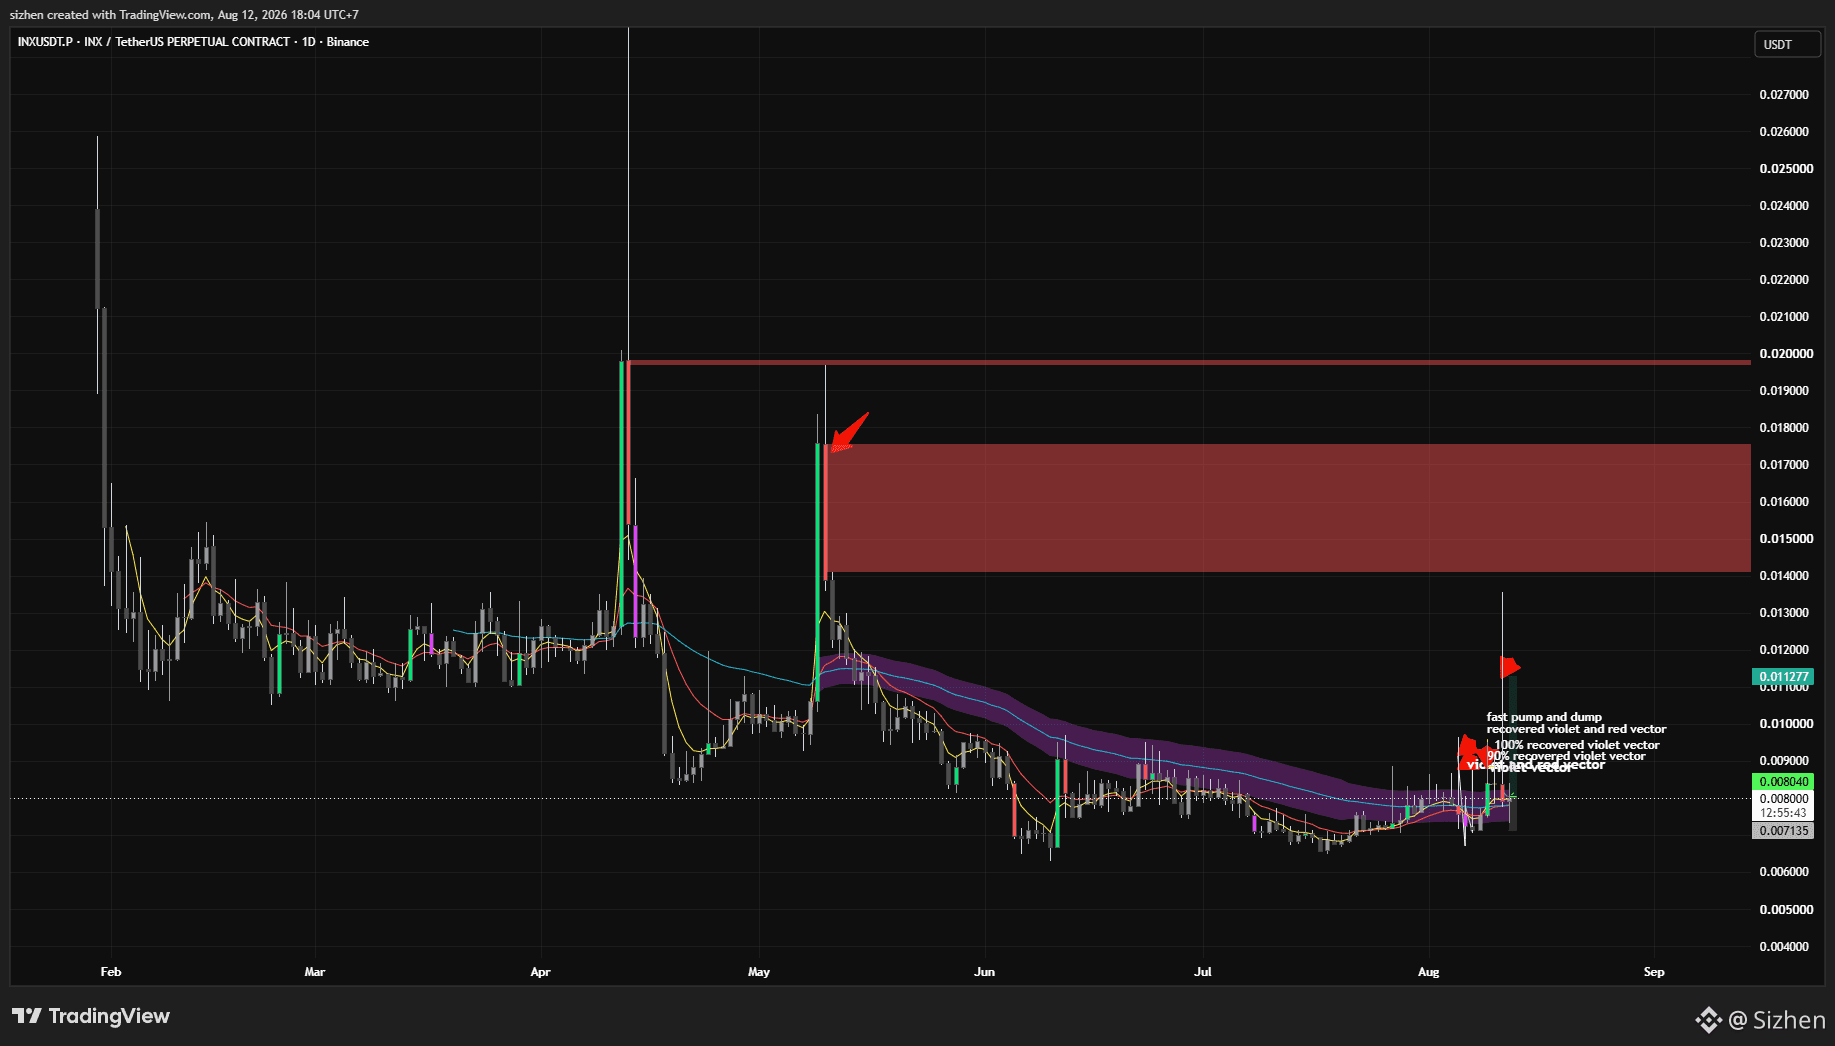
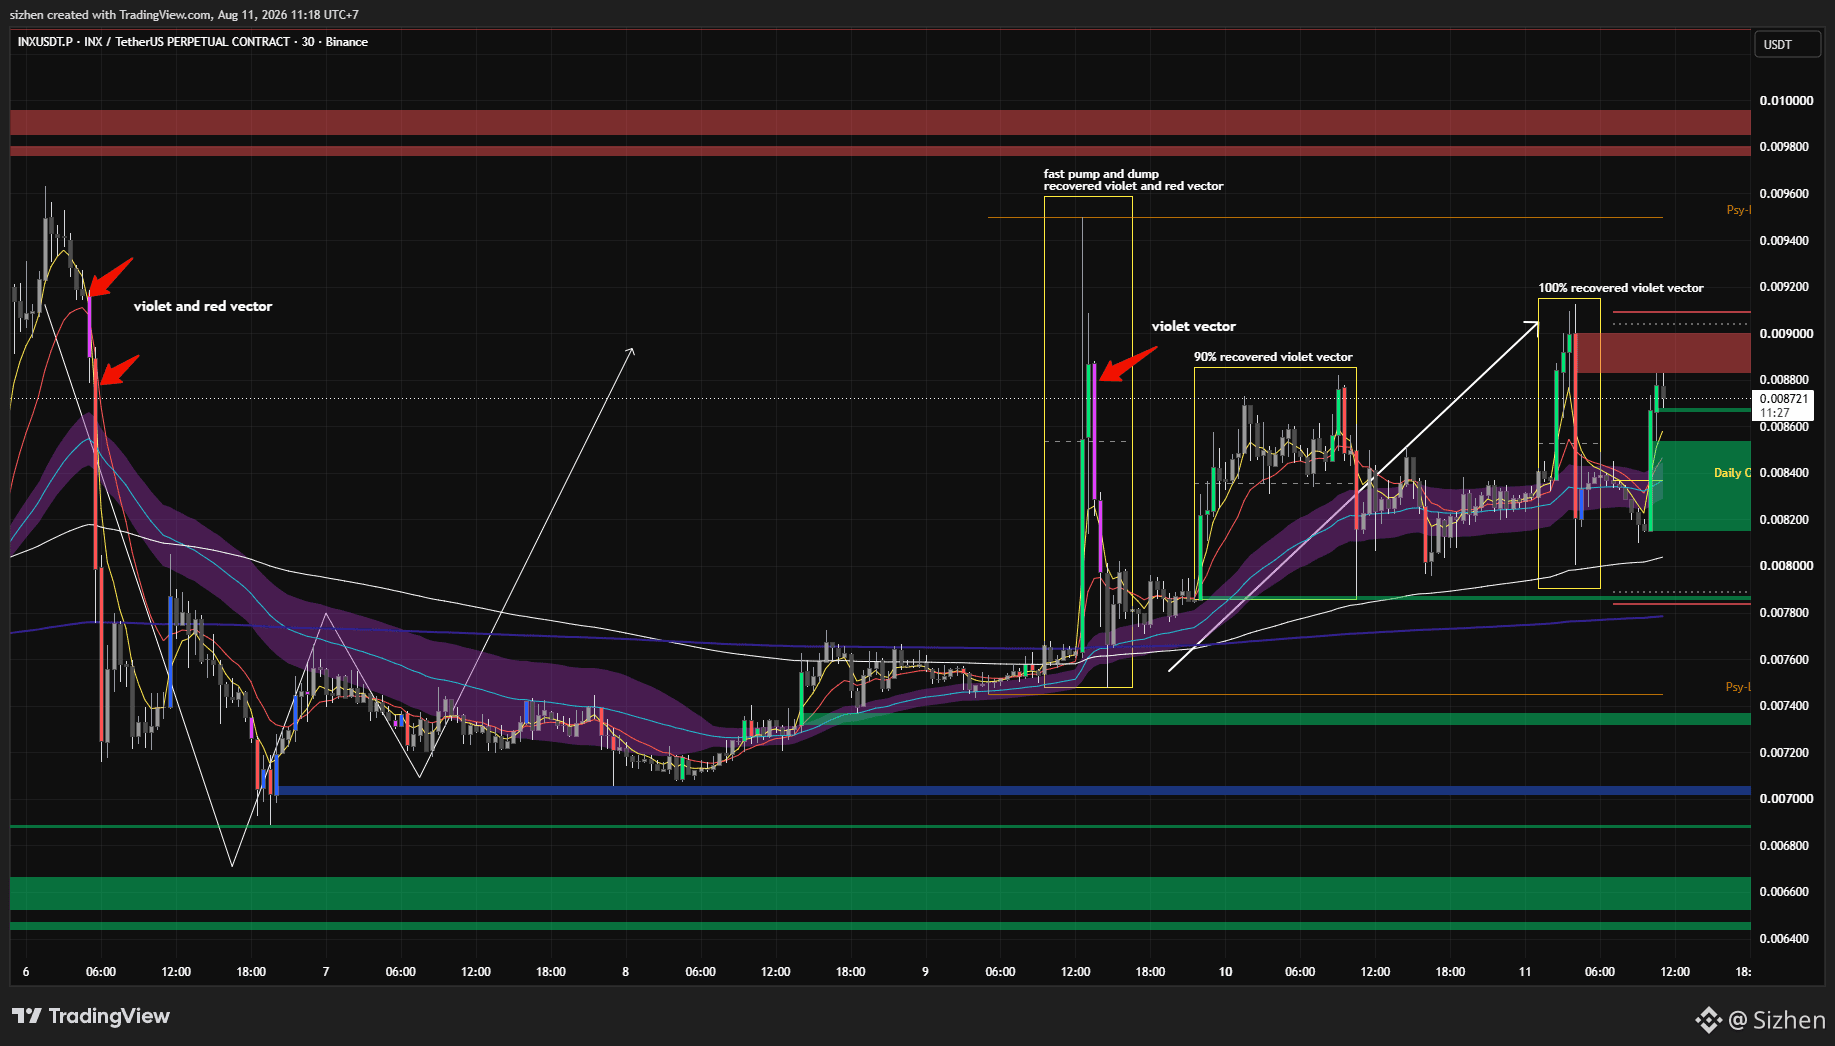
$INX TP is full and has recovered all the vectors listed above, Congratulations for those who have been following
Sizhen
·
--
Bullisch
I had closed my position on the $INX due to a rejection at the EMA, and it has now fully broken through the 50 EMA this breakout was signalled by a green vector candle, which provides sufficient confidence to reopen a long position on the $INX
$RECALL is almost at its target on the violet vector; from here, I’ll be closing the position. If anyone is still holding it, simply move the stop-loss to the entry point
Sizhen
·
--
Bullisch
$RECALL is already in play and is approaching the violet vector candle area once the violet vector candle is reached, you can move your stop
$RECALL is already in play and is approaching the violet vector candle area once the violet vector candle is reached, you can move your stop loss to the entry point or to 50% of your ROI
Sizhen
·
--
Bullisch
$RECALL is quite interesting; if the price manages to hold above the 50 EMA (the purple line), there is a chance it could rise to the daily open or higher
On the 4-hour timeframe I’ve shared, there is a vector that could serve as our upside target, let’s assume the price will rise to that area
For the entry, stop-loss and take-profit levels, please refer to the chart I’ve shared
$RECALL is quite interesting; if the price manages to hold above the 50 EMA (the purple line), there is a chance it could rise to the daily open or higher
On the 4-hour timeframe I’ve shared, there is a vector that could serve as our upside target, let’s assume the price will rise to that area
For the entry, stop-loss and take-profit levels, please refer to the chart I’ve shared
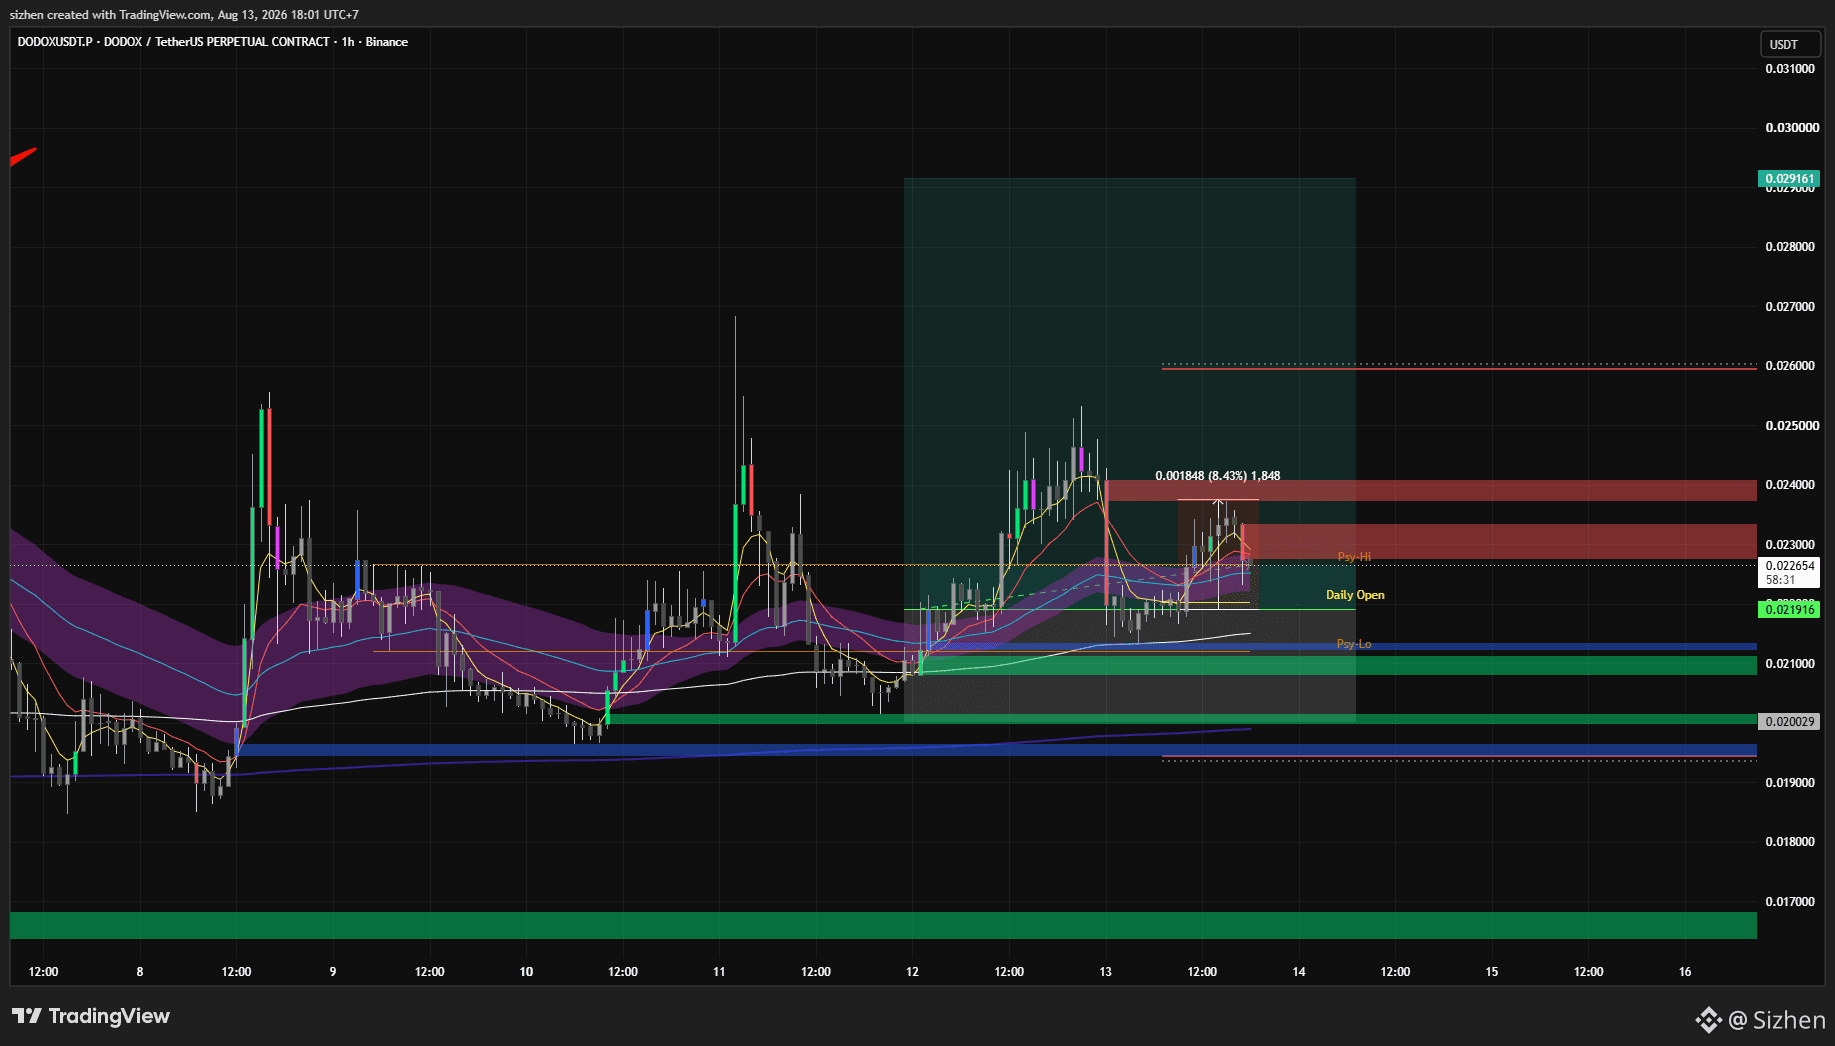
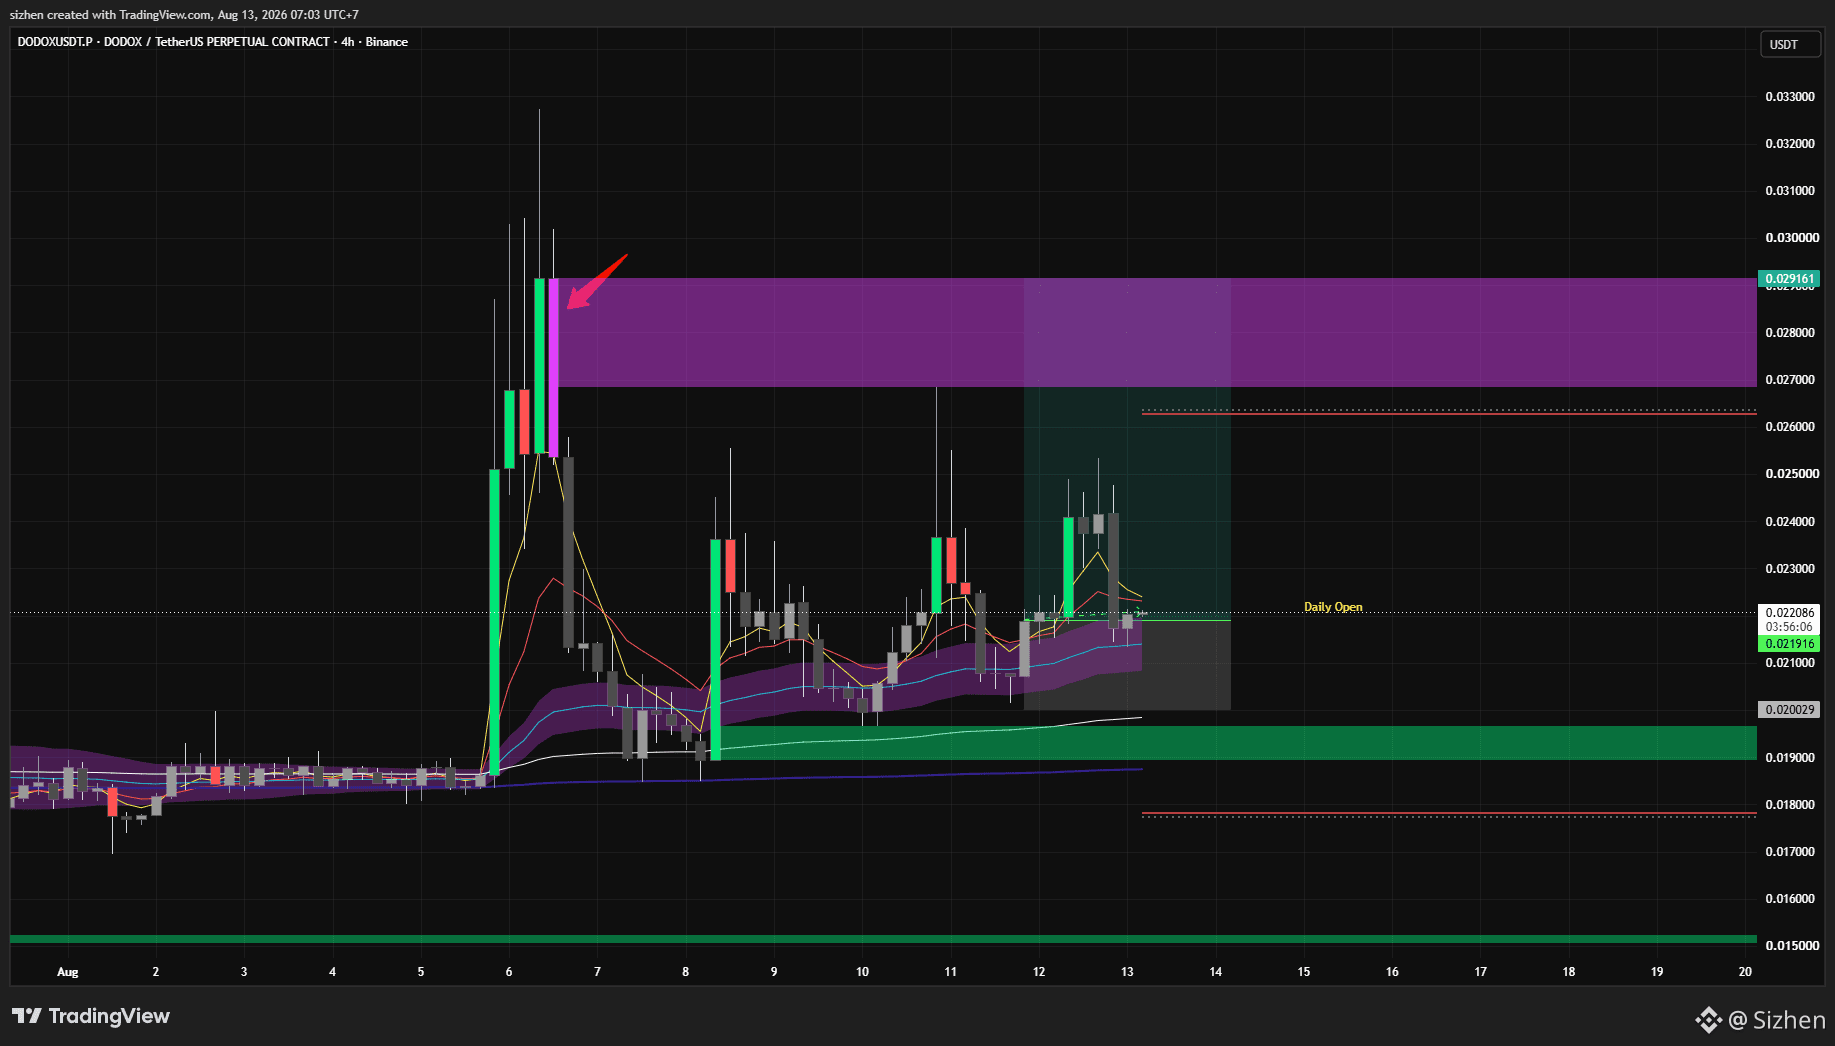
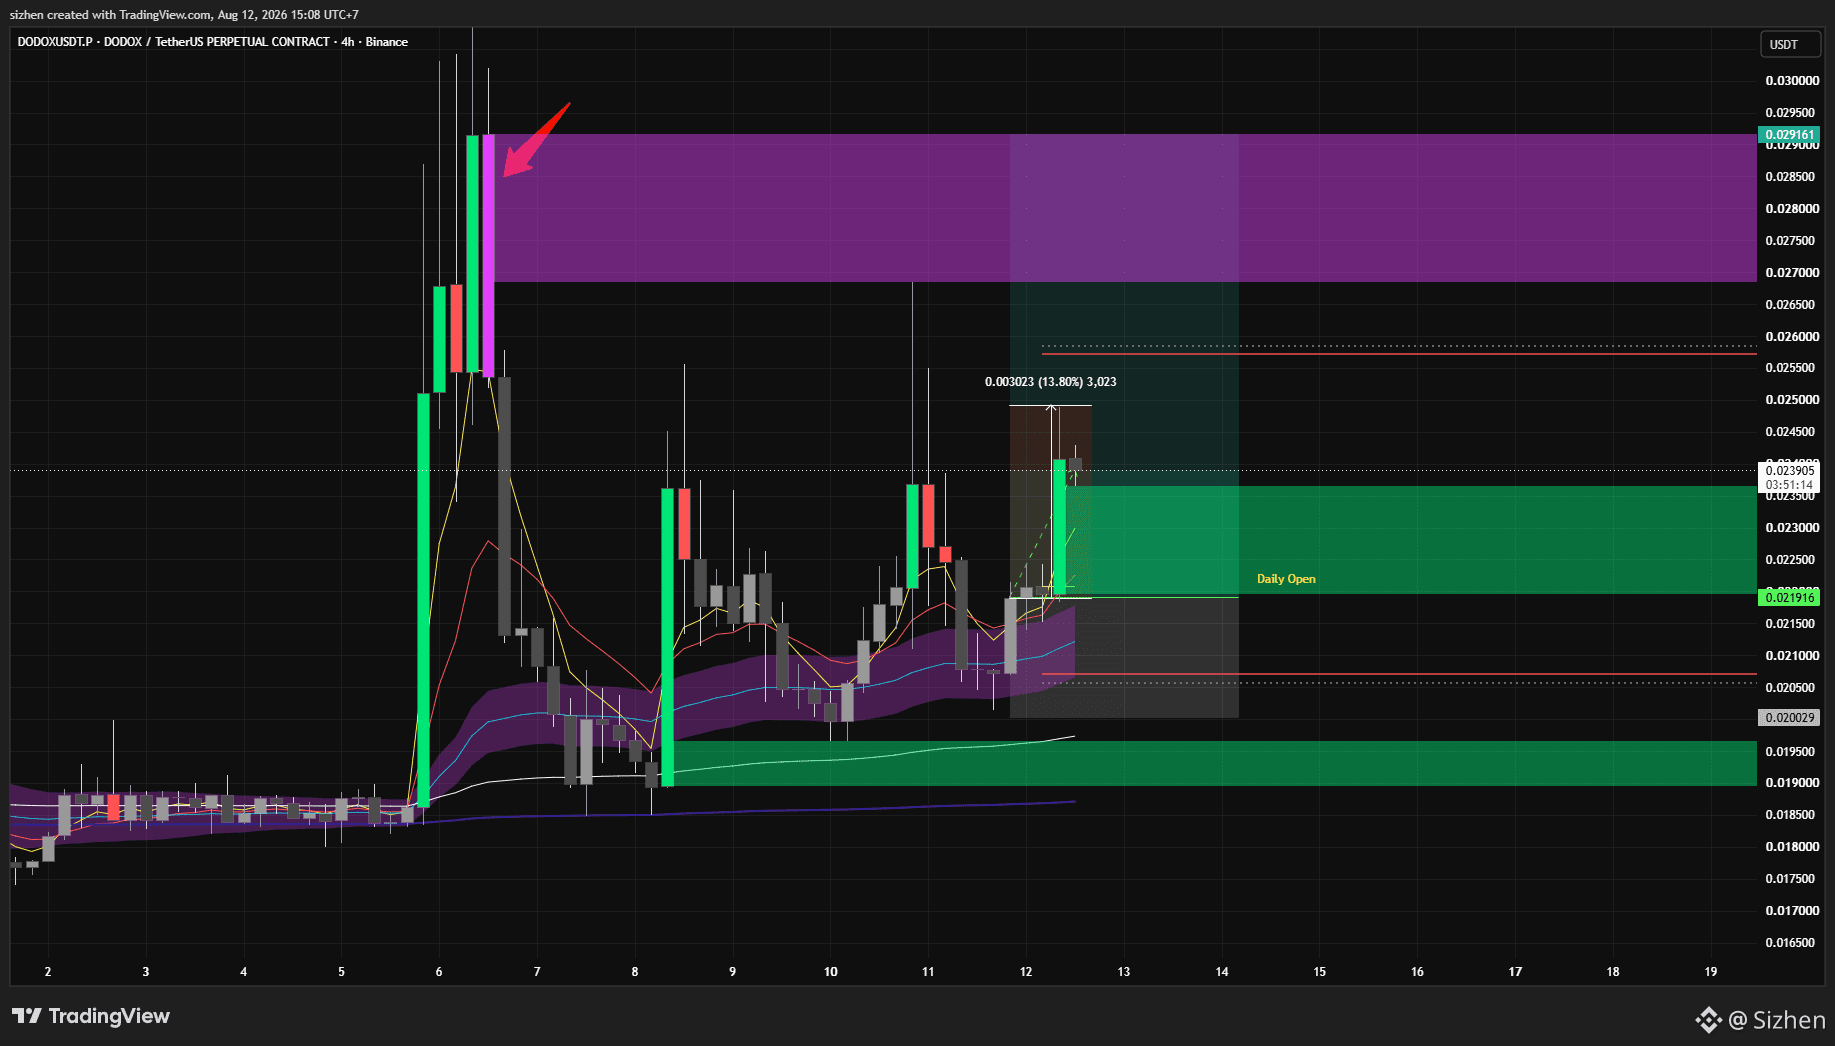
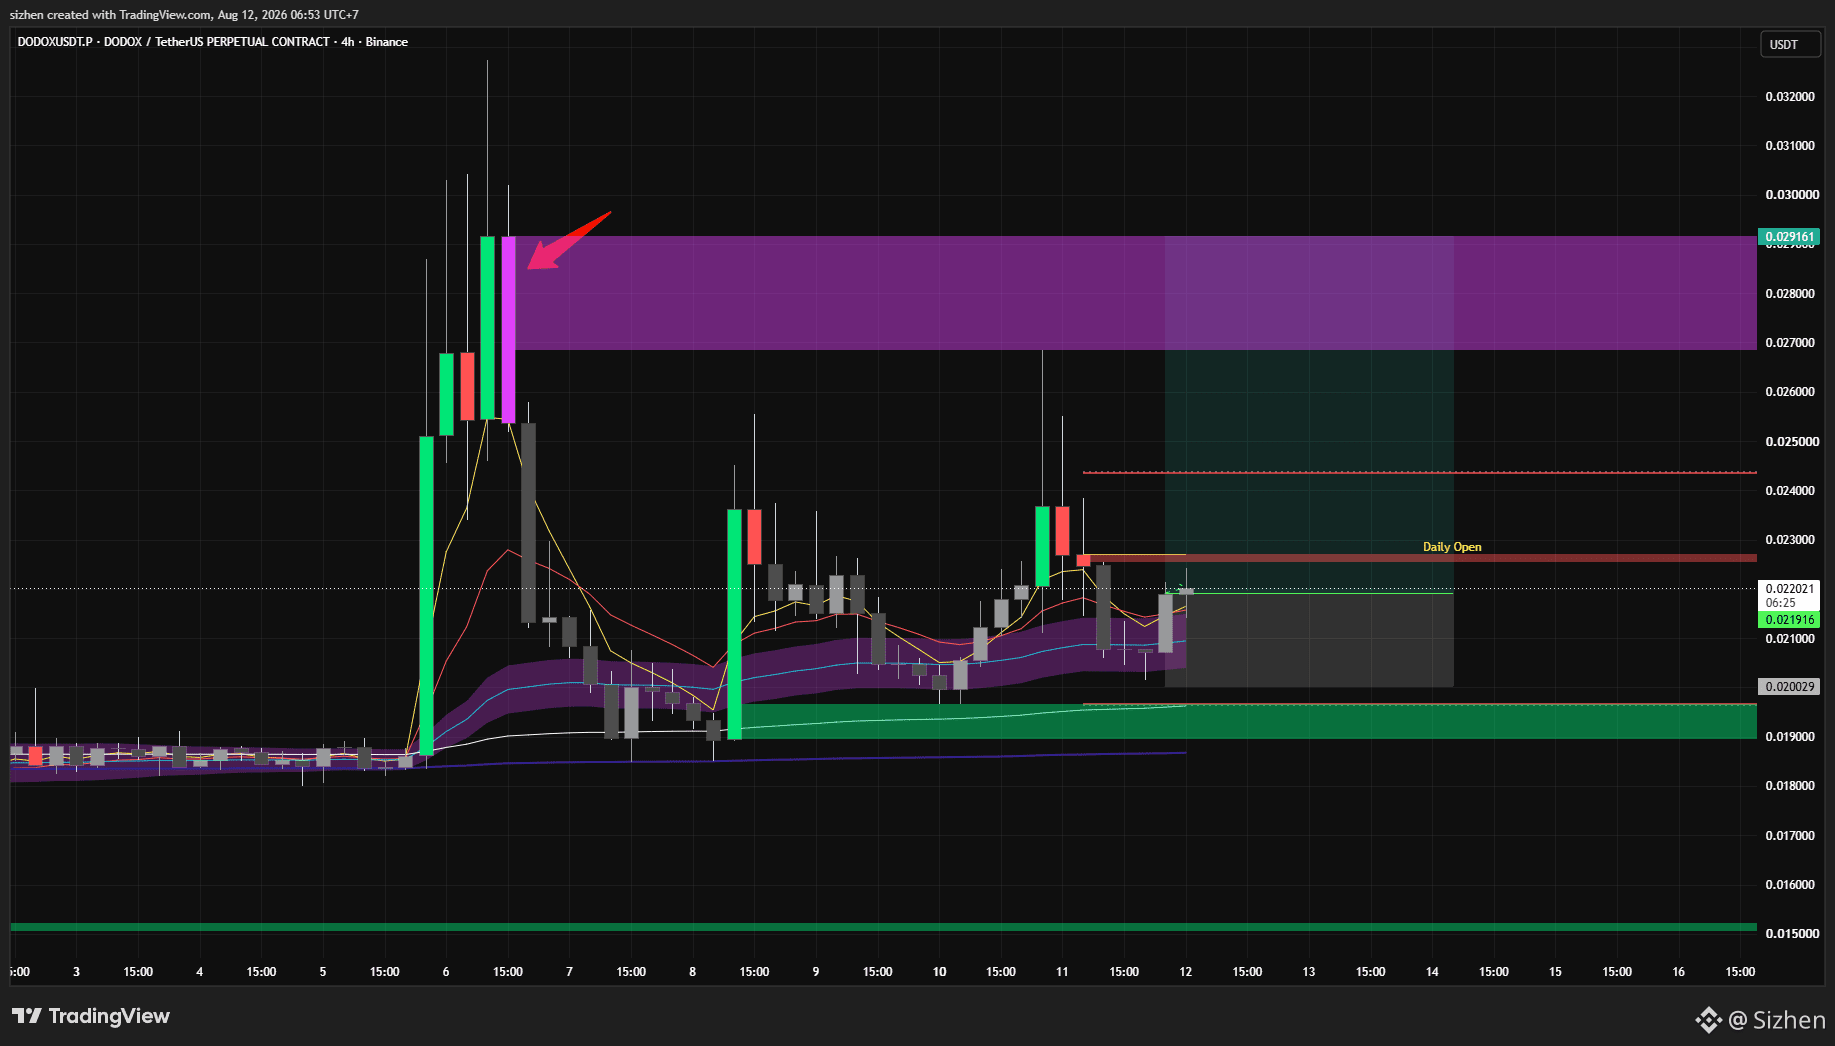
$DODOX Ich beobachte das schon seit einiger Zeit, aber es scheint, dass der Preis gestiegen ist, während ich kurz weg war. Solange der Preis jedoch nicht unter das tägliche Open fällt, lohnt es sich, ein Auge darauf zu haben, und ich habe eine Long-Position eröffnet, obwohl es nur leicht gestiegen ist. Unser Ziel ist der violette Vektor oben
W formation on $HEI if the price rises and the green vector candle breaks through the daily open, it is highly likely that we will see a further rise above the red vector on $HEI
I had closed my position on the $INX due to a rejection at the EMA, and it has now fully broken through the 50 EMA this breakout was signalled by a green vector candle, which provides sufficient confidence to reopen a long position on the $INX
Sizhen
·
--
Bullisch
$INX I’m still holding onto my long position if the price starts to break above the level I’ve marked, it could rise to the red vector candle that hasn’t yet been filled, and if it’s rejected by the 50 EMA, I’ll close the position
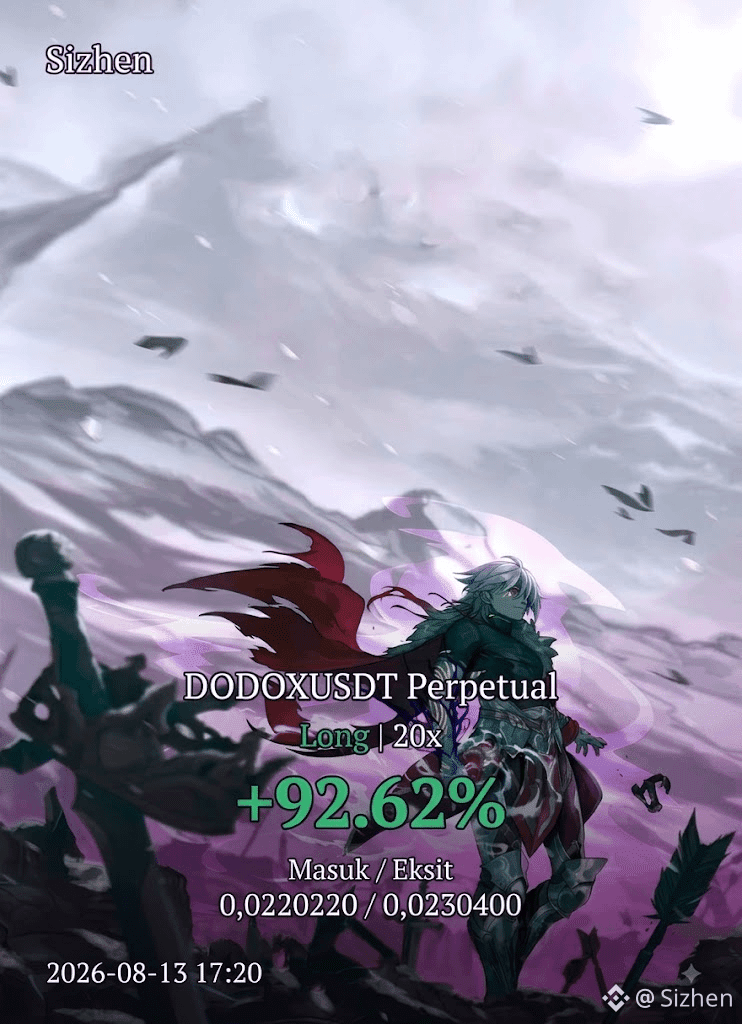
$DODOX ist von hier aus bereits ziemlich stark gestiegen; wird es das Zielniveau erreichen? Ich habe die Position zu schnell aus Gewohnheit geschlossen, ich habe es ein wenig bereut, aber egal, ich nehme das als Lektion für das nächste Mal.
Sizhen
·
--
Bullisch
$DODOX Ich beobachte das schon seit einiger Zeit, aber es scheint, dass der Preis gestiegen ist, während ich kurz weg war. Solange der Preis jedoch nicht unter das tägliche Open fällt, lohnt es sich, ein Auge darauf zu haben, und ich habe eine Long-Position eröffnet, obwohl es nur leicht gestiegen ist. Unser Ziel ist der violette Vektor oben
$AIO On the 1h timeframe, the price should be able to rise to the two target levels I’ve marked, so I’ve opened another long position – this is the third time I’ve opened one
And on the 4h timeframe, if the price breaks through the 50 EMA and bounces off the 50 EMA, we could see a full recovery upwards and a retrace of all the existing red vector candles
Sizhen
·
--
Bullisch
Basierend auf der Analyse, die ich gestern geteilt habe, ist $AIO von hier aus nach oben gegangen. Du könntest deinen Stop-Loss auf den Einstiegspunkt setzen oder Teilgewinne mitnehmen und den Rest laufen lassen
$INX I’m still holding onto my long position if the price starts to break above the level I’ve marked, it could rise to the red vector candle that hasn’t yet been filled, and if it’s rejected by the 50 EMA, I’ll close the position
Sizhen
·
--
Bullisch
Wenn $INX in diesem Bereich abprallen kann, könnte der Preis das dort markierte rote Vektorziel ansteuern
Dort gibt es außerdem Einstiegspunkte, Stop-Loss- und Take-Profit-Level
It looks as though $HEI needs a bit more time to bounce back up
Sizhen
·
--
Bullisch
$HEI This one is also interesting; as long as it remains above yesterday’s daily open – or the new one that’s due to appear, there’s a chance it will rise again