

Crypto Vyn
63 Beiträge
Crypto Vyn
Melden
Nutzer blockieren
Building my future, one coin at a time 💰📊"
Trade eröffnen
Hochfrequenz-Trader
1.3 Jahre
47 Following
126 Follower
203 Like gegeben
Beiträge
Portfolio
Alle
Videos
·
--
Bärisch
433
·
--
Übersetzung ansehen
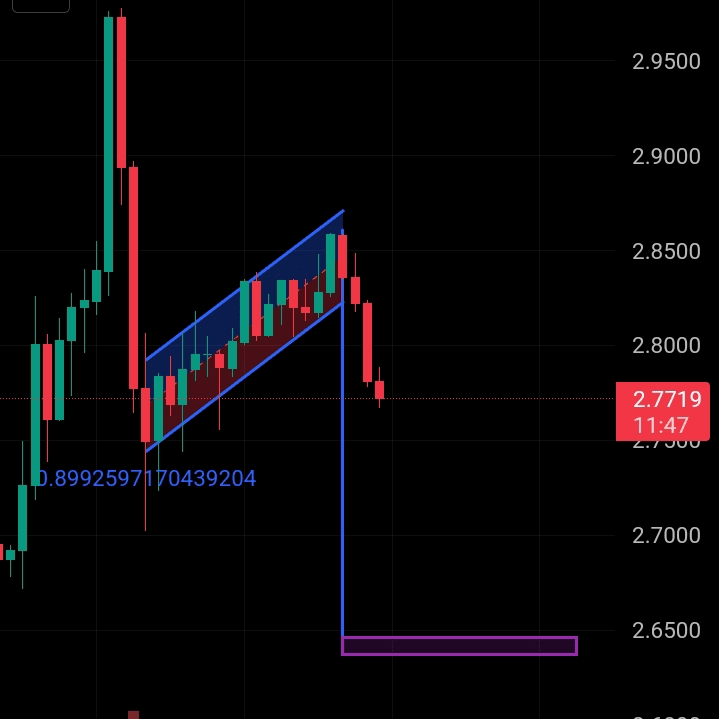
📉 BTW/USDT — Bearish Breakdown Setup
BTW formed a higher high but repeatedly faced resistance and failed to continue upward. After breaking the rising trendline, the price created lower highs, showing weakening bullish momentum.
🔻 SHORT Setup
- Entry: 2.18–2.20 USDT (after breakdown confirmation)
- Stop Loss: 2.35 USDT
- TP1: 2.00 USDT
- TP2: 1.80 USDT
- Final Target: 1.64 USDT
A confirmed break below 2.18 support could trigger further downside. Wait for confirmation before entering.
#BTW
1
400
·
--
370
·
--
Artikel
APTOS (APT): Ist das der Beginn einer großen Bodenbildung? 📈🚨 APTOS (APT): BILDET SICH EIN WICHTIGER BODEN? 📈 | MEINE VOLLSTÄNDIGE WOCHENANALYSE
Die meisten Trader konzentrieren sich darauf, wie stark eine Coin gefallen ist. Kluge Anleger achten darauf, ob sich die Marktstruktur endlich verändert.
Aptos ($APT) befindet sich an einem technisch interessanten Punkt. Nach einem anhaltenden Rückgang könnte dies der Beginn einer langfristigen Erholung sein – oder bereitet sich der Markt auf einen weiteren Ausverkauf vor?
Schauen wir uns den Chart genauer an. 👇
📊 1. DAS GROSSE BILD — WOCHENCHART
Laut meinem Chart-Snapshot wird APT bei etwa 0,8520 $ gehandelt, nachdem der Kurs zuvor ein Tief bei etwa 0,5090 $ erreicht hatte.
APTOS (APT): Ist das der Beginn einer großen Bodenbildung? 📈
🚨 APTOS (APT): BILDET SICH EIN WICHTIGER BODEN? 📈 | MEINE VOLLSTÄNDIGE WOCHENANALYSE
Die meisten Trader konzentrieren sich darauf, wie stark eine Coin gefallen ist. Kluge Anleger achten darauf, ob sich die Marktstruktur endlich verändert.
Aptos ($APT) befindet sich an einem technisch interessanten Punkt. Nach einem anhaltenden Rückgang könnte dies der Beginn einer langfristigen Erholung sein – oder bereitet sich der Markt auf einen weiteren Ausverkauf vor?
Schauen wir uns den Chart genauer an. 👇
📊 1. DAS GROSSE BILD — WOCHENCHART
Laut meinem Chart-Snapshot wird APT bei etwa 0,8520 $ gehandelt, nachdem der Kurs zuvor ein Tief bei etwa 0,5090 $ erreicht hatte.
965
·
--
Ehrlich gesagt bin ich hier mit 8-fachem Hebel short.
Ehrlich gesagt bin ich hier mit 8-fachem Hebel short.
3
908
·
--
Übersetzung ansehen
TRUTHUSDT — SHORT TRADE 📉
Entry: 0.02115–0.02130
Stop Loss (SL): 0.02235
Take Profit 1 (TP1): 0.02050
Take Profit 2 (TP2): 0.01950
Take Profit 3 (TP3): 0.01795
Resistance: 0.02290
Support: 0.02110
Analysis: Price support level ke paas hai. Agar 15m candle support ke neeche close kare aur retest fail ho, to short setup confirm ho sakta hai. Agar support hold kare, short entry avoid karein.
1
825
·
--
Übersetzung ansehen
BTCUSDT: Liquidity Sweep & Bullish Reversal Setup 📈
Bitcoin has bounced strongly after sweeping liquidity near the $81,000–$81,300 area.
My 15M chart levels:
• Entry Zone: $81,800–$81,950 (after confirmation)
• Stop Loss: $81,391
• Target 1: $83,400
• Final Target: $84,340
BTC needs to hold its support and reclaim resistance for the bullish scenario to remain valid. Recent ETF outflows and a stronger US dollar remain important risk factors.
I will wait for confirmation rather than chase the price.
761
·
--
Übersetzung ansehen
📊 BTC Market Analysis | October 10, 2026
Bitcoin is facing a crucial decision zone.
🔴 Resistance: $84,000–$85,000 🟢 Support: $81,000–$82,000
📈 Bullish Scenario: A confirmed breakout above $85K could open the way toward $87.5K and $90K.
📉 Bearish Scenario: A breakdown below $80K could expose the $75K–$76K support zone.
👀 Watch liquidity sweeps, volume, and retests before entering any trade.
My view: Wait for confirmation instead of chasing price. These are potential scenarios, not guaranteed targets.
#Bitcoin
701
·
--
Übersetzung ansehen
BTC/USDT – 1D Technical Analysis 📊
Bitcoin is currently trading near $82,450 after a pullback from the $87,400 resistance zone.
🔴 Resistance: $83,000–$84,300 | $87,000–$87,400
🟢 Support: $81,400–$82,000 | $77,600
BTC needs to reclaim $84,300 for a recovery attempt. A confirmed breakout above $87,400 could strengthen bullish momentum. However, losing $81,400 may expose lower support levels.
Recent macroeconomic pressure and Bitcoin ETF outflows remain key factors to watch.
This is my personal market analysis, not financial advice. Always manage risk.
#Bitcoin #BTC
82
·
--
Übersetzung ansehen
BTC I,m short here with 100x leverage
BTC I,m short here with 100x leverage
335
·
--
Übersetzung ansehen
MET/USDT — SHORT 📉 | 20x
Entry: 0.5682–0.6185
SL: 0.6627
TP1: 0.4876
TP2: 0.3974
Rejection from resistance → bearish move possible.
Personal analysis, not financial advice.
MET/USDT — SHORT 📉 | 20x
Entry: 0.5682–0.6185
SL: 0.6627
TP1: 0.4876
TP2: 0.3974
Rejection from resistance → bearish move possible.
Personal analysis, not financial advice.
Entry: 0.5682–0.6185
SL: 0.6627
TP1: 0.4876
TP2: 0.3974
Rejection from resistance → bearish move possible.
Personal analysis, not financial advice.
705
·
--
Übersetzung ansehen
📉 RLC/USDT Bearish Setup
RLC is facing strong resistance around 0.95–0.97. If price gets rejected from this zone, I expect a downside move toward the marked targets.
🎯 TP1: 0.85
🎯 TP2: 0.7482
🛑 SL: 1.0099
This is my personal analysis, not financial advice. The bearish setup remains valid as long as the 0.97 resistance holds.
1k
·
--
Übersetzung ansehen
📈 BTC/USDT — My Personal Analysis
BTC is following an ascending trendline and approaching the $87.3K resistance.
In my view, a confirmed breakout above $87.3K could open the way toward $91.2K, followed by $97.9K. A short pullback before the next move is possible.
⚠️ This is only my personal opinion and technical analysis, not financial advice. Targets are valid only if BTC confirms the breakout.
🚀 Let’s see if BTC breaks the resistance!
1
782
Anmelden und weiter Inhalte entdecken
Krypto-Nutzer weltweit auf Binance Square kennenlernen
⚡️ Bleib in Sachen Krypto stets am Puls.
💬 Die weltgrößte Kryptobörse vertraut darauf.
👍 Erhalte verlässliche Einblicke von verifizierten Creators.
E-Mail-Adresse/Telefonnummer
Trendthemen
BinancePick
1.4M Aufrufe
97,411 Kommentare
Mach bei #Gewinnsaison mit: Prognostiziere Unternehmensergebnisse auf Binance Pick und teile deine Meinung auf Binance Square!
Binance Square Official
·303 Likes
·266k Aufrufe
EarningsSeason
4.1M Aufrufe
19,584 Kommentare
UKAlgorithmicCryptoTradingAppsMayNeedFCAAuthorization
1,510 Aufrufe
56 Kommentare