

BlockChain Z
6.5k Beiträge

BlockChain Z
Melden
Nutzer blockieren
Square Content Creator
Trade eröffnen
Regelmäßiger Trader
1.8 Jahre
6 Following
7.8K+ Follower
8.0K+ Like gegeben
Beiträge
Portfolio
Alle
Zitierungen
Videos
Live
·
--
Bullisch
Übersetzung ansehen
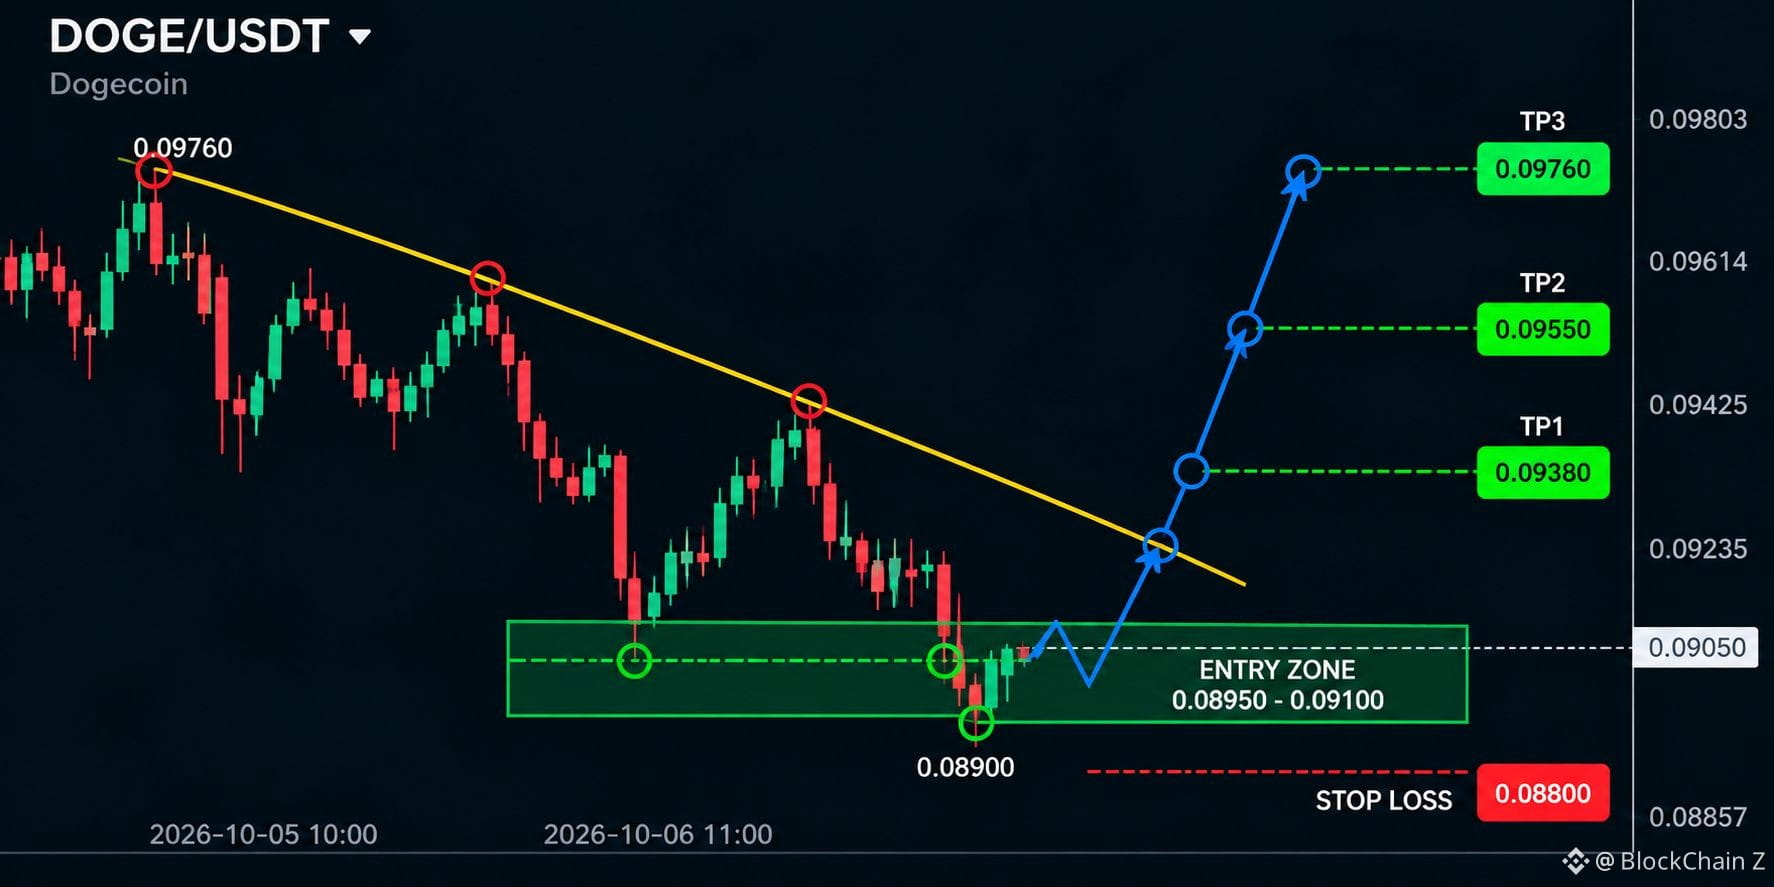
$DOGE Reversal Recovery Setup
Long Setup
Entry: 0.0895 – 0.0905
Stop Loss: 0.0883
TP1: 0.09235
TP2: 0.09425
TP3: 0.09614
DOGE has faced a sharp sell-off from the 0.0960 area, but price has now reacted strongly from the 0.08900 low and is attempting to stabilize above the support zone.
The preferred approach is to look for a controlled hold around 0.0895–0.0905 rather than chasing a sudden rebound. A reclaim of 0.09235 would strengthen the recovery structure and could open the way toward 0.09425, followed by 0.09614.
{future}(DOGEUSDT)
$BR
{future}(BRUSDT)
$龙虾
{future}(龙虾USDT)
$DOGE Reversal Recovery Setup
Long Setup
Entry: 0.0895 – 0.0905
Stop Loss: 0.0883
TP1: 0.09235
TP2: 0.09425
TP3: 0.09614
DOGE has faced a sharp sell-off from the 0.0960 area, but price has now reacted strongly from the 0.08900 low and is attempting to stabilize above the support zone.
The preferred approach is to look for a controlled hold around 0.0895–0.0905 rather than chasing a sudden rebound. A reclaim of 0.09235 would strengthen the recovery structure and could open the way toward 0.09425, followed by 0.09614.
$BR
$龙虾
Long Setup
Entry: 0.0895 – 0.0905
Stop Loss: 0.0883
TP1: 0.09235
TP2: 0.09425
TP3: 0.09614
DOGE has faced a sharp sell-off from the 0.0960 area, but price has now reacted strongly from the 0.08900 low and is attempting to stabilize above the support zone.
The preferred approach is to look for a controlled hold around 0.0895–0.0905 rather than chasing a sudden rebound. A reclaim of 0.09235 would strengthen the recovery structure and could open the way toward 0.09425, followed by 0.09614.
$BR
$龙虾
64
·
--
Bullisch
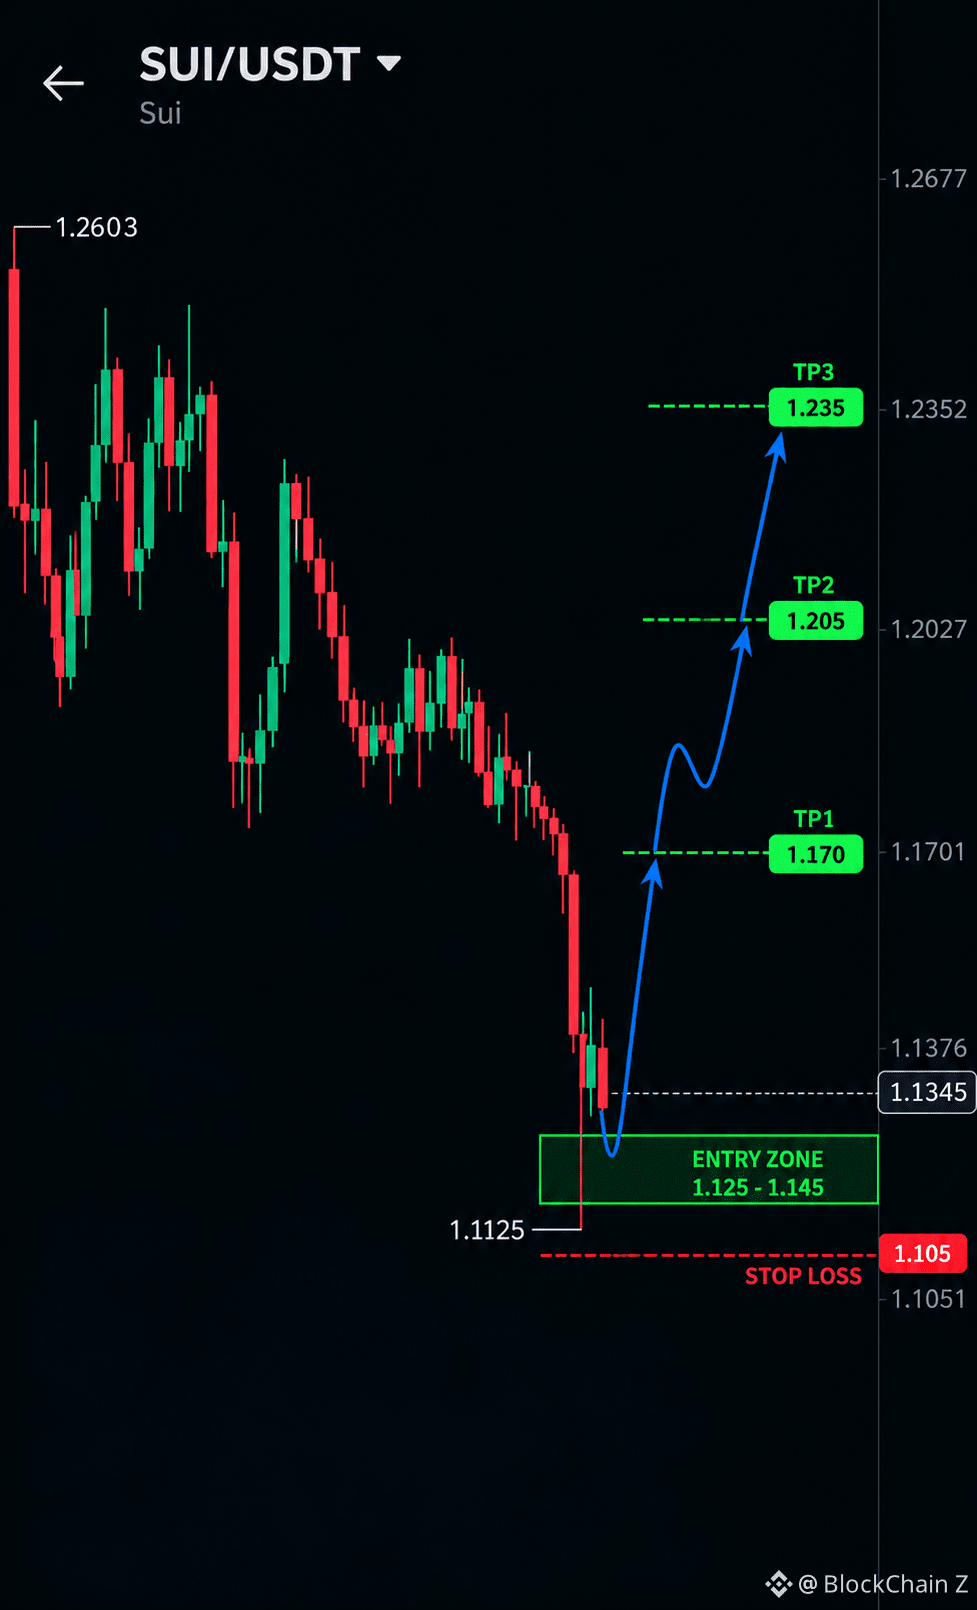
$SUI Momentum-Umkehr-Setup
Long-Setup
Einstieg: 1.125 – 1.145
Stop-Loss: 1.105
TP1: 1.170
TP2: 1.205
TP3: 1.235
SUI ist vom Bereich um 1.2603 stark gefallen und hat kürzlich am Tief bei 1.1125 eine deutliche Reaktion gezeigt. Der Kurs versucht nun, sich im Unterstützungsbereich von 1.125–1.145 zu stabilisieren, der zur Basis für eine kurzfristige Erholung werden könnte.
Es empfiehlt sich, einen kontrollierten Rücksetzer in die Einstiegszone von 1.125–1.145 abzuwarten, anstatt einer plötzlichen Aufwärtsbewegung hinterherzulaufen. Eine erfolgreiche Rückeroberung von 1.170 würde das bullische Szenario stärken und den Weg in Richtung 1.205 und anschließend 1.235 eröffnen.
{future}(SUIUSDT)
$BR
{future}(BRUSDT)
$龙虾
{future}(龙虾USDT)
$SUI Momentum-Umkehr-Setup
Long-Setup
Einstieg: 1.125 – 1.145
Stop-Loss: 1.105
TP1: 1.170
TP2: 1.205
TP3: 1.235
SUI ist vom Bereich um 1.2603 stark gefallen und hat kürzlich am Tief bei 1.1125 eine deutliche Reaktion gezeigt. Der Kurs versucht nun, sich im Unterstützungsbereich von 1.125–1.145 zu stabilisieren, der zur Basis für eine kurzfristige Erholung werden könnte.
Es empfiehlt sich, einen kontrollierten Rücksetzer in die Einstiegszone von 1.125–1.145 abzuwarten, anstatt einer plötzlichen Aufwärtsbewegung hinterherzulaufen. Eine erfolgreiche Rückeroberung von 1.170 würde das bullische Szenario stärken und den Weg in Richtung 1.205 und anschließend 1.235 eröffnen.
$BR
$龙虾
Long-Setup
Einstieg: 1.125 – 1.145
Stop-Loss: 1.105
TP1: 1.170
TP2: 1.205
TP3: 1.235
SUI ist vom Bereich um 1.2603 stark gefallen und hat kürzlich am Tief bei 1.1125 eine deutliche Reaktion gezeigt. Der Kurs versucht nun, sich im Unterstützungsbereich von 1.125–1.145 zu stabilisieren, der zur Basis für eine kurzfristige Erholung werden könnte.
Es empfiehlt sich, einen kontrollierten Rücksetzer in die Einstiegszone von 1.125–1.145 abzuwarten, anstatt einer plötzlichen Aufwärtsbewegung hinterherzulaufen. Eine erfolgreiche Rückeroberung von 1.170 würde das bullische Szenario stärken und den Weg in Richtung 1.205 und anschließend 1.235 eröffnen.
$BR
$龙虾
736
·
--
Bullisch
Übersetzung ansehen
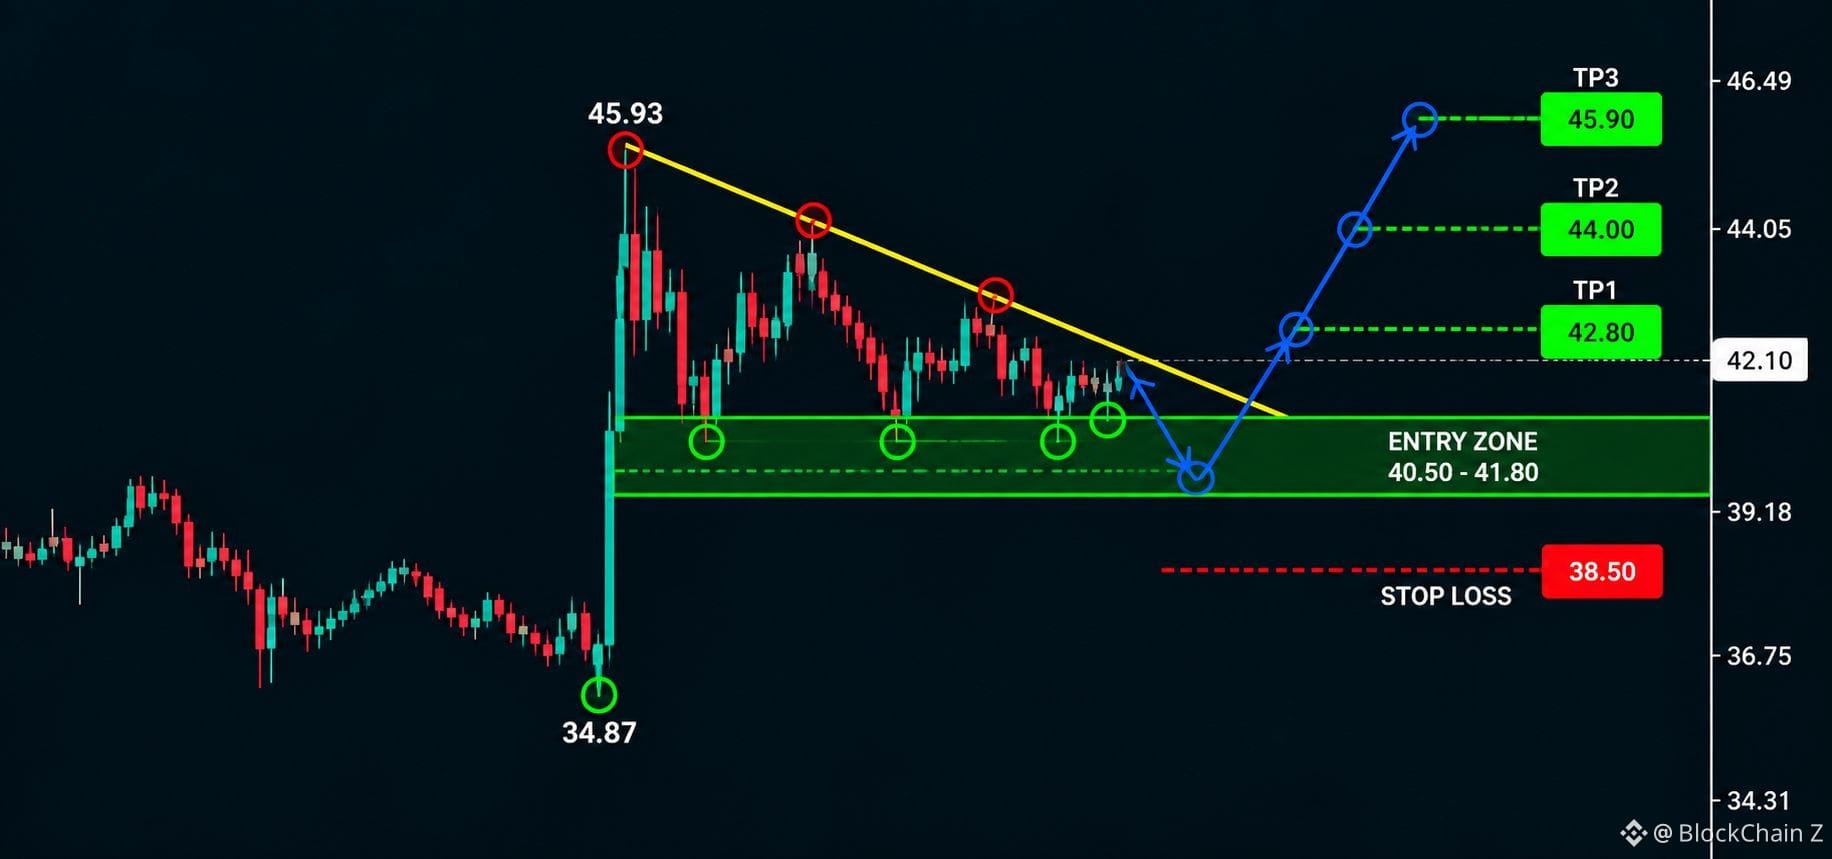
$MVLL Long Setup
Entry: 41.50 – 42.20
Stop Loss: 39.80
TP1: 43.80
TP2: 45.90
TP3: 48.00
MVLL is holding above the 41.00–41.50 area after the sharp breakout. The current consolidation can act as a continuation base. A clean reclaim of 43.80 would strengthen the move toward the previous 45.93 high and potentially higher targets.
{future}(MVLLUSDT)
$龙虾
{future}(龙虾USDT)
$BR
{future}(BRUSDT)
$MVLL Long Setup
Entry: 41.50 – 42.20
Stop Loss: 39.80
TP1: 43.80
TP2: 45.90
TP3: 48.00
MVLL is holding above the 41.00–41.50 area after the sharp breakout. The current consolidation can act as a continuation base. A clean reclaim of 43.80 would strengthen the move toward the previous 45.93 high and potentially higher targets.
$龙虾
$BR
Entry: 41.50 – 42.20
Stop Loss: 39.80
TP1: 43.80
TP2: 45.90
TP3: 48.00
MVLL is holding above the 41.00–41.50 area after the sharp breakout. The current consolidation can act as a continuation base. A clean reclaim of 43.80 would strengthen the move toward the previous 45.93 high and potentially higher targets.
$龙虾
$BR
534
·
--
Bullisch
Übersetzung ansehen
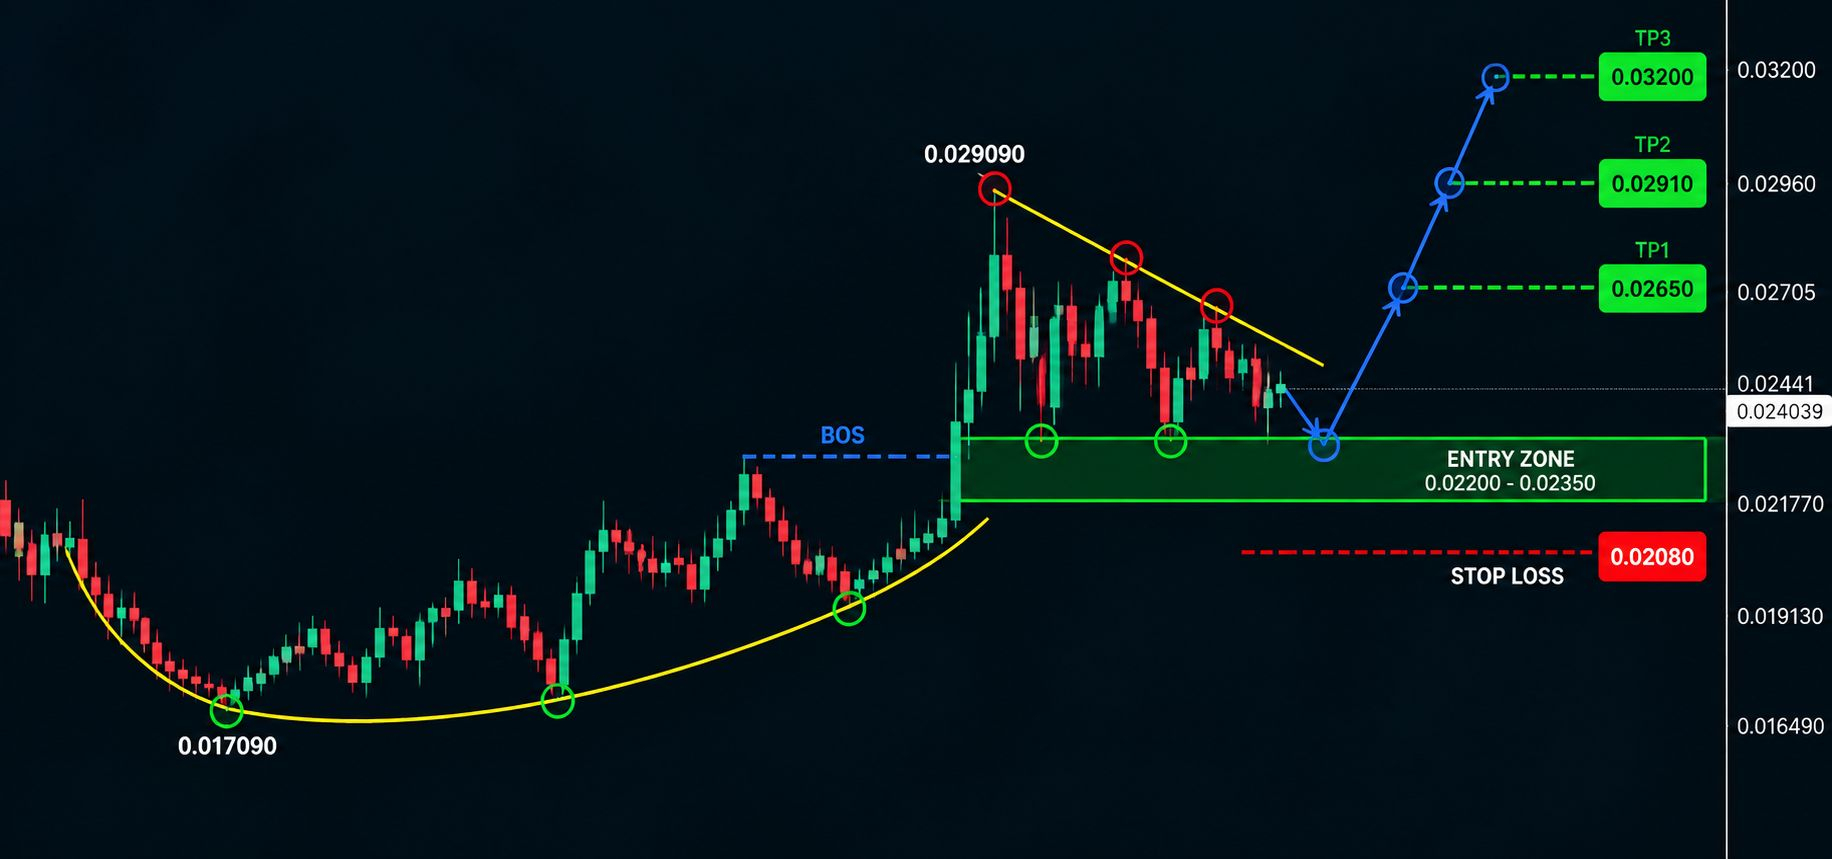
$GRIFFAIN Long Setup
Entry: 0.02300 – 0.02420
Stop Loss: 0.02200
TP1: 0.02550
TP2: 0.02700
TP3: 0.02900
GRIFFAIN is consolidating after the strong breakout from 0.01709 and remains above the 0.02177 support area. Holding the current range and reclaiming 0.02550 could bring the previous 0.02909 high back into focus.
{future}(GRIFFAINUSDT)
$BR
{future}(BRUSDT)
$龙虾
{future}(龙虾USDT)
$GRIFFAIN Long Setup
Entry: 0.02300 – 0.02420
Stop Loss: 0.02200
TP1: 0.02550
TP2: 0.02700
TP3: 0.02900
GRIFFAIN is consolidating after the strong breakout from 0.01709 and remains above the 0.02177 support area. Holding the current range and reclaiming 0.02550 could bring the previous 0.02909 high back into focus.
$BR
$龙虾
Entry: 0.02300 – 0.02420
Stop Loss: 0.02200
TP1: 0.02550
TP2: 0.02700
TP3: 0.02900
GRIFFAIN is consolidating after the strong breakout from 0.01709 and remains above the 0.02177 support area. Holding the current range and reclaiming 0.02550 could bring the previous 0.02909 high back into focus.
$BR
$龙虾
1
610
·
--
Bullisch
Übersetzung ansehen
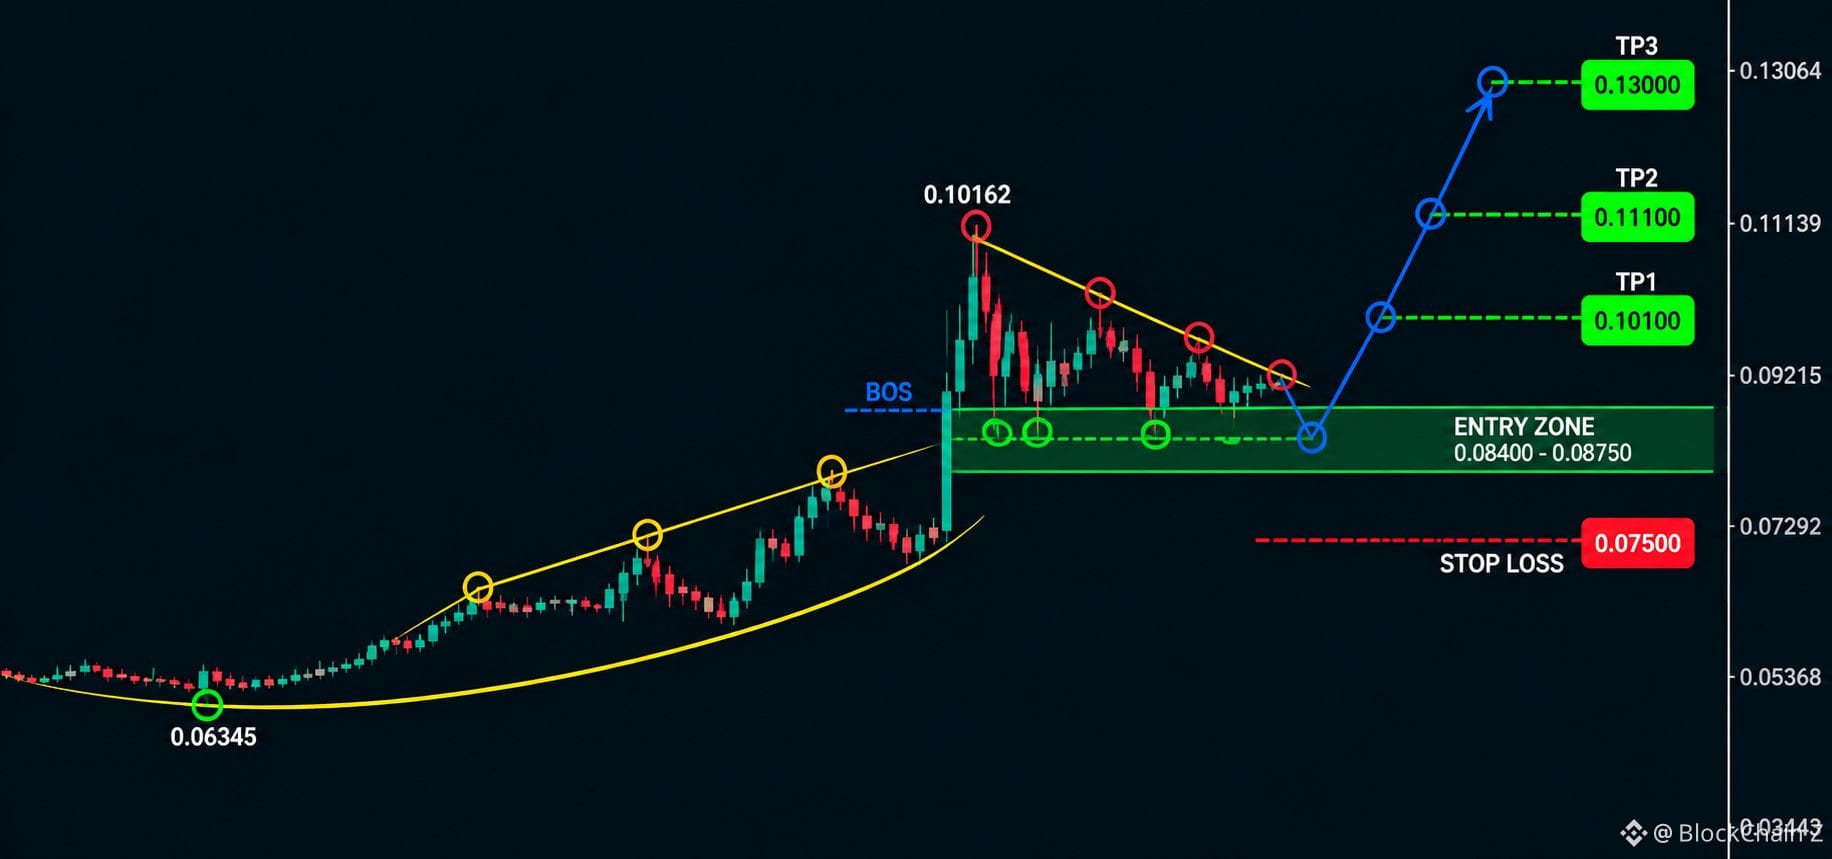
$CAP Long Setup
Entry: 0.08580 – 0.08720
Stop Loss: 0.08250
TP1: 0.09200
TP2: 0.09800
TP3: 0.10600
CAP is consolidating after the sharp move from 0.06345 to 0.10162. The current range around 0.086–0.089 can act as a continuation zone. A clean reclaim of 0.092 would strengthen the bullish move toward the next targets.
{future}(CAPUSDT)
$BR
{future}(BRUSDT)
$龙虾
{future}(龙虾USDT)
$CAP Long Setup
Entry: 0.08580 – 0.08720
Stop Loss: 0.08250
TP1: 0.09200
TP2: 0.09800
TP3: 0.10600
CAP is consolidating after the sharp move from 0.06345 to 0.10162. The current range around 0.086–0.089 can act as a continuation zone. A clean reclaim of 0.092 would strengthen the bullish move toward the next targets.
$BR
$龙虾
Entry: 0.08580 – 0.08720
Stop Loss: 0.08250
TP1: 0.09200
TP2: 0.09800
TP3: 0.10600
CAP is consolidating after the sharp move from 0.06345 to 0.10162. The current range around 0.086–0.089 can act as a continuation zone. A clean reclaim of 0.092 would strengthen the bullish move toward the next targets.
$BR
$龙虾
758
·
--
Bullisch
Übersetzung ansehen
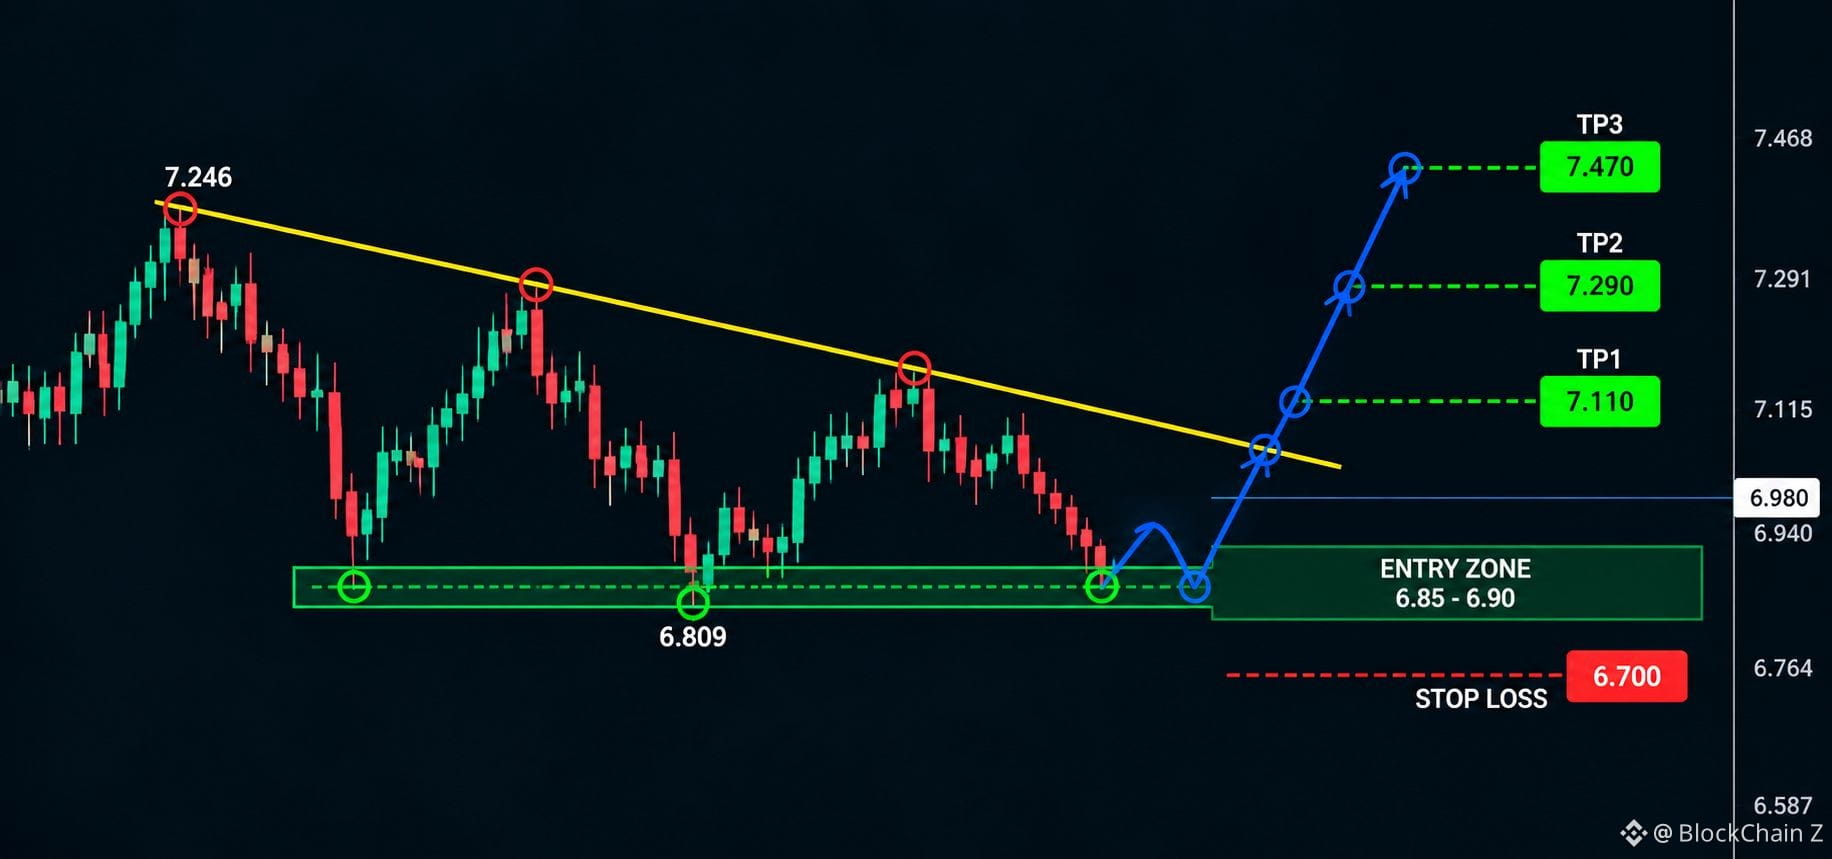
$ZEN Long Setup
Entry: 6.95 – 7.02
Stop Loss: 6.80
TP1: 7.12
TP2: 7.24
TP3: 7.40
ZEN is holding near the 6.90–6.95 support area after pulling back from 7.246. A bullish reaction from this zone could lead to a retest of 7.24 and potentially a continuation toward 7.40.
{future}(ZENUSDT)
$BR
{future}(BRUSDT)
$ORCA
{future}(ORCAUSDT)
$ZEN Long Setup
Entry: 6.95 – 7.02
Stop Loss: 6.80
TP1: 7.12
TP2: 7.24
TP3: 7.40
ZEN is holding near the 6.90–6.95 support area after pulling back from 7.246. A bullish reaction from this zone could lead to a retest of 7.24 and potentially a continuation toward 7.40.
$BR
$ORCA
Entry: 6.95 – 7.02
Stop Loss: 6.80
TP1: 7.12
TP2: 7.24
TP3: 7.40
ZEN is holding near the 6.90–6.95 support area after pulling back from 7.246. A bullish reaction from this zone could lead to a retest of 7.24 and potentially a continuation toward 7.40.
$BR
$ORCA
1
919
·
--
Bullisch
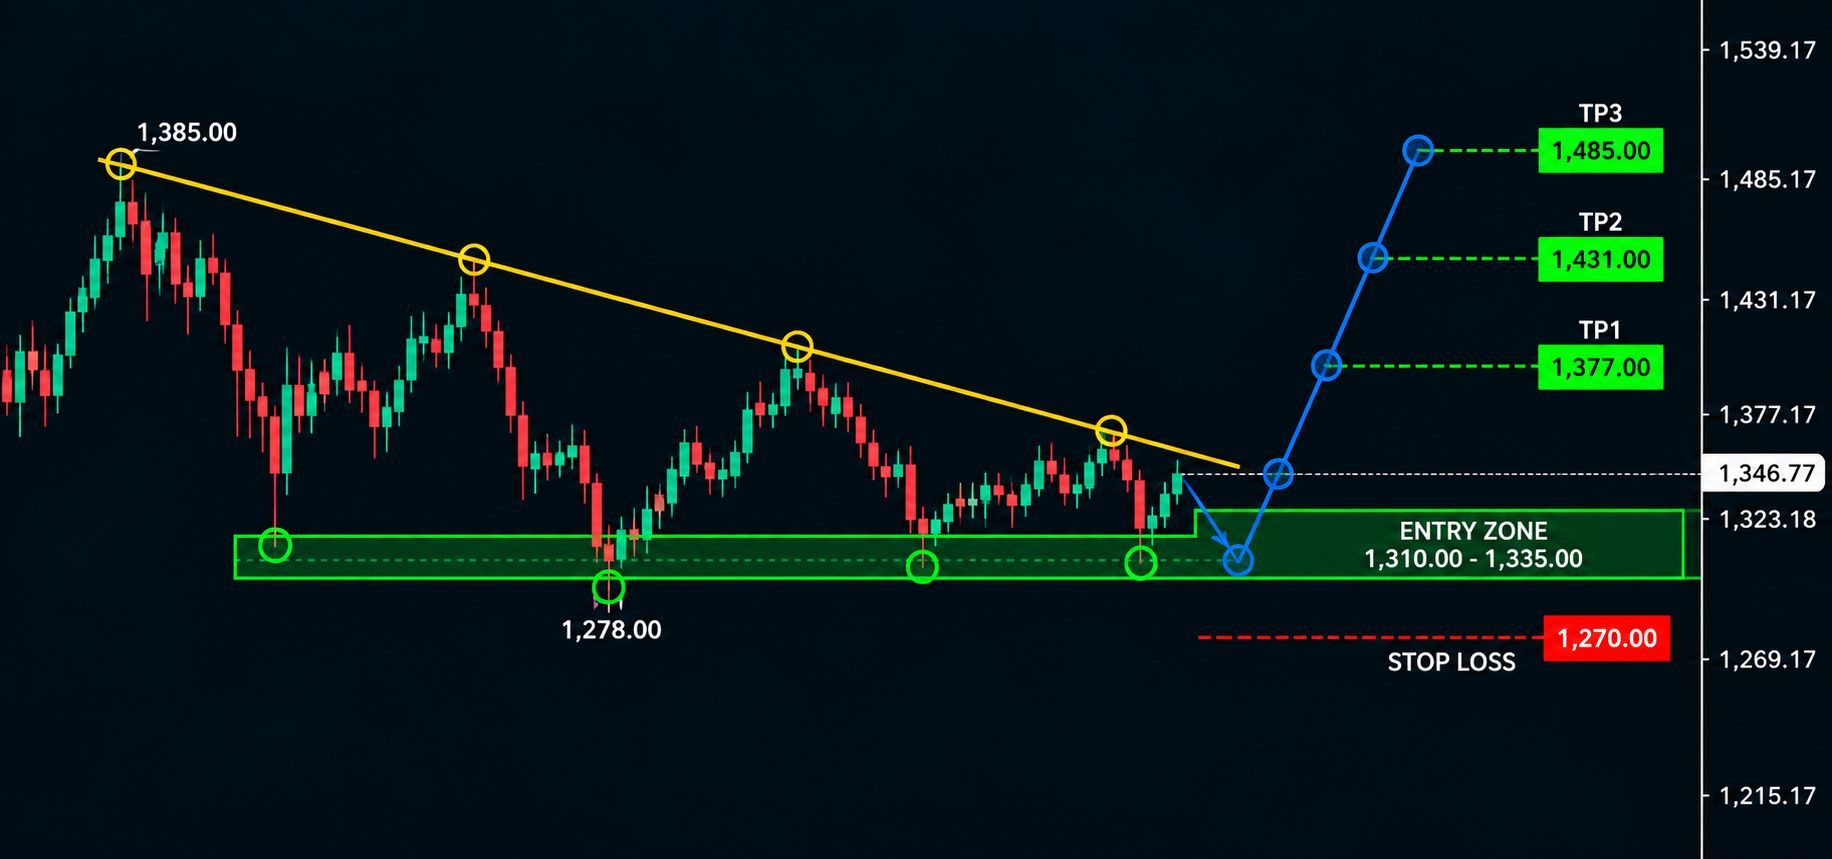
$ZEC Long-Setup
Einstieg: 1,338 – 1,350
Stop-Loss: 1,314
TP1: 1,365
TP2: 1,385
TP3: 1,420
ZEC versucht, sich nach dem Rücksetzer von 1,385 zu stabilisieren. Der Bereich von 1,323–1,338 dient als kurzfristige Unterstützung, während eine Rückeroberung von 1,385 das bullische Fortsetzungsszenario in Richtung 1,420 stärken würde.
{future}(ZECUSDT)
$BR
{future}(BRUSDT)
$龙虾
{future}(龙虾USDT)
$ZEC Long-Setup
Einstieg: 1,338 – 1,350
Stop-Loss: 1,314
TP1: 1,365
TP2: 1,385
TP3: 1,420
ZEC versucht, sich nach dem Rücksetzer von 1,385 zu stabilisieren. Der Bereich von 1,323–1,338 dient als kurzfristige Unterstützung, während eine Rückeroberung von 1,385 das bullische Fortsetzungsszenario in Richtung 1,420 stärken würde.
$BR
$龙虾
Einstieg: 1,338 – 1,350
Stop-Loss: 1,314
TP1: 1,365
TP2: 1,385
TP3: 1,420
ZEC versucht, sich nach dem Rücksetzer von 1,385 zu stabilisieren. Der Bereich von 1,323–1,338 dient als kurzfristige Unterstützung, während eine Rückeroberung von 1,385 das bullische Fortsetzungsszenario in Richtung 1,420 stärken würde.
$BR
$龙虾
1.4k
·
--
Bullisch
Übersetzung ansehen
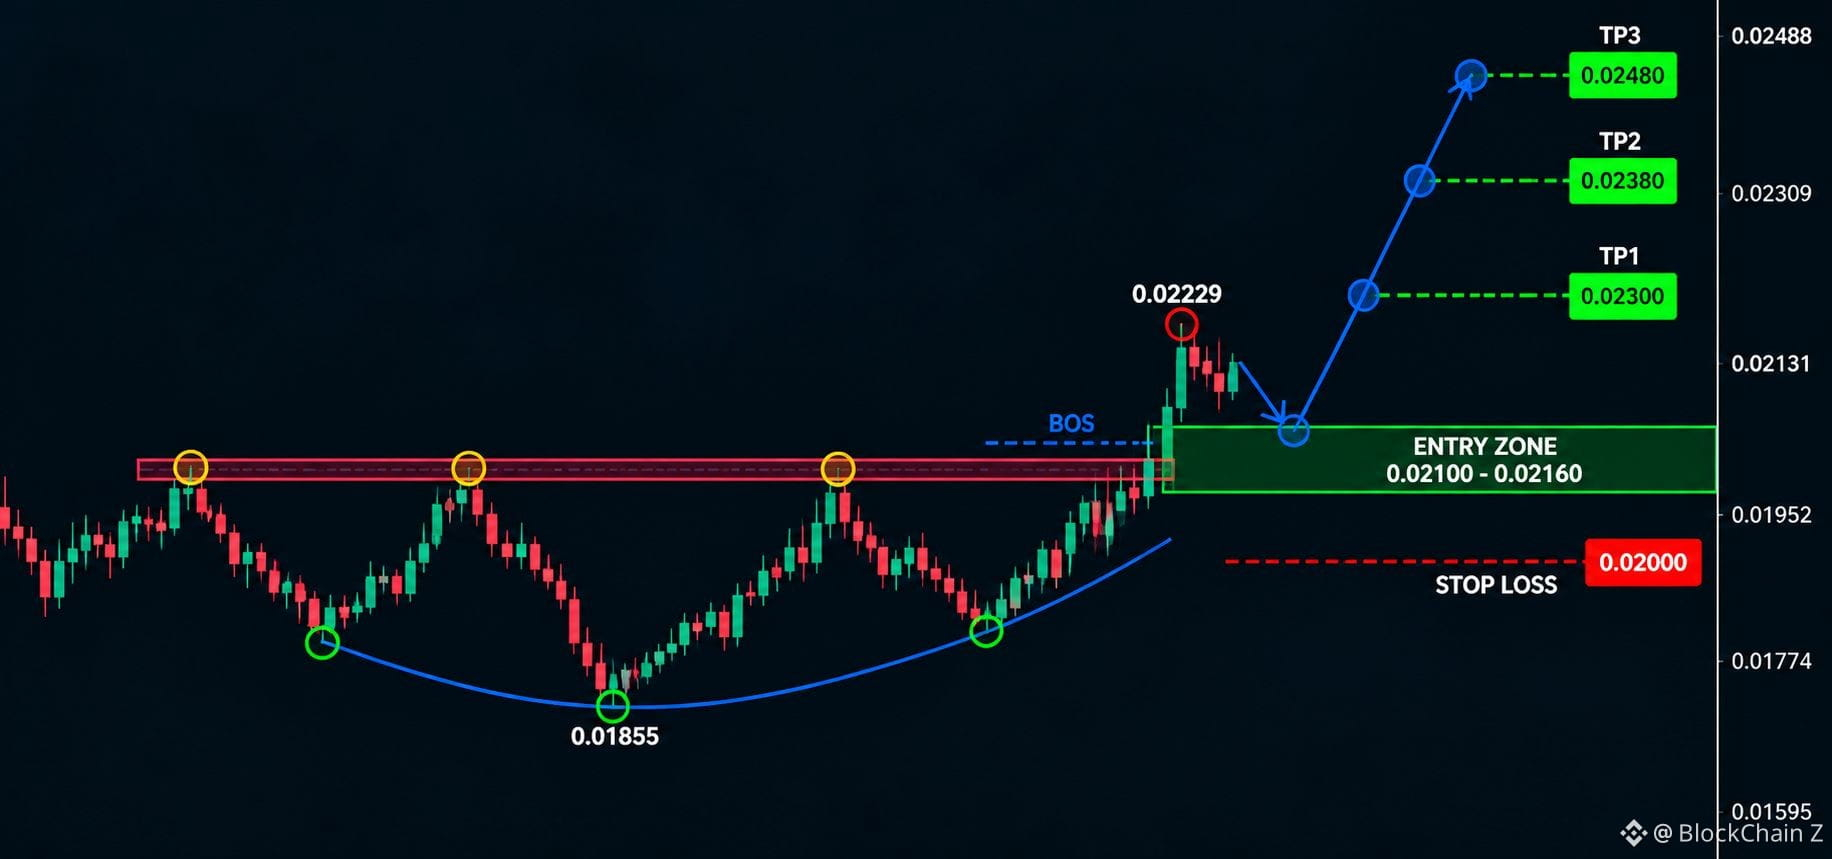
$RESOLV Long Setup
Entry: 0.02180 – 0.02215
Stop Loss: 0.02105
TP1: 0.02270
TP2: 0.02320
TP3: 0.02400
Strong bullish momentum is visible from the 0.01854 low, with consecutive higher highs and higher lows. Price is now testing 0.02229 resistance. A clean breakout and hold above this level could trigger the next upward leg.
{future}(RESOLVUSDT)
$BR
{future}(BRUSDT)
$龙虾
{future}(龙虾USDT)
$RESOLV Long Setup
Entry: 0.02180 – 0.02215
Stop Loss: 0.02105
TP1: 0.02270
TP2: 0.02320
TP3: 0.02400
Strong bullish momentum is visible from the 0.01854 low, with consecutive higher highs and higher lows. Price is now testing 0.02229 resistance. A clean breakout and hold above this level could trigger the next upward leg.
$BR
$龙虾
Entry: 0.02180 – 0.02215
Stop Loss: 0.02105
TP1: 0.02270
TP2: 0.02320
TP3: 0.02400
Strong bullish momentum is visible from the 0.01854 low, with consecutive higher highs and higher lows. Price is now testing 0.02229 resistance. A clean breakout and hold above this level could trigger the next upward leg.
$BR
$龙虾
1.4k
·
--
Bullisch
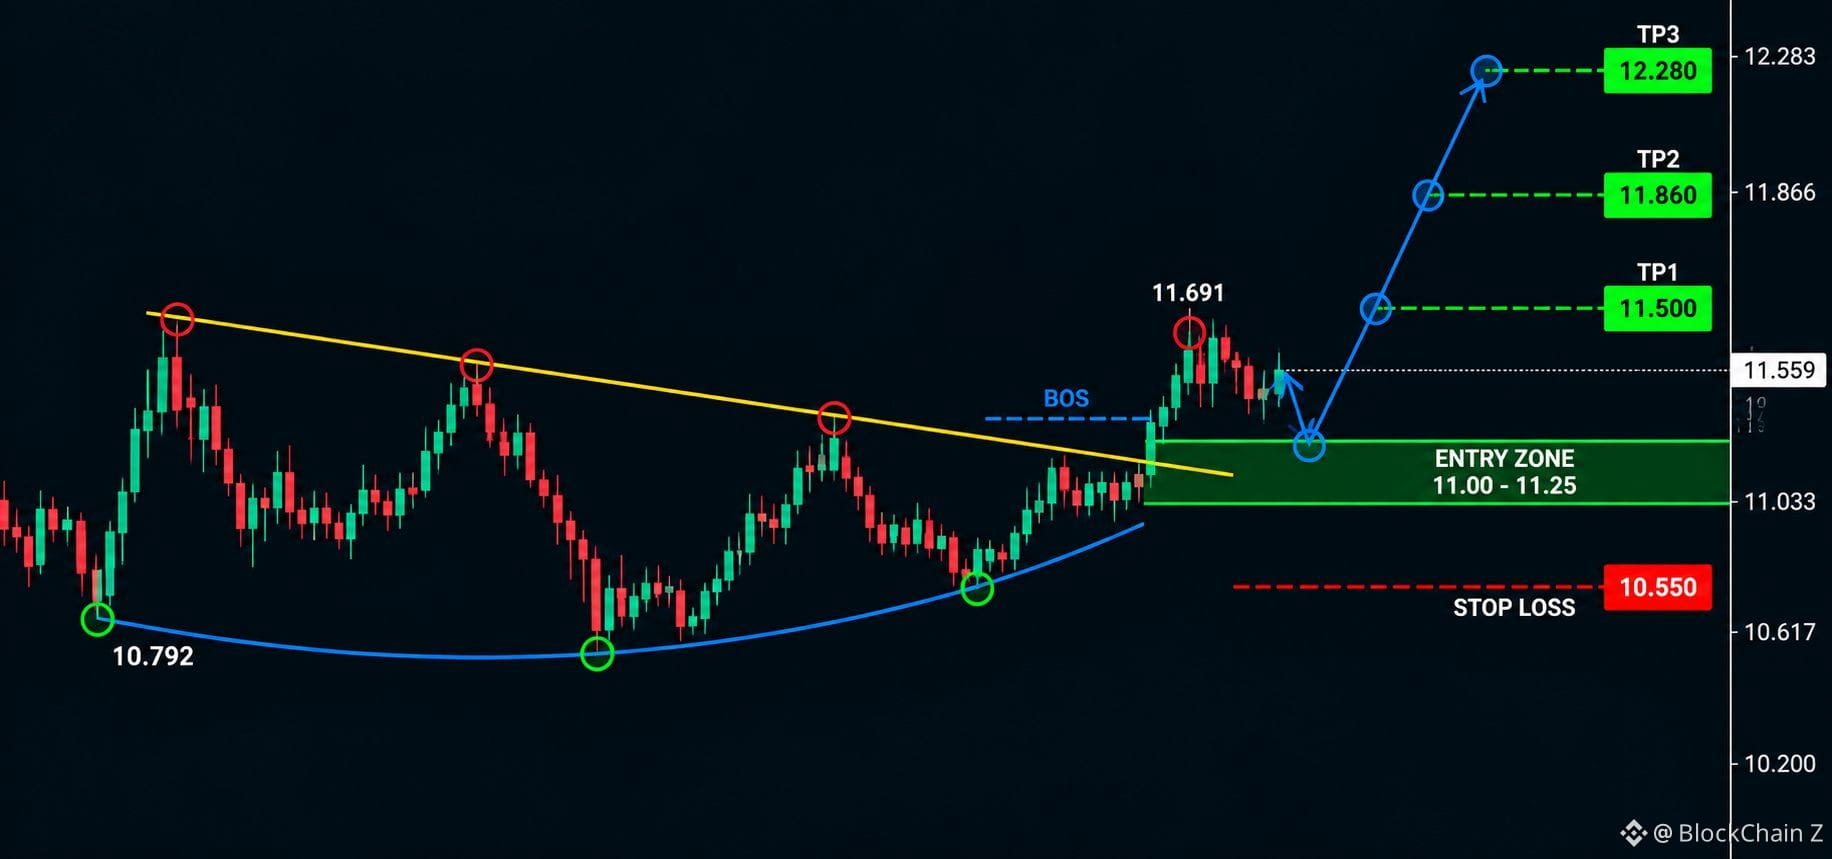
$AVAX Long-Setup
Einstieg: 11,45 – 11,58
Stop-Loss: 11,20
TP1: 11,70
TP2: 11,95
TP3: 12,25
AVAX hält nach der Bewegung von 10,792 eine starke Struktur mit höheren Tiefs und konsolidiert knapp unter dem Widerstand bei 11,691. Ein Ausbruch über 11,69 mit anschließendem Halten könnte den Weg zu den höheren Kurszielen ebnen.
{future}(AVAXUSDT)
$ORCA
{future}(ORCAUSDT)
$龙虾
{future}(龙虾USDT)
$AVAX Long-Setup
Einstieg: 11,45 – 11,58
Stop-Loss: 11,20
TP1: 11,70
TP2: 11,95
TP3: 12,25
AVAX hält nach der Bewegung von 10,792 eine starke Struktur mit höheren Tiefs und konsolidiert knapp unter dem Widerstand bei 11,691. Ein Ausbruch über 11,69 mit anschließendem Halten könnte den Weg zu den höheren Kurszielen ebnen.
$ORCA
$龙虾
Einstieg: 11,45 – 11,58
Stop-Loss: 11,20
TP1: 11,70
TP2: 11,95
TP3: 12,25
AVAX hält nach der Bewegung von 10,792 eine starke Struktur mit höheren Tiefs und konsolidiert knapp unter dem Widerstand bei 11,691. Ein Ausbruch über 11,69 mit anschließendem Halten könnte den Weg zu den höheren Kurszielen ebnen.
$ORCA
$龙虾
1
1.3k
·
--
Bullisch
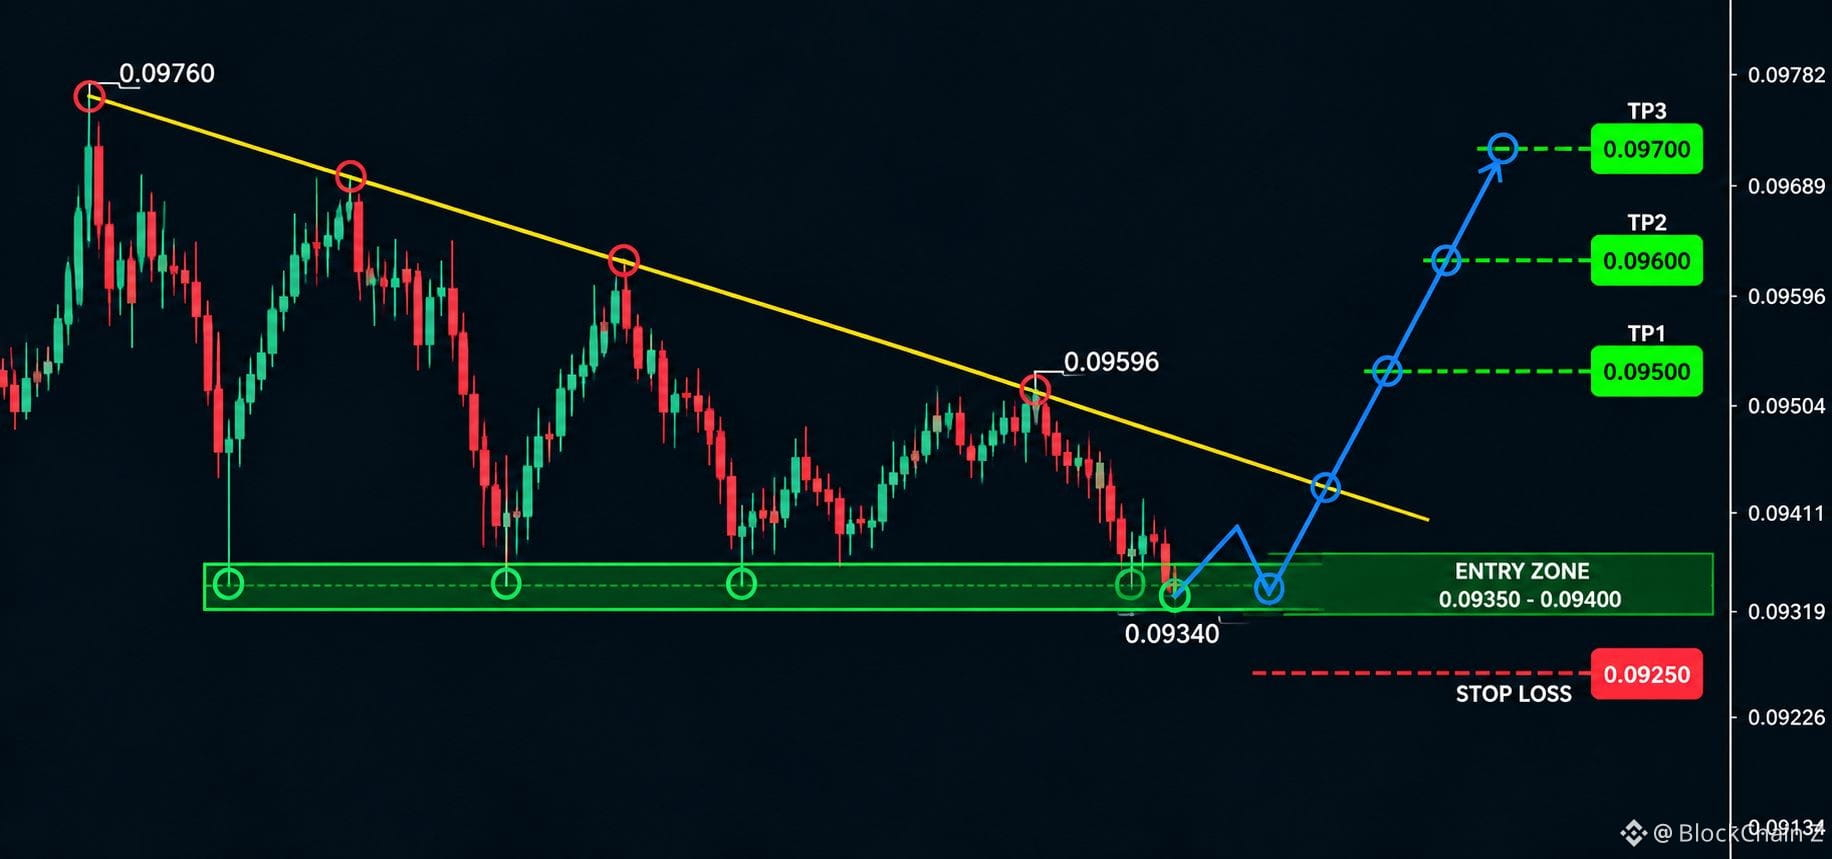
$DOGE Long-Setup
Einstieg: 0.09370 – 0.09410
Stop-Loss: 0.09290
TP1: 0.09480
TP2: 0.09560
TP3: 0.09650
DOGE versucht, sich nach einem starken Rückgang im Bereich der Unterstützung bei 0.09340 zu stabilisieren. Hält sich der Kurs oberhalb dieser Zone und kommt es zu einer bullischen Umkehr, könnte sich der Weg in Richtung 0.09560–0.09650 öffnen.
{future}(DOGEUSDT)
$ORCA
{future}(ORCAUSDT)
$龙虾
{future}(龙虾USDT)
$DOGE Long-Setup
Einstieg: 0.09370 – 0.09410
Stop-Loss: 0.09290
TP1: 0.09480
TP2: 0.09560
TP3: 0.09650
DOGE versucht, sich nach einem starken Rückgang im Bereich der Unterstützung bei 0.09340 zu stabilisieren. Hält sich der Kurs oberhalb dieser Zone und kommt es zu einer bullischen Umkehr, könnte sich der Weg in Richtung 0.09560–0.09650 öffnen.
$ORCA
$龙虾
Einstieg: 0.09370 – 0.09410
Stop-Loss: 0.09290
TP1: 0.09480
TP2: 0.09560
TP3: 0.09650
DOGE versucht, sich nach einem starken Rückgang im Bereich der Unterstützung bei 0.09340 zu stabilisieren. Hält sich der Kurs oberhalb dieser Zone und kommt es zu einer bullischen Umkehr, könnte sich der Weg in Richtung 0.09560–0.09650 öffnen.
$ORCA
$龙虾
962
·
--
Bullisch
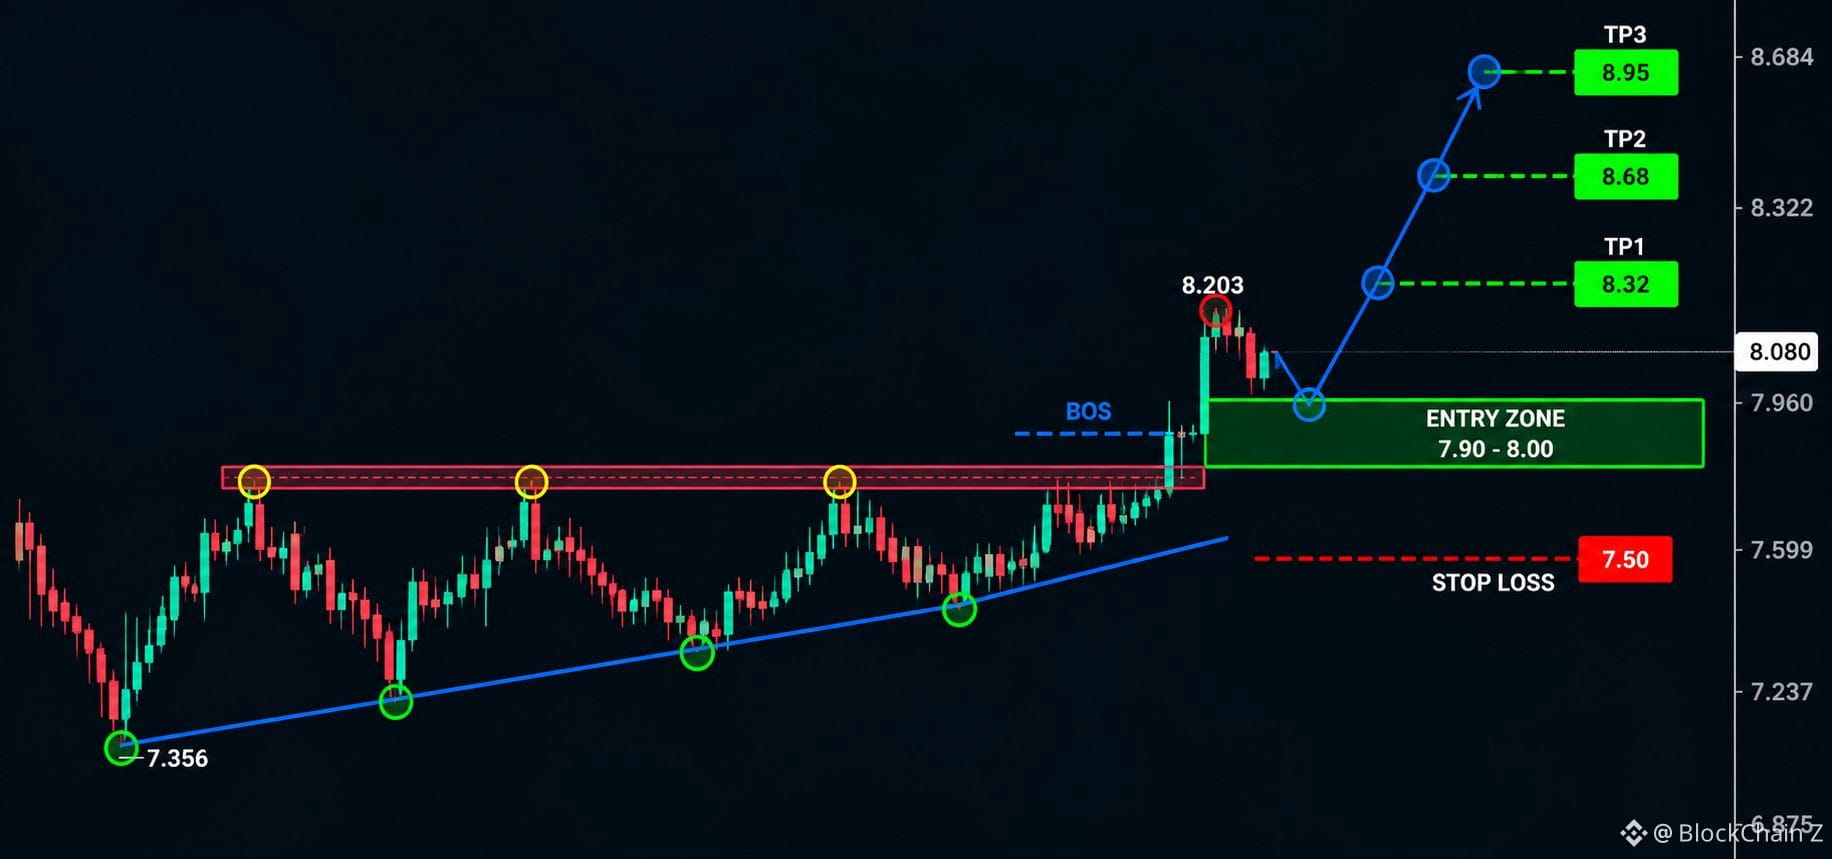
$INJ Momentum-Fortsetzungs-Setup
Long-Setup
Einstieg: 7.96 – 8.05
Stop-Loss: 7.72
TP1: 8.32
TP2: 8.68
TP3: 9.05
INJ zeigt eine starke Struktur mit höheren Tiefs und ist bis in den Widerstandsbereich bei 8.203 vorgedrungen. Ein klarer Ausbruch über 8.20 mit anschließendem Halt darüber könnte den Weg in Richtung 8.32 und anschließend 8.68 und 9.05 freimachen.
Der bevorzugte Ansatz ist ein Rücksetzer in die Zone von 7.96–8.05, statt der aktuellen Kerze hinterherzujagen. Eine anhaltende Bewegung unter 7.72 würde das Setup ungültig machen.
{future}(INJUSDT)
$ORCA
{future}(ORCAUSDT)
$龙虾
{future}(龙虾USDT)
$INJ Momentum-Fortsetzungs-Setup
Long-Setup
Einstieg: 7.96 – 8.05
Stop-Loss: 7.72
TP1: 8.32
TP2: 8.68
TP3: 9.05
INJ zeigt eine starke Struktur mit höheren Tiefs und ist bis in den Widerstandsbereich bei 8.203 vorgedrungen. Ein klarer Ausbruch über 8.20 mit anschließendem Halt darüber könnte den Weg in Richtung 8.32 und anschließend 8.68 und 9.05 freimachen.
Der bevorzugte Ansatz ist ein Rücksetzer in die Zone von 7.96–8.05, statt der aktuellen Kerze hinterherzujagen. Eine anhaltende Bewegung unter 7.72 würde das Setup ungültig machen.
$ORCA
$龙虾
Long-Setup
Einstieg: 7.96 – 8.05
Stop-Loss: 7.72
TP1: 8.32
TP2: 8.68
TP3: 9.05
INJ zeigt eine starke Struktur mit höheren Tiefs und ist bis in den Widerstandsbereich bei 8.203 vorgedrungen. Ein klarer Ausbruch über 8.20 mit anschließendem Halt darüber könnte den Weg in Richtung 8.32 und anschließend 8.68 und 9.05 freimachen.
Der bevorzugte Ansatz ist ein Rücksetzer in die Zone von 7.96–8.05, statt der aktuellen Kerze hinterherzujagen. Eine anhaltende Bewegung unter 7.72 würde das Setup ungültig machen.
$ORCA
$龙虾
1.3k
·
--
Bullisch
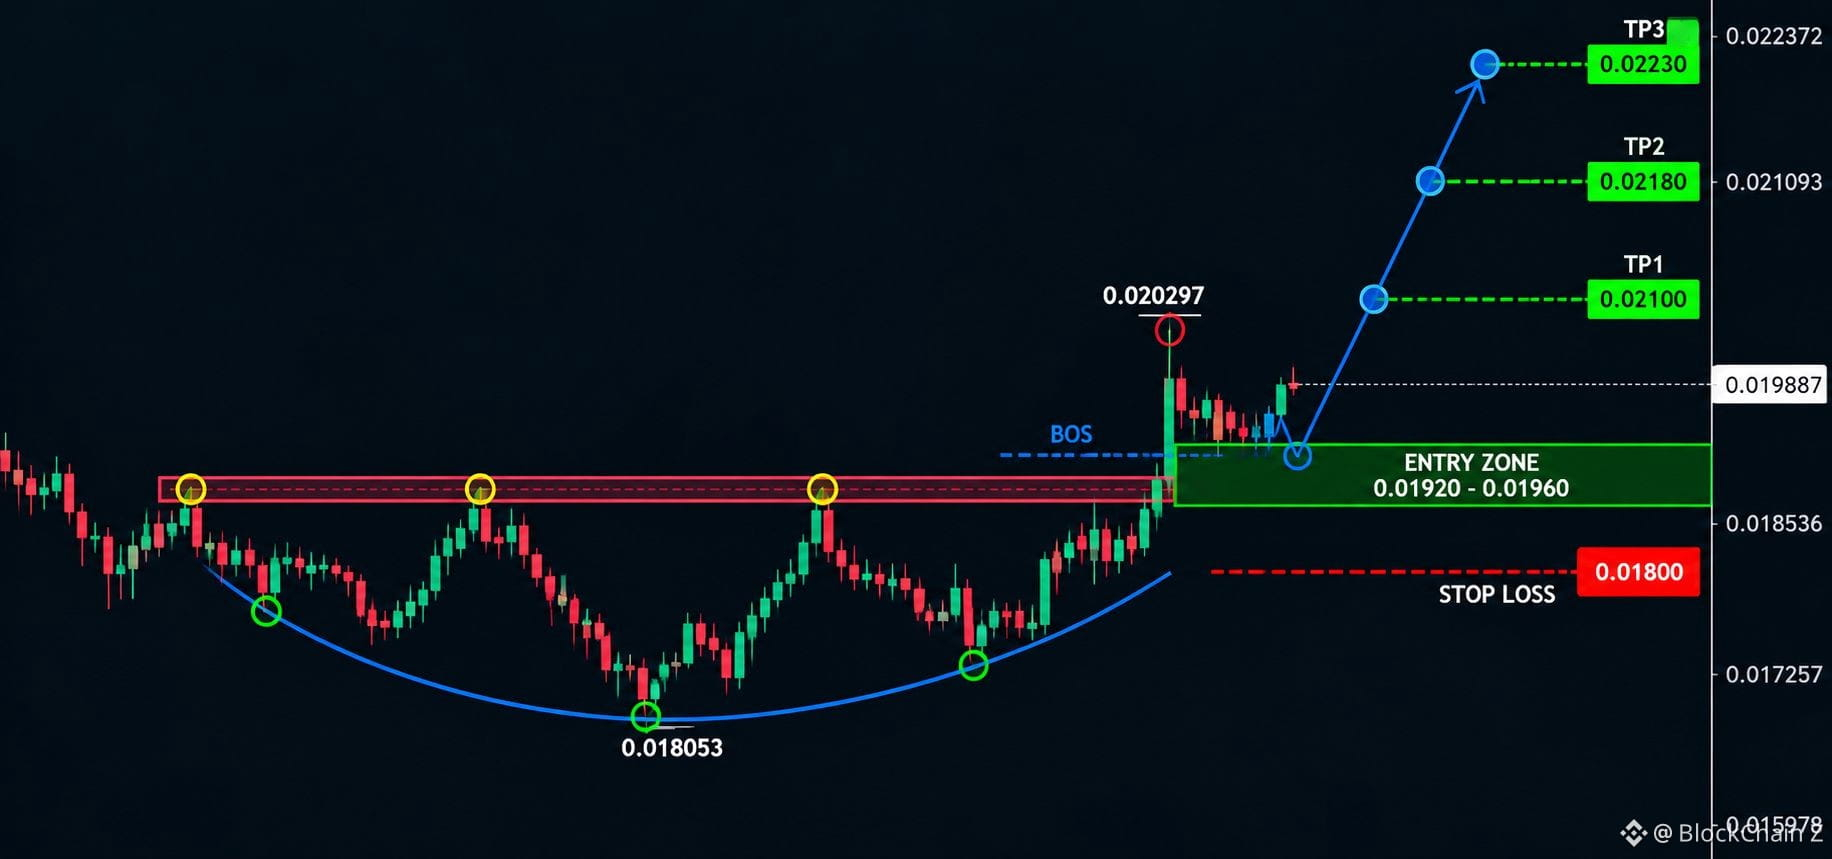
$4 Ausbruch-und-Retest-Setup
Long-Setup
Einstieg: 0.01945 – 0.01985
Stop-Loss: 0.01885
TP1: 0.02030
TP2: 0.02109
TP3: 0.02237
4 hat sich kräftig von 0.018053 erholt und nähert sich nun dem jüngsten Hoch bei 0.020297. Die Struktur bildet zunehmend höhere Tiefs aus, begleitet von neuer Aufwärtsdynamik.
Ein bestätigter Ausbruch über 0.020297 könnte den Weg in Richtung 0.02109 und 0.02237 freimachen. Die Zone von 0.01945–0.01985 ist der bevorzugte Bereich für einen Rücksetzer/Retest. Ein anhaltender Rückgang unter 0.01885 würde das Setup ungültig machen.
{future}(4USDT)
$BR
{future}(BRUSDT)
$龙虾
{future}(龙虾USDT)
$4 Ausbruch-und-Retest-Setup
Long-Setup
Einstieg: 0.01945 – 0.01985
Stop-Loss: 0.01885
TP1: 0.02030
TP2: 0.02109
TP3: 0.02237
4 hat sich kräftig von 0.018053 erholt und nähert sich nun dem jüngsten Hoch bei 0.020297. Die Struktur bildet zunehmend höhere Tiefs aus, begleitet von neuer Aufwärtsdynamik.
Ein bestätigter Ausbruch über 0.020297 könnte den Weg in Richtung 0.02109 und 0.02237 freimachen. Die Zone von 0.01945–0.01985 ist der bevorzugte Bereich für einen Rücksetzer/Retest. Ein anhaltender Rückgang unter 0.01885 würde das Setup ungültig machen.
$BR
$龙虾
Long-Setup
Einstieg: 0.01945 – 0.01985
Stop-Loss: 0.01885
TP1: 0.02030
TP2: 0.02109
TP3: 0.02237
4 hat sich kräftig von 0.018053 erholt und nähert sich nun dem jüngsten Hoch bei 0.020297. Die Struktur bildet zunehmend höhere Tiefs aus, begleitet von neuer Aufwärtsdynamik.
Ein bestätigter Ausbruch über 0.020297 könnte den Weg in Richtung 0.02109 und 0.02237 freimachen. Die Zone von 0.01945–0.01985 ist der bevorzugte Bereich für einen Rücksetzer/Retest. Ein anhaltender Rückgang unter 0.01885 würde das Setup ungültig machen.
$BR
$龙虾
1
2.1k
·
--
Bullisch
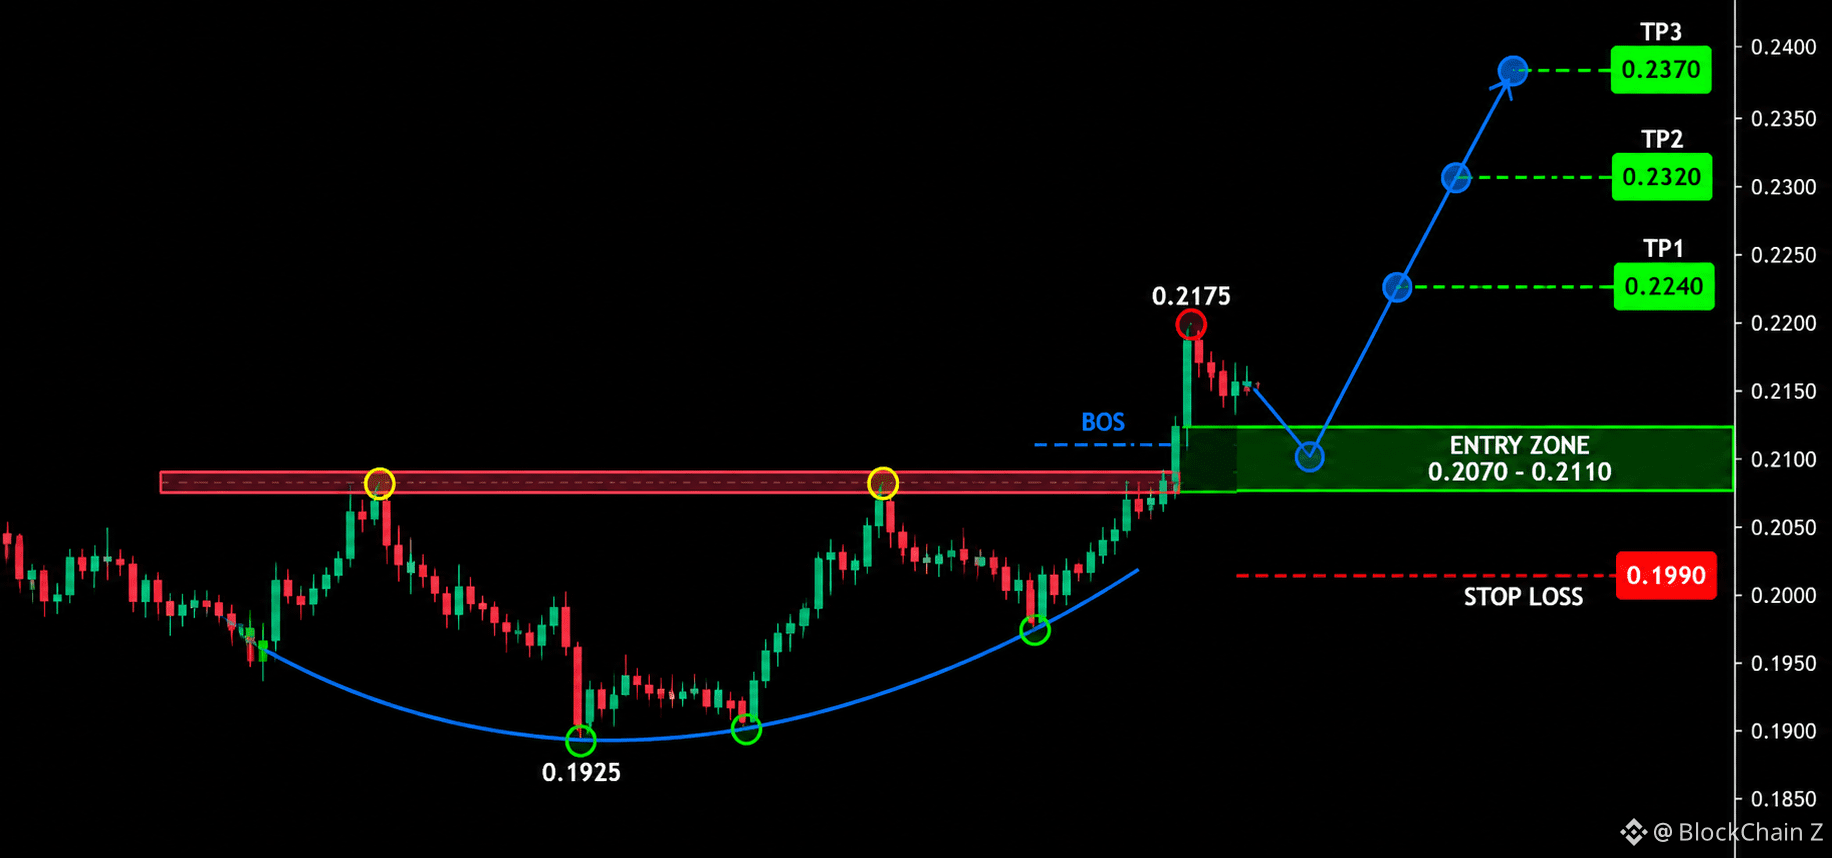
$LIGHT Bullishes Fortsetzungsszenario
Long-Setup
Einstieg: 0.2110 – 0.2150
Stop-Loss: 0.2050
TP1: 0.2175
TP2: 0.2243
TP3: 0.2372
LIGHT hält nach der Erholung von 0.1925 an einer starken Struktur mit höheren Tiefs fest. Der Kurs testet nun mit bullischem Momentum den Widerstand bei 0.2175.
Ein klarer Ausbruch über 0.2175 mit anschließendem Halt könnte den Weg in Richtung 0.2243 und 0.2372 ebnen. Die Zone zwischen 0.2110 und 0.2150 ist der bevorzugte Bereich für einen erneuten Test. Eine anhaltende Bewegung unter 0.2050 würde das Setup ungültig machen.
{future}(LIGHTUSDT)
$RLC
{future}(RLCUSDT)
$BR
{future}(BRUSDT)
$LIGHT Bullishes Fortsetzungsszenario
Long-Setup
Einstieg: 0.2110 – 0.2150
Stop-Loss: 0.2050
TP1: 0.2175
TP2: 0.2243
TP3: 0.2372
LIGHT hält nach der Erholung von 0.1925 an einer starken Struktur mit höheren Tiefs fest. Der Kurs testet nun mit bullischem Momentum den Widerstand bei 0.2175.
Ein klarer Ausbruch über 0.2175 mit anschließendem Halt könnte den Weg in Richtung 0.2243 und 0.2372 ebnen. Die Zone zwischen 0.2110 und 0.2150 ist der bevorzugte Bereich für einen erneuten Test. Eine anhaltende Bewegung unter 0.2050 würde das Setup ungültig machen.
$RLC
$BR
Long-Setup
Einstieg: 0.2110 – 0.2150
Stop-Loss: 0.2050
TP1: 0.2175
TP2: 0.2243
TP3: 0.2372
LIGHT hält nach der Erholung von 0.1925 an einer starken Struktur mit höheren Tiefs fest. Der Kurs testet nun mit bullischem Momentum den Widerstand bei 0.2175.
Ein klarer Ausbruch über 0.2175 mit anschließendem Halt könnte den Weg in Richtung 0.2243 und 0.2372 ebnen. Die Zone zwischen 0.2110 und 0.2150 ist der bevorzugte Bereich für einen erneuten Test. Eine anhaltende Bewegung unter 0.2050 würde das Setup ungültig machen.
$RLC
$BR
786
·
--
Bullisch
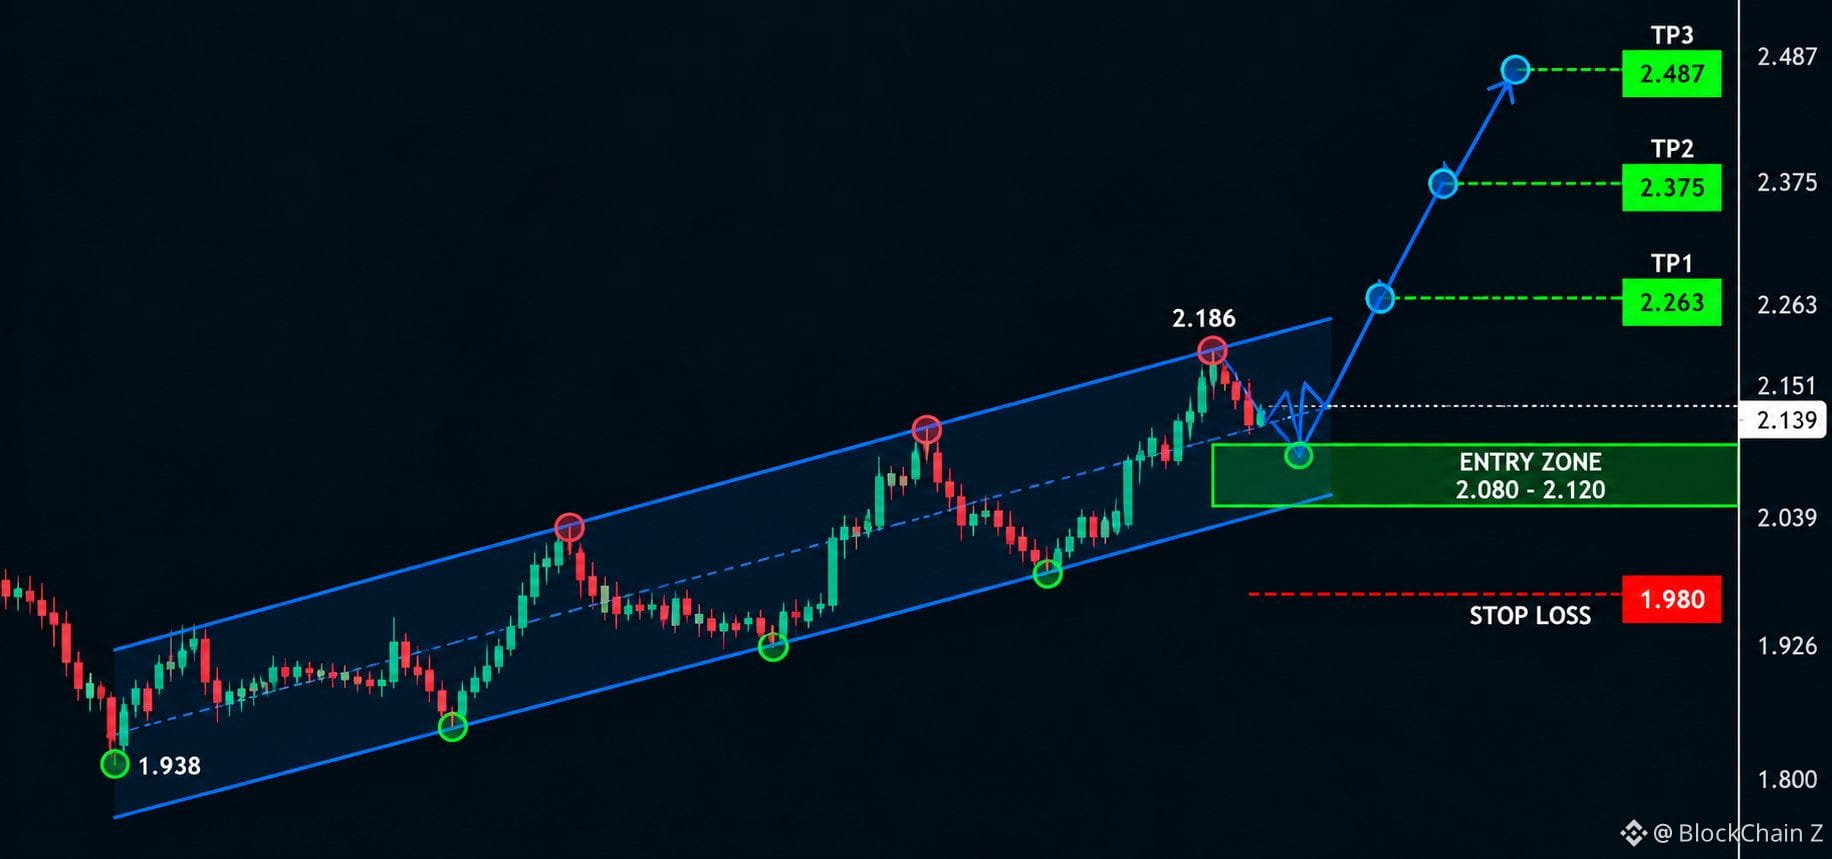
$RENDER Fortsetzung des Aufwärtstrends
Long-Setup
Einstieg: 2.105 – 2.145
Stop-Loss: 2.045
TP1: 2.186
TP2: 2.263
TP3: 2.375
RENDER hält an einer klaren bullischen Struktur fest, nachdem sich der Kurs vom Tief bei 1.938 erholt hat. Der Kurs hat eine Folge höherer Tiefs gebildet und konsolidiert nun knapp unter dem Widerstand bei 2.186.
Ein klarer Ausbruch über 2.186 mit anschließendem Halten könnte eine Fortsetzung in Richtung 2.263 und 2.375 auslösen. Der Bereich von 2.105–2.145 ist die bevorzugte Pullback-Zone. Ein anhaltender Kursrückgang unter 2.045 würde das Setup ungültig machen.
{future}(RENDERUSDT)
$BR
{future}(BRUSDT)
$RLC
{future}(RLCUSDT)
$RENDER Fortsetzung des Aufwärtstrends
Long-Setup
Einstieg: 2.105 – 2.145
Stop-Loss: 2.045
TP1: 2.186
TP2: 2.263
TP3: 2.375
RENDER hält an einer klaren bullischen Struktur fest, nachdem sich der Kurs vom Tief bei 1.938 erholt hat. Der Kurs hat eine Folge höherer Tiefs gebildet und konsolidiert nun knapp unter dem Widerstand bei 2.186.
Ein klarer Ausbruch über 2.186 mit anschließendem Halten könnte eine Fortsetzung in Richtung 2.263 und 2.375 auslösen. Der Bereich von 2.105–2.145 ist die bevorzugte Pullback-Zone. Ein anhaltender Kursrückgang unter 2.045 würde das Setup ungültig machen.
$BR
$RLC
Long-Setup
Einstieg: 2.105 – 2.145
Stop-Loss: 2.045
TP1: 2.186
TP2: 2.263
TP3: 2.375
RENDER hält an einer klaren bullischen Struktur fest, nachdem sich der Kurs vom Tief bei 1.938 erholt hat. Der Kurs hat eine Folge höherer Tiefs gebildet und konsolidiert nun knapp unter dem Widerstand bei 2.186.
Ein klarer Ausbruch über 2.186 mit anschließendem Halten könnte eine Fortsetzung in Richtung 2.263 und 2.375 auslösen. Der Bereich von 2.105–2.145 ist die bevorzugte Pullback-Zone. Ein anhaltender Kursrückgang unter 2.045 würde das Setup ungültig machen.
$BR
$RLC
287
·
--
Bullisch
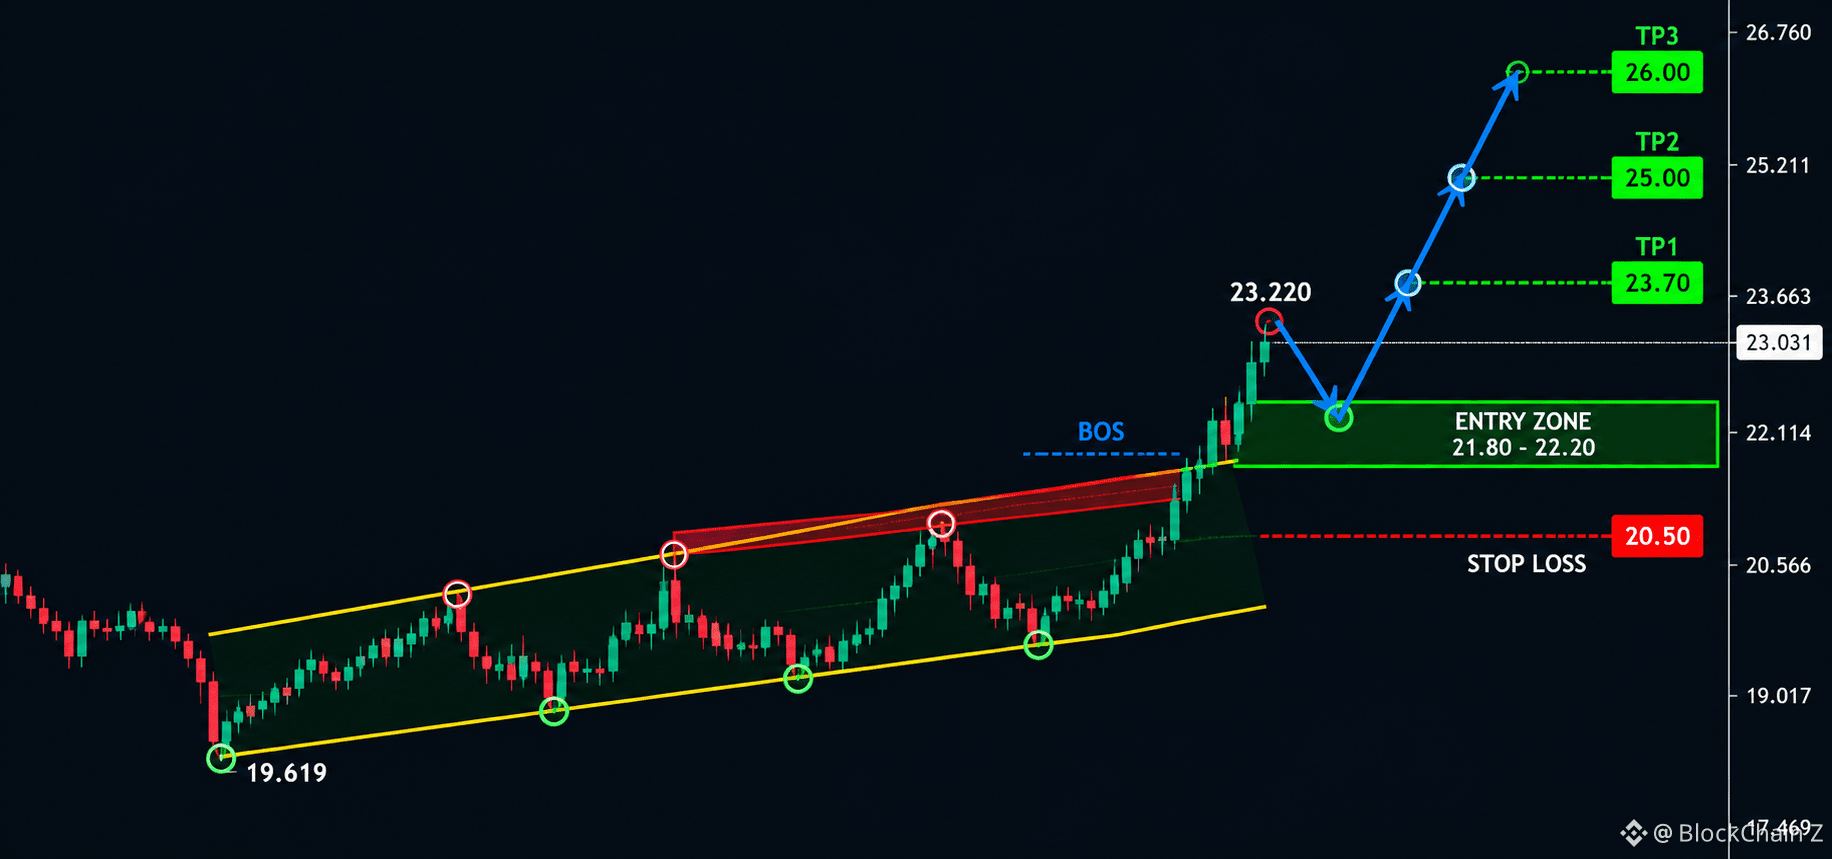
$TRB Frische Ausbruch-Fortsetzung
Long-Setup
Einstieg: 22.40 – 22.90
Stop-Loss: 21.70
TP1: 23.22
TP2: 23.66
TP3: 25.21
TRB hat sich vom Tief bei 19.619 stark beschleunigt und wird derzeit nahe dem Widerstand bei 23.22 gehandelt. Die Struktur zeigt deutlich höhere Hochs und höhere Tiefs bei anhaltendem Aufwärtsmomentum.
Ein bestätigter Ausbruch über 23.22 könnte den Weg zu den nächsten Kurszielen bei 23.66 und 25.21 freimachen. Die Zone von 22.40–22.90 ist der bevorzugte Bereich für einen Rücksetzer/Retest, statt der steilen Bewegung hinterherzulaufen. Ein anhaltender Durchbruch unter 21.70 würde das Setup schwächen.
{future}(TRBUSDT)
$RLC
{future}(RLCUSDT)
$BR
{future}(BRUSDT)
$TRB Frische Ausbruch-Fortsetzung
Long-Setup
Einstieg: 22.40 – 22.90
Stop-Loss: 21.70
TP1: 23.22
TP2: 23.66
TP3: 25.21
TRB hat sich vom Tief bei 19.619 stark beschleunigt und wird derzeit nahe dem Widerstand bei 23.22 gehandelt. Die Struktur zeigt deutlich höhere Hochs und höhere Tiefs bei anhaltendem Aufwärtsmomentum.
Ein bestätigter Ausbruch über 23.22 könnte den Weg zu den nächsten Kurszielen bei 23.66 und 25.21 freimachen. Die Zone von 22.40–22.90 ist der bevorzugte Bereich für einen Rücksetzer/Retest, statt der steilen Bewegung hinterherzulaufen. Ein anhaltender Durchbruch unter 21.70 würde das Setup schwächen.
$RLC
$BR
Long-Setup
Einstieg: 22.40 – 22.90
Stop-Loss: 21.70
TP1: 23.22
TP2: 23.66
TP3: 25.21
TRB hat sich vom Tief bei 19.619 stark beschleunigt und wird derzeit nahe dem Widerstand bei 23.22 gehandelt. Die Struktur zeigt deutlich höhere Hochs und höhere Tiefs bei anhaltendem Aufwärtsmomentum.
Ein bestätigter Ausbruch über 23.22 könnte den Weg zu den nächsten Kurszielen bei 23.66 und 25.21 freimachen. Die Zone von 22.40–22.90 ist der bevorzugte Bereich für einen Rücksetzer/Retest, statt der steilen Bewegung hinterherzulaufen. Ein anhaltender Durchbruch unter 21.70 würde das Setup schwächen.
$RLC
$BR
604
·
--
Bullisch
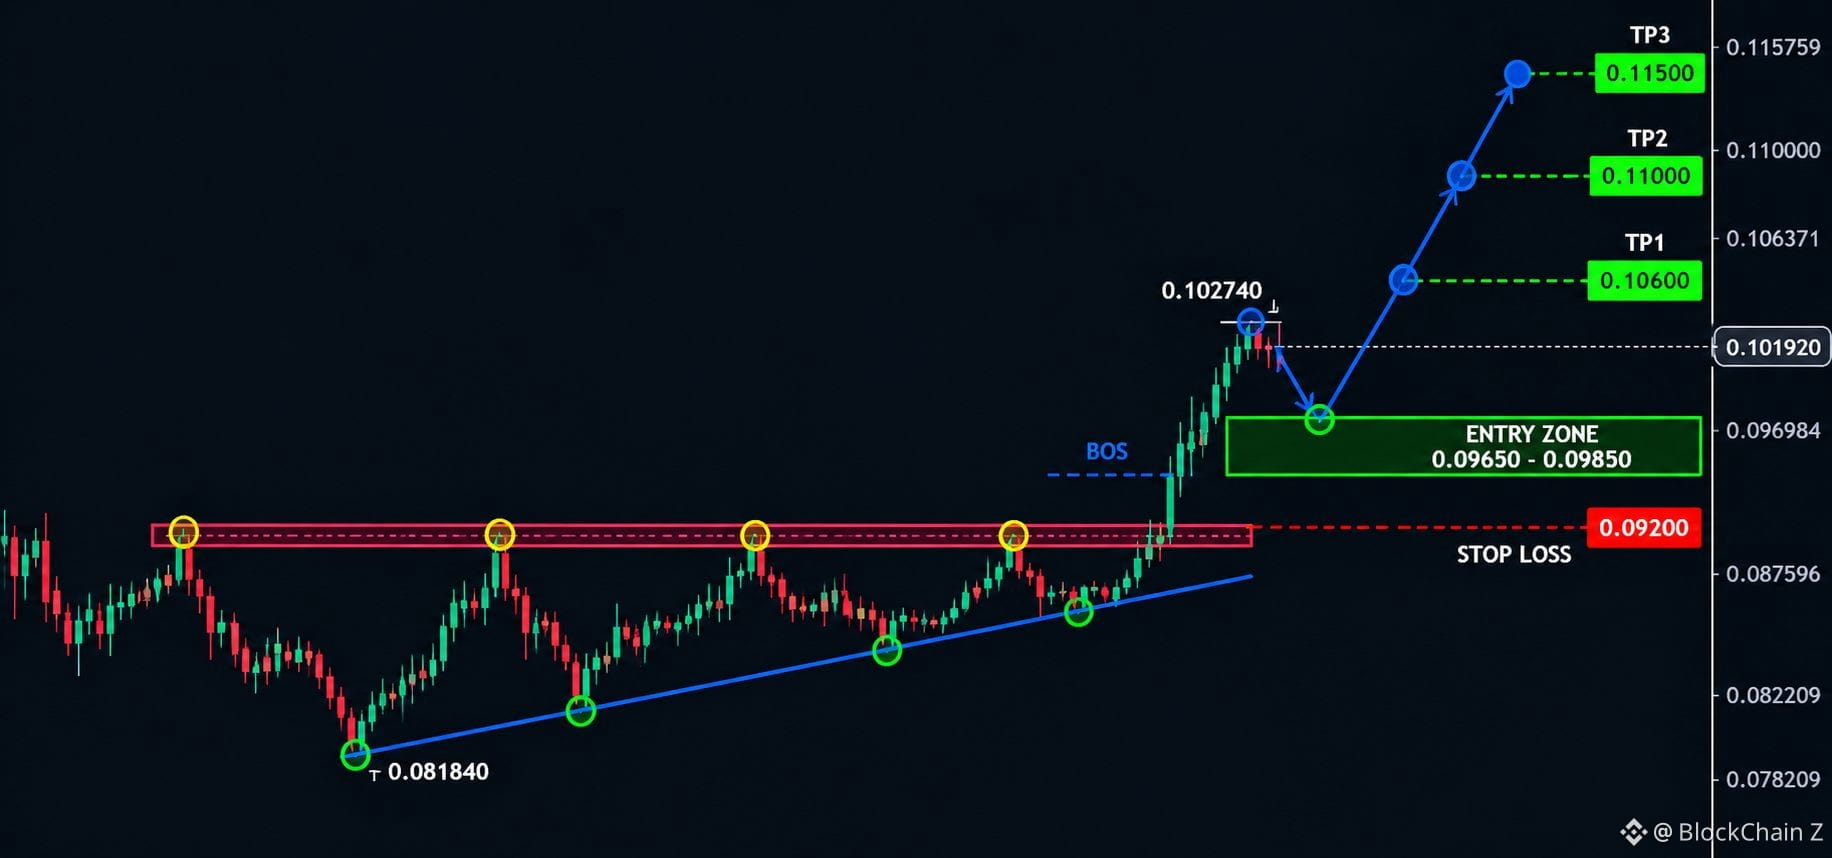
$BULLA Ausbruch mit starkem Aufwärtsmomentum
Long-Setup
Einstieg: 0.09750 – 0.10150
Stop-Loss: 0.09380
TP1: 0.10274
TP2: 0.10637
TP3: 0.11575
BULLA ist nach der Verteidigung des Tiefs bei 0.08184 in eine starke bullische Expansion übergegangen. Die jüngsten Kerzen zeigen ein aggressives Aufwärtsmomentum, wobei der Kurs nun den Widerstand bei 0.10274 testet.
Ein klarer Ausbruch über 0.10274 mit anschließendem Halten dieses Niveaus könnte die nächste Aufwärtsbewegung in Richtung 0.10637 auslösen, gefolgt von 0.11575. Der Bereich von 0.09750–0.10150 ist die entscheidende Zone für einen kontrollierten Retest. Ein anhaltender Rückgang unter 0.09380 würde das Setup ungültig machen.
{future}(BULLAUSDT)
$RLC
{future}(RLCUSDT)
$BR
{future}(BRUSDT)
$BULLA Ausbruch mit starkem Aufwärtsmomentum
Long-Setup
Einstieg: 0.09750 – 0.10150
Stop-Loss: 0.09380
TP1: 0.10274
TP2: 0.10637
TP3: 0.11575
BULLA ist nach der Verteidigung des Tiefs bei 0.08184 in eine starke bullische Expansion übergegangen. Die jüngsten Kerzen zeigen ein aggressives Aufwärtsmomentum, wobei der Kurs nun den Widerstand bei 0.10274 testet.
Ein klarer Ausbruch über 0.10274 mit anschließendem Halten dieses Niveaus könnte die nächste Aufwärtsbewegung in Richtung 0.10637 auslösen, gefolgt von 0.11575. Der Bereich von 0.09750–0.10150 ist die entscheidende Zone für einen kontrollierten Retest. Ein anhaltender Rückgang unter 0.09380 würde das Setup ungültig machen.
$RLC
$BR
Long-Setup
Einstieg: 0.09750 – 0.10150
Stop-Loss: 0.09380
TP1: 0.10274
TP2: 0.10637
TP3: 0.11575
BULLA ist nach der Verteidigung des Tiefs bei 0.08184 in eine starke bullische Expansion übergegangen. Die jüngsten Kerzen zeigen ein aggressives Aufwärtsmomentum, wobei der Kurs nun den Widerstand bei 0.10274 testet.
Ein klarer Ausbruch über 0.10274 mit anschließendem Halten dieses Niveaus könnte die nächste Aufwärtsbewegung in Richtung 0.10637 auslösen, gefolgt von 0.11575. Der Bereich von 0.09750–0.10150 ist die entscheidende Zone für einen kontrollierten Retest. Ein anhaltender Rückgang unter 0.09380 würde das Setup ungültig machen.
$RLC
$BR
433
·
--
Bullisch
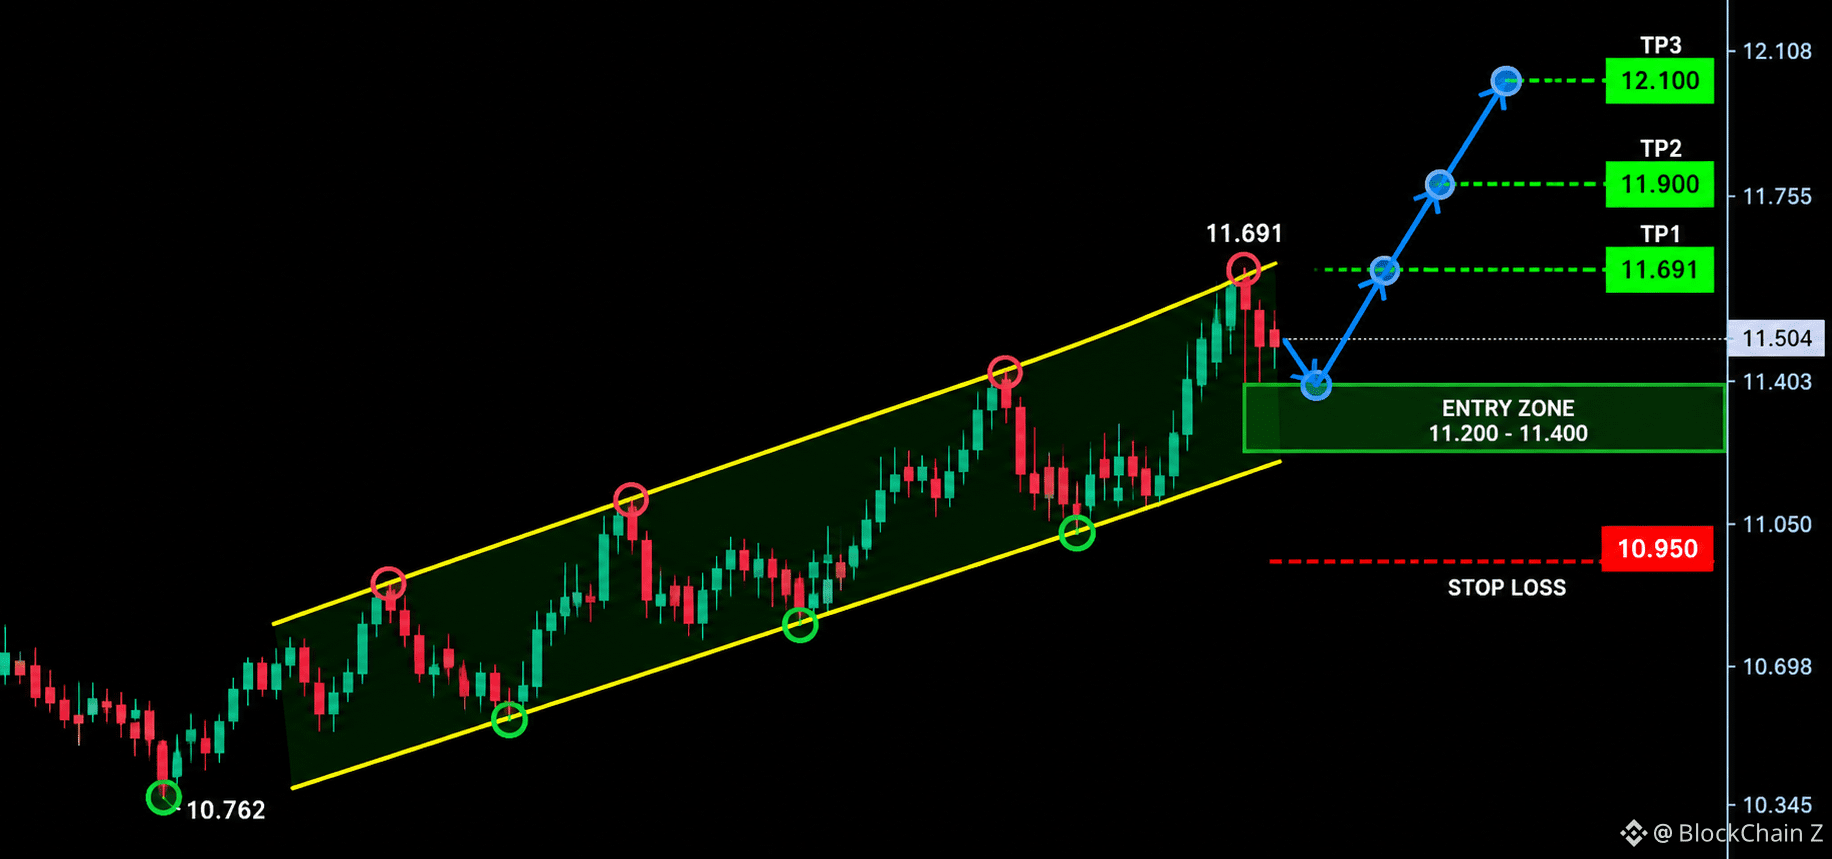
$AVAX BULLISCHES LONG-MOMENTUM
Einstieg: 11.35 – 11.50
Stop-Loss: 11.20
TP1: 11.691
TP2: 11.755
TP3: 12.108
AVAXUSDT zeigt im 1-Stunden-Chart eine starke bullische Struktur, nachdem das Tief bei 10.762 verteidigt wurde. Die Käufer haben den Kurs stetig nach oben getrieben, den Bereich um 11.050 zurückerobert und eine Folge höherer Hochs und höherer Tiefs gebildet.
Der Kurs notiert derzeit bei etwa 11.504, knapp unter dem jüngsten Widerstand bei 11.691. Ein klarer Ausbruch über 11.691 mit anschließendem Halt darüber könnte den Weg in Richtung 11.755 und möglicherweise 12.108 freimachen. Die Zone von 11.35–11.50 kann auf einen kontrollierten erneuten Test und eine Fortsetzung der Bewegung beobachtet werden. Ein anhaltender Rückgang unter 11.20 würde das bullische Setup schwächen.
{future}(AVAXUSDT)
$RLC
{future}(RLCUSDT)
$BR
{future}(BRUSDT)
$AVAX BULLISCHES LONG-MOMENTUM
Einstieg: 11.35 – 11.50
Stop-Loss: 11.20
TP1: 11.691
TP2: 11.755
TP3: 12.108
AVAXUSDT zeigt im 1-Stunden-Chart eine starke bullische Struktur, nachdem das Tief bei 10.762 verteidigt wurde. Die Käufer haben den Kurs stetig nach oben getrieben, den Bereich um 11.050 zurückerobert und eine Folge höherer Hochs und höherer Tiefs gebildet.
Der Kurs notiert derzeit bei etwa 11.504, knapp unter dem jüngsten Widerstand bei 11.691. Ein klarer Ausbruch über 11.691 mit anschließendem Halt darüber könnte den Weg in Richtung 11.755 und möglicherweise 12.108 freimachen. Die Zone von 11.35–11.50 kann auf einen kontrollierten erneuten Test und eine Fortsetzung der Bewegung beobachtet werden. Ein anhaltender Rückgang unter 11.20 würde das bullische Setup schwächen.
$RLC
$BR
Einstieg: 11.35 – 11.50
Stop-Loss: 11.20
TP1: 11.691
TP2: 11.755
TP3: 12.108
AVAXUSDT zeigt im 1-Stunden-Chart eine starke bullische Struktur, nachdem das Tief bei 10.762 verteidigt wurde. Die Käufer haben den Kurs stetig nach oben getrieben, den Bereich um 11.050 zurückerobert und eine Folge höherer Hochs und höherer Tiefs gebildet.
Der Kurs notiert derzeit bei etwa 11.504, knapp unter dem jüngsten Widerstand bei 11.691. Ein klarer Ausbruch über 11.691 mit anschließendem Halt darüber könnte den Weg in Richtung 11.755 und möglicherweise 12.108 freimachen. Die Zone von 11.35–11.50 kann auf einen kontrollierten erneuten Test und eine Fortsetzung der Bewegung beobachtet werden. Ein anhaltender Rückgang unter 11.20 würde das bullische Setup schwächen.
$RLC
$BR
463
·
--
Bullisch
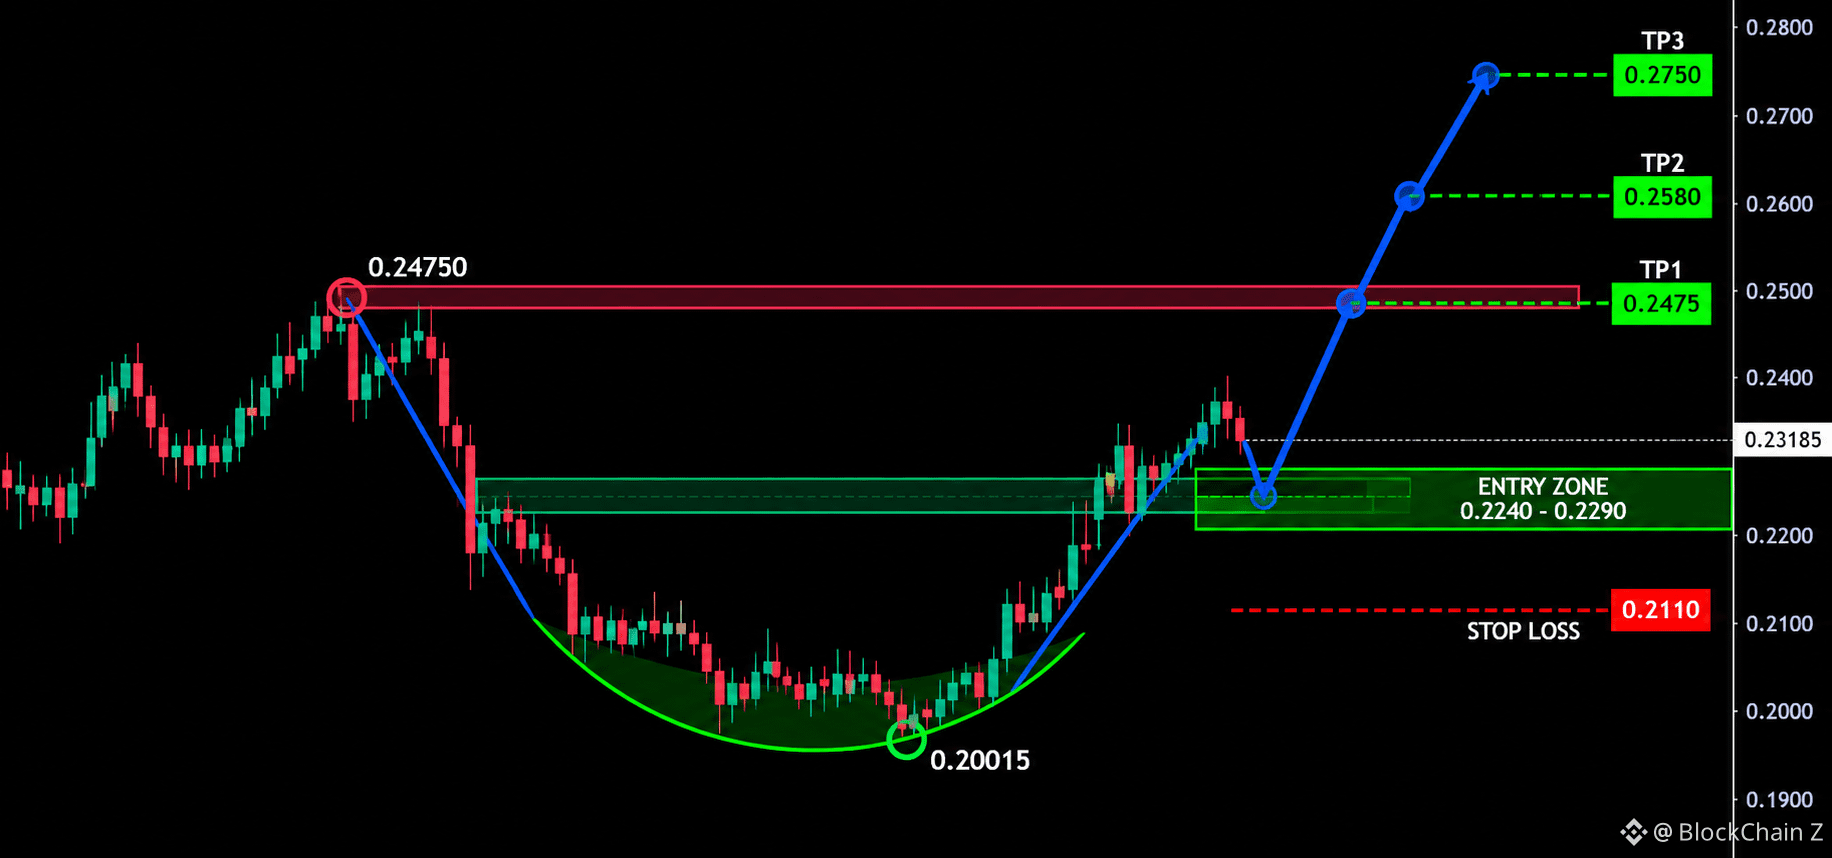
$MAGMA ERHOLUNGSAUSBRUCH LONG
Einstieg: 0.2270 – 0.2320
Stop-Loss: 0.2180
TP1: 0.23533
TP2: 0.24729
TP3: 0.26294
MAGMAUSDT zeigt nach der Bildung einer soliden Basis nahe dem Tief bei 0.20015 eine starke Erholung im 1-Stunden-Chart. Käufer haben den Bereich um 0.21600 deutlich zurückerobert und den Kurs in Richtung 0.23185 getrieben. Während der Erholung bildete sich eine klare Folge höherer Tiefs.
Der unmittelbare Auslöser ist ein deutlicher Ausbruch über 0.23533 mit anschließendem Halten dieses Niveaus. Wenn die Käufer das Momentum aufrechterhalten, könnte sich die Bewegung bis 0.24729 und möglicherweise 0.26294 fortsetzen. Die Zone zwischen 0.2270 und 0.2320 kann für einen kontrollierten Retest mit anschließender Fortsetzung beobachtet werden. Eine anhaltende Bewegung unter 0.2180 würde das bullische Setup schwächen.
{future}(MAGMAUSDT)
$RLC
{future}(RLCUSDT)
$BR
{future}(BRUSDT)
$MAGMA ERHOLUNGSAUSBRUCH LONG
Einstieg: 0.2270 – 0.2320
Stop-Loss: 0.2180
TP1: 0.23533
TP2: 0.24729
TP3: 0.26294
MAGMAUSDT zeigt nach der Bildung einer soliden Basis nahe dem Tief bei 0.20015 eine starke Erholung im 1-Stunden-Chart. Käufer haben den Bereich um 0.21600 deutlich zurückerobert und den Kurs in Richtung 0.23185 getrieben. Während der Erholung bildete sich eine klare Folge höherer Tiefs.
Der unmittelbare Auslöser ist ein deutlicher Ausbruch über 0.23533 mit anschließendem Halten dieses Niveaus. Wenn die Käufer das Momentum aufrechterhalten, könnte sich die Bewegung bis 0.24729 und möglicherweise 0.26294 fortsetzen. Die Zone zwischen 0.2270 und 0.2320 kann für einen kontrollierten Retest mit anschließender Fortsetzung beobachtet werden. Eine anhaltende Bewegung unter 0.2180 würde das bullische Setup schwächen.
$RLC
$BR
Einstieg: 0.2270 – 0.2320
Stop-Loss: 0.2180
TP1: 0.23533
TP2: 0.24729
TP3: 0.26294
MAGMAUSDT zeigt nach der Bildung einer soliden Basis nahe dem Tief bei 0.20015 eine starke Erholung im 1-Stunden-Chart. Käufer haben den Bereich um 0.21600 deutlich zurückerobert und den Kurs in Richtung 0.23185 getrieben. Während der Erholung bildete sich eine klare Folge höherer Tiefs.
Der unmittelbare Auslöser ist ein deutlicher Ausbruch über 0.23533 mit anschließendem Halten dieses Niveaus. Wenn die Käufer das Momentum aufrechterhalten, könnte sich die Bewegung bis 0.24729 und möglicherweise 0.26294 fortsetzen. Die Zone zwischen 0.2270 und 0.2320 kann für einen kontrollierten Retest mit anschließender Fortsetzung beobachtet werden. Eine anhaltende Bewegung unter 0.2180 würde das bullische Setup schwächen.
$RLC
$BR
1
709
·
--
Bullisch
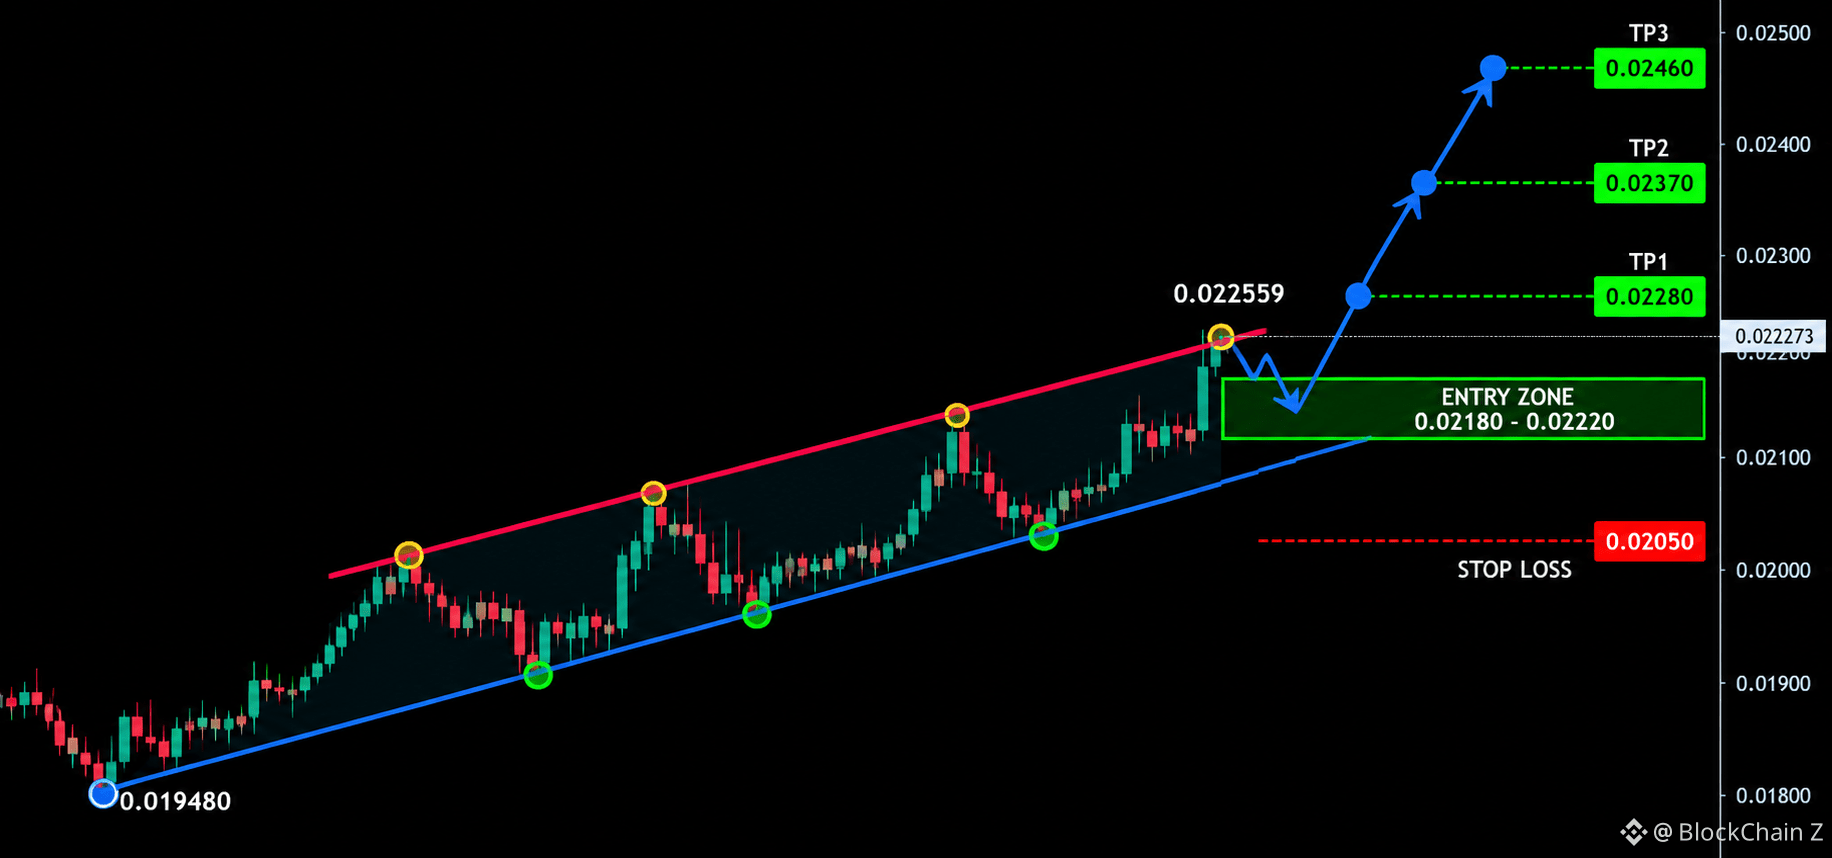
$KOMA FORTSETZUNG NACH BULLISCHEM AUSBRUCH
Einstieg: 0.02180 – 0.02230
Stop-Loss: 0.02120
TP1: 0.02256
TP2: 0.02317
TP3: 0.02461
KOMAUSDT zeigt im 1-Stunden-Chart eine stabile bullische Struktur, nachdem sich nahe dem Tief bei 0.019480 eine Basis gebildet hat. Die Käufer bildeten nach und nach höhere Hochs und höhere Tiefs, bevor der Kurs oberhalb des Bereichs um 0.021738 an Fahrt gewann.
Der Kurs testet nun mit starkem Momentum den Widerstand bei 0.022559. Ein klarer Ausbruch über dieses Niveau mit anschließendem Halten könnte den Weg in Richtung 0.02317 und möglicherweise 0.02461 freimachen. Die Zone zwischen 0.02180 und 0.02230 kann auf einen kontrollierten Retest und eine Fortsetzung beobachtet werden. Ein anhaltender Kursrückgang unter 0.02120 würde das bullische Setup schwächen.
{future}(KOMAUSDT)
$RLC
{future}(RLCUSDT)
$BR
{future}(BRUSDT)
$KOMA FORTSETZUNG NACH BULLISCHEM AUSBRUCH
Einstieg: 0.02180 – 0.02230
Stop-Loss: 0.02120
TP1: 0.02256
TP2: 0.02317
TP3: 0.02461
KOMAUSDT zeigt im 1-Stunden-Chart eine stabile bullische Struktur, nachdem sich nahe dem Tief bei 0.019480 eine Basis gebildet hat. Die Käufer bildeten nach und nach höhere Hochs und höhere Tiefs, bevor der Kurs oberhalb des Bereichs um 0.021738 an Fahrt gewann.
Der Kurs testet nun mit starkem Momentum den Widerstand bei 0.022559. Ein klarer Ausbruch über dieses Niveau mit anschließendem Halten könnte den Weg in Richtung 0.02317 und möglicherweise 0.02461 freimachen. Die Zone zwischen 0.02180 und 0.02230 kann auf einen kontrollierten Retest und eine Fortsetzung beobachtet werden. Ein anhaltender Kursrückgang unter 0.02120 würde das bullische Setup schwächen.
$RLC
$BR
Einstieg: 0.02180 – 0.02230
Stop-Loss: 0.02120
TP1: 0.02256
TP2: 0.02317
TP3: 0.02461
KOMAUSDT zeigt im 1-Stunden-Chart eine stabile bullische Struktur, nachdem sich nahe dem Tief bei 0.019480 eine Basis gebildet hat. Die Käufer bildeten nach und nach höhere Hochs und höhere Tiefs, bevor der Kurs oberhalb des Bereichs um 0.021738 an Fahrt gewann.
Der Kurs testet nun mit starkem Momentum den Widerstand bei 0.022559. Ein klarer Ausbruch über dieses Niveau mit anschließendem Halten könnte den Weg in Richtung 0.02317 und möglicherweise 0.02461 freimachen. Die Zone zwischen 0.02180 und 0.02230 kann auf einen kontrollierten Retest und eine Fortsetzung beobachtet werden. Ein anhaltender Kursrückgang unter 0.02120 würde das bullische Setup schwächen.
$RLC
$BR
1
647
·
--
Bullisch
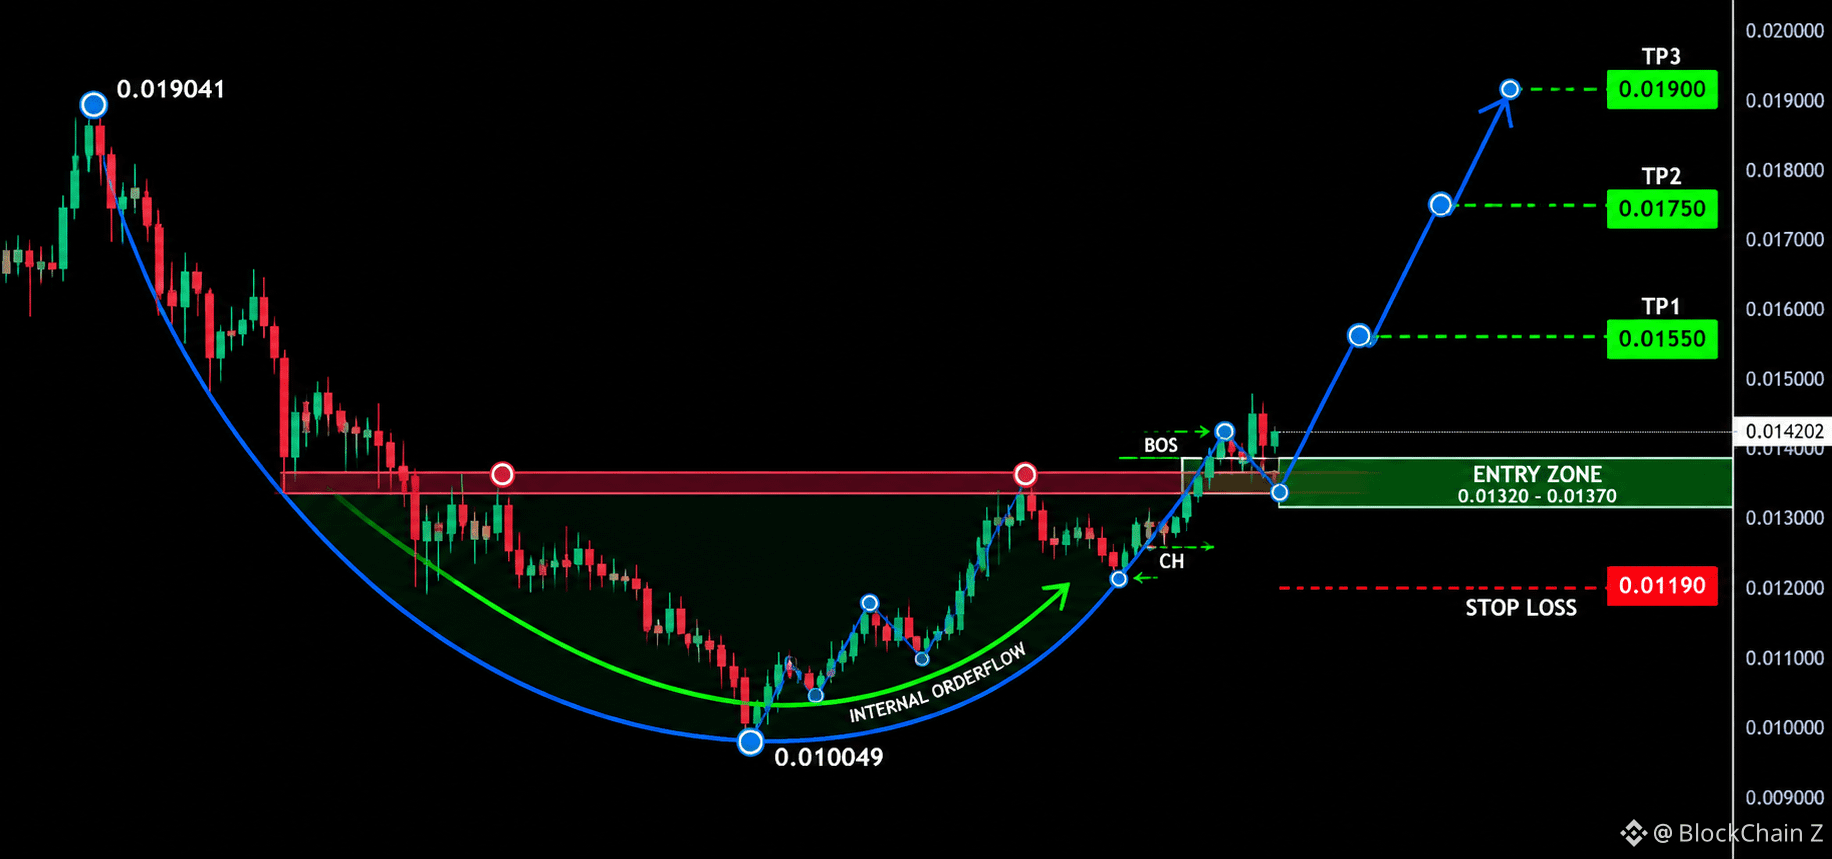
$US LONG MIT UMKEHR-MOMENTUM
Einstieg: 0.01360 – 0.01420
Stop-Loss: 0.01280
TP1: 0.01553
TP2: 0.01751
TP3: 0.01904
USUSDT zeigt im 1H-Chart eine starke Umkehrstruktur nach einem anhaltenden Rückgang vom Hoch bei 0.019041. Der Kurs bildete eine Basis nahe 0.010049 und verzeichnete nun eine kräftige bullische Erholung, wobei er den Bereich um 0.013556 mit starkem Momentum zurückeroberte.
Der entscheidende Auslöser ist ein klarer Halt über 0.01420. Wenn die Käufer dieses Momentum beibehalten, könnte der Kurs bis auf 0.01553 steigen, gefolgt von 0.01751 und möglicherweise 0.01904. Die Spanne von 0.01360–0.01420 kann auf einen kontrollierten Retest und eine Fortsetzung hin beobachtet werden. Ein anhaltender Rückgang unter 0.01280 würde das bullische Setup schwächen.
$RLC
{future}(RLCUSDT)
$BR
{future}(BRUSDT)
$US LONG MIT UMKEHR-MOMENTUM
Einstieg: 0.01360 – 0.01420
Stop-Loss: 0.01280
TP1: 0.01553
TP2: 0.01751
TP3: 0.01904
USUSDT zeigt im 1H-Chart eine starke Umkehrstruktur nach einem anhaltenden Rückgang vom Hoch bei 0.019041. Der Kurs bildete eine Basis nahe 0.010049 und verzeichnete nun eine kräftige bullische Erholung, wobei er den Bereich um 0.013556 mit starkem Momentum zurückeroberte.
Der entscheidende Auslöser ist ein klarer Halt über 0.01420. Wenn die Käufer dieses Momentum beibehalten, könnte der Kurs bis auf 0.01553 steigen, gefolgt von 0.01751 und möglicherweise 0.01904. Die Spanne von 0.01360–0.01420 kann auf einen kontrollierten Retest und eine Fortsetzung hin beobachtet werden. Ein anhaltender Rückgang unter 0.01280 würde das bullische Setup schwächen.
$RLC
$BR
Einstieg: 0.01360 – 0.01420
Stop-Loss: 0.01280
TP1: 0.01553
TP2: 0.01751
TP3: 0.01904
USUSDT zeigt im 1H-Chart eine starke Umkehrstruktur nach einem anhaltenden Rückgang vom Hoch bei 0.019041. Der Kurs bildete eine Basis nahe 0.010049 und verzeichnete nun eine kräftige bullische Erholung, wobei er den Bereich um 0.013556 mit starkem Momentum zurückeroberte.
Der entscheidende Auslöser ist ein klarer Halt über 0.01420. Wenn die Käufer dieses Momentum beibehalten, könnte der Kurs bis auf 0.01553 steigen, gefolgt von 0.01751 und möglicherweise 0.01904. Die Spanne von 0.01360–0.01420 kann auf einen kontrollierten Retest und eine Fortsetzung hin beobachtet werden. Ein anhaltender Rückgang unter 0.01280 würde das bullische Setup schwächen.
$RLC
$BR
915
Anmelden und weiter Inhalte entdecken
Krypto-Nutzer weltweit auf Binance Square kennenlernen
⚡️ Bleib in Sachen Krypto stets am Puls.
💬 Die weltgrößte Kryptobörse vertraut darauf.
👍 Erhalte verlässliche Einblicke von verifizierten Creators.
E-Mail-Adresse/Telefonnummer
Trendthemen
BinanceLaunchesBinanceIntelligence
689,259 Aufrufe
4,315 Kommentare
🧠 Traden wie ein erfahrener Investmentfonds? Jetzt übernimmt die KI das kostenlos für dich! 🤖📈
Wilsontrader97
·10 Likes
·12k Aufrufe
BTCFallsBelow$84K
20,345 Aufrufe
81 Kommentare
DubaiVARAIssuesReserveAssetAuditCircular
2,444 Aufrufe
218 Kommentare