

Odunerd
54 Beiträge

Odunerd
Melden
Nutzer blockieren
BP-24948D0AD5FF
94 Following
432 Follower
1.3K+ Like gegeben
Beiträge
Alle
Zitierungen
PINNED
·
--
Bullisch
Oftmals vernachlässigen wir unsere Überzeugungen und wenn es so weit kommt, schreit man 😬 ups.
Abgesehen von TA und FA
Es gibt etwas, das Sentimentanalyse genannt wird
Was denken Sie über eine bestimmte Erzählung im Kryptoraum und welche Auswirkungen haben Ihre Gefühle auf Sie – GUT oder SCHLECHT?
Ich meine, entweder bullisch oder bärisch, es kommt auf Ihren Geisteszustand an und nicht nur darauf, was der Chart oder das MM da draußen darstellt.
Konzentriert bleiben🤳
Tokens Ich treibe meine Überzeugungen in Richtung rn
#memes
#L2s
#AI
#exchtokens
Oftmals vernachlässigen wir unsere Überzeugungen und wenn es so weit kommt, schreit man 😬 ups.
Abgesehen von TA und FA
Es gibt etwas, das Sentimentanalyse genannt wird
Was denken Sie über eine bestimmte Erzählung im Kryptoraum und welche Auswirkungen haben Ihre Gefühle auf Sie – GUT oder SCHLECHT?
Ich meine, entweder bullisch oder bärisch, es kommt auf Ihren Geisteszustand an und nicht nur darauf, was der Chart oder das MM da draußen darstellt.
Konzentriert bleiben🤳
Tokens Ich treibe meine Überzeugungen in Richtung rn
#memes
#L2s
#AI
#exchtokens
Abgesehen von TA und FA
Es gibt etwas, das Sentimentanalyse genannt wird
Was denken Sie über eine bestimmte Erzählung im Kryptoraum und welche Auswirkungen haben Ihre Gefühle auf Sie – GUT oder SCHLECHT?
Ich meine, entweder bullisch oder bärisch, es kommt auf Ihren Geisteszustand an und nicht nur darauf, was der Chart oder das MM da draußen darstellt.
Konzentriert bleiben🤳
Tokens Ich treibe meine Überzeugungen in Richtung rn
#memes
#L2s
#AI
#exchtokens

3
8
2.5k
·
--
Ein Token, der gerade so dabei ist, wieder auf die Beine zu kommen – das sieht für die Ripple-Familie im Moment nicht gut aus, rn..
#BitgetHackerMoves$83MStolenXRP
Ein Token, der gerade so dabei ist, wieder auf die Beine zu kommen – das sieht für die Ripple-Familie im Moment nicht gut aus, rn..
#BitgetHackerMoves$83MStolenXRP
#BitgetHackerMoves$83MStolenXRP
351
·
--
Artikel
Übersetzung ansehen
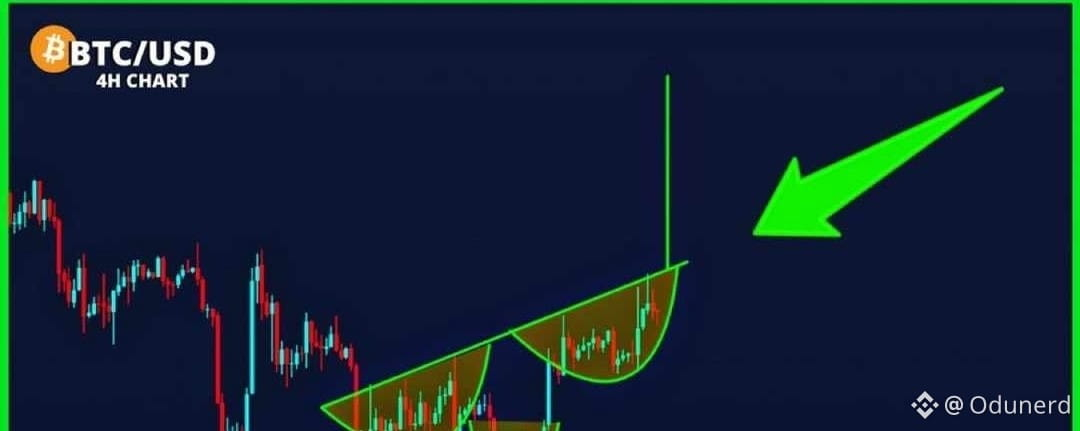
BITCOIN INCONSISTENCIES ANALYTICAL PROVEN..Was June 30, 2026 the Bitcoin Cycle Bottom?
One question has been sitting at the center of my Bitcoin analysis:
Did Bitcoin actually find its cycle bottom on June 30, 2026?
Rather than relying on the chart alone, I approached the question from two sides:
Market structure + on-chain and market data.
1. Starting With Price Action
I deliberately kept the technical analysis simple.
No complicated indicators.
Just price structure.
Bitcoin reached a low of approximately $58.53K on June 30.
Since then, the market has behaved differently from the downtrend that led into that low.
On the daily chart, $BTC moved away from the June low and entered a period of consolidation before beginning to form a sequence of higher highs and higher lows.
The weekly chart adds another important piece of context.
The June low has remained intact, while Bitcoin has recovered substantially from that level.
That is certainly worth paying attention to.
But there is an important distinction:
A strong recovery from a low does not, by itself, prove that the cycle bottom is in.
So I went deeper.
2. Looking Beneath the Chart
To test the June low from a data perspective, I built a framework around several metrics and historical comparisons:
- MVRV
- Bitcoin Realized Price
- ETF flows
- Historical cycle bottoms
- Peak-to-bottom drawdowns
- Post-bottom recovery behaviour
The objective wasn't to find one magic indicator.
Instead, I wanted to see whether multiple independent pieces of evidence were pointing toward the same conclusion.
Key numbers from the analysis
$58.53K — June 30 low
-53.11% — Peak-to-bottom drawdown
1.47 — Current MVRV
$53.19K — Realized Price
+30.52% — Recovery from the June low at the time of the analysis
When these figures are placed alongside historical Bitcoin cycle behaviour, the June 30 low starts to look increasingly significant.
3. What Does the Evidence Actually Tell Us?
The analysis suggests that June 30 is a credible candidate for the cycle bottom.
But there is an important caveat:
A candidate bottom is not the same thing as a confirmed cycle bottom.
Bitcoin has historically experienced significant recoveries that were later followed by another major move lower.
That's why I don't think one should look at the June low in isolation.
The more interesting observation is that both price structure and the underlying data are pointing toward a potential change in market behaviour around that period.
Price is showing a different structure.
The on-chain and market data provide additional evidence worth investigating.
But the higher-timeframe cycle still needs to prove itself.
4. Why Combine Technical Analysis With Data Analytics?
This is actually the bigger lesson behind the research.
The chart tells us what price is doing.
But data can help us investigate what may be happening underneath the price.
Instead of asking:
«"Does the chart look bullish?"»
The better analytical question becomes:
"Do multiple independent datasets support the same market hypothesis?"
That shift changes the way I approach crypto research.
Rather than relying on a single indicator or prediction, I want to combine:
Price → On-chain data → Historical behaviour → Market flows → Statistical context
Then let the evidence tell the story.
So, was June 30, 2026 the Bitcoin cycle bottom?
It is a credible candidate — but the data does not make it a confirmed fact yet.
For me, that's where the research becomes interesting.
The goal isn't to predict the market with certainty.
It's to identify important market events, collect the relevant data, test the hypothesis, and continue monitoring whether the evidence holds.
PS: I've put together the full research, dashboard, and methodology for anyone interested in going through the analysis from start to finish.
BITCOIN INCONSISTENCIES ANALYTICAL PROVEN..
Was June 30, 2026 the Bitcoin Cycle Bottom?
One question has been sitting at the center of my Bitcoin analysis:
Did Bitcoin actually find its cycle bottom on June 30, 2026?
Rather than relying on the chart alone, I approached the question from two sides:
Market structure + on-chain and market data.
1. Starting With Price Action
I deliberately kept the technical analysis simple.
No complicated indicators.
Just price structure.
Bitcoin reached a low of approximately $58.53K on June 30.
Since then, the market has behaved differently from the downtrend that led into that low.
On the daily chart, $BTC moved away from the June low and entered a period of consolidation before beginning to form a sequence of higher highs and higher lows.
The weekly chart adds another important piece of context.
The June low has remained intact, while Bitcoin has recovered substantially from that level.
That is certainly worth paying attention to.
But there is an important distinction:
A strong recovery from a low does not, by itself, prove that the cycle bottom is in.
So I went deeper.
2. Looking Beneath the Chart
To test the June low from a data perspective, I built a framework around several metrics and historical comparisons:
- MVRV
- Bitcoin Realized Price
- ETF flows
- Historical cycle bottoms
- Peak-to-bottom drawdowns
- Post-bottom recovery behaviour
The objective wasn't to find one magic indicator.
Instead, I wanted to see whether multiple independent pieces of evidence were pointing toward the same conclusion.
Key numbers from the analysis
$58.53K — June 30 low
-53.11% — Peak-to-bottom drawdown
1.47 — Current MVRV
$53.19K — Realized Price
+30.52% — Recovery from the June low at the time of the analysis
When these figures are placed alongside historical Bitcoin cycle behaviour, the June 30 low starts to look increasingly significant.
3. What Does the Evidence Actually Tell Us?
The analysis suggests that June 30 is a credible candidate for the cycle bottom.
But there is an important caveat:
A candidate bottom is not the same thing as a confirmed cycle bottom.
Bitcoin has historically experienced significant recoveries that were later followed by another major move lower.
That's why I don't think one should look at the June low in isolation.
The more interesting observation is that both price structure and the underlying data are pointing toward a potential change in market behaviour around that period.
Price is showing a different structure.
The on-chain and market data provide additional evidence worth investigating.
But the higher-timeframe cycle still needs to prove itself.
4. Why Combine Technical Analysis With Data Analytics?
This is actually the bigger lesson behind the research.
The chart tells us what price is doing.
But data can help us investigate what may be happening underneath the price.
Instead of asking:
«"Does the chart look bullish?"»
The better analytical question becomes:
"Do multiple independent datasets support the same market hypothesis?"
That shift changes the way I approach crypto research.
Rather than relying on a single indicator or prediction, I want to combine:
Price → On-chain data → Historical behaviour → Market flows → Statistical context
Then let the evidence tell the story.
So, was June 30, 2026 the Bitcoin cycle bottom?
It is a credible candidate — but the data does not make it a confirmed fact yet.
For me, that's where the research becomes interesting.
The goal isn't to predict the market with certainty.
It's to identify important market events, collect the relevant data, test the hypothesis, and continue monitoring whether the evidence holds.
PS: I've put together the full research, dashboard, and methodology for anyone interested in going through the analysis from start to finish.
One question has been sitting at the center of my Bitcoin analysis:
Did Bitcoin actually find its cycle bottom on June 30, 2026?
Rather than relying on the chart alone, I approached the question from two sides:
Market structure + on-chain and market data.
1. Starting With Price Action
I deliberately kept the technical analysis simple.
No complicated indicators.
Just price structure.
Bitcoin reached a low of approximately $58.53K on June 30.
Since then, the market has behaved differently from the downtrend that led into that low.
On the daily chart, $BTC moved away from the June low and entered a period of consolidation before beginning to form a sequence of higher highs and higher lows.
The weekly chart adds another important piece of context.
The June low has remained intact, while Bitcoin has recovered substantially from that level.
That is certainly worth paying attention to.
But there is an important distinction:
A strong recovery from a low does not, by itself, prove that the cycle bottom is in.
So I went deeper.
2. Looking Beneath the Chart
To test the June low from a data perspective, I built a framework around several metrics and historical comparisons:
- MVRV
- Bitcoin Realized Price
- ETF flows
- Historical cycle bottoms
- Peak-to-bottom drawdowns
- Post-bottom recovery behaviour
The objective wasn't to find one magic indicator.
Instead, I wanted to see whether multiple independent pieces of evidence were pointing toward the same conclusion.
Key numbers from the analysis
$58.53K — June 30 low
-53.11% — Peak-to-bottom drawdown
1.47 — Current MVRV
$53.19K — Realized Price
+30.52% — Recovery from the June low at the time of the analysis
When these figures are placed alongside historical Bitcoin cycle behaviour, the June 30 low starts to look increasingly significant.
3. What Does the Evidence Actually Tell Us?
The analysis suggests that June 30 is a credible candidate for the cycle bottom.
But there is an important caveat:
A candidate bottom is not the same thing as a confirmed cycle bottom.
Bitcoin has historically experienced significant recoveries that were later followed by another major move lower.
That's why I don't think one should look at the June low in isolation.
The more interesting observation is that both price structure and the underlying data are pointing toward a potential change in market behaviour around that period.
Price is showing a different structure.
The on-chain and market data provide additional evidence worth investigating.
But the higher-timeframe cycle still needs to prove itself.
4. Why Combine Technical Analysis With Data Analytics?
This is actually the bigger lesson behind the research.
The chart tells us what price is doing.
But data can help us investigate what may be happening underneath the price.
Instead of asking:
«"Does the chart look bullish?"»
The better analytical question becomes:
"Do multiple independent datasets support the same market hypothesis?"
That shift changes the way I approach crypto research.
Rather than relying on a single indicator or prediction, I want to combine:
Price → On-chain data → Historical behaviour → Market flows → Statistical context
Then let the evidence tell the story.
So, was June 30, 2026 the Bitcoin cycle bottom?
It is a credible candidate — but the data does not make it a confirmed fact yet.
For me, that's where the research becomes interesting.
The goal isn't to predict the market with certainty.
It's to identify important market events, collect the relevant data, test the hypothesis, and continue monitoring whether the evidence holds.
PS: I've put together the full research, dashboard, and methodology for anyone interested in going through the analysis from start to finish.
1
62
·
--
Bullisch
$ARB
$ZAMA
$SUI
Alternativen wachen noch auf, aber die Erholungsrate einiger Tokens stimmt mit ihrem Momentum immer noch nicht überein.
$ARB
$ZAMA
$SUI
Alternativen wachen noch auf, aber die Erholungsrate einiger Tokens stimmt mit ihrem Momentum immer noch nicht überein.
$ZAMA
$SUI
Alternativen wachen noch auf, aber die Erholungsrate einiger Tokens stimmt mit ihrem Momentum immer noch nicht überein.
1
594
·
--
bringe mir jederzeit den Dunkelmodus zu meinem eigenen Wohl, tatsächlich muss dem Schaden, den der Lichtmodus verursacht hat, mehr Aufmerksamkeit geschenkt werden.
bringe mir jederzeit den Dunkelmodus zu meinem eigenen Wohl, tatsächlich muss dem Schaden, den der Lichtmodus verursacht hat, mehr Aufmerksamkeit geschenkt werden.

Odunerd
·
--
BullischWelchen Bildschirm bevorzugen Sie als Entwickler, der lernt und auch programmiert, während Sie auf dem Bildschirm sind?
▪︎Heller Bildschirm
▪︎Dunkler Bildschirm
Lassen Sie uns reden.
▪︎Heller Bildschirm
▪︎Dunkler Bildschirm
Lassen Sie uns reden.
1
6
·
--
#StockMarketCrash Die Auswirkungen des Krieges werden sich definitiv entfalten, was wir jetzt sehen, ist ein Köder, um die Menschen hereinzulocken.
#StockMarketCrash Die Auswirkungen des Krieges werden sich definitiv entfalten, was wir jetzt sehen, ist ein Köder, um die Menschen hereinzulocken.
1
53
·
--
Bullisch
Bitcoin, der $73K erreicht, ist keine Grundlage, um sich angekommen zu fühlen. Was den Anstieg auf dem Markt jetzt antreibt, ist die Menge an $BTC auf Lager, und der Krieg lenkt die Miner ab, um es so zu sagen.
Bitcoin, der $73K erreicht, ist keine Grundlage, um sich angekommen zu fühlen. Was den Anstieg auf dem Markt jetzt antreibt, ist die Menge an $BTC auf Lager, und der Krieg lenkt die Miner ab, um es so zu sagen.
1
65
·
--
Sie haben jeden in der Position wirklich gelähmt
Sie haben jeden in der Position wirklich gelähmt

Tyler Oliveira
·
--
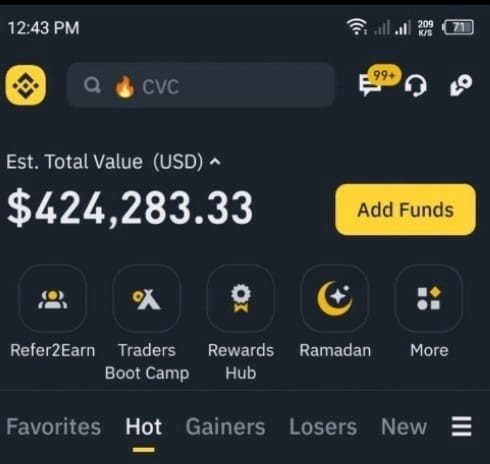
Ich hatte vor wenigen Stunden 1,2 Millionen auf meinem Konto 💔😭
Ich habe fast 800K in $POWER verloren, wie kann ich diese Verluste wiederherstellen??? 😰
Ich kaufe $RIVER 📈✅
Ich habe fast 800K in $POWER verloren, wie kann ich diese Verluste wiederherstellen??? 😰
Ich kaufe $RIVER 📈✅

1
16
·
--
Bullisch
gleich optimistisch für $KAITO hier
gleich optimistisch für $KAITO hier


CoinQuest
·
--
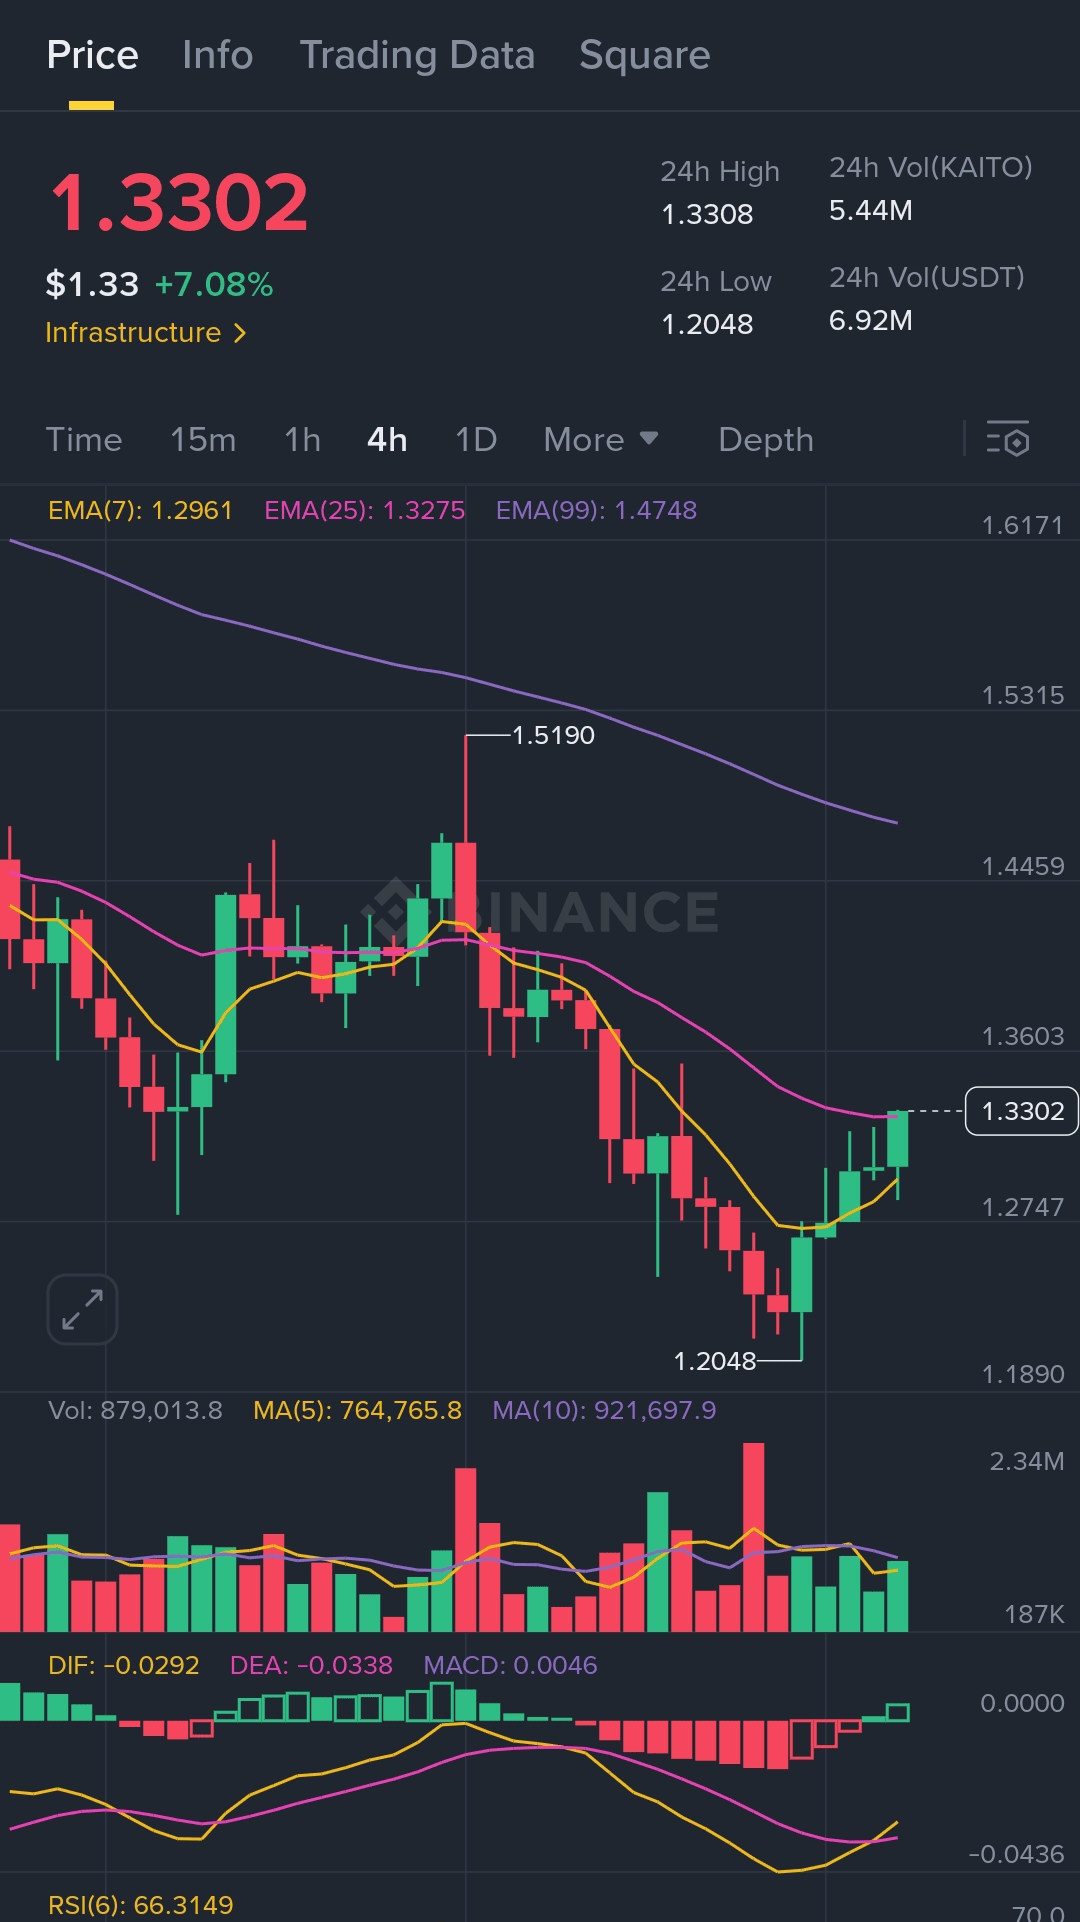
Bullisch$KAITO Ausbruchstruktur in Bewegung ✅
KAITO hat den Widerstand mit Volumenbestätigung durchbrochen und bildet saubere höhere Tiefs, die Bullen gewinnen die volle Kontrolle zurück.
🎯 Einstieg: $1.3300
Ziele: $1.3538 | $1.3850 | $1.4200 (optional zum Skalieren)
🛡️ Stop-Loss: $1.2975
Momentum begünstigt die Fortsetzung. Ausbruchshändler sollten auf Stärke über $1.33 achten, um eine saubere Einrichtung für die Aufwärtsverlängerung zu beobachten.
KAITO hat den Widerstand mit Volumenbestätigung durchbrochen und bildet saubere höhere Tiefs, die Bullen gewinnen die volle Kontrolle zurück.
🎯 Einstieg: $1.3300
Ziele: $1.3538 | $1.3850 | $1.4200 (optional zum Skalieren)
🛡️ Stop-Loss: $1.2975
Momentum begünstigt die Fortsetzung. Ausbruchshändler sollten auf Stärke über $1.33 achten, um eine saubere Einrichtung für die Aufwärtsverlängerung zu beobachten.
182
·
--
Bullisch
➠Nur die Zeit zählt, aber auf lange Sicht bitte priorisiere zuerst deine Sicherheit, alles andere ist nur ein Witz.
📢📢
➠Nur die Zeit zählt, aber auf lange Sicht bitte priorisiere zuerst deine Sicherheit, alles andere ist nur ein Witz.
📢📢
📢📢
16
·
--
Der Moment!
Wie hoch ist noch mal dein Gierlevel?
{spot}(BTCUSDT)
Der Moment!
Wie hoch ist noch mal dein Gierlevel?
Wie hoch ist noch mal dein Gierlevel?
1
18
·
--
Bullisch
Lassen Sie nichts unversucht.
Mein Rat: Hören Sie nicht auf zu klicken.
Lassen Sie nichts unversucht.
Mein Rat: Hören Sie nicht auf zu klicken.
Mein Rat: Hören Sie nicht auf zu klicken.

2
6
6.9k
·
--
Bullisch
Nur eine echte Frage für eine echte Antwort.
Stehen die Alts-Saisons kurz bevor?
Nur eine echte Frage für eine echte Antwort.
Stehen die Alts-Saisons kurz bevor?
Stehen die Alts-Saisons kurz bevor?

11
7
7.1k
·
--
Bullisch
Der wichtigste Schlüssel hier ist, eine starke Überzeugung von allem zu haben, was Sie danach halten, und sich dann Zeit zu nehmen, einige Daten und Statistiken zu überprüfen, um Ihren Standpunkt zu untermauern.
#Dogs hat ein sehr starkes narratives Backend, keine Panik, halten ist möglich, oder handeln Sie mit Vorsicht.
Wenn Sie Pavel Durov, dem CEO von Telegram, zuhören, verstehen Sie, woher die Erzählung von #Dogs kommt, und Sie werden wissen, dass es sich nicht nur um ein gewöhnliches Meme handelt.
Ich bleibe auf X konzentriert.
Wir können uns hier darüber hinaus verbinden.
Liken Sie und teilen Sie Ihre Gedanken.
#bnb 💛
Der wichtigste Schlüssel hier ist, eine starke Überzeugung von allem zu haben, was Sie danach halten, und sich dann Zeit zu nehmen, einige Daten und Statistiken zu überprüfen, um Ihren Standpunkt zu untermauern.
#Dogs hat ein sehr starkes narratives Backend, keine Panik, halten ist möglich, oder handeln Sie mit Vorsicht.
Wenn Sie Pavel Durov, dem CEO von Telegram, zuhören, verstehen Sie, woher die Erzählung von #Dogs kommt, und Sie werden wissen, dass es sich nicht nur um ein gewöhnliches Meme handelt.
Ich bleibe auf X konzentriert.
Wir können uns hier darüber hinaus verbinden.
Liken Sie und teilen Sie Ihre Gedanken.
#bnb 💛
#Dogs hat ein sehr starkes narratives Backend, keine Panik, halten ist möglich, oder handeln Sie mit Vorsicht.
Wenn Sie Pavel Durov, dem CEO von Telegram, zuhören, verstehen Sie, woher die Erzählung von #Dogs kommt, und Sie werden wissen, dass es sich nicht nur um ein gewöhnliches Meme handelt.
Ich bleibe auf X konzentriert.
Wir können uns hier darüber hinaus verbinden.
Liken Sie und teilen Sie Ihre Gedanken.
#bnb 💛
1
706
·
--
Bärisch
Das Open Network (TON) erlebt aufgrund der Verhaftung des CEO von Telegram einen plötzlichen Tiefpunkt.
#PavelDurov
Jetzt ist es an der Zeit, schnell auf die bemerkenswerten Memes auf Ton Blockchain zu reagieren, um diese Gelegenheit als Kaufstimme zu nutzen und zu sichern.
#Fish
#Notcoin
#utyab
#Raff
Tpet
Durev
Tcandy
Tmonk.
Und viele davon können Sie auf geckoterminal.com überprüfen oder diese Dexs verwenden, um gelistete Token zu kaufen.
Ston.fi
DeDust.io
Das Open Network (TON) erlebt aufgrund der Verhaftung des CEO von Telegram einen plötzlichen Tiefpunkt.
#PavelDurov
Jetzt ist es an der Zeit, schnell auf die bemerkenswerten Memes auf Ton Blockchain zu reagieren, um diese Gelegenheit als Kaufstimme zu nutzen und zu sichern.
#Fish
#Notcoin
#utyab
#Raff
Tpet
Durev
Tcandy
Tmonk.
Und viele davon können Sie auf geckoterminal.com überprüfen oder diese Dexs verwenden, um gelistete Token zu kaufen.
Ston.fi
DeDust.io
#PavelDurov
Jetzt ist es an der Zeit, schnell auf die bemerkenswerten Memes auf Ton Blockchain zu reagieren, um diese Gelegenheit als Kaufstimme zu nutzen und zu sichern.
#Fish
#Notcoin
#utyab
#Raff
Tpet
Durev
Tcandy
Tmonk.
Und viele davon können Sie auf geckoterminal.com überprüfen oder diese Dexs verwenden, um gelistete Token zu kaufen.
Ston.fi
DeDust.io

4
720
·
--
Bullisch
Dieser Teil der AUSBILDUNG erwärmt mir immer das Herz, von Binance bis zur Welt.
#BNB 💛
Dieser Teil der AUSBILDUNG erwärmt mir immer das Herz, von Binance bis zur Welt.
#BNB 💛
#BNB 💛


Binance Square Official
·
--
So schreiben Sie einen langen Artikel auf Square
202
·
--
Bullisch
Mein Gedanke für die heutige DEFI-Welt ist auch, dass wir mehr Technologie und Innovationen annehmen sollten, und an Ideen wird es im Krypto-Raum nicht mangeln.
Seien Sie produktiv
Seien Sie vernetzt
Seien Sie aufgeschlossen
Mein Gedanke für die heutige DEFI-Welt ist auch, dass wir mehr Technologie und Innovationen annehmen sollten, und an Ideen wird es im Krypto-Raum nicht mangeln.
Seien Sie produktiv
Seien Sie vernetzt
Seien Sie aufgeschlossen
Seien Sie produktiv
Seien Sie vernetzt
Seien Sie aufgeschlossen
5
269
·
--
#MarketSentimentToday Ich würde sagen, der Markt befindet sich derzeit in einer Doji-Situation und man muss bei Entscheidungen äußerst vorsichtig sein.
#MarketSentimentToday Ich würde sagen, der Markt befindet sich derzeit in einer Doji-Situation und man muss bei Entscheidungen äußerst vorsichtig sein.
5
3k
·
--
Bullisch
Welchen Bildschirm bevorzugen Sie als Entwickler, der lernt und auch programmiert, während Sie auf dem Bildschirm sind?
▪︎Heller Bildschirm
▪︎Dunkler Bildschirm
Lassen Sie uns reden.
Welchen Bildschirm bevorzugen Sie als Entwickler, der lernt und auch programmiert, während Sie auf dem Bildschirm sind?
▪︎Heller Bildschirm
▪︎Dunkler Bildschirm
Lassen Sie uns reden.
▪︎Heller Bildschirm
▪︎Dunkler Bildschirm
Lassen Sie uns reden.
1
2
5.5k
Anmelden und weiter Inhalte entdecken
Krypto-Nutzer weltweit auf Binance Square kennenlernen
⚡️ Bleib in Sachen Krypto stets am Puls.
💬 Die weltgrößte Kryptobörse vertraut darauf.
👍 Erhalte verlässliche Einblicke von verifizierten Creators.
E-Mail-Adresse/Telefonnummer
Trendthemen
UKFCAWinsCourtOrderToRecover851400Pounds
34,704 Aufrufe
789 Kommentare
🚨 KRYPTOREGULIERUNG BETRITT JETZT EINE NEUE PHASE: SIE SCHREIBEN NICHT NUR REGELN — SIE HOLEN GELD ZURÜCK.
Die britische FCA hat eine weitere gerichtlich gestützte Vermögensrückgewinnung gesichert und verstärkt damit einen breiteren Durchsetzungsansatz gegen unbefugte Finanz- und Kryptoaktivitäten.
Und schau dir an, was gleichzeitig passiert:
🇬🇧 FCA → Durchsetzung + Vermögensrückgewinnung
🇺🇸 SEC → klarere Regeln für funktionale Krypto-Assets
🇺🇸 Fed → formale Stablecoin-Aufsicht unter dem GENIUS Act
Diese Kombination ist entscheidend.
Regulierungsbehörden debattieren nicht länger, ob Krypto in das Finanzsystem gehört.
Stattdessen entscheiden sie zunehmend, wer Zugang bekommt, welche Regeln gilt, und was passiert, wenn diese Regeln gebrochen werden.
Der nächste Krypto-Zyklus könnte nicht „Regulierung vs. Innovation“ sein.
Er könnte reguliertes Krypto sein — im Gegensatz zu allen, die den Standard nicht erfüllen können. 👀
$COIN $CRCL $BTC
#ukfcawinscourtordertorecover851400pounds #ChainlinkLaunchesCCIP2WithEnterpriseVerification #GoldFallsTo$4144 #QNTFallsOver40%FromMorningHigh #USDTAdds845900HoldersInPast7Days
KimHotbae
·3 Likes
·4.3k Aufrufe
ChainlinkLaunchesCCIP2WithEnterpriseVerification
47,789 Aufrufe
958 Kommentare
GoldFallsTo$4144
16,437 Aufrufe
165 Kommentare