
Nouha X
96 Beiträge

Nouha X
Melden
Nutzer blockieren
Binance square content creator | 500k Pumpfun Gained.
5.8 Jahre
26 Following
33 Follower
39 Like gegeben
Beiträge
Alle
Videos
·
--
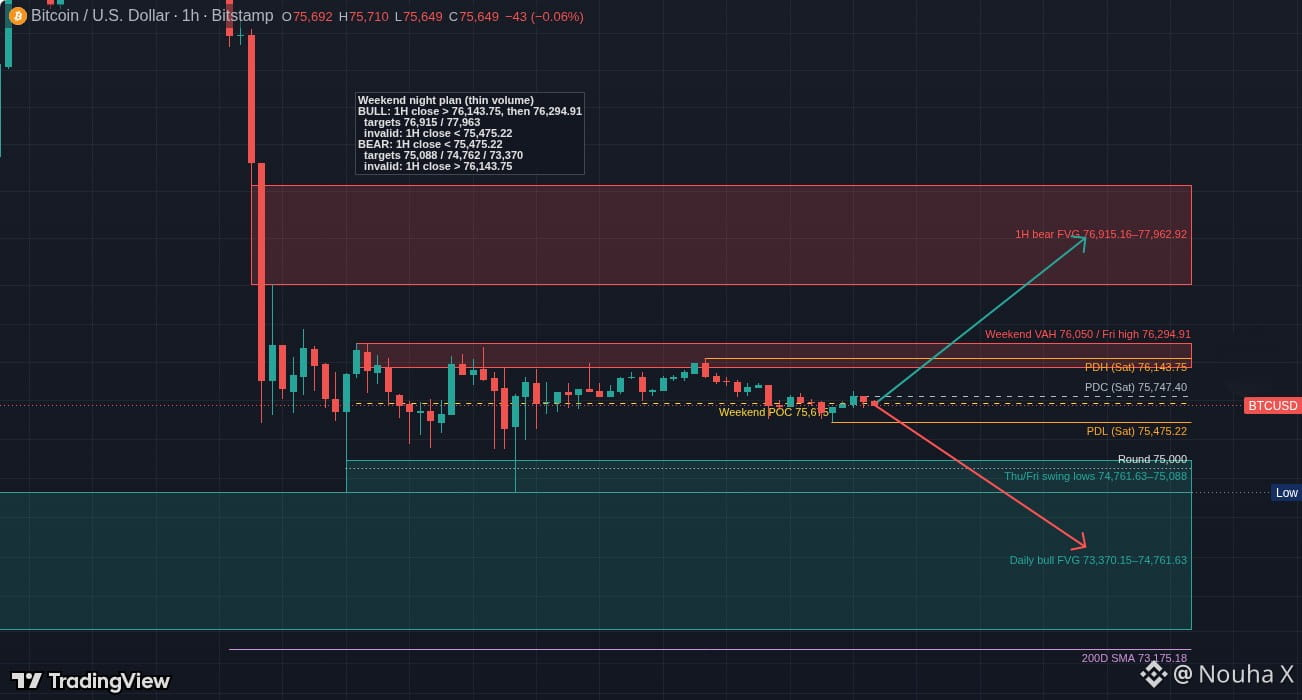
Seitwärtsbewegung am Wochenende um 75.650 in einer engen Spanne zwischen 75.475 und 76.144 bei $BTC
Bei geringem Handelsvolumen ist ein Stundenschlusskurs außerhalb dieser Spanne nötig, um der Richtung zu vertrauen
Die Tagesstruktur liegt unter dem 50-Tage-SMA bei 81.762, aber über dem 200-Tage-SMA bei 73.175
Seitwärtsbewegung am Wochenende um 75.650 in einer engen Spanne zwischen 75.475 und 76.144 bei $BTC
Bei geringem Handelsvolumen ist ein Stundenschlusskurs außerhalb dieser Spanne nötig, um der Richtung zu vertrauen
Die Tagesstruktur liegt unter dem 50-Tage-SMA bei 81.762, aber über dem 200-Tage-SMA bei 73.175
Bei geringem Handelsvolumen ist ein Stundenschlusskurs außerhalb dieser Spanne nötig, um der Richtung zu vertrauen
Die Tagesstruktur liegt unter dem 50-Tage-SMA bei 81.762, aber über dem 200-Tage-SMA bei 73.175
28
·
--
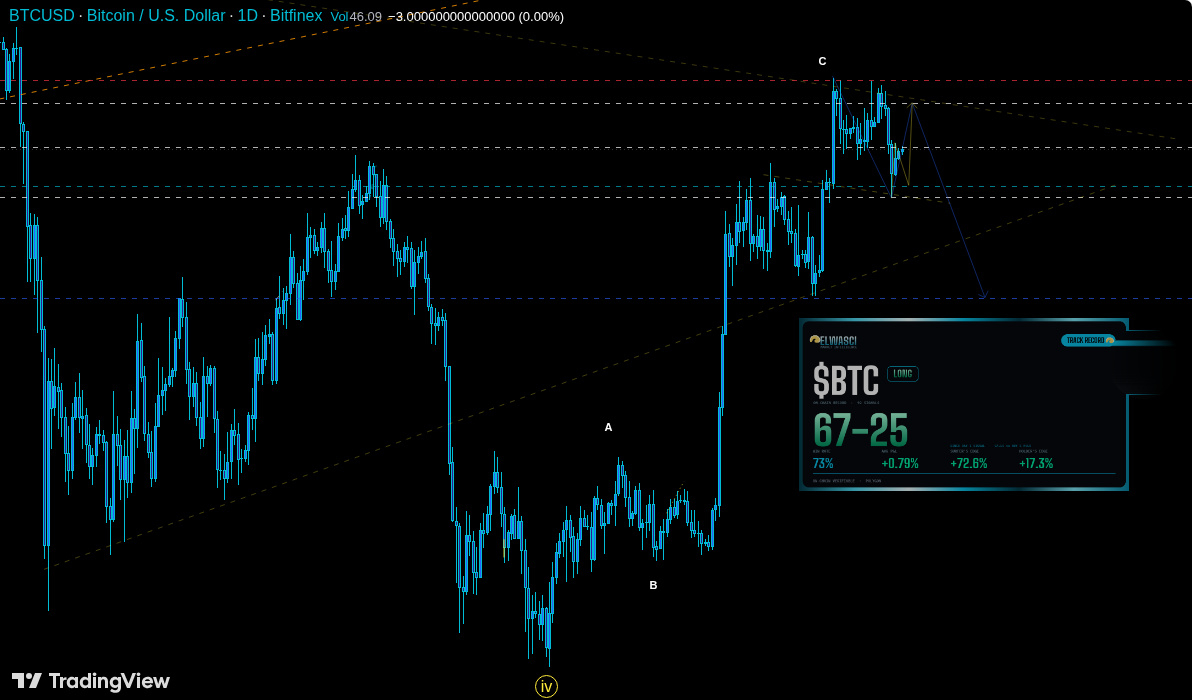
Sieht so aus, als würden die BearFriends denken, dass $BTC irgendwann auf 75K fallen könnte. 🐻
Ein Rückgang in Richtung 81K könnte in den nächsten 72 Stunden bevorstehen, es sei denn, der Kurs durchbricht die rote horizontale Linie bei etwa 87.262 $.
Ich habe eine simulierte Abweichung von +72 % bei der Nachverfolgung über unveränderliche Transaktionen gesehen, verglichen mit den +17 % Gewinnen der aktuellen Inhaber. #BTCshort
Sieht so aus, als würden die BearFriends denken, dass $BTC irgendwann auf 75K fallen könnte. 🐻
Ein Rückgang in Richtung 81K könnte in den nächsten 72 Stunden bevorstehen, es sei denn, der Kurs durchbricht die rote horizontale Linie bei etwa 87.262 $.
Ich habe eine simulierte Abweichung von +72 % bei der Nachverfolgung über unveränderliche Transaktionen gesehen, verglichen mit den +17 % Gewinnen der aktuellen Inhaber. #BTCshort
Ein Rückgang in Richtung 81K könnte in den nächsten 72 Stunden bevorstehen, es sei denn, der Kurs durchbricht die rote horizontale Linie bei etwa 87.262 $.
Ich habe eine simulierte Abweichung von +72 % bei der Nachverfolgung über unveränderliche Transaktionen gesehen, verglichen mit den +17 % Gewinnen der aktuellen Inhaber. #BTCshort
67
·
--
Übersetzung ansehen
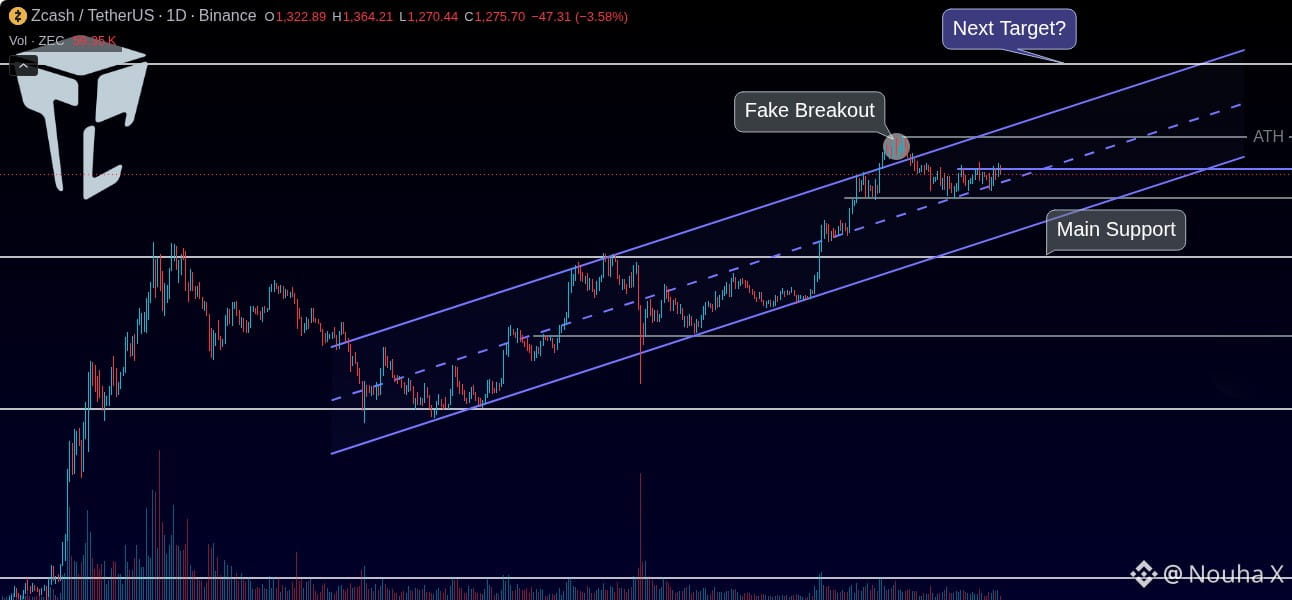
zcash $ZEC had that explosive rally through 2025, topping out near $670 after breaking $55.
it’s in a bullish structure, supported by the $204 range, with a higher low at $363 showing buying pressure. 🚀
#PrivacyCoins
zcash $ZEC had that explosive rally through 2025, topping out near $670 after breaking $55.
it’s in a bullish structure, supported by the $204 range, with a higher low at $363 showing buying pressure. 🚀
#PrivacyCoins
it’s in a bullish structure, supported by the $204 range, with a higher low at $363 showing buying pressure. 🚀
#PrivacyCoins
264
·
--
Übersetzung ansehen
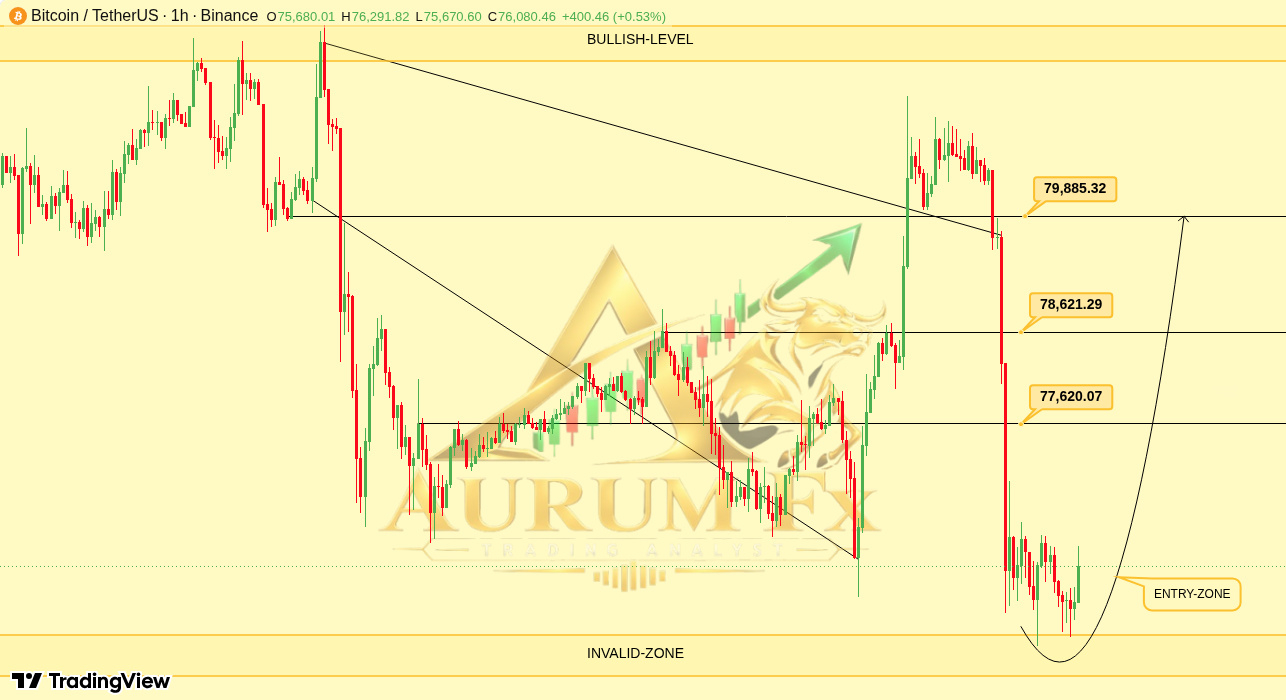
BTC is testing a key demand zone after an intraday selloff on the 1H chart.
If that support holds, we're looking for a gradual recovery.
Target 1 is $77,620, then $78,621, and finally $79,885. 🐂 #BitcoinRecovery
BTC is testing a key demand zone after an intraday selloff on the 1H chart.
If that support holds, we're looking for a gradual recovery.
Target 1 is $77,620, then $78,621, and finally $79,885. 🐂 #BitcoinRecovery
If that support holds, we're looking for a gradual recovery.
Target 1 is $77,620, then $78,621, and finally $79,885. 🐂 #BitcoinRecovery
88
·
--
Übersetzung ansehen
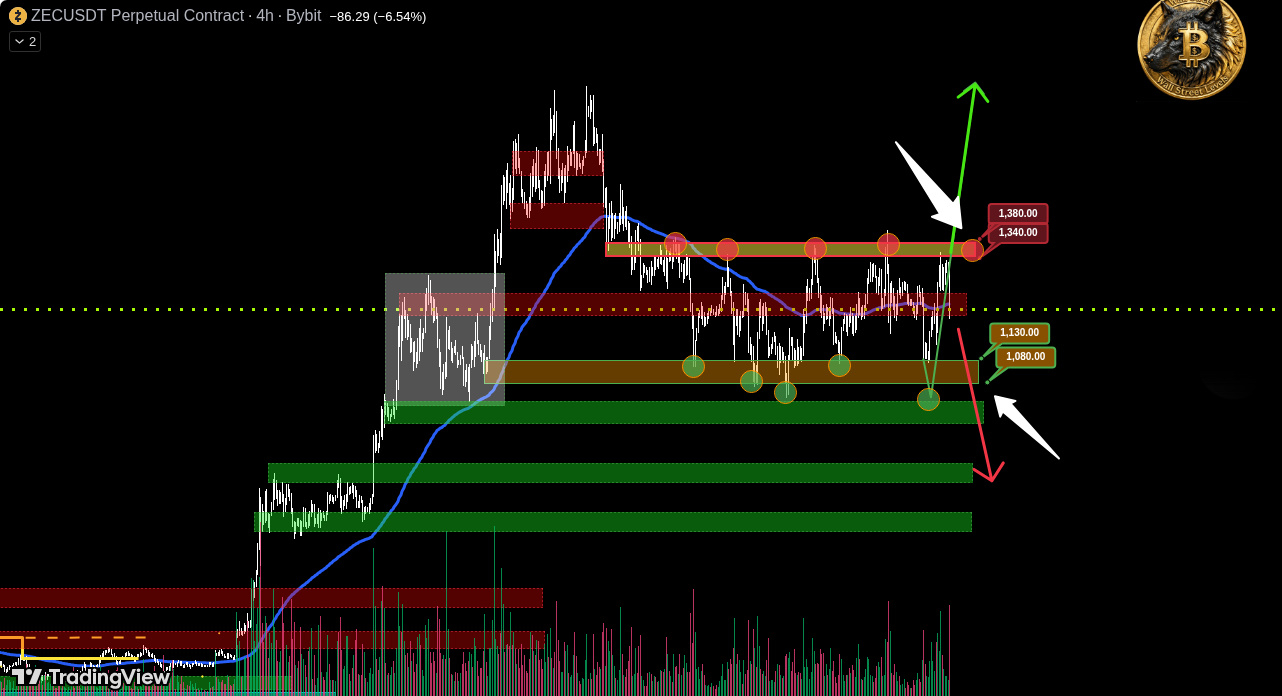
$ZEC tapped the $1340-$1380 zone on BYBIT:ZECUSDT.P but failed to reclaim it, so the price dropped.
IMA showed zero capital inflow during that breakout attempt.
Now we're waiting for a move down to the lower range boundary of $1080-$1130.
A break and hold above $1380 would cancel the short scenario.
$ZEC tapped the $1340-$1380 zone on BYBIT:ZECUSDT.P but failed to reclaim it, so the price dropped.
IMA showed zero capital inflow during that breakout attempt.
Now we're waiting for a move down to the lower range boundary of $1080-$1130.
A break and hold above $1380 would cancel the short scenario.
IMA showed zero capital inflow during that breakout attempt.
Now we're waiting for a move down to the lower range boundary of $1080-$1130.
A break and hold above $1380 would cancel the short scenario.
413
·
--
Übersetzung ansehen
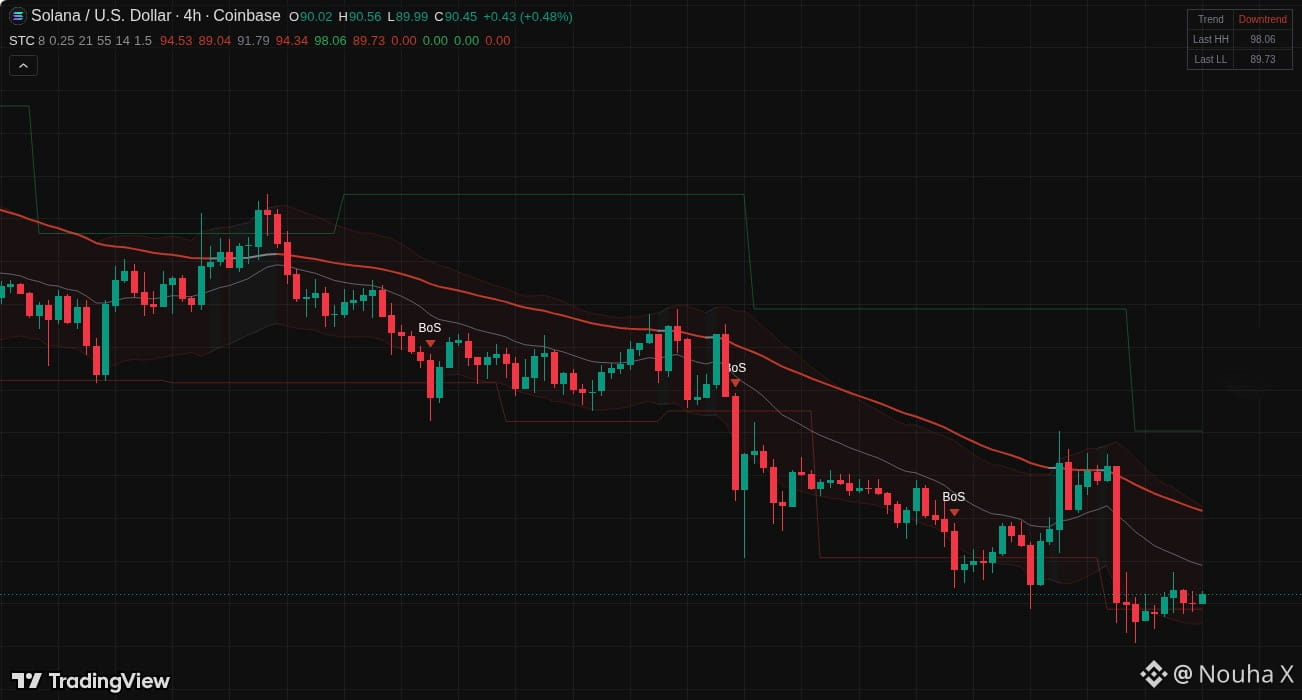
SOL is trading at 90.65 on the 4H, with a down trend bias. 📉
It's pinned in the lower half of the volatility band, below both EMA21 at 91.92 and EMA55 at 94.48.
The last swing low at 89.86 remains open under the current price. $SOL
SOL is trading at 90.65 on the 4H, with a down trend bias. 📉
It's pinned in the lower half of the volatility band, below both EMA21 at 91.92 and EMA55 at 94.48.
The last swing low at 89.86 remains open under the current price. $SOL
It's pinned in the lower half of the volatility band, below both EMA21 at 91.92 and EMA55 at 94.48.
The last swing low at 89.86 remains open under the current price. $SOL
164
·
--
Übersetzung ansehen
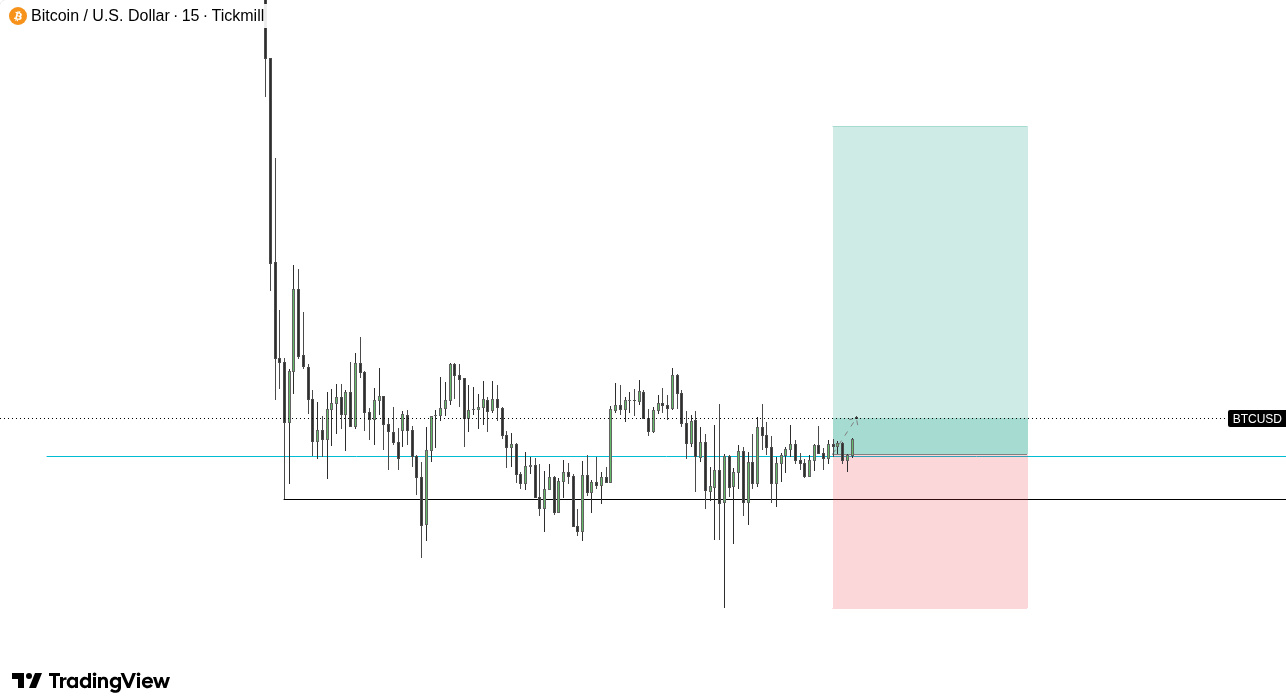
$BTC swept below the 75,450.50 low then reclaimed it on the 15m chart. Now consolidating near 75,700–75,800. A long entry around 75,729 has a stop at 74,763. If $BTC decisively breaks above 76,000, heading toward 77,781.66 could happen. 🤔 #CryptoAnalysis
$BTC swept below the 75,450.50 low then reclaimed it on the 15m chart. Now consolidating near 75,700–75,800. A long entry around 75,729 has a stop at 74,763. If $BTC decisively breaks above 76,000, heading toward 77,781.66 could happen. 🤔 #CryptoAnalysis
63
·
--
Übersetzung ansehen
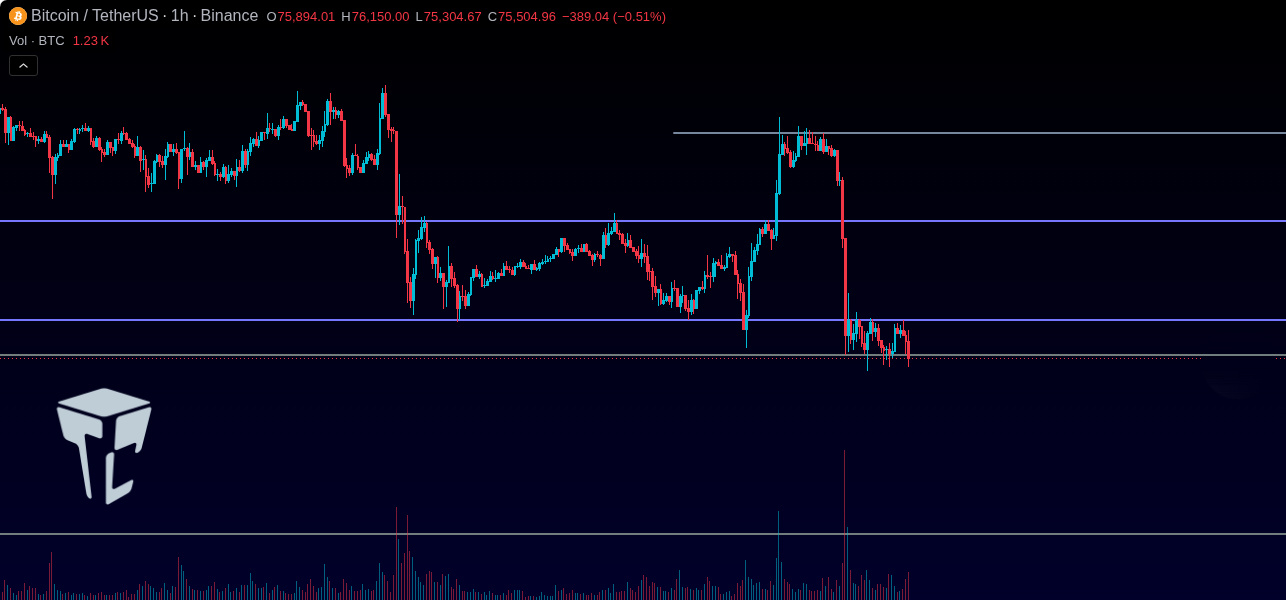
BTC $BTC is in a critical support zone after yesterday's sell-off. ⌛️ On the 1-hour chart, $BTC is consolidating tight between $75,568 and $76,385. A break below $75,568 acts as a bearish trigger. Opportunities exist on a breakout, but risk profiles differ. #CryptoAnalysis 🧐
BTC $BTC is in a critical support zone after yesterday's sell-off. ⌛️ On the 1-hour chart, $BTC is consolidating tight between $75,568 and $76,385. A break below $75,568 acts as a bearish trigger. Opportunities exist on a breakout, but risk profiles differ. #CryptoAnalysis 🧐
47
·
--
Übersetzung ansehen
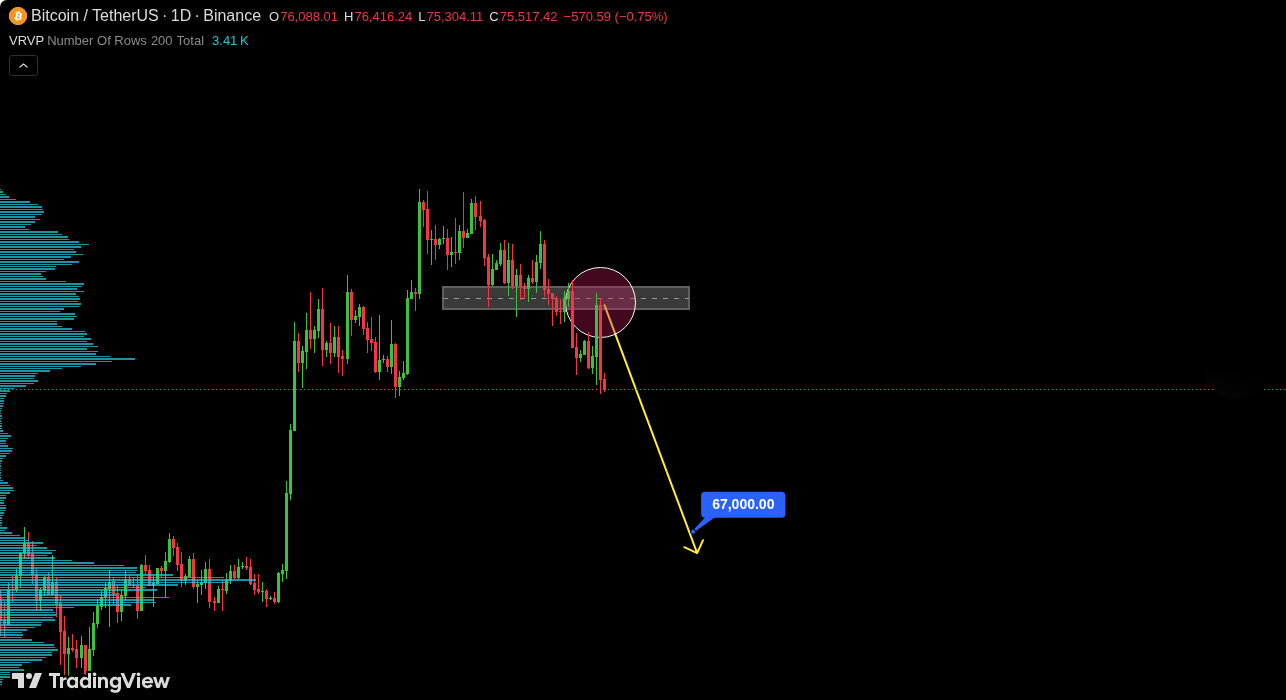
BTCUSDT is struggling on the daily chart. That recent rebound failed to hold at the former support zone, showing sellers are still in control. The lower highs confirm the bearish structure, and Bitcoin $BTC lost its recovery momentum fast. 📉 $BTC
BTCUSDT is struggling on the daily chart. That recent rebound failed to hold at the former support zone, showing sellers are still in control. The lower highs confirm the bearish structure, and Bitcoin $BTC lost its recovery momentum fast. 📉 $BTC
58
·
--
Übersetzung ansehen
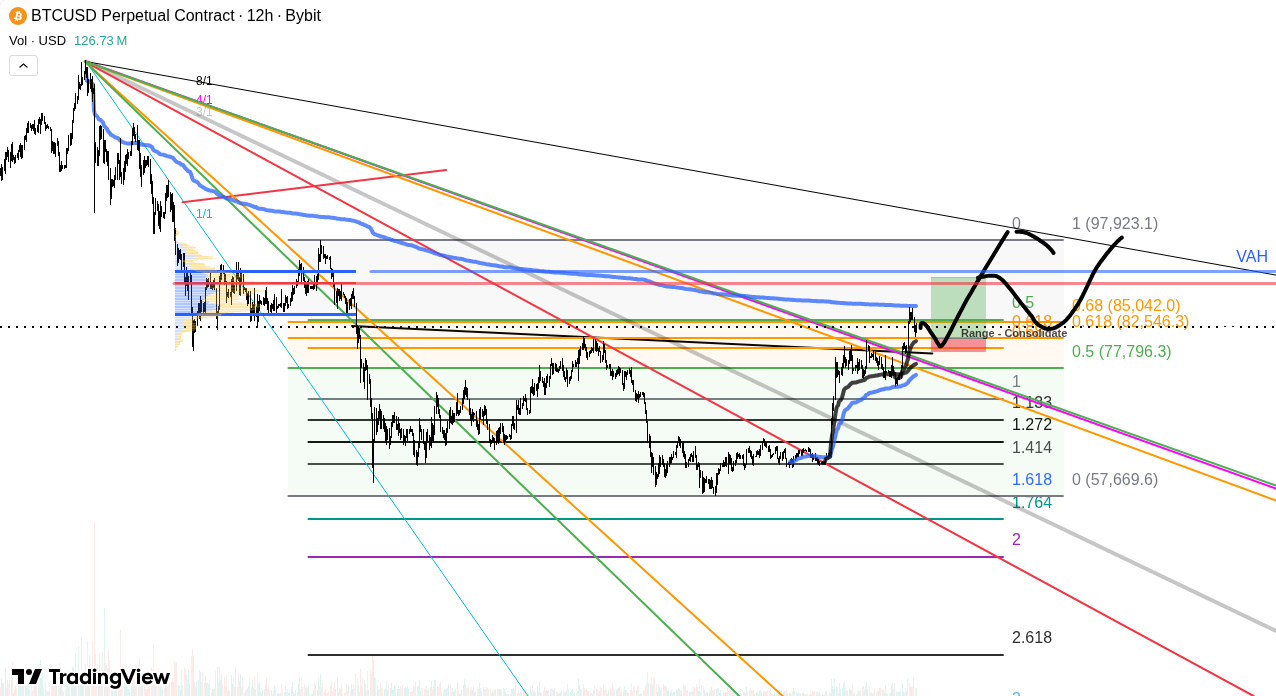
BTC $BTC seems to have strong resistance near the Avwap and POC based on the daily look at 25.09.26 🤔. While a mild ABC zigzag is the current setup, BTC $BTC has ranged under that resistance before, which might propel strength. A correction isn't heavily expected, but it's possible. #CryptoTrading $BTC
BTC $BTC seems to have strong resistance near the Avwap and POC based on the daily look at 25.09.26 🤔. While a mild ABC zigzag is the current setup, BTC $BTC has ranged under that resistance before, which might propel strength. A correction isn't heavily expected, but it's possible. #CryptoTrading $BTC
77
·
--
Übersetzung ansehen
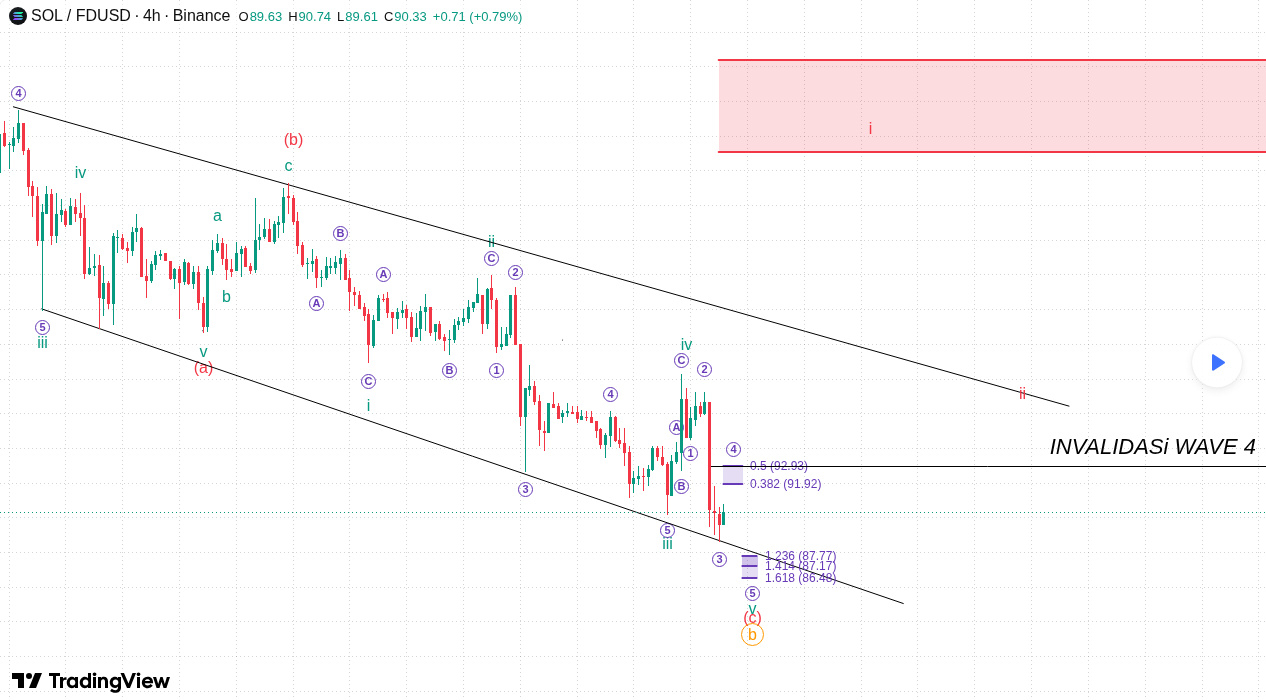
Looking at the SOL $SOL / FDUSD chart, we've got a dual possibility macro update inside that corrective descending channel 🧐. Scenario 1 suggests the Green Wave 5 and the bigger purple ABC correction are done at the lower trendline, which could signal a bullish reversal. But then there's Scenario 2, where $SOL is still navigating purple Wave 4 and one final low is pending. We need to watch that action closely. #CryptoTrading 📈
Looking at the SOL $SOL / FDUSD chart, we've got a dual possibility macro update inside that corrective descending channel 🧐. Scenario 1 suggests the Green Wave 5 and the bigger purple ABC correction are done at the lower trendline, which could signal a bullish reversal. But then there's Scenario 2, where $SOL is still navigating purple Wave 4 and one final low is pending. We need to watch that action closely. #CryptoTrading 📈
96
·
--
Übersetzung ansehen
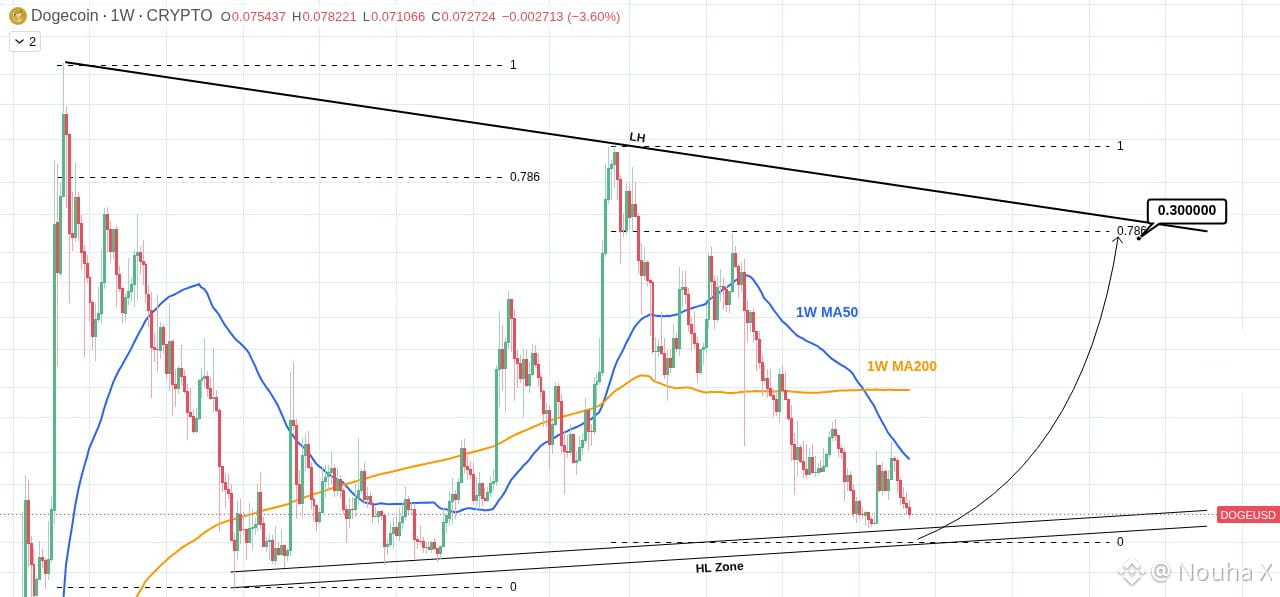
Bitcoin $BTC gave back the whole post-election pop today, selling off with tech, and tonight it dipped under the Nov 3 low before bouncing. It's back near 75,800, and 74,913 is the level I care about most. The rally from 75,618 to 81,105 fully reversed, with $BTC dropping from about 80,300 to 75,463 in roughly four hours this morning. Reports put liquidations at about $1.09 billion, so a lot of this looks like leverage getting flushed. On the Daily chart, we see lower highs at 85,591, 84,843, 81,888 and 81,105, and the price is below the 50-day near 81,990 but above the 200-day near 73,180. For the 1H timeframe, tonight's low was 75,088, and the gaps left above are still open. The bull case depends on $BTC holding 74,913 and closing a 1H candle above 76,915, targeting 77,963, then 79,472; this is invalidated by a 1H close below 74,913. Conversely, the bear case suggests $BTC stays under 76,915 and closes a 1H candle below 74,913, targeting 73,180; this is invalidated by a 1H close above 76,915. #CryptoAnalysis
Bitcoin $BTC gave back the whole post-election pop today, selling off with tech, and tonight it dipped under the Nov 3 low before bouncing. It's back near 75,800, and 74,913 is the level I care about most. The rally from 75,618 to 81,105 fully reversed, with $BTC dropping from about 80,300 to 75,463 in roughly four hours this morning. Reports put liquidations at about $1.09 billion, so a lot of this looks like leverage getting flushed. On the Daily chart, we see lower highs at 85,591, 84,843, 81,888 and 81,105, and the price is below the 50-day near 81,990 but above the 200-day near 73,180. For the 1H timeframe, tonight's low was 75,088, and the gaps left above are still open. The bull case depends on $BTC holding 74,913 and closing a 1H candle above 76,915, targeting 77,963, then 79,472; this is invalidated by a 1H close below 74,913. Conversely, the bear case suggests $BTC stays under 76,915 and closes a 1H candle below 74,913, targeting 73,180; this is invalidated by a 1H close above 76,915. #CryptoAnalysis
1
244
·
--
Übersetzung ansehen
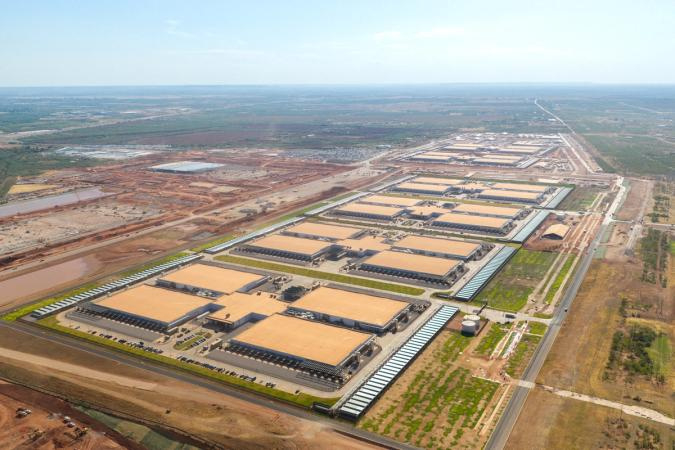
Wall Street is trimming Bitcoin miner price targets after Democrats took Texas. 🏛️ That's the headline, and it's a reminder of how fast policy can flip a whole sector.
The angle here is the data center boom. New blue Texas threatens that boom. Miners and AI hyperscalers are competing for the same power, and a change in the political landscape just made the energy picture less predictable for the industry.
It's not about BTC price. It's about the miners' access to cheap electricity and the demand side they've been counting on. Cut targets mean the market is repricing risk, not necessarily fundamentals.
Keep an eye on how this plays out in the next few quarters. Policy-driven energy constraints move faster than most people expect.
Wall Street is trimming Bitcoin miner price targets after Democrats took Texas. 🏛️ That's the headline, and it's a reminder of how fast policy can flip a whole sector.
The angle here is the data center boom. New blue Texas threatens that boom. Miners and AI hyperscalers are competing for the same power, and a change in the political landscape just made the energy picture less predictable for the industry.
It's not about BTC price. It's about the miners' access to cheap electricity and the demand side they've been counting on. Cut targets mean the market is repricing risk, not necessarily fundamentals.
Keep an eye on how this plays out in the next few quarters. Policy-driven energy constraints move faster than most people expect.
The angle here is the data center boom. New blue Texas threatens that boom. Miners and AI hyperscalers are competing for the same power, and a change in the political landscape just made the energy picture less predictable for the industry.
It's not about BTC price. It's about the miners' access to cheap electricity and the demand side they've been counting on. Cut targets mean the market is repricing risk, not necessarily fundamentals.
Keep an eye on how this plays out in the next few quarters. Policy-driven energy constraints move faster than most people expect.
91
·
--
BREAKING: Der institutionelle Krypto-Custodian Copper erwägt einen massiven Verkauf von 500 Millionen Dollar und hat den Wall-Street-Riesen Cantor Fitzgerald beauftragt, den Deal zu vermitteln! Der traditionelle Finanzsektor kauft aggressiv die Krypto-Infrastruktur. Große Bewegungen stehen bevor!
$BTC #CryptoNews #BinanceSquare $ETH $XRP
BREAKING: Der institutionelle Krypto-Custodian Copper erwägt einen massiven Verkauf von 500 Millionen Dollar und hat den Wall-Street-Riesen Cantor Fitzgerald beauftragt, den Deal zu vermitteln! Der traditionelle Finanzsektor kauft aggressiv die Krypto-Infrastruktur. Große Bewegungen stehen bevor!
$BTC #CryptoNews #BinanceSquare $ETH $XRP
$BTC #CryptoNews #BinanceSquare $ETH $XRP

113
·
--
$ARKM erreicht die ultimative Akkumulationszone!
Nach der jüngsten Korrektur im Sektor ist die KI-Powerhouse Arkham ($ARKM) direkt auf einem historischen Makrotief ($0.11 - $0.12) gelandet. Hier ist der schnelle Spielplan:
Einstiegszone: $0.110 - $0.118 (Whale-Akkumulationsblock)
Ziele: $0.142 👉 $0.185 👉 $0.250
Stop-Loss: Täglicher Schlusskurs unter $0.090
{future}(ARKMUSDT)
$ARKM erreicht die ultimative Akkumulationszone!
Nach der jüngsten Korrektur im Sektor ist die KI-Powerhouse Arkham ($ARKM) direkt auf einem historischen Makrotief ($0.11 - $0.12) gelandet. Hier ist der schnelle Spielplan:
Einstiegszone: $0.110 - $0.118 (Whale-Akkumulationsblock)
Ziele: $0.142 👉 $0.185 👉 $0.250
Stop-Loss: Täglicher Schlusskurs unter $0.090
Nach der jüngsten Korrektur im Sektor ist die KI-Powerhouse Arkham ($ARKM) direkt auf einem historischen Makrotief ($0.11 - $0.12) gelandet. Hier ist der schnelle Spielplan:
Einstiegszone: $0.110 - $0.118 (Whale-Akkumulationsblock)
Ziele: $0.142 👉 $0.185 👉 $0.250
Stop-Loss: Täglicher Schlusskurs unter $0.090

38
·
--
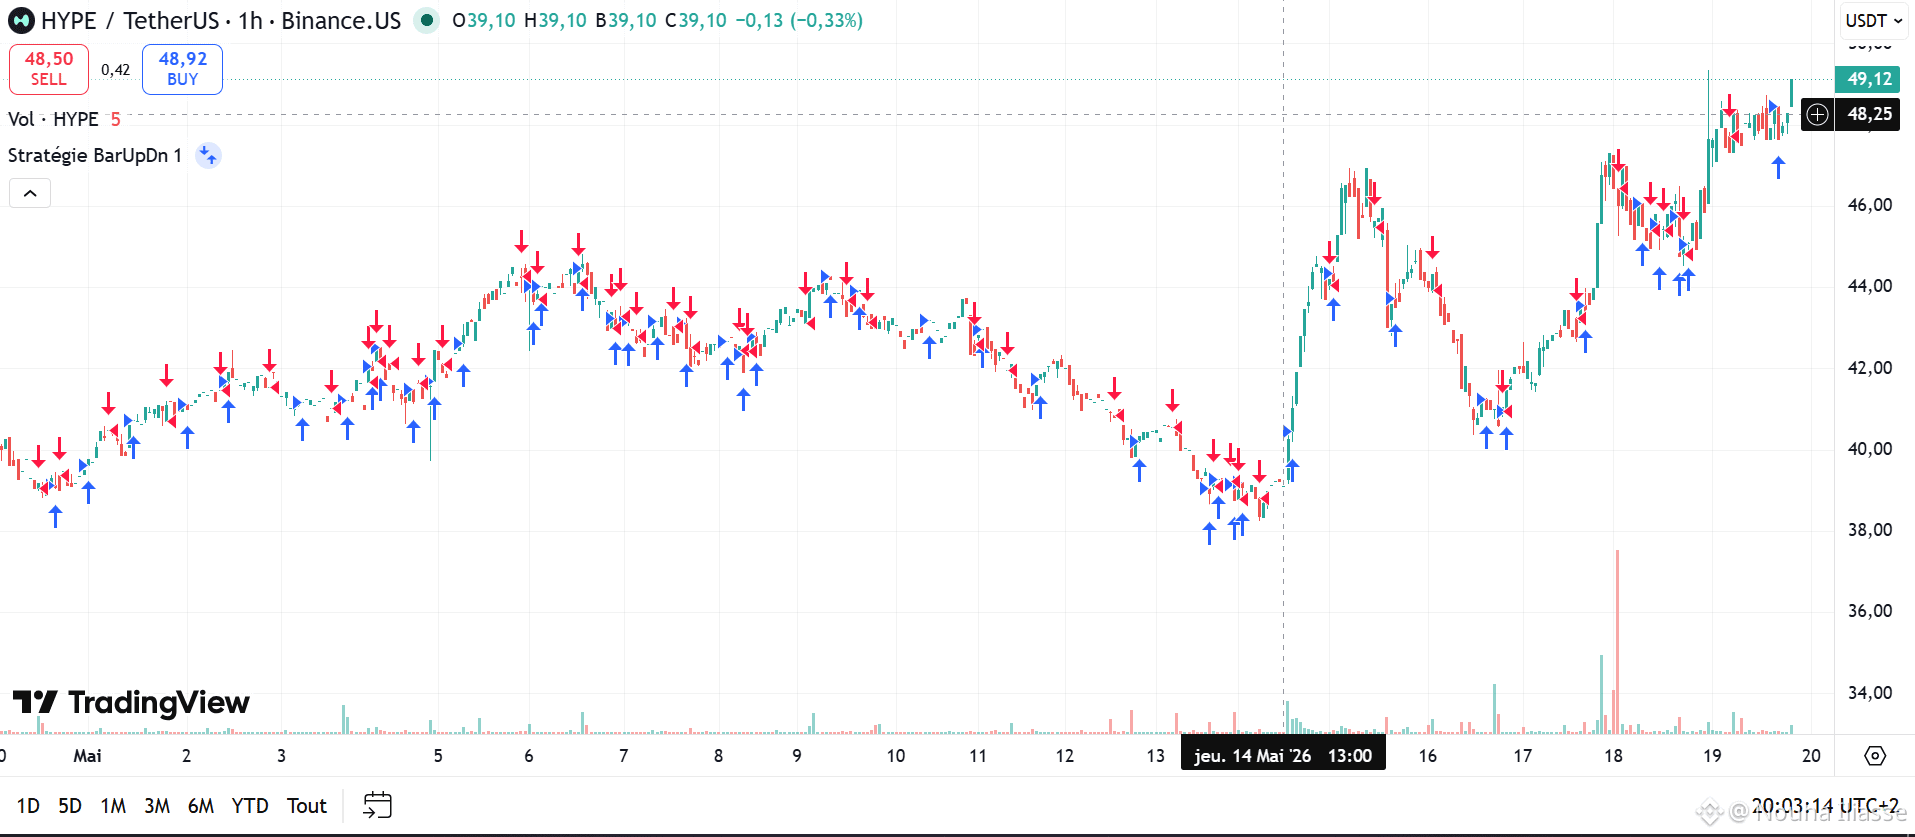
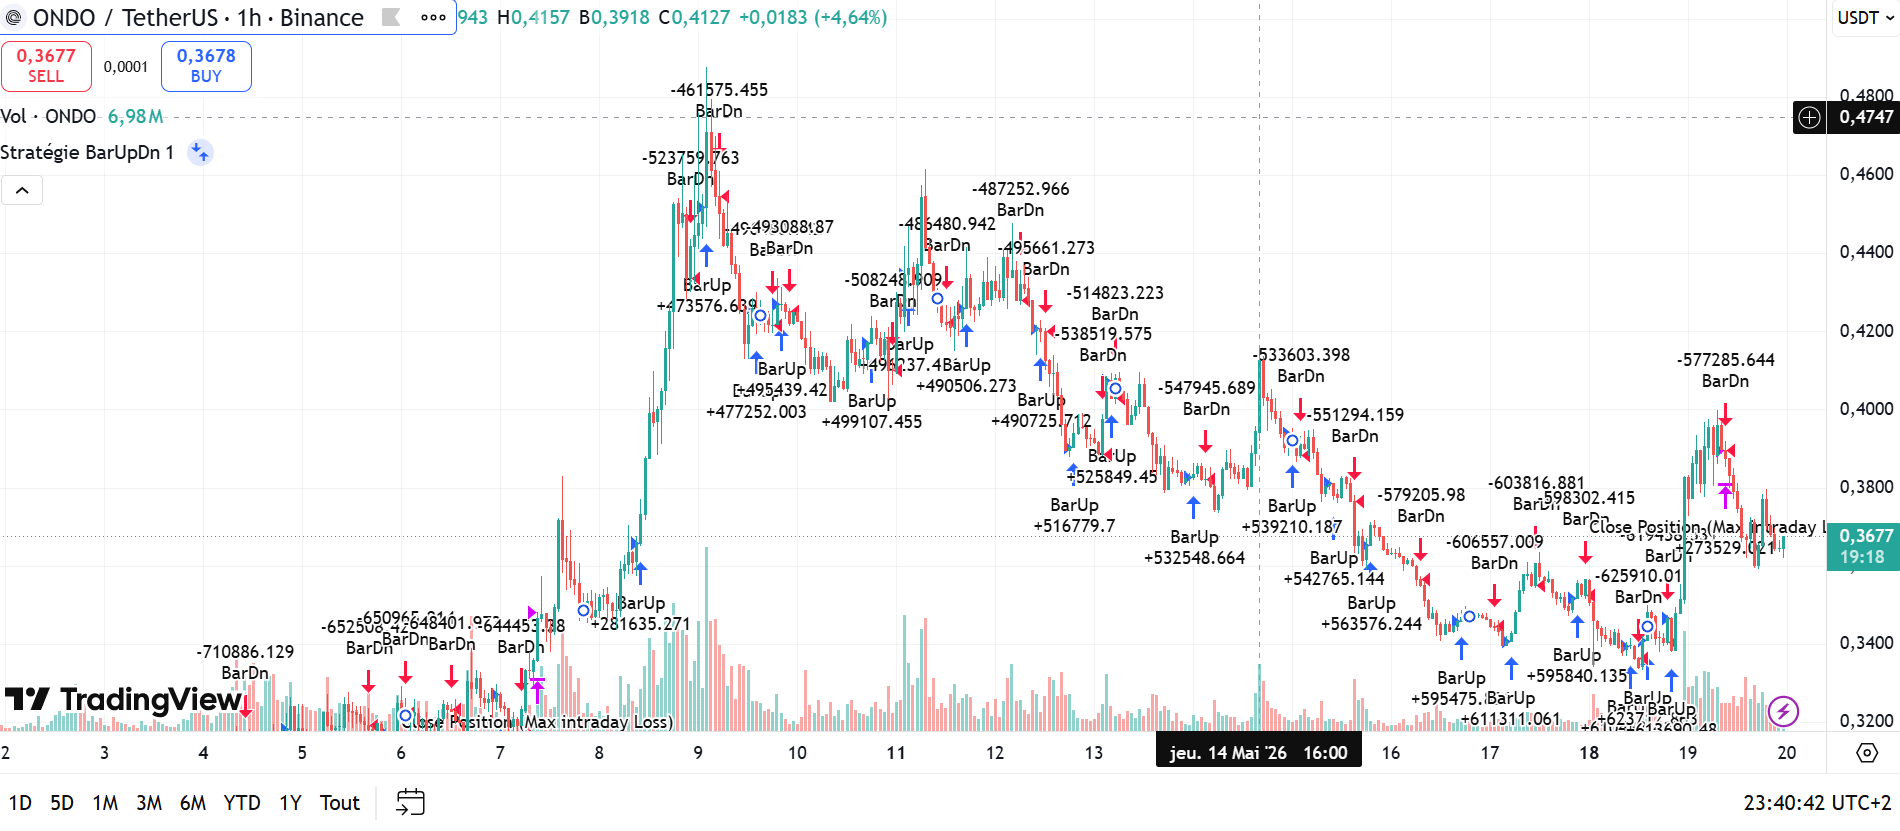
$HYPE vs $ONDO — Wo liegt der Gewinn gerade?
Wenn du Kapital in die stärksten Markt-Narrative in diesem Jahr investieren möchtest, schau dir die beiden ultimativen Führer an: Hyperliquid ($HYPE), das Next-Gen DeFi dominiert, und Ondo Finance ($ONDO), das Real World Assets (RWA) anführt.
Beide Candlesticks zeigen ein massives institutionelles Volumen, aber sie befinden sich derzeit in völlig unterschiedlichen technischen Phasen:
🚀 1. Hyperliquid ($HYPE): Auf den Allzeithochs reiten
Das Setup: $HYPE zeigt pure Stärke. Nach einem massiven Akkumulationsausbruch vom $38-Boden dringt es derzeit in das Preisentdeckungsgebiet rund um $48.25 - $49.12 vor.
Die Strategie: Niemals FOMO kaufen, wenn der Preis ganz oben ist. Warte auf einen gesunden Rücksetzer.
Beste Einstiegszone: $46.00 – $46.50
Ziele: $52.00 | $55.00
Stop Loss: Unter $44.00
2. Ondo Finance ($ONDO): Kauf den generationalen Dip
Das Setup: Im Gegensatz zu $HYPE bietet $ONDO einen massiven Rabatt. Nachdem es nahe $0.48 einen Höhepunkt erreicht hat, hat es sich auf einen rocksoliden Unterstützungsboden korrigiert. Es handelt sich derzeit um einen Preis von rund $0.3657, der eine klare Double Bottom Umkehrstruktur mit starken Kaufindikatoren (blaue Pfeile) zeigt.
Die Strategie: Dies ist eine Lehrbuch-Dip-Kaufgelegenheit mit einem hochprofitablen Risiko-Ertrags-Verhältnis.
Beste Einstiegszone: Aktueller Marktpreis ($0.3550 – $0.3670)
Ziele: $0.4100 | $0.4500 | $0.4850
Stop Loss: 3H Schlusskurs unter $0.3300
⚖️ Das Urteil: Wenn du schnelles Momentum und Scalping-Trading willst, greif zu $HYPE. Wenn du sicher den Boden eines Assets kaufen möchtest, das stark durch das BlackRock-Narrativ unterstützt wird, akkumulieren $ONDO
Kauf jetzt $HYPE
{future}(ONDOUSDT)
{future}(HYPERUSDT)
$HYPE vs $ONDO — Wo liegt der Gewinn gerade?
Wenn du Kapital in die stärksten Markt-Narrative in diesem Jahr investieren möchtest, schau dir die beiden ultimativen Führer an: Hyperliquid ($HYPE), das Next-Gen DeFi dominiert, und Ondo Finance ($ONDO ), das Real World Assets (RWA) anführt.
Beide Candlesticks zeigen ein massives institutionelles Volumen, aber sie befinden sich derzeit in völlig unterschiedlichen technischen Phasen:
🚀 1. Hyperliquid ($HYPE): Auf den Allzeithochs reiten
Das Setup: $HYPE zeigt pure Stärke. Nach einem massiven Akkumulationsausbruch vom $38-Boden dringt es derzeit in das Preisentdeckungsgebiet rund um $48.25 - $49.12 vor.
Die Strategie: Niemals FOMO kaufen, wenn der Preis ganz oben ist. Warte auf einen gesunden Rücksetzer.
Beste Einstiegszone: $46.00 – $46.50
Ziele: $52.00 | $55.00
Stop Loss: Unter $44.00
2. Ondo Finance ($ONDO ): Kauf den generationalen Dip
Das Setup: Im Gegensatz zu $HYPE bietet $ONDO einen massiven Rabatt. Nachdem es nahe $0.48 einen Höhepunkt erreicht hat, hat es sich auf einen rocksoliden Unterstützungsboden korrigiert. Es handelt sich derzeit um einen Preis von rund $0.3657, der eine klare Double Bottom Umkehrstruktur mit starken Kaufindikatoren (blaue Pfeile) zeigt.
Die Strategie: Dies ist eine Lehrbuch-Dip-Kaufgelegenheit mit einem hochprofitablen Risiko-Ertrags-Verhältnis.
Beste Einstiegszone: Aktueller Marktpreis ($0.3550 – $0.3670)
Ziele: $0.4100 | $0.4500 | $0.4850
Stop Loss: 3H Schlusskurs unter $0.3300
⚖️ Das Urteil: Wenn du schnelles Momentum und Scalping-Trading willst, greif zu $HYPE. Wenn du sicher den Boden eines Assets kaufen möchtest, das stark durch das BlackRock-Narrativ unterstützt wird, akkumulieren $ONDO
Kauf jetzt $HYPE
Wenn du Kapital in die stärksten Markt-Narrative in diesem Jahr investieren möchtest, schau dir die beiden ultimativen Führer an: Hyperliquid ($HYPE), das Next-Gen DeFi dominiert, und Ondo Finance ($ONDO ), das Real World Assets (RWA) anführt.
Beide Candlesticks zeigen ein massives institutionelles Volumen, aber sie befinden sich derzeit in völlig unterschiedlichen technischen Phasen:
🚀 1. Hyperliquid ($HYPE): Auf den Allzeithochs reiten
Das Setup: $HYPE zeigt pure Stärke. Nach einem massiven Akkumulationsausbruch vom $38-Boden dringt es derzeit in das Preisentdeckungsgebiet rund um $48.25 - $49.12 vor.
Die Strategie: Niemals FOMO kaufen, wenn der Preis ganz oben ist. Warte auf einen gesunden Rücksetzer.
Beste Einstiegszone: $46.00 – $46.50
Ziele: $52.00 | $55.00
Stop Loss: Unter $44.00
2. Ondo Finance ($ONDO ): Kauf den generationalen Dip
Das Setup: Im Gegensatz zu $HYPE bietet $ONDO einen massiven Rabatt. Nachdem es nahe $0.48 einen Höhepunkt erreicht hat, hat es sich auf einen rocksoliden Unterstützungsboden korrigiert. Es handelt sich derzeit um einen Preis von rund $0.3657, der eine klare Double Bottom Umkehrstruktur mit starken Kaufindikatoren (blaue Pfeile) zeigt.
Die Strategie: Dies ist eine Lehrbuch-Dip-Kaufgelegenheit mit einem hochprofitablen Risiko-Ertrags-Verhältnis.
Beste Einstiegszone: Aktueller Marktpreis ($0.3550 – $0.3670)
Ziele: $0.4100 | $0.4500 | $0.4850
Stop Loss: 3H Schlusskurs unter $0.3300
⚖️ Das Urteil: Wenn du schnelles Momentum und Scalping-Trading willst, greif zu $HYPE. Wenn du sicher den Boden eines Assets kaufen möchtest, das stark durch das BlackRock-Narrativ unterstützt wird, akkumulieren $ONDO
Kauf jetzt $HYPE
202
·
--

Artikel
Übersetzung ansehen
DEEP DIVE: The Uniquely Defensive Bitcoin Market — Why K33 Research Thinks the Bottom is ReadyThe current Bitcoin ($BTC) market structure is testing the patience of even the most seasoned crypto veterans. We are witnessing a slow, grinding, and often frustrating sideways-to-downward price action that has retail traders completely paralyzed by fear.
However, beneath the surface of this quiet market, institutional research firm K33 Research has identified a highly unique structural anomaly. According to their latest market intelligence report, the overwhelming pessimism currently dominating the trading space is actually the ultimate structural shield keeping Bitcoin from a catastrophic, leverage-driven collapse.
Here is a deep-dive analysis of why this "bearish" market sentiment is secretly one of the most bullish structural setups of the year.
Breaking the Ghost of Past Market Crashes
To truly understand why today's market is different, we have to look back at the mechanics of previous historical downturns (like the devastating capitulations of 2018 and 2022).
Historically, crypto market corrections followed a very predictable, dangerous cycle:
The market would suffer an initial drop.A small, temporary relief rally (a "dead cat bounce") would occur.Retail greed would instantly kick back in, with traders aggressively stacking high-leverage long positions using futures and derivatives.This over-leveraged environment created an artificial bubble. The moment the price ticked down slightly, it triggered a chain reaction of forced liquidations (Liquidation Cascades), aggressively flushing the price down into a violent spiral.
Today, that leverage bubble simply does not exist. The market has completely purged the speculative froth. Traders are no longer chasing the bounce with reckless leverage; instead, they are acting with extreme, almost historical defense.
The 80+ Days of Negative Funding Rates
K33 Research points to a staggering derivatives metric that proves just how deeply entrenched this trader pessimism is: Perpetual futures funding rates have remained consistently negative for over 80 consecutive days.
When funding rates remain negative for nearly three months, it reveals two critical structural realities:Massive Hedging/Shorting: The vast majority of active traders are either heavily shorting the market or using derivatives to hedge their spot portfolios out of intense fear.Capital on the Sidelines: A massive portion of market liquidity has entirely left the altcoin and futures sectors, sitting safely in stablecoins waiting for a "worst-case scenario" that may never come.Furthermore, institutional data from the CME (Chicago Mercantile Exchange) shows that the basis premium has drifted below 2.5%. This confirms that the caution isn't just coming from retail traders—Wall Street institutions are aggressively tapping the brakes and playing a defensive game as well.Why This "Fear" Creates a Solid Macro Bottom
In financial markets, when everyone is expecting a catastrophic crash, it rarely happens. Why? Because a market can only crash violently when it is top-heavy with over-leveraged buyers who can be forced to sell.With leverage completely wiped out and traders already positioned for lower prices, the structural downside for Bitcoin is strictly limited. This is why the macro support zone around $60,000 (originally tapped earlier f the year) has held up so fiercely despite endless waves of negative macro news.The market is effectively undergoing a prolonged, healthy, and necessary Consolidation and Accumulation phase. Supply is slowly transferring from panicked, impatient hands over to patient, long-term institutional accumulators.The Setup for a Massive "Short Squeeze"
The most exciting takeaway from the K33 Research report is the sheer mathematical probability of a violent Short Squeeze.When a market is wound up this tightly on the short side—with funding rates negative and bearish sentiment at an extreme—it becomes highly volatile to the upside. The room is overcrowded with short-sellers.The moment a single piece of major, unexpected positive news hits the wire (such as a shift in macroeconomic policy, regulatory clarity, or institutional buying), the price will tick upward. This upward tick will instantly force short-sellers to buy back their positions to cover their losses. This triggers an explosive, rapid domino effect of forced buying, violently launching Bitcoin back into higher structural price targets.💡 Conclusion: While the Crowd Panics, Smart Money Positions Boring, fearful markets are precisely where generational wealth is built. The retail crowd is waiting on the sidelines out of panic, completely missing the fact that the market structure has never been healthier or safer from an actual liquidation collapse. The floor is being cemented right under our feet.🔥 DO NOT GET LEFT BEHIND BEFORE THE SQUEEZE BEGINS 🔥The smart way to play this market isn't guessing when the move happens; it’s building your positions at the absolute bottom while the risk is at its lowest. I am actively tracking institutional order flows and mapping out the exact entry zones for the highest-potential assets right now.
$BTC $ETH $BNB
DEEP DIVE: The Uniquely Defensive Bitcoin Market — Why K33 Research Thinks the Bottom is Ready
The current Bitcoin ($BTC ) market structure is testing the patience of even the most seasoned crypto veterans. We are witnessing a slow, grinding, and often frustrating sideways-to-downward price action that has retail traders completely paralyzed by fear.
However, beneath the surface of this quiet market, institutional research firm K33 Research has identified a highly unique structural anomaly. According to their latest market intelligence report, the overwhelming pessimism currently dominating the trading space is actually the ultimate structural shield keeping Bitcoin from a catastrophic, leverage-driven collapse.
Here is a deep-dive analysis of why this "bearish" market sentiment is secretly one of the most bullish structural setups of the year.
Breaking the Ghost of Past Market Crashes
To truly understand why today's market is different, we have to look back at the mechanics of previous historical downturns (like the devastating capitulations of 2018 and 2022).
Historically, crypto market corrections followed a very predictable, dangerous cycle:
The market would suffer an initial drop.A small, temporary relief rally (a "dead cat bounce") would occur.Retail greed would instantly kick back in, with traders aggressively stacking high-leverage long positions using futures and derivatives.This over-leveraged environment created an artificial bubble. The moment the price ticked down slightly, it triggered a chain reaction of forced liquidations (Liquidation Cascades), aggressively flushing the price down into a violent spiral.
Today, that leverage bubble simply does not exist. The market has completely purged the speculative froth. Traders are no longer chasing the bounce with reckless leverage; instead, they are acting with extreme, almost historical defense.
The 80+ Days of Negative Funding Rates
K33 Research points to a staggering derivatives metric that proves just how deeply entrenched this trader pessimism is: Perpetual futures funding rates have remained consistently negative for over 80 consecutive days.
When funding rates remain negative for nearly three months, it reveals two critical structural realities:Massive Hedging/Shorting: The vast majority of active traders are either heavily shorting the market or using derivatives to hedge their spot portfolios out of intense fear.Capital on the Sidelines: A massive portion of market liquidity has entirely left the altcoin and futures sectors, sitting safely in stablecoins waiting for a "worst-case scenario" that may never come.Furthermore, institutional data from the CME (Chicago Mercantile Exchange) shows that the basis premium has drifted below 2.5%. This confirms that the caution isn't just coming from retail traders—Wall Street institutions are aggressively tapping the brakes and playing a defensive game as well.Why This "Fear" Creates a Solid Macro Bottom
In financial markets, when everyone is expecting a catastrophic crash, it rarely happens. Why? Because a market can only crash violently when it is top-heavy with over-leveraged buyers who can be forced to sell.With leverage completely wiped out and traders already positioned for lower prices, the structural downside for Bitcoin is strictly limited. This is why the macro support zone around $60,000 (originally tapped earlier f the year) has held up so fiercely despite endless waves of negative macro news.The market is effectively undergoing a prolonged, healthy, and necessary Consolidation and Accumulation phase. Supply is slowly transferring from panicked, impatient hands over to patient, long-term institutional accumulators.The Setup for a Massive "Short Squeeze"
The most exciting takeaway from the K33 Research report is the sheer mathematical probability of a violent Short Squeeze.When a market is wound up this tightly on the short side—with funding rates negative and bearish sentiment at an extreme—it becomes highly volatile to the upside. The room is overcrowded with short-sellers.The moment a single piece of major, unexpected positive news hits the wire (such as a shift in macroeconomic policy, regulatory clarity, or institutional buying), the price will tick upward. This upward tick will instantly force short-sellers to buy back their positions to cover their losses. This triggers an explosive, rapid domino effect of forced buying, violently launching Bitcoin back into higher structural price targets.💡 Conclusion: While the Crowd Panics, Smart Money Positions Boring, fearful markets are precisely where generational wealth is built. The retail crowd is waiting on the sidelines out of panic, completely missing the fact that the market structure has never been healthier or safer from an actual liquidation collapse. The floor is being cemented right under our feet.🔥 DO NOT GET LEFT BEHIND BEFORE THE SQUEEZE BEGINS 🔥The smart way to play this market isn't guessing when the move happens; it’s building your positions at the absolute bottom while the risk is at its lowest. I am actively tracking institutional order flows and mapping out the exact entry zones for the highest-potential assets right now.
$BTC $ETH $BNB
However, beneath the surface of this quiet market, institutional research firm K33 Research has identified a highly unique structural anomaly. According to their latest market intelligence report, the overwhelming pessimism currently dominating the trading space is actually the ultimate structural shield keeping Bitcoin from a catastrophic, leverage-driven collapse.
Here is a deep-dive analysis of why this "bearish" market sentiment is secretly one of the most bullish structural setups of the year.
Breaking the Ghost of Past Market Crashes
To truly understand why today's market is different, we have to look back at the mechanics of previous historical downturns (like the devastating capitulations of 2018 and 2022).
Historically, crypto market corrections followed a very predictable, dangerous cycle:
The market would suffer an initial drop.A small, temporary relief rally (a "dead cat bounce") would occur.Retail greed would instantly kick back in, with traders aggressively stacking high-leverage long positions using futures and derivatives.This over-leveraged environment created an artificial bubble. The moment the price ticked down slightly, it triggered a chain reaction of forced liquidations (Liquidation Cascades), aggressively flushing the price down into a violent spiral.
Today, that leverage bubble simply does not exist. The market has completely purged the speculative froth. Traders are no longer chasing the bounce with reckless leverage; instead, they are acting with extreme, almost historical defense.
The 80+ Days of Negative Funding Rates
K33 Research points to a staggering derivatives metric that proves just how deeply entrenched this trader pessimism is: Perpetual futures funding rates have remained consistently negative for over 80 consecutive days.
When funding rates remain negative for nearly three months, it reveals two critical structural realities:Massive Hedging/Shorting: The vast majority of active traders are either heavily shorting the market or using derivatives to hedge their spot portfolios out of intense fear.Capital on the Sidelines: A massive portion of market liquidity has entirely left the altcoin and futures sectors, sitting safely in stablecoins waiting for a "worst-case scenario" that may never come.Furthermore, institutional data from the CME (Chicago Mercantile Exchange) shows that the basis premium has drifted below 2.5%. This confirms that the caution isn't just coming from retail traders—Wall Street institutions are aggressively tapping the brakes and playing a defensive game as well.Why This "Fear" Creates a Solid Macro Bottom
In financial markets, when everyone is expecting a catastrophic crash, it rarely happens. Why? Because a market can only crash violently when it is top-heavy with over-leveraged buyers who can be forced to sell.With leverage completely wiped out and traders already positioned for lower prices, the structural downside for Bitcoin is strictly limited. This is why the macro support zone around $60,000 (originally tapped earlier f the year) has held up so fiercely despite endless waves of negative macro news.The market is effectively undergoing a prolonged, healthy, and necessary Consolidation and Accumulation phase. Supply is slowly transferring from panicked, impatient hands over to patient, long-term institutional accumulators.The Setup for a Massive "Short Squeeze"
The most exciting takeaway from the K33 Research report is the sheer mathematical probability of a violent Short Squeeze.When a market is wound up this tightly on the short side—with funding rates negative and bearish sentiment at an extreme—it becomes highly volatile to the upside. The room is overcrowded with short-sellers.The moment a single piece of major, unexpected positive news hits the wire (such as a shift in macroeconomic policy, regulatory clarity, or institutional buying), the price will tick upward. This upward tick will instantly force short-sellers to buy back their positions to cover their losses. This triggers an explosive, rapid domino effect of forced buying, violently launching Bitcoin back into higher structural price targets.💡 Conclusion: While the Crowd Panics, Smart Money Positions Boring, fearful markets are precisely where generational wealth is built. The retail crowd is waiting on the sidelines out of panic, completely missing the fact that the market structure has never been healthier or safer from an actual liquidation collapse. The floor is being cemented right under our feet.🔥 DO NOT GET LEFT BEHIND BEFORE THE SQUEEZE BEGINS 🔥The smart way to play this market isn't guessing when the move happens; it’s building your positions at the absolute bottom while the risk is at its lowest. I am actively tracking institutional order flows and mapping out the exact entry zones for the highest-potential assets right now.
$BTC $ETH $BNB
84
·
--
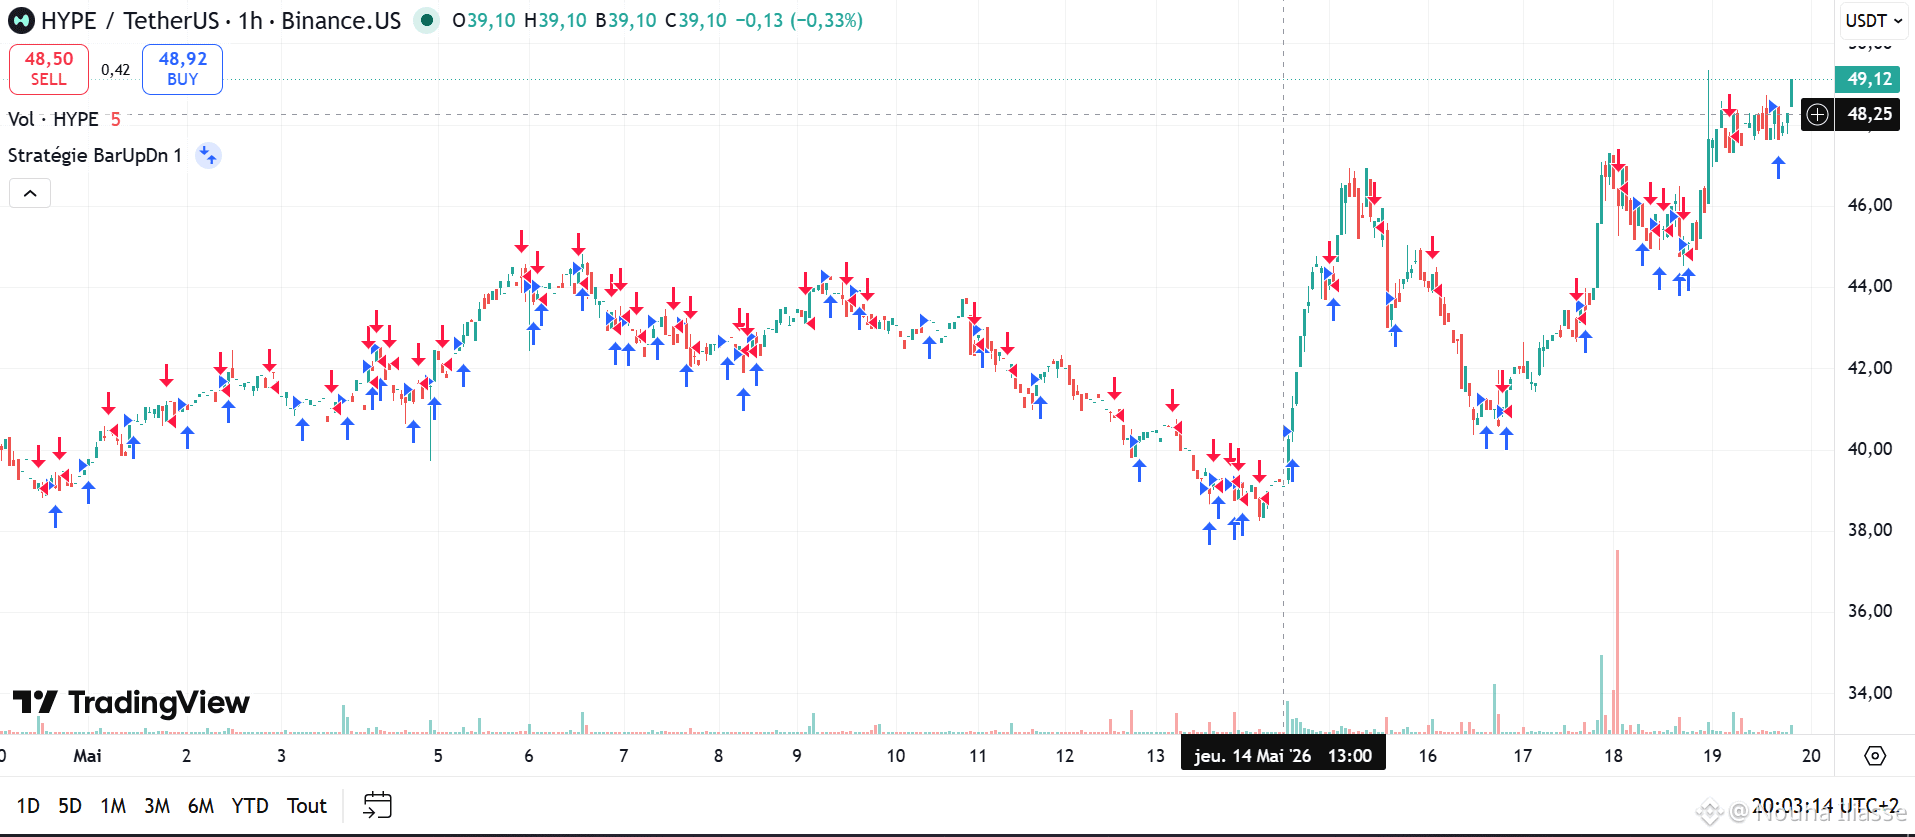
$HYPE Setup ist bereit
👉Einstiegszone (Kauflevels):
Einstieg 1: $47.80 - $48.50
Einstieg 2: $46.20
🤑Take Profit:
Ziel 1: $50.50
Ziel 2: $53.00
Ziel 3: $56.00
👀 Stop Loss:
1-Stunden Kerze schließt unter $44.00 (Ungültigkeitspunkt zum Schutz deines Kapitals).
$XRP $BTC
$HYPE Setup ist bereit
👉Einstiegszone (Kauflevels):
Einstieg 1: $47.80 - $48.50
Einstieg 2: $46.20
🤑Take Profit:
Ziel 1: $50.50
Ziel 2: $53.00
Ziel 3: $56.00
👀 Stop Loss:
1-Stunden Kerze schließt unter $44.00 (Ungültigkeitspunkt zum Schutz deines Kapitals).
$XRP $BTC
👉Einstiegszone (Kauflevels):
Einstieg 1: $47.80 - $48.50
Einstieg 2: $46.20
🤑Take Profit:
Ziel 1: $50.50
Ziel 2: $53.00
Ziel 3: $56.00
👀 Stop Loss:
1-Stunden Kerze schließt unter $44.00 (Ungültigkeitspunkt zum Schutz deines Kapitals).
$XRP $BTC
293
·
--
Übersetzung ansehen
🚨 Wall Street Wants 24/7 Trading! Big Flows Into New Hyperliquid ETF ($HYPE)
Institutional investors are officially tired of the weekend market closures. 21Shares just launched the Hyperliquid ETF ($THYP) on Nasdaq, and early inflows are massive!
Key Takeaways:
24/7 Demand: Huge appetite from Wall Street for non-stop, around-the-clock DeFi trading.
Real-Time Discovery: Hyperliquid is leading global price discovery even when traditional exchanges (like CME) are closed.
Beyond BTC/ETH: Big money is aggressively moving into high-utility Altcoins
$BTC $HYPE
{future}(HYPEUSDT)
🚨 Wall Street Wants 24/7 Trading! Big Flows Into New Hyperliquid ETF ($HYPE )
Institutional investors are officially tired of the weekend market closures. 21Shares just launched the Hyperliquid ETF ($THYP) on Nasdaq, and early inflows are massive!
Key Takeaways:
24/7 Demand: Huge appetite from Wall Street for non-stop, around-the-clock DeFi trading.
Real-Time Discovery: Hyperliquid is leading global price discovery even when traditional exchanges (like CME) are closed.
Beyond BTC/ETH: Big money is aggressively moving into high-utility Altcoins
$BTC $HYPE
Institutional investors are officially tired of the weekend market closures. 21Shares just launched the Hyperliquid ETF ($THYP) on Nasdaq, and early inflows are massive!
Key Takeaways:
24/7 Demand: Huge appetite from Wall Street for non-stop, around-the-clock DeFi trading.
Real-Time Discovery: Hyperliquid is leading global price discovery even when traditional exchanges (like CME) are closed.
Beyond BTC/ETH: Big money is aggressively moving into high-utility Altcoins
$BTC $HYPE
·
--
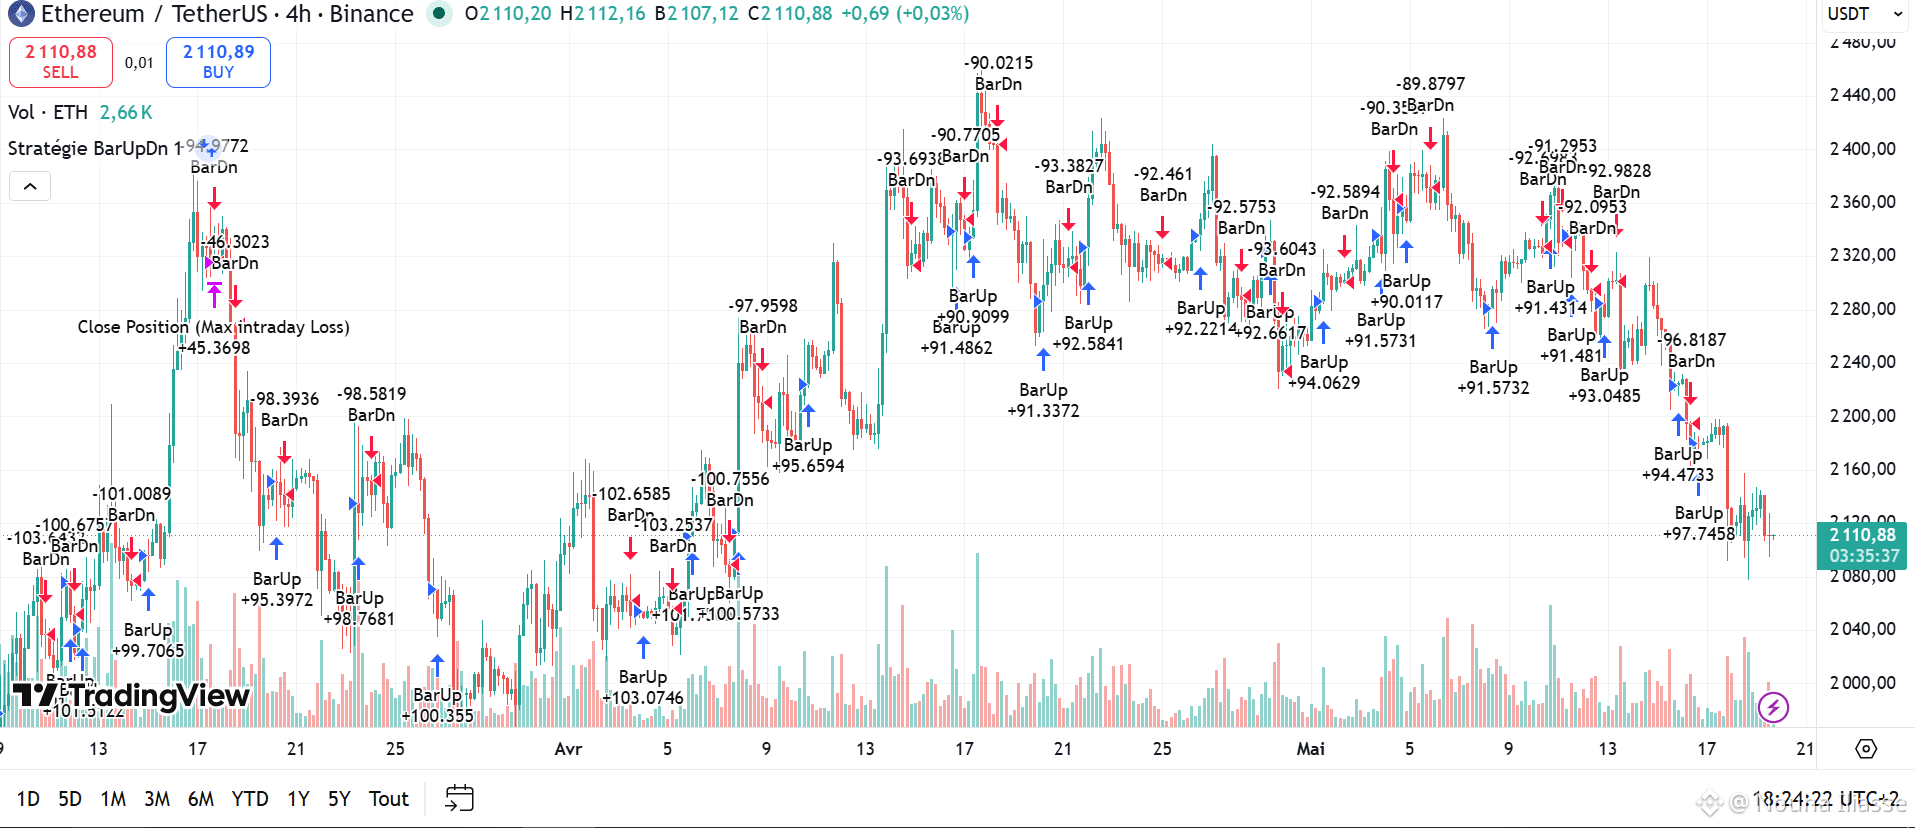
Nach den aktuellen Nachrichten über Ethereum, kann uns jemand sagen, ob das tatsächlich ein bullisches Zeichen und eine gute Kaufgelegenheit ist, oder ob es schlechte Nachrichten sind und ein Signal, dass es Zeit ist auszusteigen? Wann sollten wir aussteigen?
$ETH
{future}(ETHUSDT)
Nach den aktuellen Nachrichten über Ethereum, kann uns jemand sagen, ob das tatsächlich ein bullisches Zeichen und eine gute Kaufgelegenheit ist, oder ob es schlechte Nachrichten sind und ein Signal, dass es Zeit ist auszusteigen? Wann sollten wir aussteigen?
$ETH
$ETH
1
2
203
Anmelden und weiter Inhalte entdecken
Krypto-Nutzer weltweit auf Binance Square kennenlernen
⚡️ Bleib in Sachen Krypto stets am Puls.
💬 Die weltgrößte Kryptobörse vertraut darauf.
👍 Erhalte verlässliche Einblicke von verifizierten Creators.
E-Mail-Adresse/Telefonnummer
Trendthemen
JobsReportRaisesHikeOdds
534,961 Aufrufe
3,427 Kommentare
TradFi-News | USA schaffen im Oktober 165.000 Stellen – mehr als doppelt so viele wie die prognostizierten 65.000 –, während die Arbeitslosenquote auf 4,1 % sinkt
Binance News
·42 Likes
·24.2k Aufrufe
CPITestsDecemberRateOutlook
162,649 Aufrufe
1,189 Kommentare
US Data Center Rules May Constrain AI Expansion
74,766 Aufrufe
229 Kommentare