

Mr_Oreo
22 Beiträge

Mr_Oreo
Melden
Nutzer blockieren
It's not how much profit you make in the market, but how strong you hold on in it.
Trade eröffnen
Hochfrequenz-Trader
3.8 Jahre
21 Following
4 Follower
27 Like gegeben
Beiträge
Portfolio
Alle
Zitierungen
·
--
Bullisch
Übersetzung ansehen
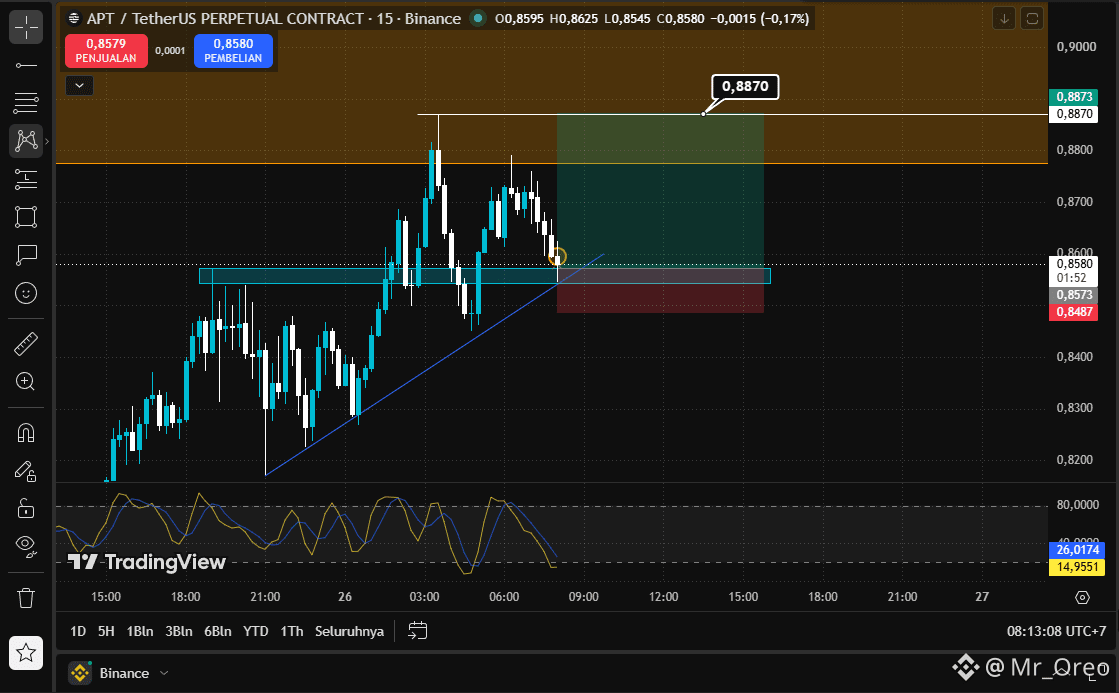
$APT TF 15M pendek..
Disclaimer: Konten ini murni analisis teknikal dan bukan nasihat keuangan. Selalu gunakan manajemen risiko dan Do Your Own Research (DYOR).
#MrOreoAnalysis
{future}(APTUSDT)
$APT TF 15M pendek..
Disclaimer: Konten ini murni analisis teknikal dan bukan nasihat keuangan. Selalu gunakan manajemen risiko dan Do Your Own Research (DYOR).
#MrOreoAnalysis
Disclaimer: Konten ini murni analisis teknikal dan bukan nasihat keuangan. Selalu gunakan manajemen risiko dan Do Your Own Research (DYOR).
#MrOreoAnalysis
1
490
·
--
Übersetzung ansehen
Mr_Oreo
·
--
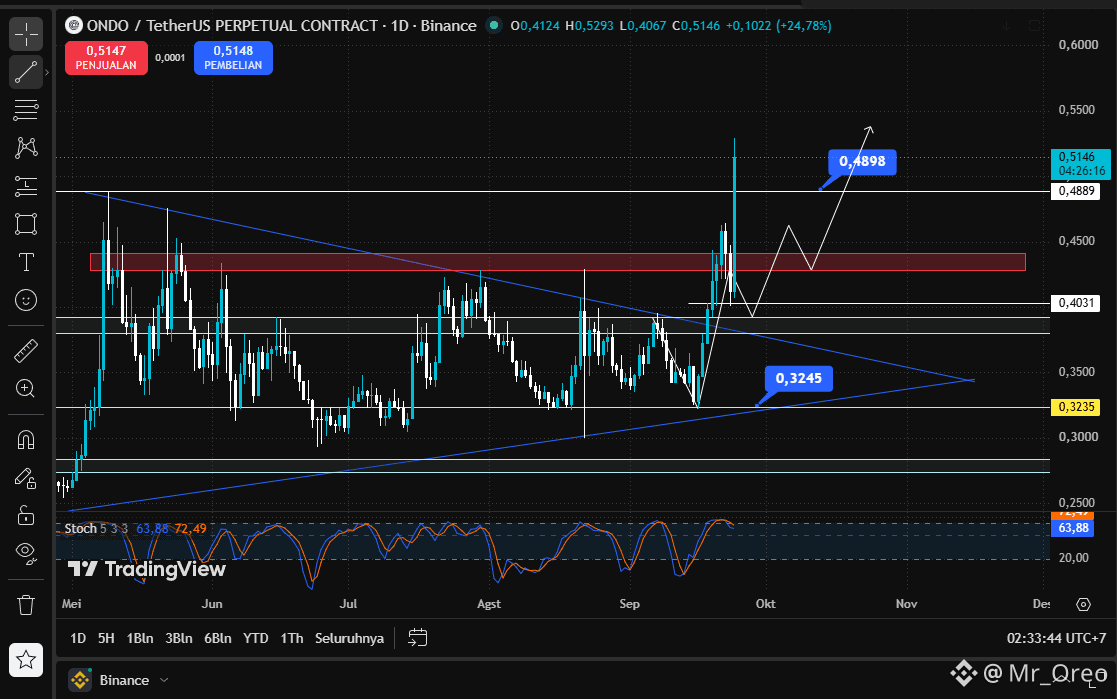
$ONDO rejection at the 0.3245 area with high buying volume, then continued to rise to 0.4280. interesting to watch
1
150
·
--
Übersetzung ansehen
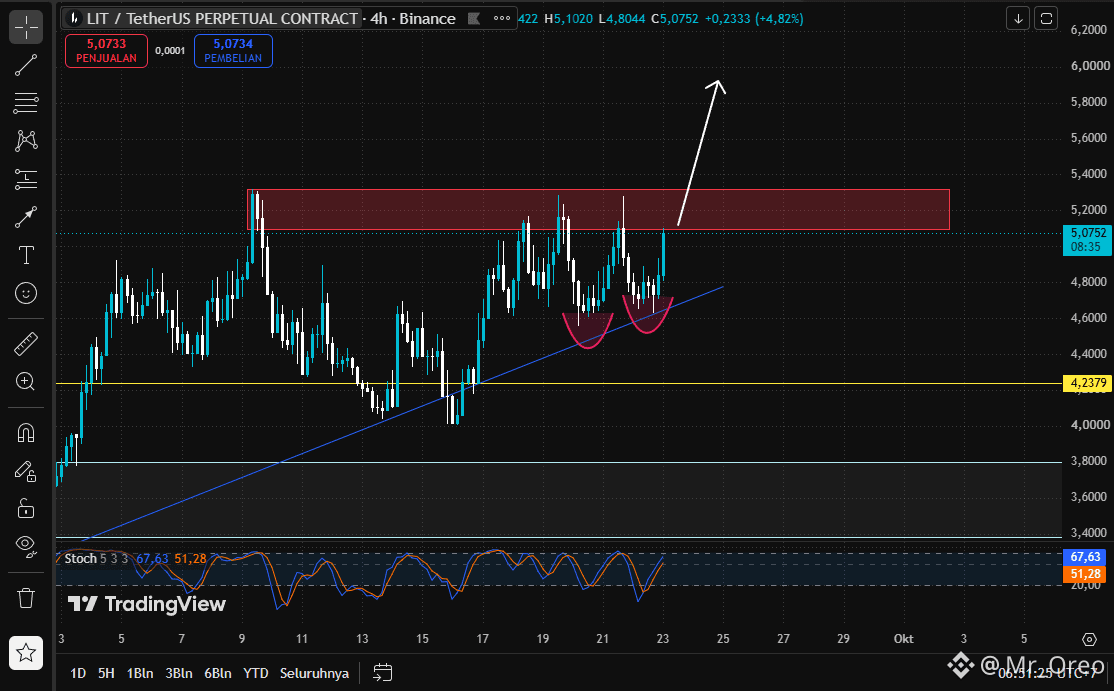
Halo semuanya! Mari kita analisis pergerakan harga $LIT pada chart 4 Jam (4H). Saat ini, harga berada di titik keputusan krusial dengan dua potensi skenario pergerakan:
📈 Skenario (A): Immediate Breakout. Harga saat ini (sekitar $5,07) sedang menguji area resistance zona merah ($5,10 – $5,30). Indikator Stochastic di bawah menunjukkan crossover ke atas dari garis tren support. Jika breakout berhasil, LIT berpeluang kuat untuk terus naik menuju target resistance berikutnya di rentang $5,80 – $6,00.
📉 Skenario (B): Koreksi / Rejection. Jika tekanan jual di zona resistance masih kuat dan harga mengalami penolakan (rejection), LIT kemungkinan akan berkonsolidasi kembali ke area garis support di kisaran $4,60 – $4,80. Area ini dapat menjadi zona demand untuk membentuk fondasi baru sebelum melanjutkan kenaikan.
Kesimpulan: Secara keseluruhan, struktur pasar menunjukkan pola Double Bottom yang berpotensi bullish, namun arah jangka pendek sangat bergantung pada kemampuan harga menembus level $5,30.
Menurut kalian, apakah LIT akan mengikuti jalur (A) atau (B)? Tulis pendapatmu di kolom komentar!
Disclaimer: Konten ini murni analisis teknikal dan bukan nasihat keuangan. Selalu gunakan manajemen risiko dan Do Your Own Research (DYOR).
#MrOreoAnalysis #LIT #LITUSDT #TechnicalAnalysis
Halo semuanya! Mari kita analisis pergerakan harga $LIT pada chart 4 Jam (4H). Saat ini, harga berada di titik keputusan krusial dengan dua potensi skenario pergerakan:
📈 Skenario (A): Immediate Breakout. Harga saat ini (sekitar $5,07) sedang menguji area resistance zona merah ($5,10 – $5,30). Indikator Stochastic di bawah menunjukkan crossover ke atas dari garis tren support. Jika breakout berhasil, LIT berpeluang kuat untuk terus naik menuju target resistance berikutnya di rentang $5,80 – $6,00.
📉 Skenario (B): Koreksi / Rejection. Jika tekanan jual di zona resistance masih kuat dan harga mengalami penolakan (rejection), LIT kemungkinan akan berkonsolidasi kembali ke area garis support di kisaran $4,60 – $4,80. Area ini dapat menjadi zona demand untuk membentuk fondasi baru sebelum melanjutkan kenaikan.
Kesimpulan: Secara keseluruhan, struktur pasar menunjukkan pola Double Bottom yang berpotensi bullish, namun arah jangka pendek sangat bergantung pada kemampuan harga menembus level $5,30.
Menurut kalian, apakah LIT akan mengikuti jalur (A) atau (B)? Tulis pendapatmu di kolom komentar!
Disclaimer: Konten ini murni analisis teknikal dan bukan nasihat keuangan. Selalu gunakan manajemen risiko dan Do Your Own Research (DYOR).
#MrOreoAnalysis #LIT #LITUSDT #TechnicalAnalysis
📈 Skenario (A): Immediate Breakout. Harga saat ini (sekitar $5,07) sedang menguji area resistance zona merah ($5,10 – $5,30). Indikator Stochastic di bawah menunjukkan crossover ke atas dari garis tren support. Jika breakout berhasil, LIT berpeluang kuat untuk terus naik menuju target resistance berikutnya di rentang $5,80 – $6,00.
📉 Skenario (B): Koreksi / Rejection. Jika tekanan jual di zona resistance masih kuat dan harga mengalami penolakan (rejection), LIT kemungkinan akan berkonsolidasi kembali ke area garis support di kisaran $4,60 – $4,80. Area ini dapat menjadi zona demand untuk membentuk fondasi baru sebelum melanjutkan kenaikan.
Kesimpulan: Secara keseluruhan, struktur pasar menunjukkan pola Double Bottom yang berpotensi bullish, namun arah jangka pendek sangat bergantung pada kemampuan harga menembus level $5,30.
Menurut kalian, apakah LIT akan mengikuti jalur (A) atau (B)? Tulis pendapatmu di kolom komentar!
Disclaimer: Konten ini murni analisis teknikal dan bukan nasihat keuangan. Selalu gunakan manajemen risiko dan Do Your Own Research (DYOR).
#MrOreoAnalysis #LIT #LITUSDT #TechnicalAnalysis
1
185
·
--
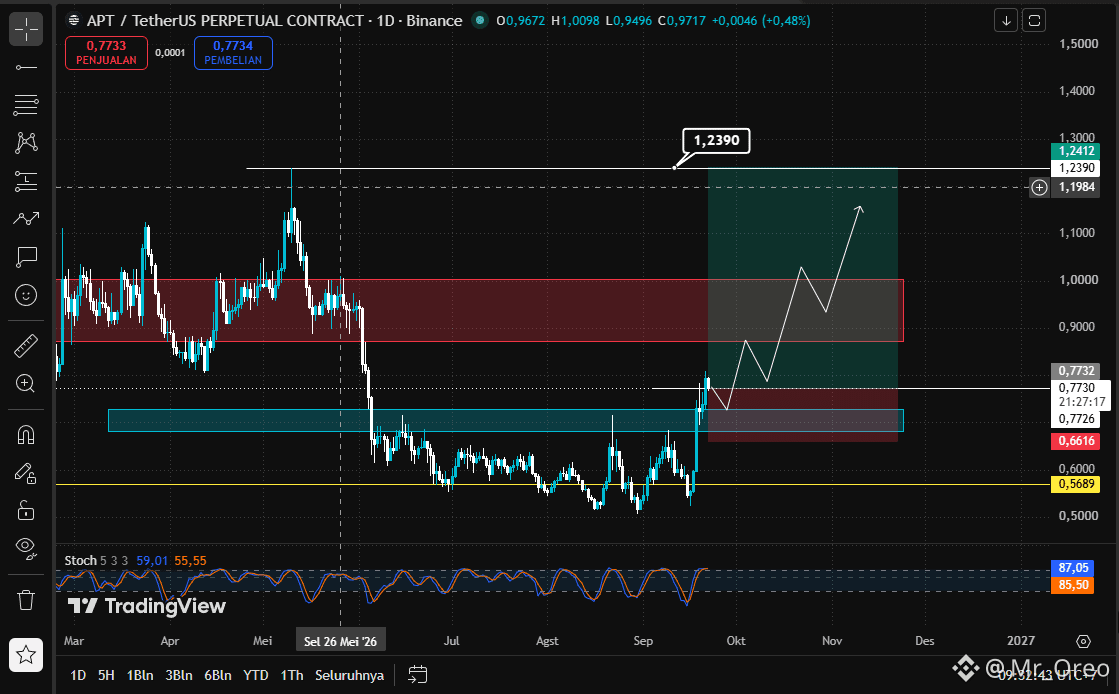
$APT beginnt mit der Erholung aus dem Demand-Bereich 0,66–0,77 USDT, nachdem eine ausreichend lange Akkumulationsphase durchlaufen wurde.
Wichtige Levels, die es zu beachten gilt:
Support: 0,66–0,77
Resistance: 0,87–1,00
Widerstand (Major): 1,19–1,24
Das bullische Szenario wird noch attraktiver, wenn der Kurs einen Breakout gelingt und einen Close über 1,00 hinlegt, gestützt durch das Volumen. Gelingt dies, wird der Bereich 1,19–1,24 die nächste wichtige Resistance sein, die es zu beobachten gilt.
Wenn der Kurs hingegen den Bereich 0,77 erneut verliert, sollte man auf einen möglichen Retest in den unteren Demand-Bereich achten.
Derzeit wirkt der Momentum stärker, aber der Stochastic befindet sich bereits im oberen Bereich. Daher bleiben eine Breakout-Bestätigung und das Volumen entscheidend, bevor man Positionen einnimmt.
Watchlist: $APT
Haftungsausschluss: Dieser Inhalt dient ausschließlich der technischen Analyse und stellt keine finanzielle Beratung dar. Übe stets Risikomanagement und mache Do Your Own Research (DYOR).
#MrOreoAnalysis #APTUSDT #BinanceSquare #TechnicalAnalysis
$APT beginnt mit der Erholung aus dem Demand-Bereich 0,66–0,77 USDT, nachdem eine ausreichend lange Akkumulationsphase durchlaufen wurde.
Wichtige Levels, die es zu beachten gilt:
Support: 0,66–0,77
Resistance: 0,87–1,00
Widerstand (Major): 1,19–1,24
Das bullische Szenario wird noch attraktiver, wenn der Kurs einen Breakout gelingt und einen Close über 1,00 hinlegt, gestützt durch das Volumen. Gelingt dies, wird der Bereich 1,19–1,24 die nächste wichtige Resistance sein, die es zu beobachten gilt.
Wenn der Kurs hingegen den Bereich 0,77 erneut verliert, sollte man auf einen möglichen Retest in den unteren Demand-Bereich achten.
Derzeit wirkt der Momentum stärker, aber der Stochastic befindet sich bereits im oberen Bereich. Daher bleiben eine Breakout-Bestätigung und das Volumen entscheidend, bevor man Positionen einnimmt.
Watchlist: $APT
Haftungsausschluss: Dieser Inhalt dient ausschließlich der technischen Analyse und stellt keine finanzielle Beratung dar. Übe stets Risikomanagement und mache Do Your Own Research (DYOR).
#MrOreoAnalysis #APTUSDT #BinanceSquare #TechnicalAnalysis
Wichtige Levels, die es zu beachten gilt:
Support: 0,66–0,77
Resistance: 0,87–1,00
Widerstand (Major): 1,19–1,24
Das bullische Szenario wird noch attraktiver, wenn der Kurs einen Breakout gelingt und einen Close über 1,00 hinlegt, gestützt durch das Volumen. Gelingt dies, wird der Bereich 1,19–1,24 die nächste wichtige Resistance sein, die es zu beobachten gilt.
Wenn der Kurs hingegen den Bereich 0,77 erneut verliert, sollte man auf einen möglichen Retest in den unteren Demand-Bereich achten.
Derzeit wirkt der Momentum stärker, aber der Stochastic befindet sich bereits im oberen Bereich. Daher bleiben eine Breakout-Bestätigung und das Volumen entscheidend, bevor man Positionen einnimmt.
Watchlist: $APT
Haftungsausschluss: Dieser Inhalt dient ausschließlich der technischen Analyse und stellt keine finanzielle Beratung dar. Übe stets Risikomanagement und mache Do Your Own Research (DYOR).
#MrOreoAnalysis #APTUSDT #BinanceSquare #TechnicalAnalysis
1
353
·
--
Übersetzung ansehen
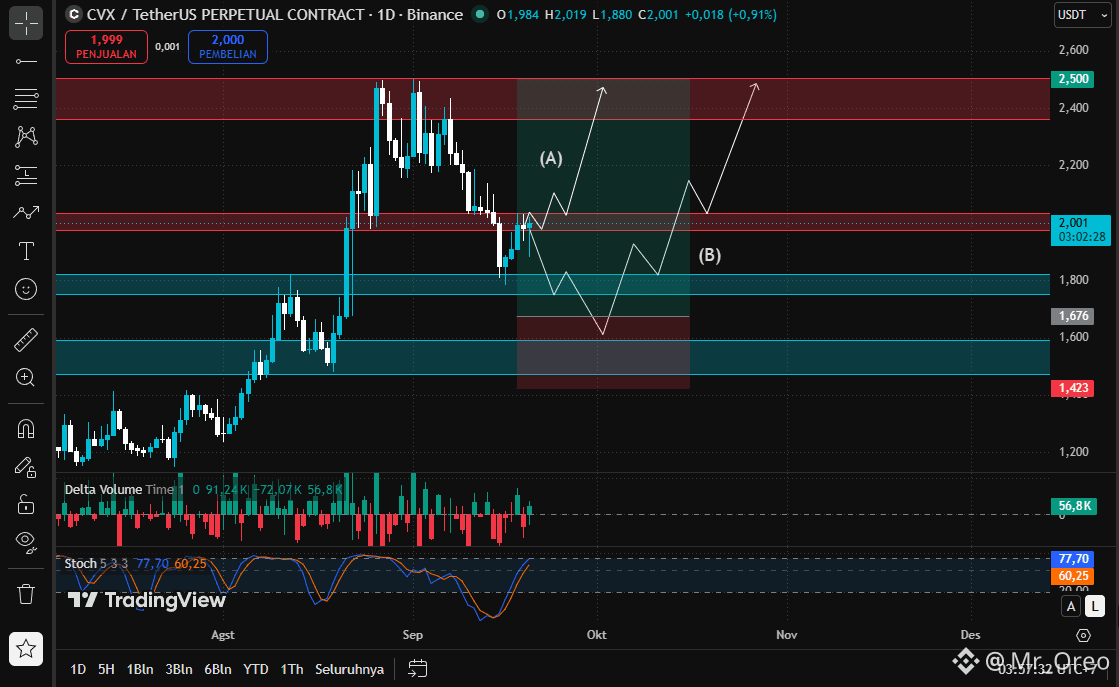
Hello everyone! Let's analyze the $CVX price movement on the daily (1D) chart. Currently, the price is at a critical decision point with two potential movement scenarios:
📈 Scenario (A): Immediate Rebound. The current price (around $2.001) is sitting at the first support area, marked by the blue zone ($1.800 – $2.000). Looking at the Stochastic indicator at the bottom, the lines are beginning to show an upward crossover from the oversold zone. If this support holds, CVX has a strong chance of rebounding immediately toward the resistance target in the upper red zone—specifically the $2.400 – $2.500 range.
📉 Scenario (B): Correction to Demand Area. If selling pressure remains strong and the price breaks below the current support, CVX will likely drop to test the second support area in the $1.423 – $1.676 range (lower red zone). This level could act as a strong demand zone, potentially allowing the price to establish a new foothold before eventually reversing and rising toward the $2.500 resistance target.
Conclusion: Overall, the market structure indicates a potential bullish move to retest the $2.400+ area; however, the short-term direction depends on whether the support at the $1.800 level holds.
Do you think CVX will follow path (A) or (B)? Share your thoughts in the comments!
Disclaimer: This content is purely technical analysis and not financial advice. Always practice risk management and Do Your Own Research (DYOR).
#MrOreoAnalysis #CVX #CVXUSDT #DYOR
Hello everyone! Let's analyze the $CVX price movement on the daily (1D) chart. Currently, the price is at a critical decision point with two potential movement scenarios:
📈 Scenario (A): Immediate Rebound. The current price (around $2.001) is sitting at the first support area, marked by the blue zone ($1.800 – $2.000). Looking at the Stochastic indicator at the bottom, the lines are beginning to show an upward crossover from the oversold zone. If this support holds, CVX has a strong chance of rebounding immediately toward the resistance target in the upper red zone—specifically the $2.400 – $2.500 range.
📉 Scenario (B): Correction to Demand Area. If selling pressure remains strong and the price breaks below the current support, CVX will likely drop to test the second support area in the $1.423 – $1.676 range (lower red zone). This level could act as a strong demand zone, potentially allowing the price to establish a new foothold before eventually reversing and rising toward the $2.500 resistance target.
Conclusion: Overall, the market structure indicates a potential bullish move to retest the $2.400+ area; however, the short-term direction depends on whether the support at the $1.800 level holds.
Do you think CVX will follow path (A) or (B)? Share your thoughts in the comments!
Disclaimer: This content is purely technical analysis and not financial advice. Always practice risk management and Do Your Own Research (DYOR).
#MrOreoAnalysis #CVX #CVXUSDT #DYOR
📈 Scenario (A): Immediate Rebound. The current price (around $2.001) is sitting at the first support area, marked by the blue zone ($1.800 – $2.000). Looking at the Stochastic indicator at the bottom, the lines are beginning to show an upward crossover from the oversold zone. If this support holds, CVX has a strong chance of rebounding immediately toward the resistance target in the upper red zone—specifically the $2.400 – $2.500 range.
📉 Scenario (B): Correction to Demand Area. If selling pressure remains strong and the price breaks below the current support, CVX will likely drop to test the second support area in the $1.423 – $1.676 range (lower red zone). This level could act as a strong demand zone, potentially allowing the price to establish a new foothold before eventually reversing and rising toward the $2.500 resistance target.
Conclusion: Overall, the market structure indicates a potential bullish move to retest the $2.400+ area; however, the short-term direction depends on whether the support at the $1.800 level holds.
Do you think CVX will follow path (A) or (B)? Share your thoughts in the comments!
Disclaimer: This content is purely technical analysis and not financial advice. Always practice risk management and Do Your Own Research (DYOR).
#MrOreoAnalysis #CVX #CVXUSDT #DYOR
1
76
·
--
Übersetzung ansehen
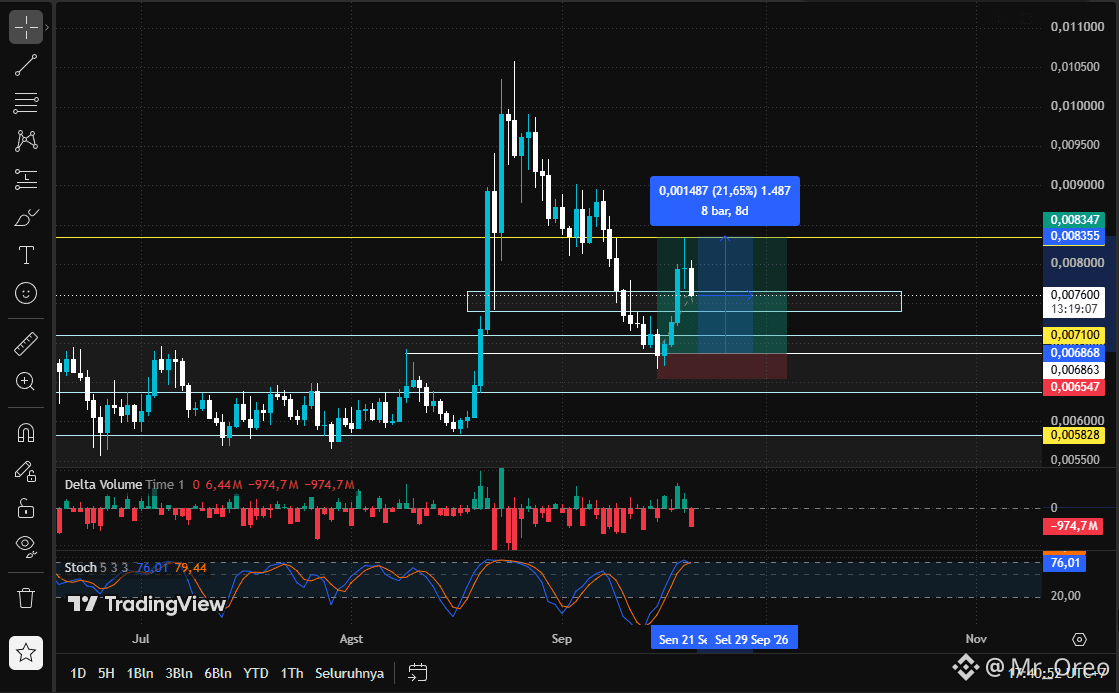
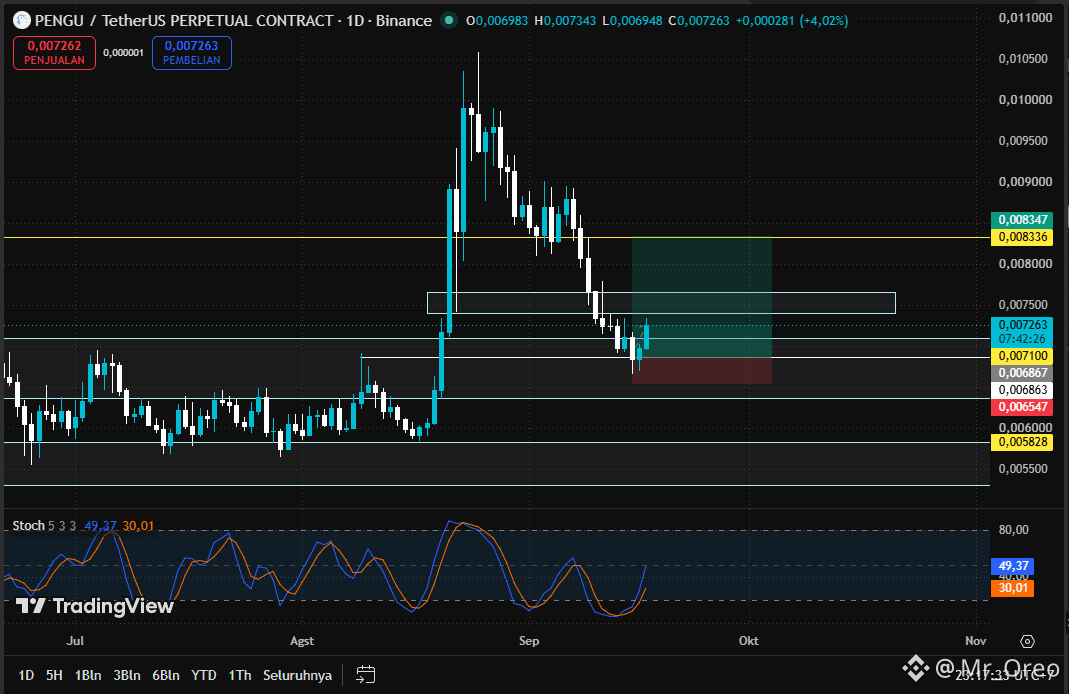
sedikit profit di $PENGU 😁
sedikit profit di $PENGU 😁
Mr_Oreo
·
--
taking a little profit in $PENGU
2
208
·
--
Übersetzung ansehen
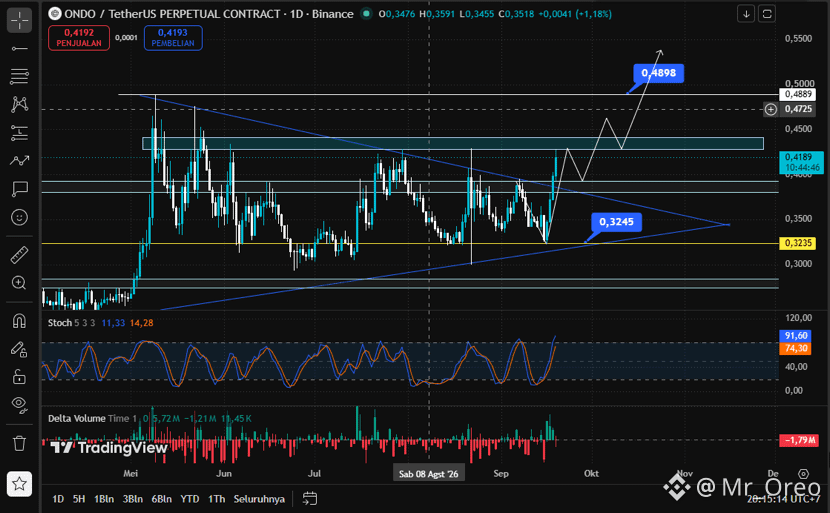
$ONDO rejection at the 0.3245 area with high buying volume, then continued to rise to 0.4280. interesting to watch
$ONDO rejection at the 0.3245 area with high buying volume, then continued to rise to 0.4280. interesting to watch
1
1
224
·
--
Übersetzung ansehen
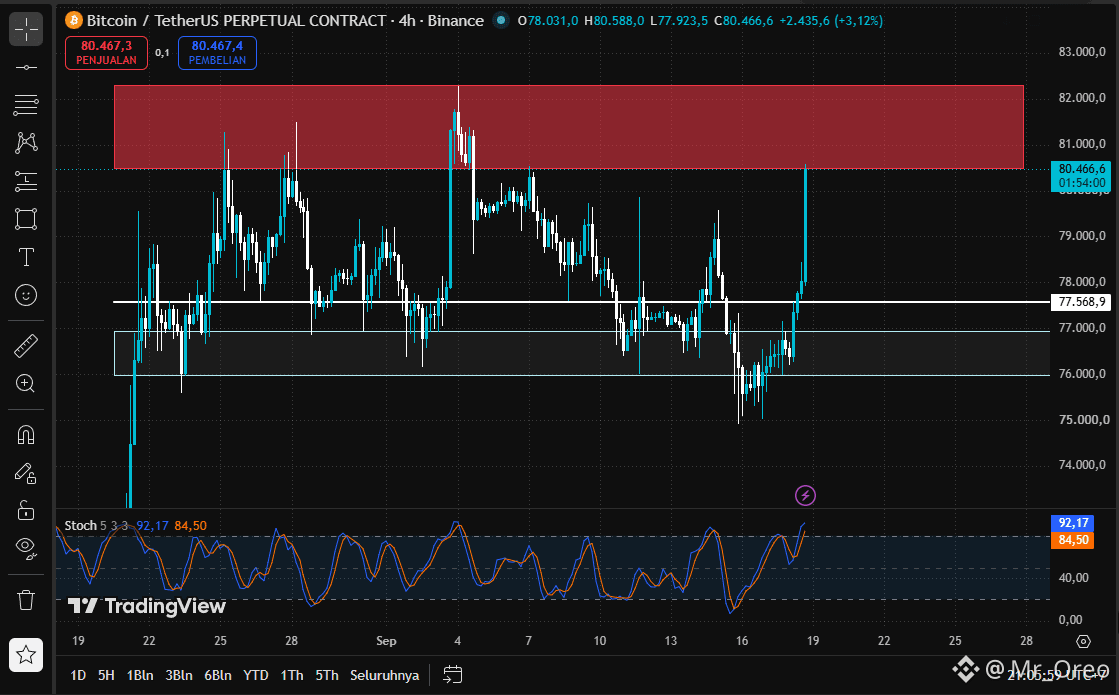
$BTC Even bad news can't stop a bull that's running.😁crazy
$BTC Even bad news can't stop a bull that's running.😁crazy
1
83
·
--
Übersetzung ansehen
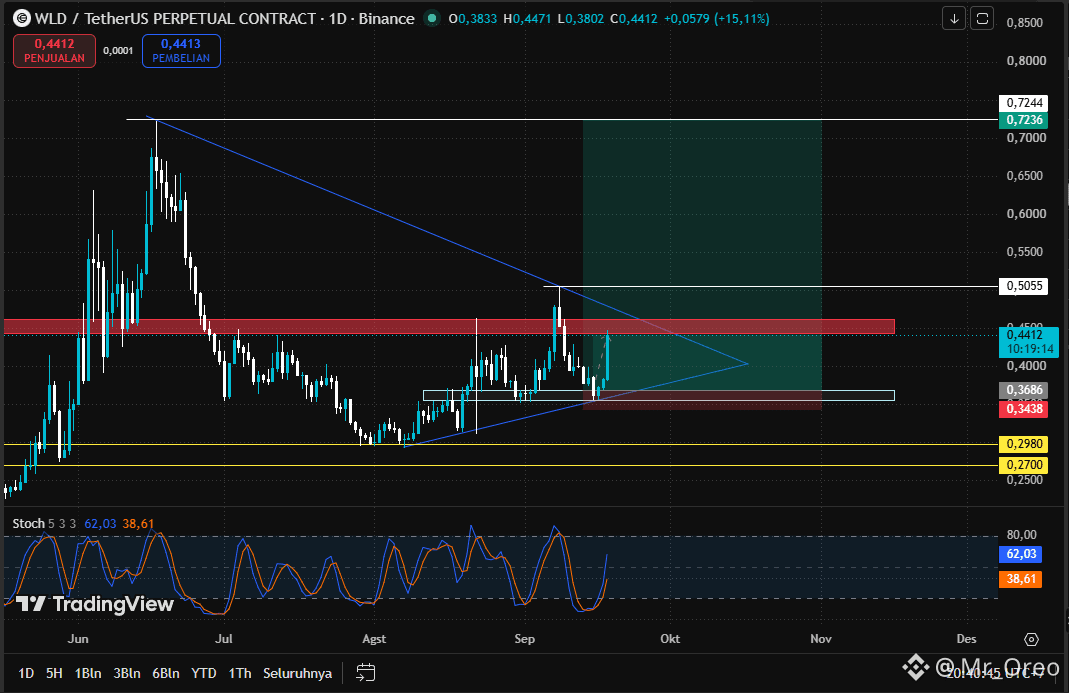
update $WLD I've already taken some of my profits and set BEP. if you want to open position, wait for it to break the resistance area and try to find the retest area
update $WLD I've already taken some of my profits and set BEP. if you want to open position, wait for it to break the resistance area and try to find the retest area
2
176
·
--
Bullisch
Übersetzung ansehen
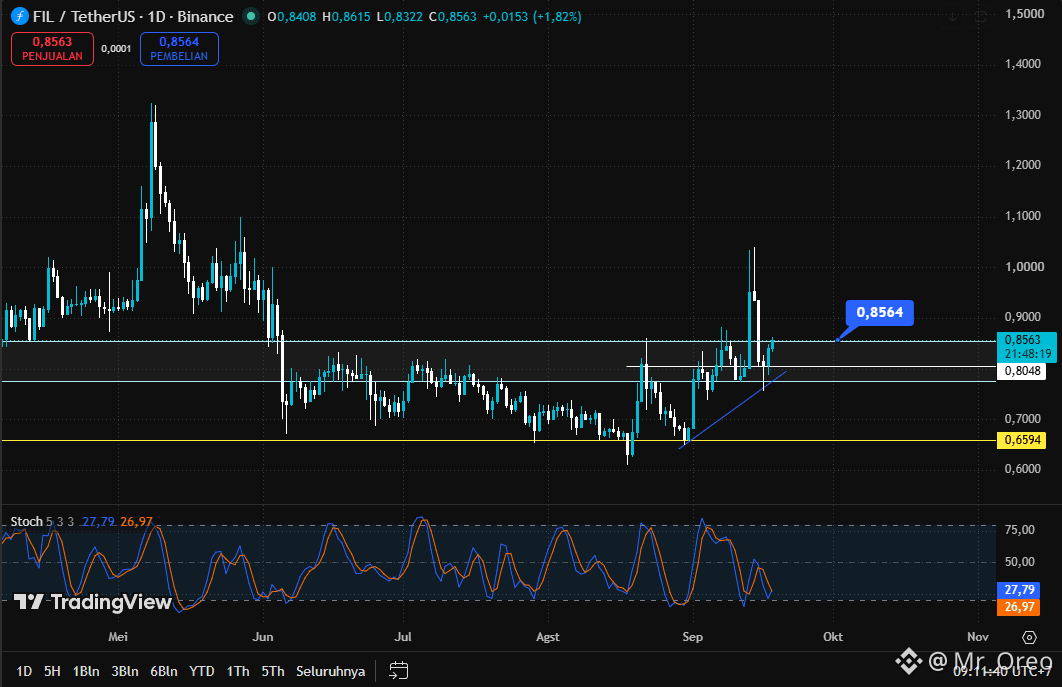
if $FIL manages to retake the 0.8564 area and stay there on the daily, I have no idea how high it could go. $1-$4? let's see where the market takes it😁
if $FIL manages to retake the 0.8564 area and stay there on the daily, I have no idea how high it could go. $1-$4? let's see where the market takes it😁
1
318
·
--
1
1
240
·
--
Bullisch
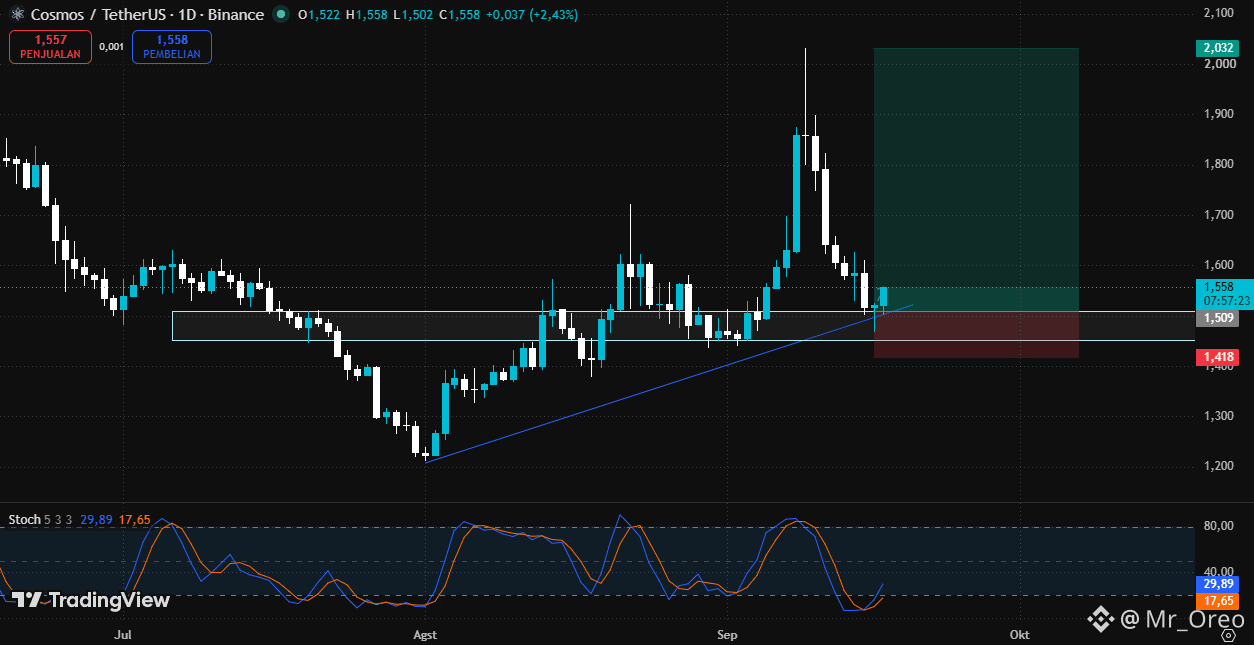
$ATOM goodluck!,vergiss nicht mir einen Trinkgeld zu geben😁
$ATOM goodluck!,vergiss nicht mir einen Trinkgeld zu geben😁
1
2
515
·
--
Bärisch
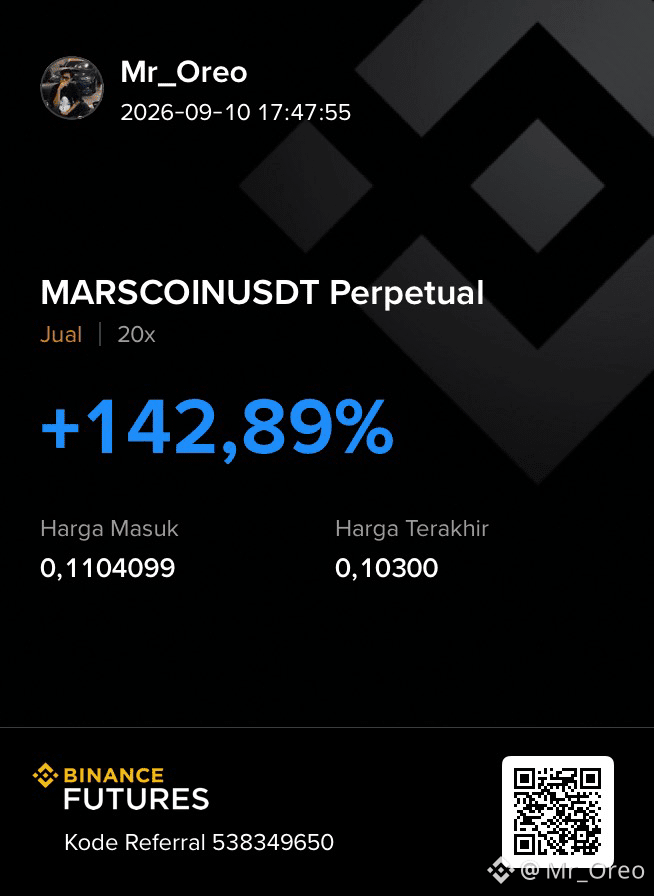
1
7
·
--
Übersetzung ansehen
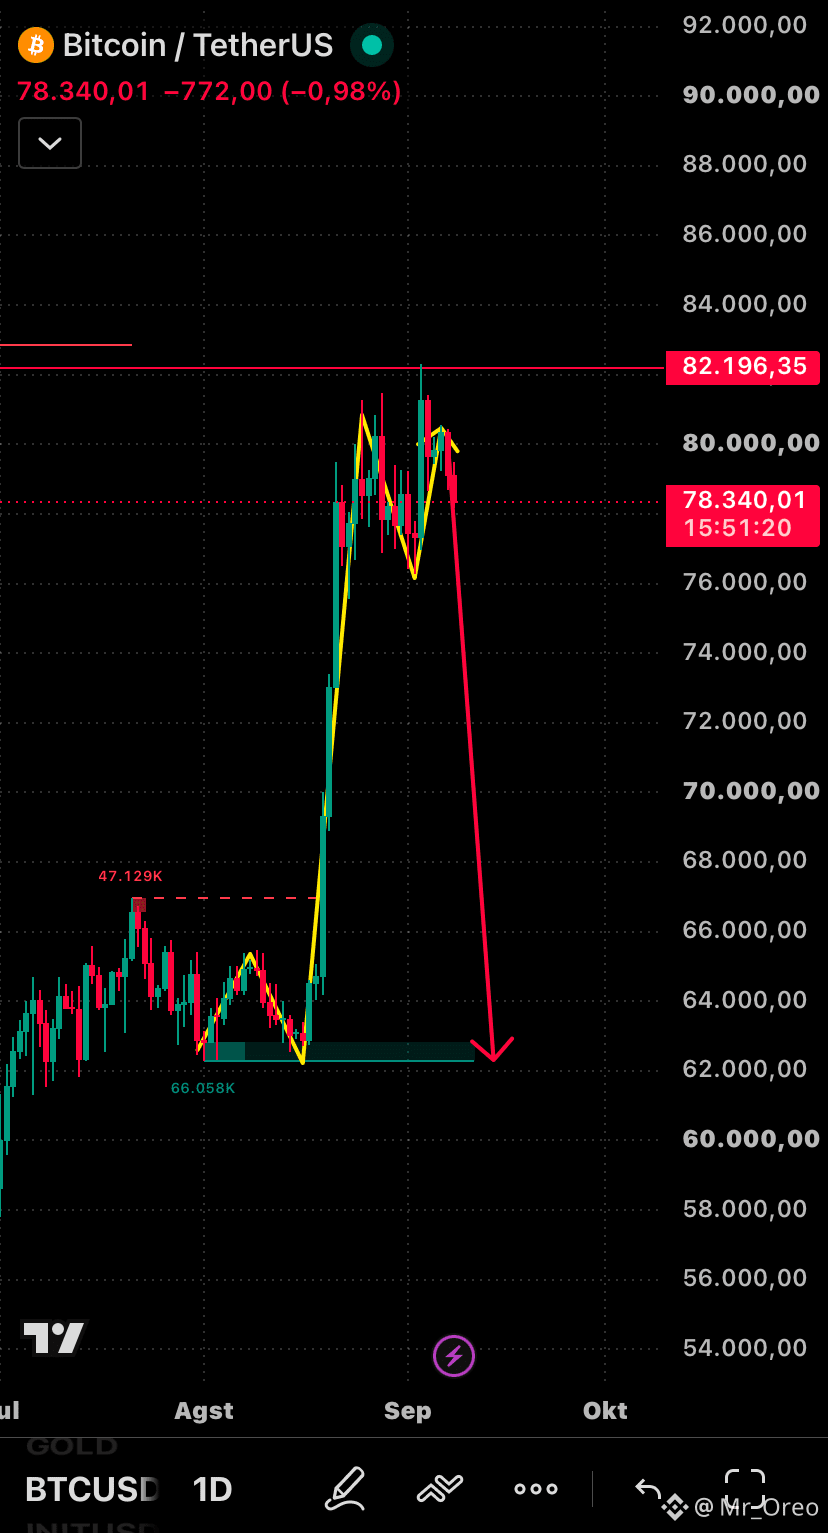
Like this maybe my prediction about $BTC 😅
Like this maybe my prediction about $BTC 😅
1
91
·
--
Bullisch
Übersetzung ansehen
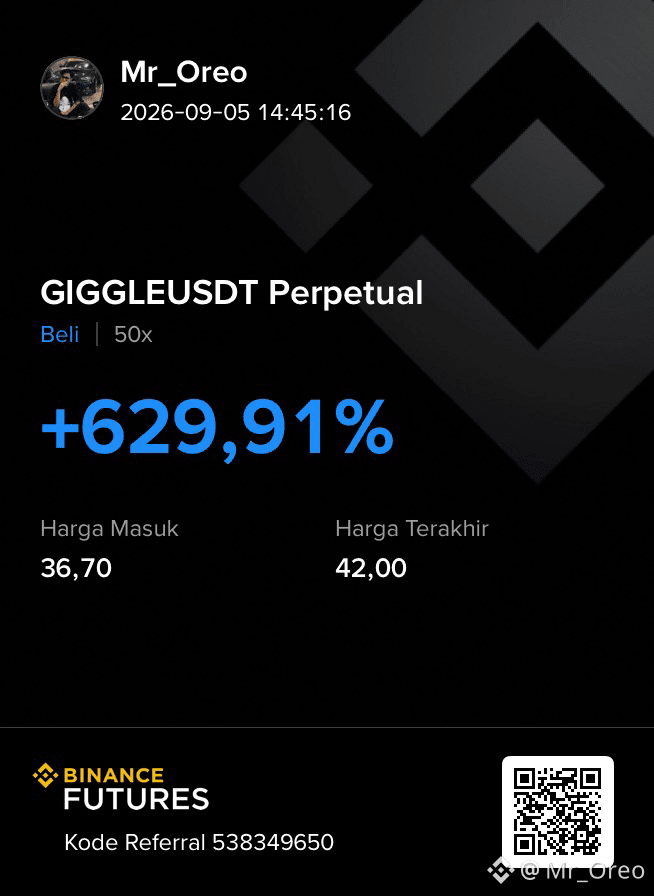
If $GIGGLE breaks through the 45.80 level and holds, the next target is 55.59.
If $GIGGLE breaks through the 45.80 level and holds, the next target is 55.59.
Mr_Oreo
·
--
Bullisch$GIGGLE I will tell you, don't miss it!
1
125
·
--
Bullisch
Übersetzung ansehen
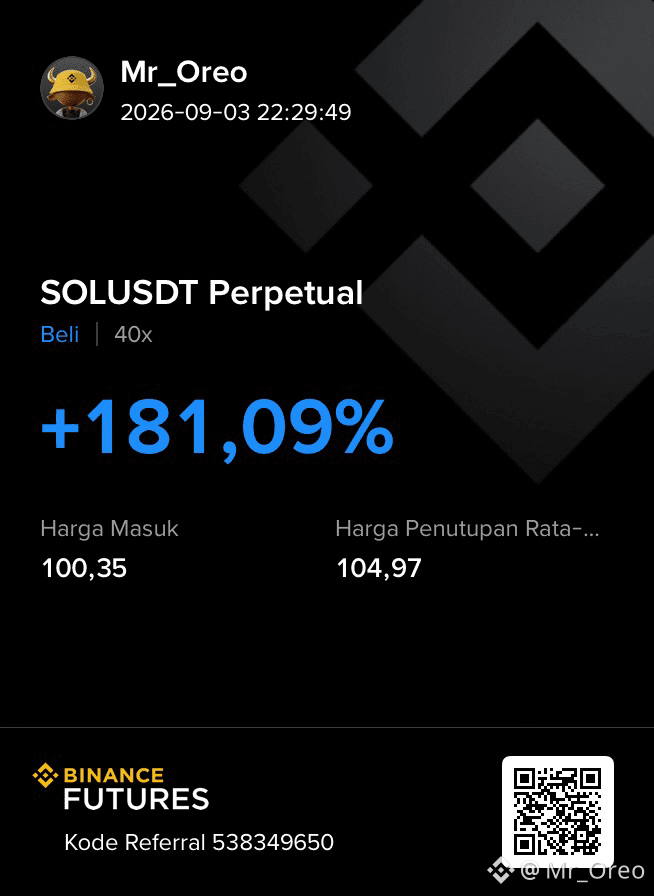
$GIGGLE I will tell you, don't miss it!
$GIGGLE I will tell you, don't miss it!
1
1
74
·
--
Übersetzung ansehen
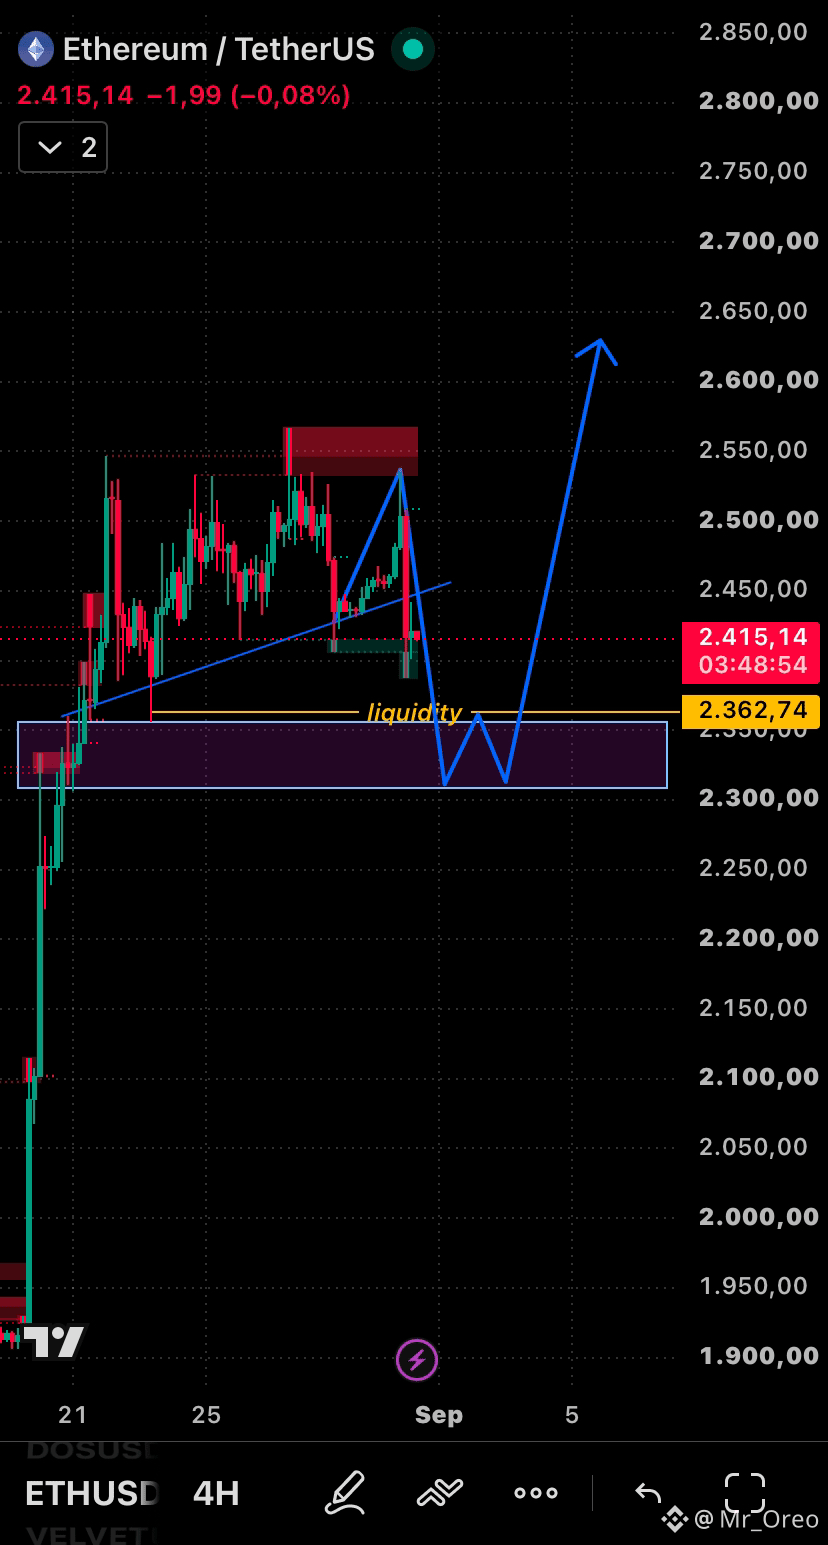
$ETH after the liquidity grab,what next?👀
$ETH after the liquidity grab,what next?👀
85
Anmelden und weiter Inhalte entdecken
Krypto-Nutzer weltweit auf Binance Square kennenlernen
⚡️ Bleib in Sachen Krypto stets am Puls.
💬 Die weltgrößte Kryptobörse vertraut darauf.
👍 Erhalte verlässliche Einblicke von verifizierten Creators.
E-Mail-Adresse/Telefonnummer