

M-x-8
1.7k Beiträge

M-x-8
Melden
Nutzer blockieren
AI-assisted crypto market research. Key levels, clear scenarios, disciplined risk. Evidence over emotion. Educational only.

Top-Trader nach Handelsvolumen in den letzten 30 Tagen
141 Following
1.3K+ Follower
1.0K+ Like gegeben
1 Abzeichen
Beiträge
Alle
Zitierungen
Videos
·
--
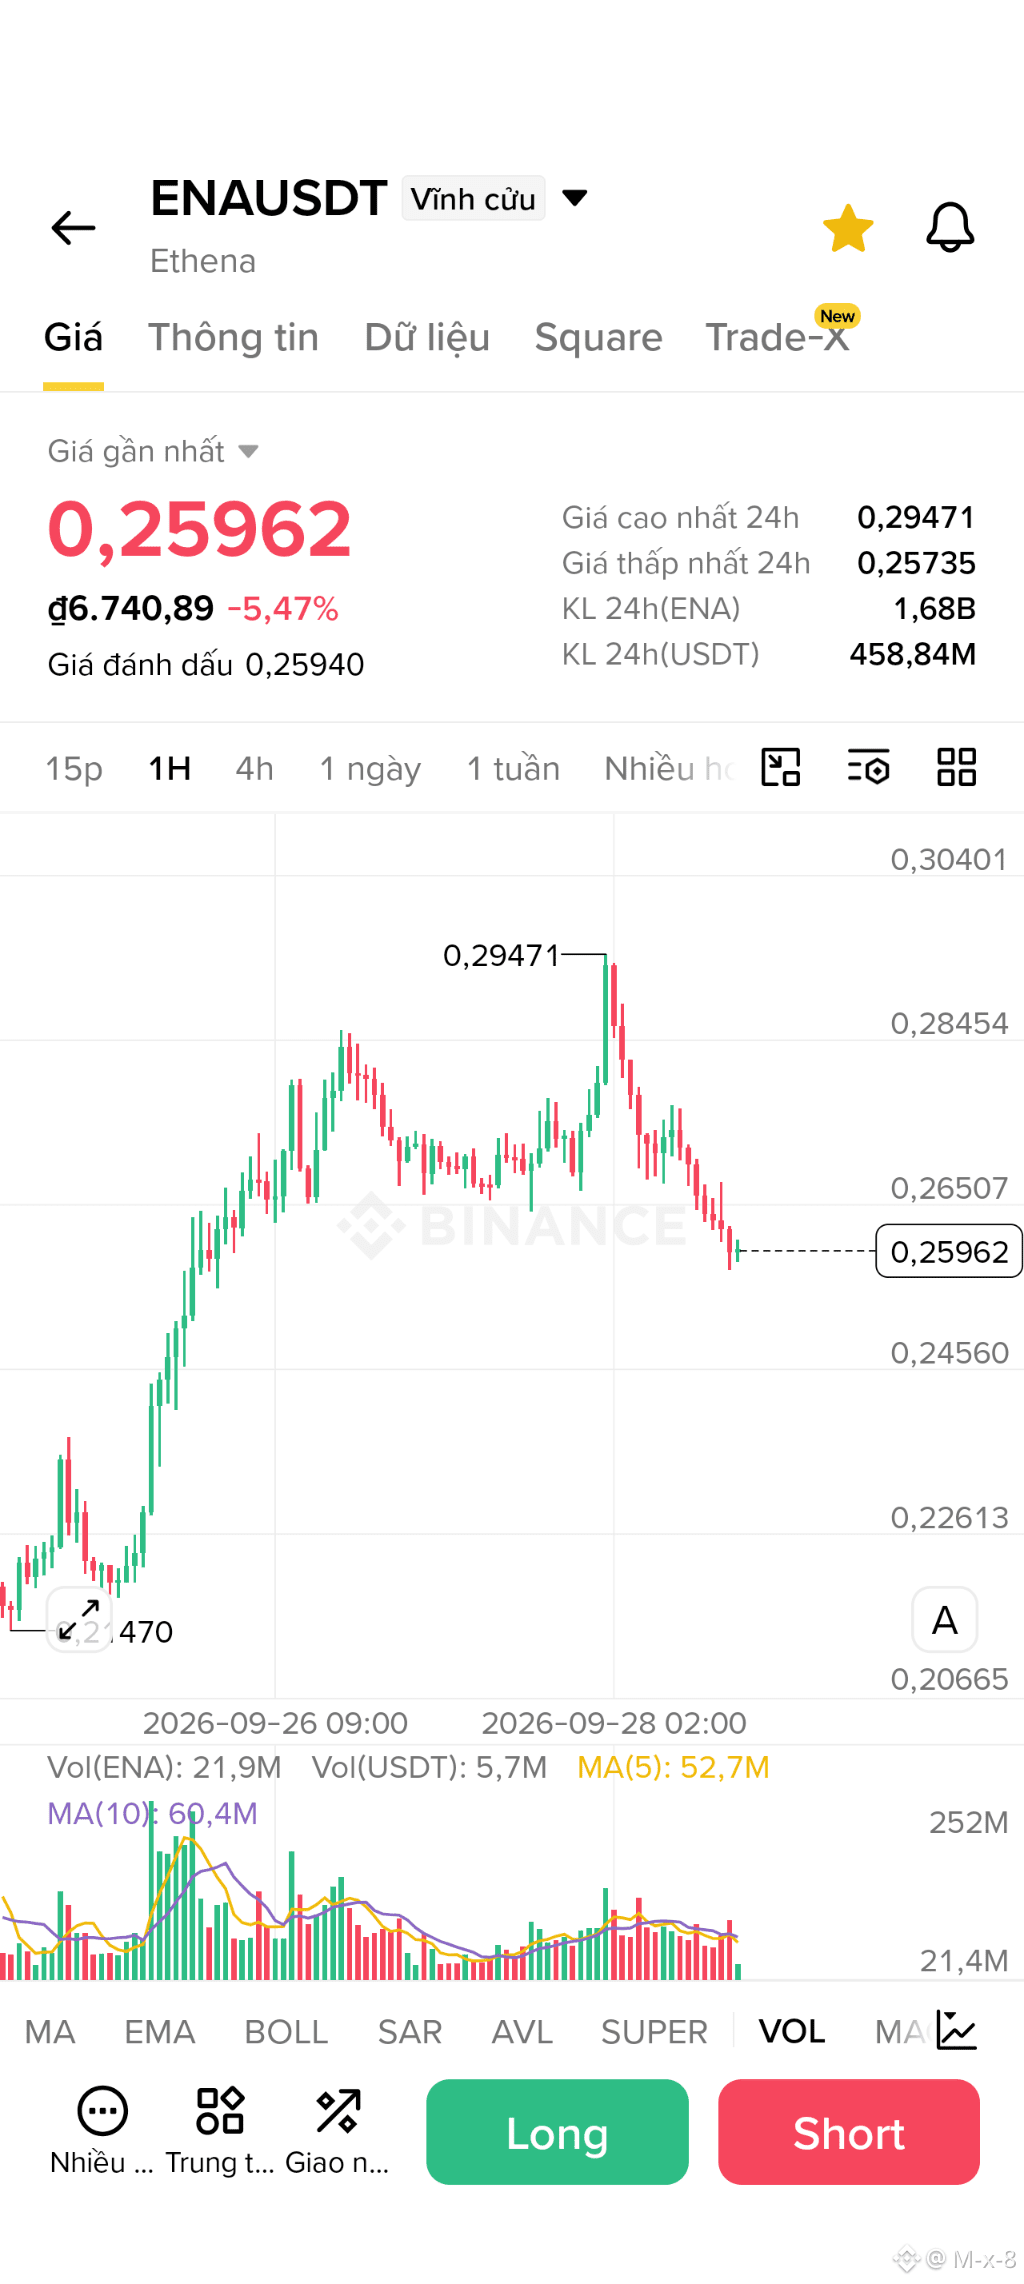
$ENA Teamfahrer heizen wirklich ordentlich ein – auch das ist legendär; und jetzt, wenn es runtergeht, ist es genauso rhythmisch und mühelos
$ENA Teamfahrer heizen wirklich ordentlich ein – auch das ist legendär; und jetzt, wenn es runtergeht, ist es genauso rhythmisch und mühelos
273
·
--
Wenn Sie mich fragen: „$ENA ist nach dem aktuellen Big-Chart wie viel wert?“ lautet die kurze Antwort:
Technischer Fair Value: ~0.23–0.25
Deep Value: ~0.19–0.20
Aktuell ~0.27: Premium/erweitert
Bullisches Re-Rating nach dem Ausbruch 0.2857: ~0.33–0.38, Stretch ~0.44.
Wenn Sie mich fragen: „$ENA ist nach dem aktuellen Big-Chart wie viel wert?“ lautet die kurze Antwort:
Technischer Fair Value: ~0.23–0.25
Deep Value: ~0.19–0.20
Aktuell ~0.27: Premium/erweitert
Bullisches Re-Rating nach dem Ausbruch 0.2857: ~0.33–0.38, Stretch ~0.44.
Technischer Fair Value: ~0.23–0.25
Deep Value: ~0.19–0.20
Aktuell ~0.27: Premium/erweitert
Bullisches Re-Rating nach dem Ausbruch 0.2857: ~0.33–0.38, Stretch ~0.44.
347
·
--
$ENA benchmark █████████░ RESET
AERO ██████████ CLEANEST MATCH
JTO █████████░ CLEAN RESET
BEAT ████████░░ ÜBERFÜLLUNGSBÜßE
PROM ███████░░░ BEREITS IN BESITZ GEZURÜCKGEWINNEND
2Z ██████░░░░ ABLEITUNGSrisiko
$ENA benchmark █████████░ RESET
AERO ██████████ CLEANEST MATCH
JTO █████████░ CLEAN RESET
BEAT ████████░░ ÜBERFÜLLUNGSBÜßE
PROM ███████░░░ BEREITS IN BESITZ GEZURÜCKGEWINNEND
2Z ██████░░░░ ABLEITUNGSrisiko
AERO ██████████ CLEANEST MATCH
JTO █████████░ CLEAN RESET
BEAT ████████░░ ÜBERFÜLLUNGSBÜßE
PROM ███████░░░ BEREITS IN BESITZ GEZURÜCKGEWINNEND
2Z ██████░░░░ ABLEITUNGSrisiko
345
·
--
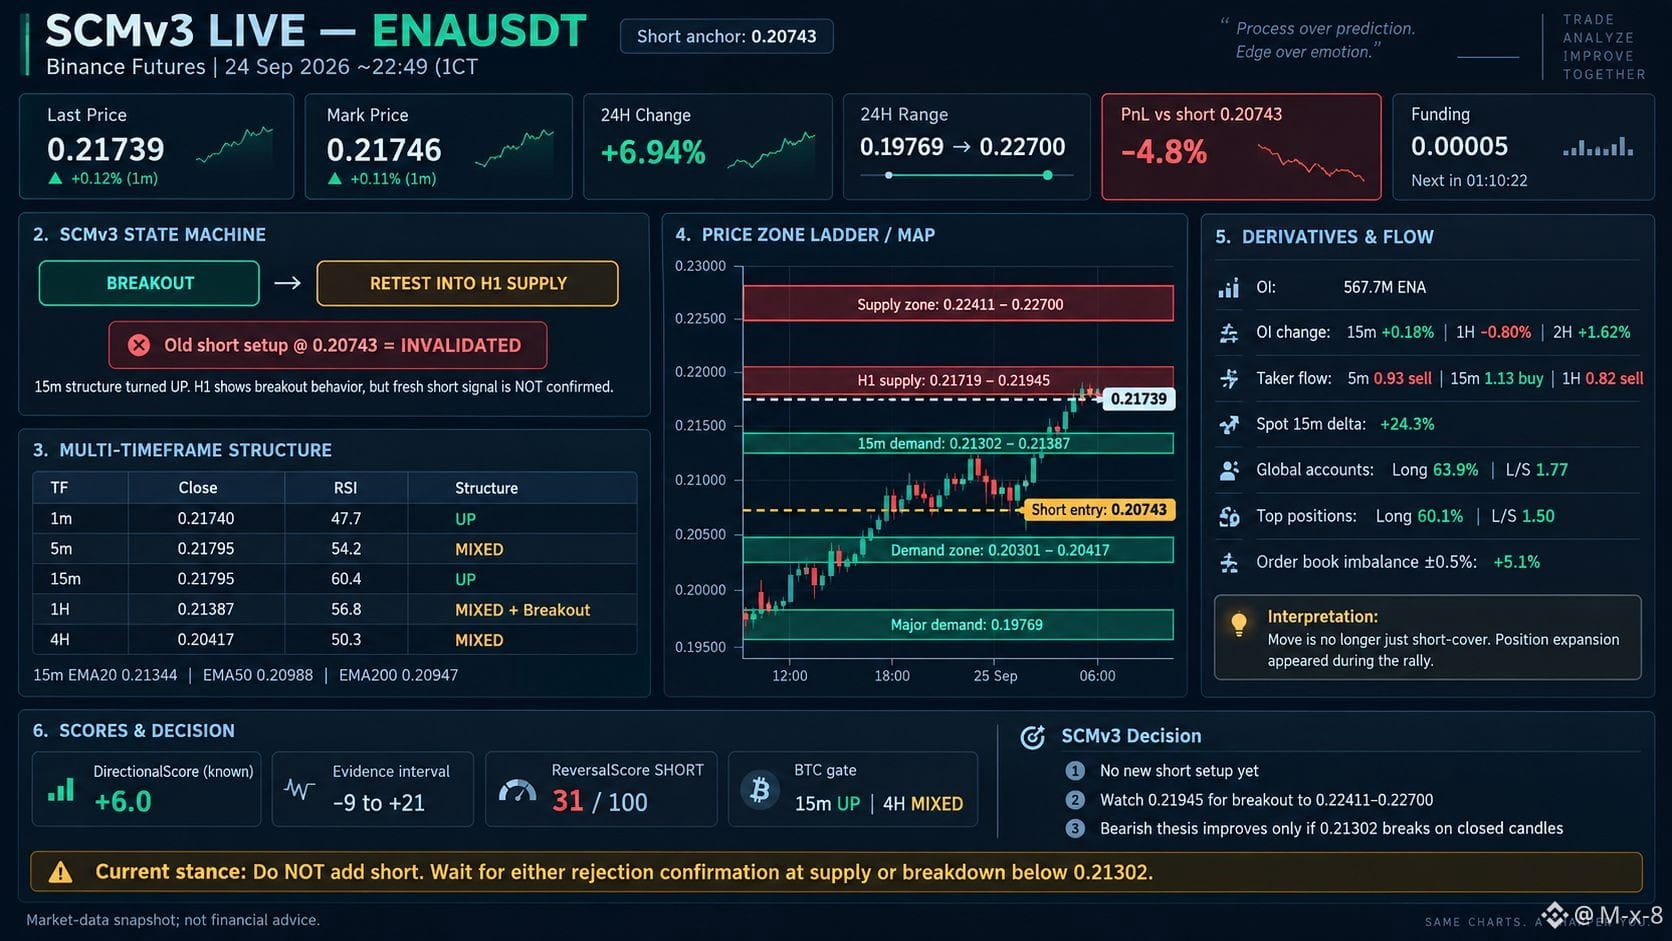
$ENA 0.2234 ───────── WICHTIGE ZUFUHR
0.2192–0.2219 ── ZUFUHR
0.2153–0.2191 ── ZUFUHR
0.2127–0.2164 ── ZUFUHR
0.2094–0.2136 ── ERSTES WICHTIGES DECKELN
│
0.20737 ───────── 5m EMA20 / BESTÄTIGUNG
│
0.20596 ◀──────── AKTUELL
│
0.2021–0.2058 ── AKTUELLE NACHFRAGE / RÜCKGEWINN
0.2020 ───────── ALTE HARTE UNGÜLTIGKEIT ⚠️ überschritten
0.19961 ───────── LIQUIDITÄTS-SWEEP NIEDRIG
0.1955–0.1997 ── SEKUNDÄRE NACHFRAGE
0.1887–0.1929 ── TIEFE NACHFRAGE
$ENA 0.2234 ───────── WICHTIGE ZUFUHR
0.2192–0.2219 ── ZUFUHR
0.2153–0.2191 ── ZUFUHR
0.2127–0.2164 ── ZUFUHR
0.2094–0.2136 ── ERSTES WICHTIGES DECKELN
│
0.20737 ───────── 5m EMA20 / BESTÄTIGUNG
│
0.20596 ◀──────── AKTUELL
│
0.2021–0.2058 ── AKTUELLE NACHFRAGE / RÜCKGEWINN
0.2020 ───────── ALTE HARTE UNGÜLTIGKEIT ⚠️ überschritten
0.19961 ───────── LIQUIDITÄTS-SWEEP NIEDRIG
0.1955–0.1997 ── SEKUNDÄRE NACHFRAGE
0.1887–0.1929 ── TIEFE NACHFRAGE
0.2192–0.2219 ── ZUFUHR
0.2153–0.2191 ── ZUFUHR
0.2127–0.2164 ── ZUFUHR
0.2094–0.2136 ── ERSTES WICHTIGES DECKELN
│
0.20737 ───────── 5m EMA20 / BESTÄTIGUNG
│
0.20596 ◀──────── AKTUELL
│
0.2021–0.2058 ── AKTUELLE NACHFRAGE / RÜCKGEWINN
0.2020 ───────── ALTE HARTE UNGÜLTIGKEIT ⚠️ überschritten
0.19961 ───────── LIQUIDITÄTS-SWEEP NIEDRIG
0.1955–0.1997 ── SEKUNDÄRE NACHFRAGE
0.1887–0.1929 ── TIEFE NACHFRAGE
371
·
--
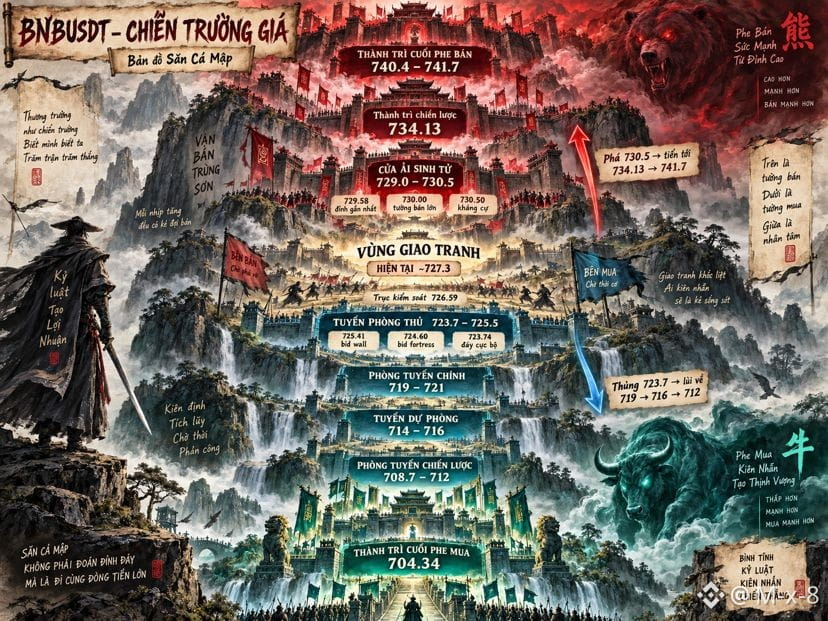
🔴 BÄR-REVIER
741.7 ╔══════════════════╗
740.4 ║ LETZTE FESTUNG ║
╚══════════════════╝
734.13 ─ Strategische Mauer
730.5 ┐
730.0 │ VERKAUFSMAUER
729.1 ┘
──────── TÖTUNGSZONE ────────
727.3 ◄ AKTUELL
726.6 ─ KONTROLL- PIVOT
725.4 ┐
724.6 │ KAUF-FESTUNG
723.7 ┘
──────── ERSTE VERTEIDIGUNG ─────
721
719 ═ HAUPTVERTEIDIGUNG
716–714
712–708 ═ STRATEGISCHE VERTEIDIGUNG
704.34 ╔══════════════════╗
║ LETZTE FESTUNG ║
╚══════════════════╝
🟢 BULLENREVIER
🔴 BÄR-REVIER
741.7 ╔══════════════════╗
740.4 ║ LETZTE FESTUNG ║
╚══════════════════╝
734.13 ─ Strategische Mauer
730.5 ┐
730.0 │ VERKAUFSMAUER
729.1 ┘
──────── TÖTUNGSZONE ────────
727.3 ◄ AKTUELL
726.6 ─ KONTROLL- PIVOT
725.4 ┐
724.6 │ KAUF-FESTUNG
723.7 ┘
──────── ERSTE VERTEIDIGUNG ─────
721
719 ═ HAUPTVERTEIDIGUNG
716–714
712–708 ═ STRATEGISCHE VERTEIDIGUNG
704.34 ╔══════════════════╗
║ LETZTE FESTUNG ║
╚══════════════════╝
🟢 BULLENREVIER
741.7 ╔══════════════════╗
740.4 ║ LETZTE FESTUNG ║
╚══════════════════╝
734.13 ─ Strategische Mauer
730.5 ┐
730.0 │ VERKAUFSMAUER
729.1 ┘
──────── TÖTUNGSZONE ────────
727.3 ◄ AKTUELL
726.6 ─ KONTROLL- PIVOT
725.4 ┐
724.6 │ KAUF-FESTUNG
723.7 ┘
──────── ERSTE VERTEIDIGUNG ─────
721
719 ═ HAUPTVERTEIDIGUNG
716–714
712–708 ═ STRATEGISCHE VERTEIDIGUNG
704.34 ╔══════════════════╗
║ LETZTE FESTUNG ║
╚══════════════════╝
🟢 BULLENREVIER
99
·
--
722.47 ███████ GROẞE VERKAUFSWAND
721.84 ─────── High gerade geschlagen/abgeholt
721.11 ████ BUY
↓ Ablehnung
718.89 ● AKTUELL
│
716.77 █████ KAUFWAND
716.28 ████ KAUFWAND
714.82 ─────── Pivot
711.20 ───────
707.85 ★ LIQUIDITÄTS-SWEEP
722.47 ███████ GROẞE VERKAUFSWAND
721.84 ─────── High gerade geschlagen/abgeholt
721.11 ████ BUY
↓ Ablehnung
718.89 ● AKTUELL
│
716.77 █████ KAUFWAND
716.28 ████ KAUFWAND
714.82 ─────── Pivot
711.20 ───────
707.85 ★ LIQUIDITÄTS-SWEEP
721.84 ─────── High gerade geschlagen/abgeholt
721.11 ████ BUY
↓ Ablehnung
718.89 ● AKTUELL
│
716.77 █████ KAUFWAND
716.28 ████ KAUFWAND
714.82 ─────── Pivot
711.20 ───────
707.85 ★ LIQUIDITÄTS-SWEEP
19
·
--
$BNB Die aktive Verkaufsseite wird von der passiven Kaufkraft absorbiert.
In den jüngsten Daten gab es zeitweise einen ziemlich deutlichen Moment, in dem der Taker Sell stärker war als der Taker Buy. Trotzdem hielt der BNB-Preis sich weiterhin um 712–713, anstatt schnell zu fallen. Das bedeutet normalerweise, dass darunter große Limit-Käufer sitzen, die die gesamte Menge an Market-Sell auffangen.
Konkret gibt es 4 Hauptgründe:
Sell-Aufsaugung
Marktverkäufer verkaufen stark.
Doch jedes Mal, wenn sie nach unten drücken, wird das von Bids absorbiert.
Ergebnis: großes Verkaufsvolumen, aber geringe Preisverschiebung.
Das ist ein wichtigeres Signal als nur auf rote/grüne Kerzen zu schauen.
Spot verkauft nicht mehr einseitig Zuvor war Spot die Hauptquelle für Abwärtsdruck. In letzter Zeit gab es wieder Kauf-Impulse bei Spot, sodass Futures-Verkäufer Spot nicht mehr vollständig als „Mitspieler“ haben.
OI explodiert nicht in Richtung Short Wenn der Preis sich wirklich auf einen starken Rückgang vorbereitet, wäre das schönste Muster: Price↓ + OI↑ stark + Spot sell + Futures sell.
Aktuell ist der OI jedoch häufig flach/steigend oder die Ströme sind widersprüchlich. Das zeigt, dass ein Teil der Bewegung aus dem Schließen von Positionen/Absicherung (Hedging) besteht und noch nicht aus einer frischen, sehr starken Welle neuer Shorts.
Der Bereich 708–712 wurde mehrfach getestet, aber es gab noch keine Akzeptanz unterhalb Der Preis wurde auf 708.7–710 hinuntergestoßen und erholte sich dann wieder. Das heißt: Unterhalb ist weiterhin Nachfrage/Liquidität vorhanden, die absorbiert.
Wer als Seller wirklich einen echten Abwärtstrend erzeugen will, muss das tun, was ihm bisher nicht gelungen ist: eine Kerze tief schließen und nach dem Retest unter dem Support halten.
$BNB Die aktive Verkaufsseite wird von der passiven Kaufkraft absorbiert.
In den jüngsten Daten gab es zeitweise einen ziemlich deutlichen Moment, in dem der Taker Sell stärker war als der Taker Buy. Trotzdem hielt der BNB-Preis sich weiterhin um 712–713, anstatt schnell zu fallen. Das bedeutet normalerweise, dass darunter große Limit-Käufer sitzen, die die gesamte Menge an Market-Sell auffangen.
Konkret gibt es 4 Hauptgründe:
Sell-Aufsaugung
Marktverkäufer verkaufen stark.
Doch jedes Mal, wenn sie nach unten drücken, wird das von Bids absorbiert.
Ergebnis: großes Verkaufsvolumen, aber geringe Preisverschiebung.
Das ist ein wichtigeres Signal als nur auf rote/grüne Kerzen zu schauen.
Spot verkauft nicht mehr einseitig Zuvor war Spot die Hauptquelle für Abwärtsdruck. In letzter Zeit gab es wieder Kauf-Impulse bei Spot, sodass Futures-Verkäufer Spot nicht mehr vollständig als „Mitspieler“ haben.
OI explodiert nicht in Richtung Short Wenn der Preis sich wirklich auf einen starken Rückgang vorbereitet, wäre das schönste Muster: Price↓ + OI↑ stark + Spot sell + Futures sell.
Aktuell ist der OI jedoch häufig flach/steigend oder die Ströme sind widersprüchlich. Das zeigt, dass ein Teil der Bewegung aus dem Schließen von Positionen/Absicherung (Hedging) besteht und noch nicht aus einer frischen, sehr starken Welle neuer Shorts.
Der Bereich 708–712 wurde mehrfach getestet, aber es gab noch keine Akzeptanz unterhalb Der Preis wurde auf 708.7–710 hinuntergestoßen und erholte sich dann wieder. Das heißt: Unterhalb ist weiterhin Nachfrage/Liquidität vorhanden, die absorbiert.
Wer als Seller wirklich einen echten Abwärtstrend erzeugen will, muss das tun, was ihm bisher nicht gelungen ist: eine Kerze tief schließen und nach dem Retest unter dem Support halten.
In den jüngsten Daten gab es zeitweise einen ziemlich deutlichen Moment, in dem der Taker Sell stärker war als der Taker Buy. Trotzdem hielt der BNB-Preis sich weiterhin um 712–713, anstatt schnell zu fallen. Das bedeutet normalerweise, dass darunter große Limit-Käufer sitzen, die die gesamte Menge an Market-Sell auffangen.
Konkret gibt es 4 Hauptgründe:
Sell-Aufsaugung
Marktverkäufer verkaufen stark.
Doch jedes Mal, wenn sie nach unten drücken, wird das von Bids absorbiert.
Ergebnis: großes Verkaufsvolumen, aber geringe Preisverschiebung.
Das ist ein wichtigeres Signal als nur auf rote/grüne Kerzen zu schauen.
Spot verkauft nicht mehr einseitig Zuvor war Spot die Hauptquelle für Abwärtsdruck. In letzter Zeit gab es wieder Kauf-Impulse bei Spot, sodass Futures-Verkäufer Spot nicht mehr vollständig als „Mitspieler“ haben.
OI explodiert nicht in Richtung Short Wenn der Preis sich wirklich auf einen starken Rückgang vorbereitet, wäre das schönste Muster: Price↓ + OI↑ stark + Spot sell + Futures sell.
Aktuell ist der OI jedoch häufig flach/steigend oder die Ströme sind widersprüchlich. Das zeigt, dass ein Teil der Bewegung aus dem Schließen von Positionen/Absicherung (Hedging) besteht und noch nicht aus einer frischen, sehr starken Welle neuer Shorts.
Der Bereich 708–712 wurde mehrfach getestet, aber es gab noch keine Akzeptanz unterhalb Der Preis wurde auf 708.7–710 hinuntergestoßen und erholte sich dann wieder. Das heißt: Unterhalb ist weiterhin Nachfrage/Liquidität vorhanden, die absorbiert.
Wer als Seller wirklich einen echten Abwärtstrend erzeugen will, muss das tun, was ihm bisher nicht gelungen ist: eine Kerze tief schließen und nach dem Retest unter dem Support halten.
1
64
·
--
Mit „Hai-Fischen“ bevorzuge ich diese Reihenfolge
1. Price
Wirklich, wohin geht es?
2. Spot flow
Geht das echte Geld in die gleiche Richtung?
3. Futures taker
Welcher Hebel greift an?
4. OI
Gibt es eine neue Position oder werden nur Positionen geschlossen?
5. BTC
Unterstützt das Market regime?
Ein perfekter Long ist nicht nur:
Futures BUY.
Sondern muss sein:
Price↑ + Spot BUY + Futures BUY + OI↑ + BTC bestätigt
Ein perfekter Short:
Price↓ + Spot SELL + Futures SELL + OI↑ + BTC bestätigt
Wenn Spot und Futures gegeneinander kämpfen, ist das meistens eine Zone aus Absorption / Trap / Phasenwechsel – genau dort muss der „Hai-Fischer“ hinschauen, nicht vorschnell in Trades gehen.
Aktuell zeigt BNB Anzeichen einer Spot-geführten Erholung, aber reicht noch nicht, um Long zu wechseln, da das OI sinkt und 4H weiterhin bearish ist. Die nächsten 15m: Wenn Spot weiter Buy macht, Futures von Sell auf Buy wechseln, OI wieder ansteigt und der Schlusskurs über 714.24 liegt, dann ändert sich die Geschichte deutlich.
Mit „Hai-Fischen“ bevorzuge ich diese Reihenfolge
1. Price
Wirklich, wohin geht es?
2. Spot flow
Geht das echte Geld in die gleiche Richtung?
3. Futures taker
Welcher Hebel greift an?
4. OI
Gibt es eine neue Position oder werden nur Positionen geschlossen?
5. BTC
Unterstützt das Market regime?
Ein perfekter Long ist nicht nur:
Futures BUY.
Sondern muss sein:
Price↑ + Spot BUY + Futures BUY + OI↑ + BTC bestätigt
Ein perfekter Short:
Price↓ + Spot SELL + Futures SELL + OI↑ + BTC bestätigt
Wenn Spot und Futures gegeneinander kämpfen, ist das meistens eine Zone aus Absorption / Trap / Phasenwechsel – genau dort muss der „Hai-Fischer“ hinschauen, nicht vorschnell in Trades gehen.
Aktuell zeigt BNB Anzeichen einer Spot-geführten Erholung, aber reicht noch nicht, um Long zu wechseln, da das OI sinkt und 4H weiterhin bearish ist. Die nächsten 15m: Wenn Spot weiter Buy macht, Futures von Sell auf Buy wechseln, OI wieder ansteigt und der Schlusskurs über 714.24 liegt, dann ändert sich die Geschichte deutlich.
1. Price
Wirklich, wohin geht es?
2. Spot flow
Geht das echte Geld in die gleiche Richtung?
3. Futures taker
Welcher Hebel greift an?
4. OI
Gibt es eine neue Position oder werden nur Positionen geschlossen?
5. BTC
Unterstützt das Market regime?
Ein perfekter Long ist nicht nur:
Futures BUY.
Sondern muss sein:
Price↑ + Spot BUY + Futures BUY + OI↑ + BTC bestätigt
Ein perfekter Short:
Price↓ + Spot SELL + Futures SELL + OI↑ + BTC bestätigt
Wenn Spot und Futures gegeneinander kämpfen, ist das meistens eine Zone aus Absorption / Trap / Phasenwechsel – genau dort muss der „Hai-Fischer“ hinschauen, nicht vorschnell in Trades gehen.
Aktuell zeigt BNB Anzeichen einer Spot-geführten Erholung, aber reicht noch nicht, um Long zu wechseln, da das OI sinkt und 4H weiterhin bearish ist. Die nächsten 15m: Wenn Spot weiter Buy macht, Futures von Sell auf Buy wechseln, OI wieder ansteigt und der Schlusskurs über 714.24 liegt, dann ändert sich die Geschichte deutlich.
208
·
--
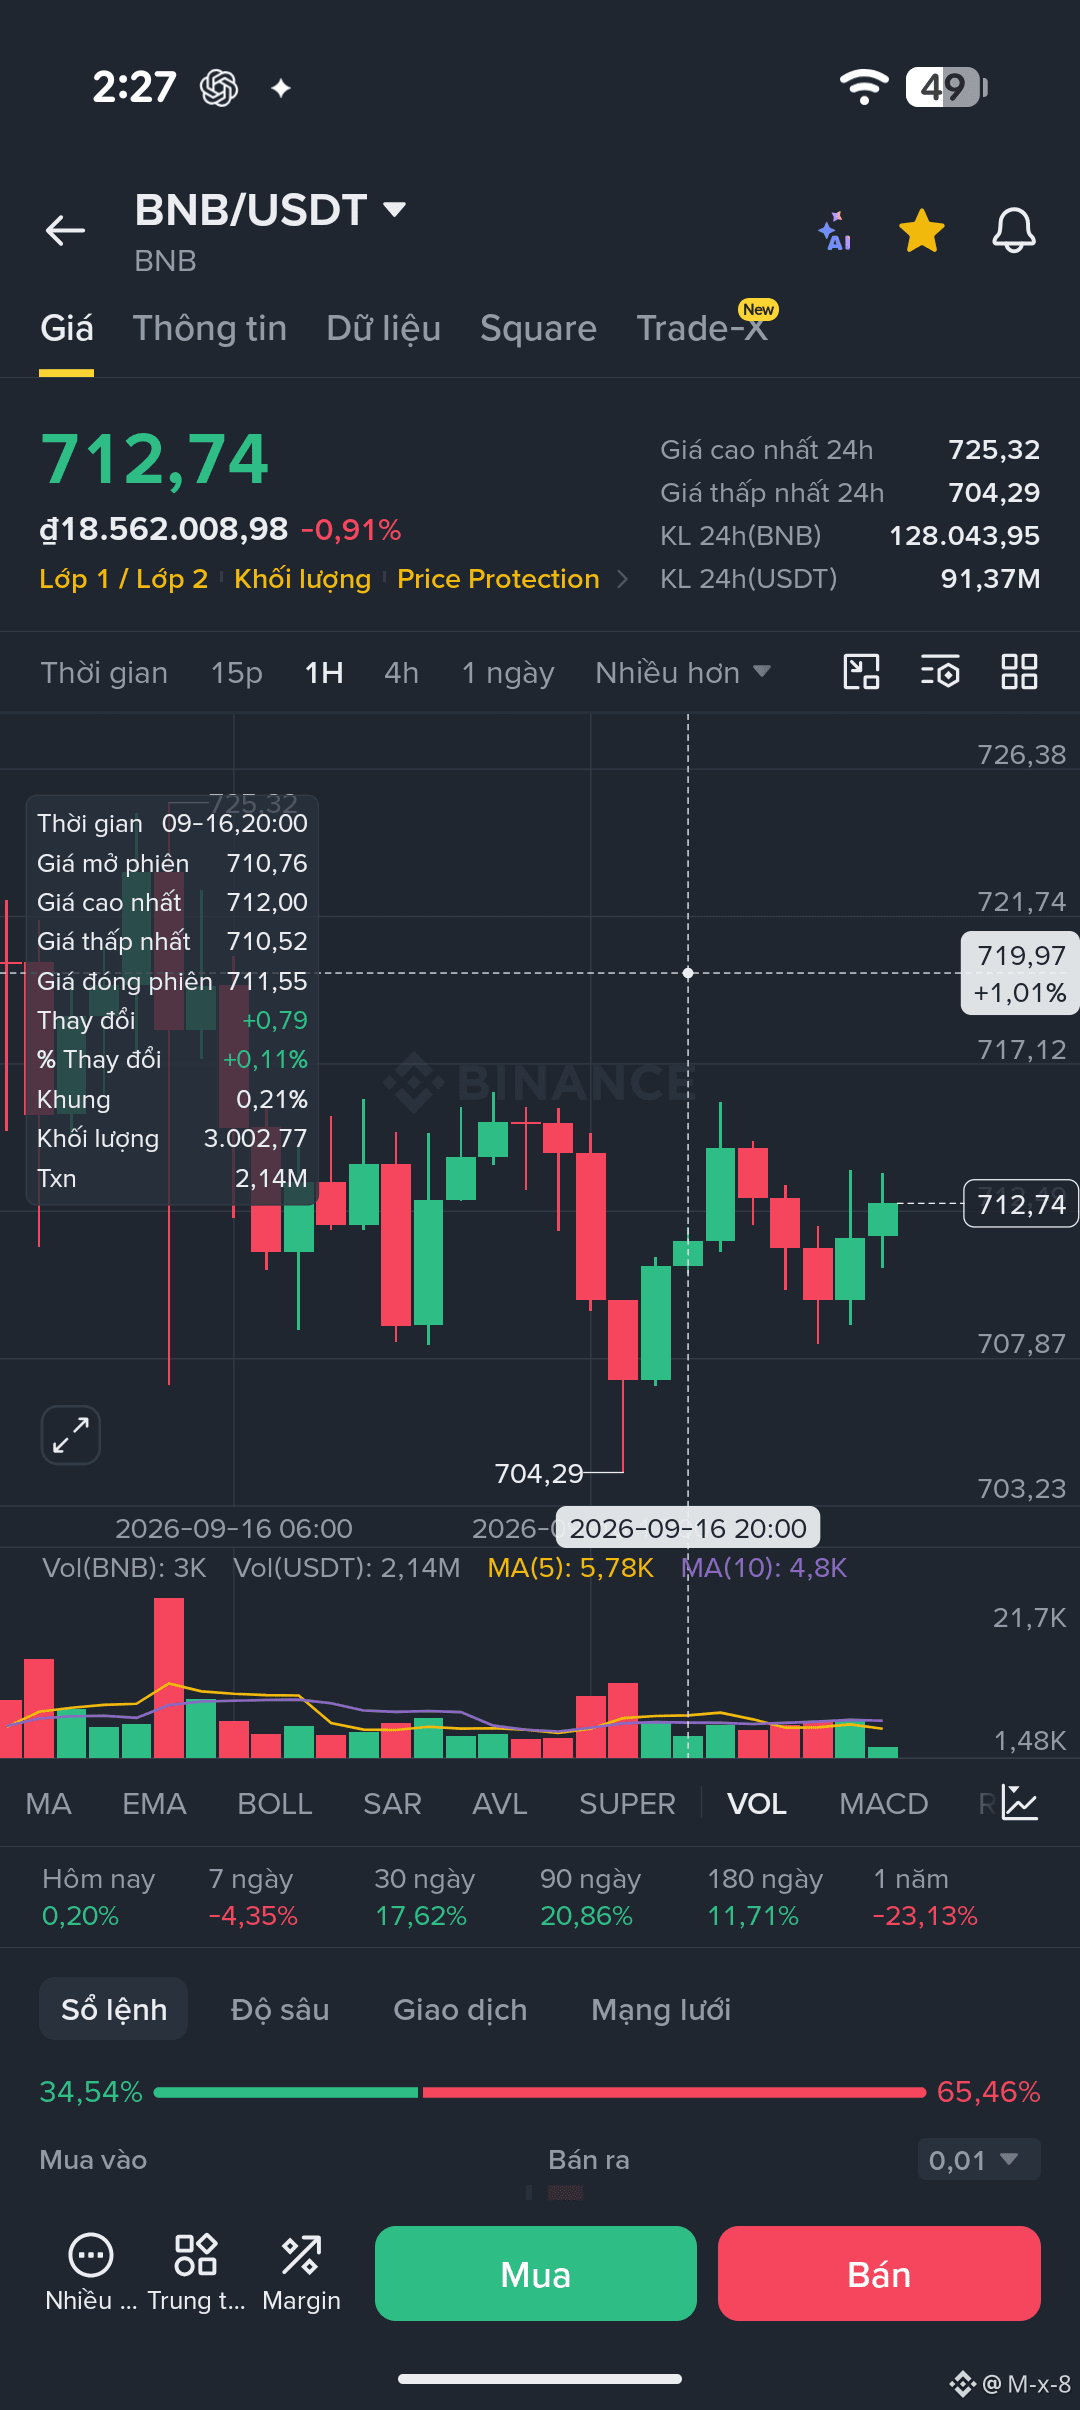
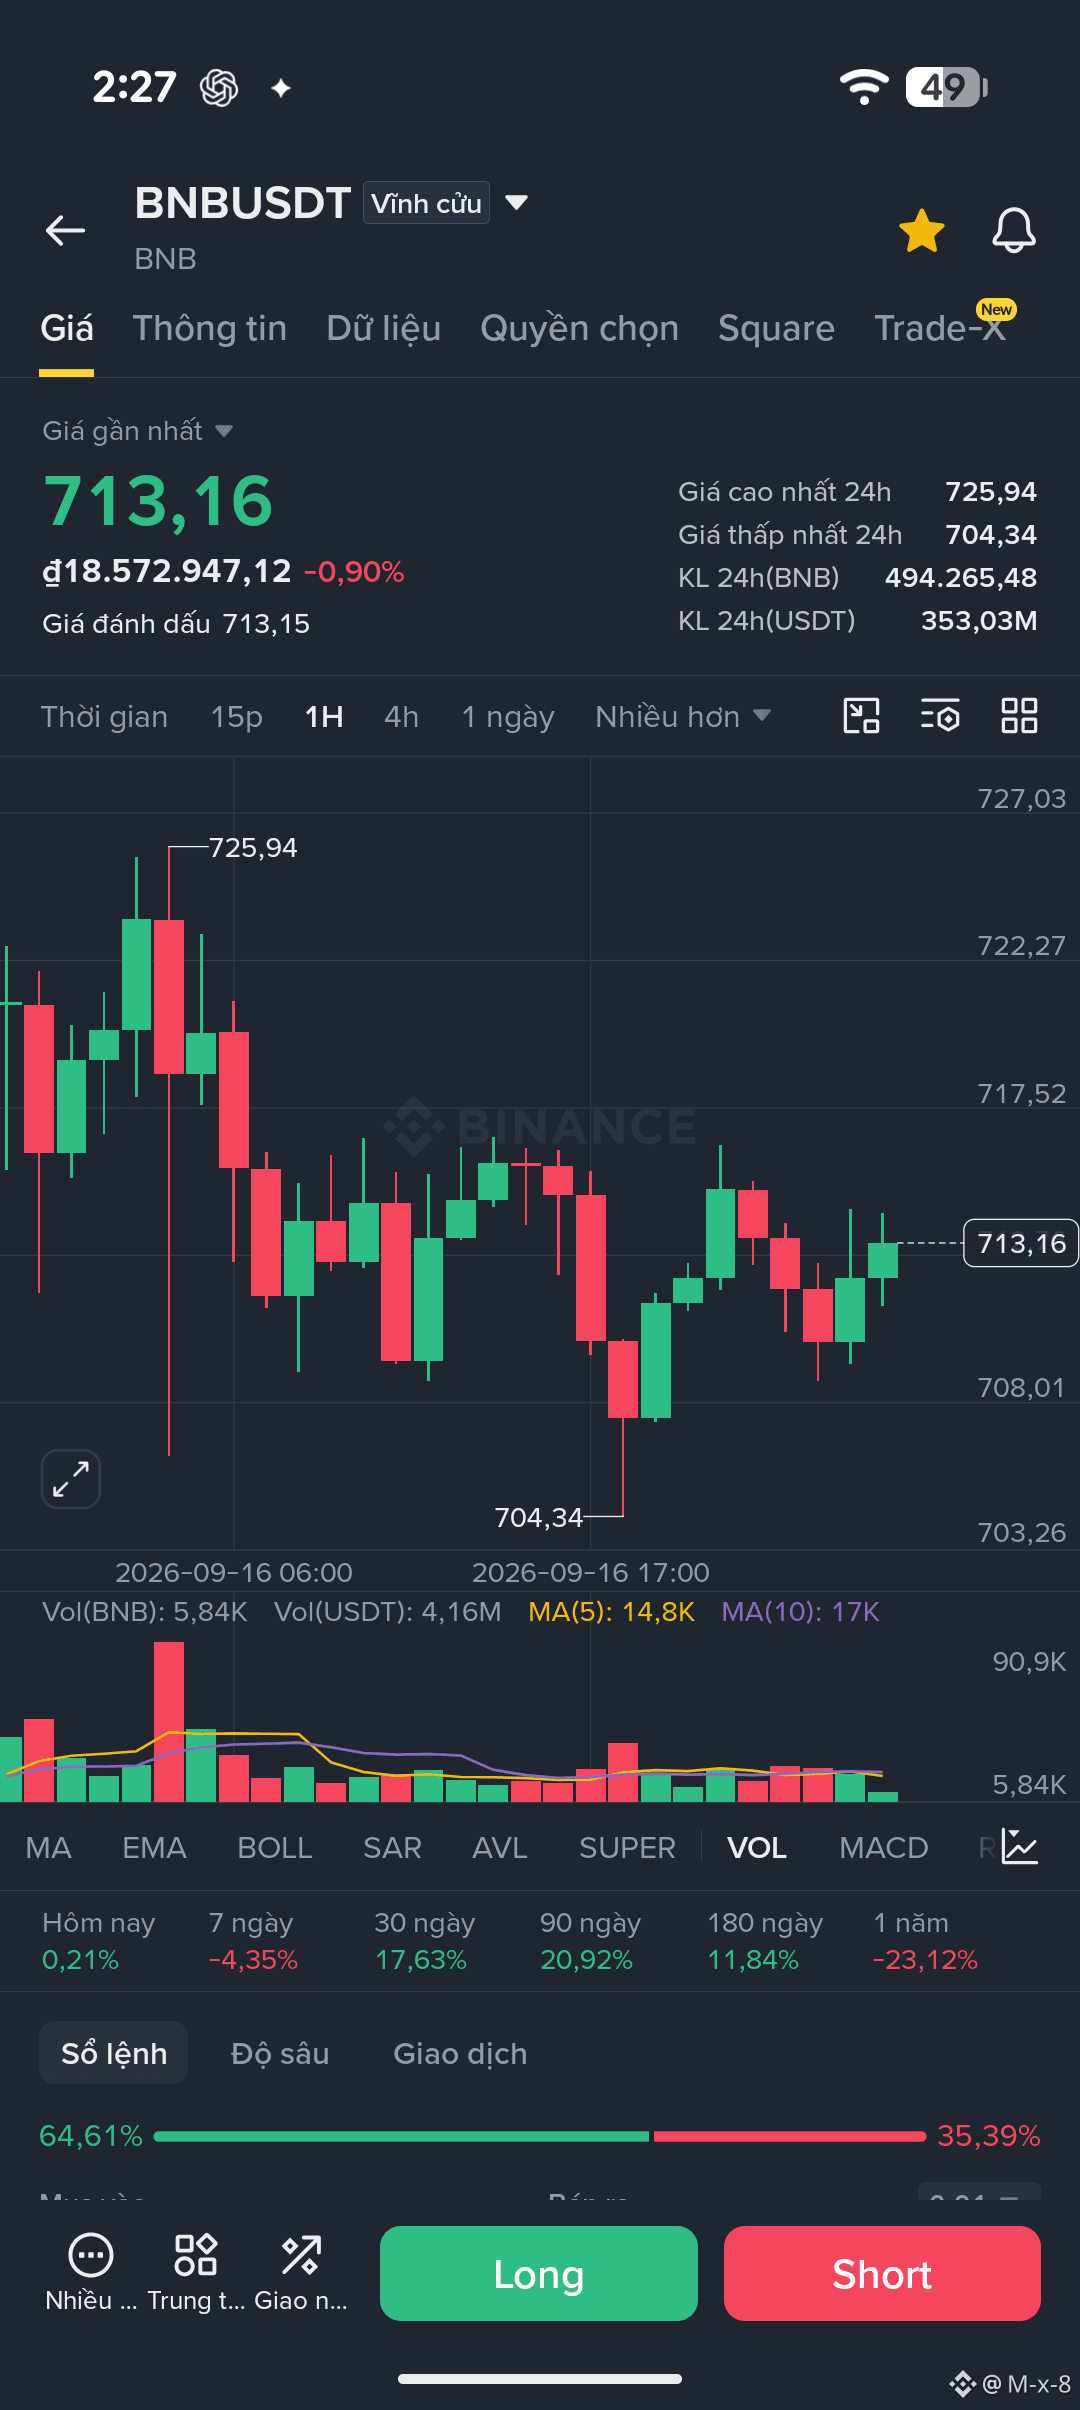
$BNB Mda ist der wichtigste Meilenstein im Moment: 714.24
Ablehnung unter 714.24 → bearishes Setup schöner.
Rückeroberung von 714.24 und dann 715.17 → Short-Thesis schwächer.
Über 716.6 mit Close + OI/Spot-Bestätigung → Wechsel in ein Recovery-Regime.
Die wertvollste Zone beim Cutoff um 02:00 ist: BTC 4H hat Price↓ + OI↑ stark, bei BNB 4H gibt es zwar aggressive Käufer, aber der Preis fällt — das ist eher ein bärisches Footprint als ein sauberer Long-Breakout.
$BNB Mda ist der wichtigste Meilenstein im Moment: 714.24
Ablehnung unter 714.24 → bearishes Setup schöner.
Rückeroberung von 714.24 und dann 715.17 → Short-Thesis schwächer.
Über 716.6 mit Close + OI/Spot-Bestätigung → Wechsel in ein Recovery-Regime.
Die wertvollste Zone beim Cutoff um 02:00 ist: BTC 4H hat Price↓ + OI↑ stark, bei BNB 4H gibt es zwar aggressive Käufer, aber der Preis fällt — das ist eher ein bärisches Footprint als ein sauberer Long-Breakout.
Ablehnung unter 714.24 → bearishes Setup schöner.
Rückeroberung von 714.24 und dann 715.17 → Short-Thesis schwächer.
Über 716.6 mit Close + OI/Spot-Bestätigung → Wechsel in ein Recovery-Regime.
Die wertvollste Zone beim Cutoff um 02:00 ist: BTC 4H hat Price↓ + OI↑ stark, bei BNB 4H gibt es zwar aggressive Käufer, aber der Preis fällt — das ist eher ein bärisches Footprint als ein sauberer Long-Breakout.
22
·
--
$BNB BTC 4H 🔴 STARK BÄRISCH
BNB 4H 🔴 BÄRISCH / LANGE ABSORPTION
BNB 1H 🟠 ERHOLUNG, aber unter EMA13/26
BNB 15m 🟠 KAUF-FLOW wird absorbiert
SPOT 1H 🔴 VERKAUF-DOMINANT
POSITIONIERUNG 🔴 LONG-SCHWER
TREND-ENGINE WARTEN
TAKTISCH SHORT-RETEST BEOBACHTEN
$BNB BTC 4H 🔴 STARK BÄRISCH
BNB 4H 🔴 BÄRISCH / LANGE ABSORPTION
BNB 1H 🟠 ERHOLUNG, aber unter EMA13/26
BNB 15m 🟠 KAUF-FLOW wird absorbiert
SPOT 1H 🔴 VERKAUF-DOMINANT
POSITIONIERUNG 🔴 LONG-SCHWER
TREND-ENGINE WARTEN
TAKTISCH SHORT-RETEST BEOBACHTEN
BNB 4H 🔴 BÄRISCH / LANGE ABSORPTION
BNB 1H 🟠 ERHOLUNG, aber unter EMA13/26
BNB 15m 🟠 KAUF-FLOW wird absorbiert
SPOT 1H 🔴 VERKAUF-DOMINANT
POSITIONIERUNG 🔴 LONG-SCHWER
TREND-ENGINE WARTEN
TAKTISCH SHORT-RETEST BEOBACHTEN
161
·
--
🦈 FISCHE JAGEN – GELDSTRÖME LESEN, NICHT DEM PREIS NACHJAGEN
Der Kryptomarkt wird nicht nur von Indikatoren bewegt. Hinter jedem Pump, Dump oder Breakout stehen Geldströme, Liquidität und die Positionierung der großen Akteure.
Săn Cá Mập ist ein Analyse-System für BTC, BNB und den Futures-Markt basierend auf:
• Open Interest & Funding Rate
• Taker Buy/Sell Volume
• Long/Short-Positionierung
• Supply – Demand & Liquidität
• Multi-Timeframe-Analyse 4H → 1H → 15m
Ziel ist nicht, den Preis vorherzusagen.
Ziel ist, zu beantworten:
🐋 Jagen Wale Liquidität, akkumulieren sie, verteilen sie oder jagen sie Liquidität?
Daraus trifft das System 3 klare Entscheidungen:
🟢 LONG
🔴 SHORT
⚪ WAIT
Dem Geldstrom folgen. Auf Bestätigung warten. Risiko managen.
#SanCaMap #Binance #BNB #BTC #CryptoTrading #WhaleTracking #OrderFlow
🦈 FISCHE JAGEN – GELDSTRÖME LESEN, NICHT DEM PREIS NACHJAGEN
Der Kryptomarkt wird nicht nur von Indikatoren bewegt. Hinter jedem Pump, Dump oder Breakout stehen Geldströme, Liquidität und die Positionierung der großen Akteure.
Săn Cá Mập ist ein Analyse-System für BTC, BNB und den Futures-Markt basierend auf:
• Open Interest & Funding Rate
• Taker Buy/Sell Volume
• Long/Short-Positionierung
• Supply – Demand & Liquidität
• Multi-Timeframe-Analyse 4H → 1H → 15m
Ziel ist nicht, den Preis vorherzusagen.
Ziel ist, zu beantworten:
🐋 Jagen Wale Liquidität, akkumulieren sie, verteilen sie oder jagen sie Liquidität?
Daraus trifft das System 3 klare Entscheidungen:
🟢 LONG
🔴 SHORT
⚪ WAIT
Dem Geldstrom folgen. Auf Bestätigung warten. Risiko managen.
#SanCaMap #Binance #BNB #BTC #CryptoTrading #WhaleTracking #OrderFlow
Der Kryptomarkt wird nicht nur von Indikatoren bewegt. Hinter jedem Pump, Dump oder Breakout stehen Geldströme, Liquidität und die Positionierung der großen Akteure.
Săn Cá Mập ist ein Analyse-System für BTC, BNB und den Futures-Markt basierend auf:
• Open Interest & Funding Rate
• Taker Buy/Sell Volume
• Long/Short-Positionierung
• Supply – Demand & Liquidität
• Multi-Timeframe-Analyse 4H → 1H → 15m
Ziel ist nicht, den Preis vorherzusagen.
Ziel ist, zu beantworten:
🐋 Jagen Wale Liquidität, akkumulieren sie, verteilen sie oder jagen sie Liquidität?
Daraus trifft das System 3 klare Entscheidungen:
🟢 LONG
🔴 SHORT
⚪ WAIT
Dem Geldstrom folgen. Auf Bestätigung warten. Risiko managen.
#SanCaMap #Binance #BNB #BTC #CryptoTrading #WhaleTracking #OrderFlow
219
·
--
Phố Wall verwendet Tierbilder, weil es komplexes Marktverhalten in ein intuitives, leicht merkbares Bild verwandelt.
🐂 Bull – Stierbock = steigender Markt: Stiere stoßen oft von unten nach oben mit den Hörnern → steht für steigende Kurse, optimistische Stimmung, Kauf.
🐻 Bear – Bär = fallender Markt: Bären schwingen oft die Pranken von oben nach unten → steht für fallende Kurse, pessimistische Stimmung, Verkauf.
🐋 Whale – Wal = Investor mit großem Kapital: nur Organisationen/Einzelpersonen mit genügend Einfluss, um Liquidität und Kurse spürbar zu beeinflussen.
🐑 Sheep – Schaf = die Masse: meist ein Hinweis darauf, dass Anleger dem Trend hinterherlaufen, FOMO.
🐖 Pig – Schwein = übermäßige Gier: das Wall-Street-Sprichwort „Bulls make money, bears make money, pigs get slaughtered“ beschreibt Gier, das zu lange Halten einer Position oder die Verwendung von zu großen Risiken.
Wichtigste Punkte: Bull und Bear sind nicht nur Deko-Symbole. Sie spiegeln zwei grundlegende Kräfte des Marktes wider:
Demand > Supply → 🐂 Bullish → Price ↑
Supply > Demand → 🐻 Bearish → Price ↓
Phố Wall verwendet Tierbilder, weil es komplexes Marktverhalten in ein intuitives, leicht merkbares Bild verwandelt.
🐂 Bull – Stierbock = steigender Markt: Stiere stoßen oft von unten nach oben mit den Hörnern → steht für steigende Kurse, optimistische Stimmung, Kauf.
🐻 Bear – Bär = fallender Markt: Bären schwingen oft die Pranken von oben nach unten → steht für fallende Kurse, pessimistische Stimmung, Verkauf.
🐋 Whale – Wal = Investor mit großem Kapital: nur Organisationen/Einzelpersonen mit genügend Einfluss, um Liquidität und Kurse spürbar zu beeinflussen.
🐑 Sheep – Schaf = die Masse: meist ein Hinweis darauf, dass Anleger dem Trend hinterherlaufen, FOMO.
🐖 Pig – Schwein = übermäßige Gier: das Wall-Street-Sprichwort „Bulls make money, bears make money, pigs get slaughtered“ beschreibt Gier, das zu lange Halten einer Position oder die Verwendung von zu großen Risiken.
Wichtigste Punkte: Bull und Bear sind nicht nur Deko-Symbole. Sie spiegeln zwei grundlegende Kräfte des Marktes wider:
Demand > Supply → 🐂 Bullish → Price ↑
Supply > Demand → 🐻 Bearish → Price ↓
🐂 Bull – Stierbock = steigender Markt: Stiere stoßen oft von unten nach oben mit den Hörnern → steht für steigende Kurse, optimistische Stimmung, Kauf.
🐻 Bear – Bär = fallender Markt: Bären schwingen oft die Pranken von oben nach unten → steht für fallende Kurse, pessimistische Stimmung, Verkauf.
🐋 Whale – Wal = Investor mit großem Kapital: nur Organisationen/Einzelpersonen mit genügend Einfluss, um Liquidität und Kurse spürbar zu beeinflussen.
🐑 Sheep – Schaf = die Masse: meist ein Hinweis darauf, dass Anleger dem Trend hinterherlaufen, FOMO.
🐖 Pig – Schwein = übermäßige Gier: das Wall-Street-Sprichwort „Bulls make money, bears make money, pigs get slaughtered“ beschreibt Gier, das zu lange Halten einer Position oder die Verwendung von zu großen Risiken.
Wichtigste Punkte: Bull und Bear sind nicht nur Deko-Symbole. Sie spiegeln zwei grundlegende Kräfte des Marktes wider:
Demand > Supply → 🐂 Bullish → Price ↑
Supply > Demand → 🐻 Bearish → Price ↓

13
·
--
Hallo, Binance befindet sich derzeit bei etwa BTC 75.646 und BNB 710,69. Besonders auffällig ist, dass BNB genau in der Trigger-Zone liegt, die wir verfolgen: 710,28–710,02.
Wenn die FED die Zinsen unerwartet anhebt / hawkish als erwartet
ist der übliche Mechanismus:
Zinsen ↑ → USD/Rendite ↑ → Risk Appetite ↓ → BTC-Druck ↓ → Altcoins/BNB reagieren meist sensibler
Beim „Haijagd“-Setup werde ich nicht sofort short gehen, sobald die Schlagzeile erscheint. Ich möchte diese Sequenz sehen:
FED-Hike → BTC-Preis↓ + OI↑ + Taker-Sell → BNB 15m Close <710.28 → Spot <710.02 → Retest 710–711 scheitert.
Wenn diese Kette komplett ist, wird der neue Status aktualisiert auf:
DOWNSIDE EXPANSION CONFIRMED
Die darunterliegenden Zonen sind bereits vorhanden:
709,56 → 707,38 → 706,30 → 704,34 → 703,00
Wenn BNB unter 704,34 mit einer 1H-Kerze schließt und dabei eine „volume expansion“ zeigt, dann erst nähere ich mich der Short-Bedingung des Trend-Following-Engines.
Doch der gefährlichste Fall ist: „Hike wurde bereits eingepreist“
Die FED kann zwar erhöhen, aber Krypto kann innerhalb von Minuten abverkaufen und dann wieder nach oben drehen, wenn der Markt das zuvor bereits reflektiert hat oder Powell eine weichere Guidance als erwartet gibt.
Ein typischer Bear-Trap wäre:
bei 710 auslösen → 707/704 abräumen → OI fällt stark → Spot wird absorbiert → Close zurück >710–712 → Reclaim 713,25/714,2
Dann gilt: Unter keinen Umständen weiter short anhand der Schlagzeile.
Hallo, Binance befindet sich derzeit bei etwa BTC 75.646 und BNB 710,69. Besonders auffällig ist, dass BNB genau in der Trigger-Zone liegt, die wir verfolgen: 710,28–710,02.
Wenn die FED die Zinsen unerwartet anhebt / hawkish als erwartet
ist der übliche Mechanismus:
Zinsen ↑ → USD/Rendite ↑ → Risk Appetite ↓ → BTC-Druck ↓ → Altcoins/BNB reagieren meist sensibler
Beim „Haijagd“-Setup werde ich nicht sofort short gehen, sobald die Schlagzeile erscheint. Ich möchte diese Sequenz sehen:
FED-Hike → BTC-Preis↓ + OI↑ + Taker-Sell → BNB 15m Close <710.28 → Spot <710.02 → Retest 710–711 scheitert.
Wenn diese Kette komplett ist, wird der neue Status aktualisiert auf:
DOWNSIDE EXPANSION CONFIRMED
Die darunterliegenden Zonen sind bereits vorhanden:
709,56 → 707,38 → 706,30 → 704,34 → 703,00
Wenn BNB unter 704,34 mit einer 1H-Kerze schließt und dabei eine „volume expansion“ zeigt, dann erst nähere ich mich der Short-Bedingung des Trend-Following-Engines.
Doch der gefährlichste Fall ist: „Hike wurde bereits eingepreist“
Die FED kann zwar erhöhen, aber Krypto kann innerhalb von Minuten abverkaufen und dann wieder nach oben drehen, wenn der Markt das zuvor bereits reflektiert hat oder Powell eine weichere Guidance als erwartet gibt.
Ein typischer Bear-Trap wäre:
bei 710 auslösen → 707/704 abräumen → OI fällt stark → Spot wird absorbiert → Close zurück >710–712 → Reclaim 713,25/714,2
Dann gilt: Unter keinen Umständen weiter short anhand der Schlagzeile.
Wenn die FED die Zinsen unerwartet anhebt / hawkish als erwartet
ist der übliche Mechanismus:
Zinsen ↑ → USD/Rendite ↑ → Risk Appetite ↓ → BTC-Druck ↓ → Altcoins/BNB reagieren meist sensibler
Beim „Haijagd“-Setup werde ich nicht sofort short gehen, sobald die Schlagzeile erscheint. Ich möchte diese Sequenz sehen:
FED-Hike → BTC-Preis↓ + OI↑ + Taker-Sell → BNB 15m Close <710.28 → Spot <710.02 → Retest 710–711 scheitert.
Wenn diese Kette komplett ist, wird der neue Status aktualisiert auf:
DOWNSIDE EXPANSION CONFIRMED
Die darunterliegenden Zonen sind bereits vorhanden:
709,56 → 707,38 → 706,30 → 704,34 → 703,00
Wenn BNB unter 704,34 mit einer 1H-Kerze schließt und dabei eine „volume expansion“ zeigt, dann erst nähere ich mich der Short-Bedingung des Trend-Following-Engines.
Doch der gefährlichste Fall ist: „Hike wurde bereits eingepreist“
Die FED kann zwar erhöhen, aber Krypto kann innerhalb von Minuten abverkaufen und dann wieder nach oben drehen, wenn der Markt das zuvor bereits reflektiert hat oder Powell eine weichere Guidance als erwartet gibt.
Ein typischer Bear-Trap wäre:
bei 710 auslösen → 707/704 abräumen → OI fällt stark → Spot wird absorbiert → Close zurück >710–712 → Reclaim 713,25/714,2
Dann gilt: Unter keinen Umständen weiter short anhand der Schlagzeile.
133
·
--
Die wichtigste Regel
Nicht in die Breakout-Kerze hinein.
Warten auf:
Close → Retest → Reject/Hold → Entry
Diese Methode hilft, die meisten Stop-Hunts zu vermeiden.
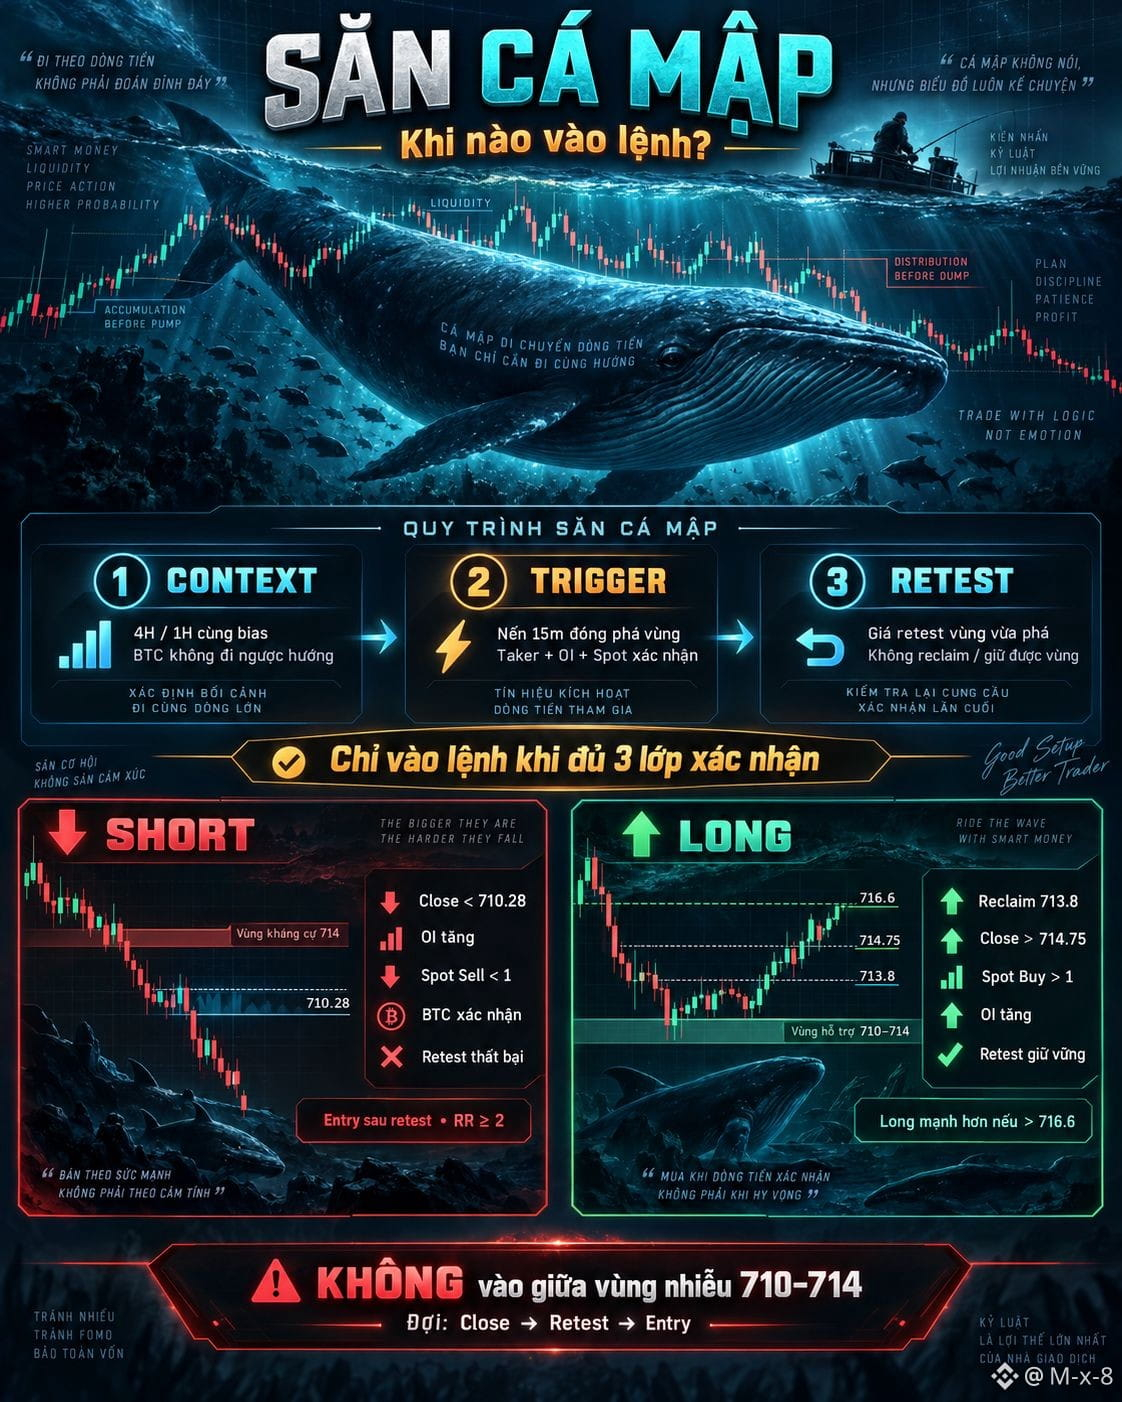
Ich werde es zu einer sehr kurzen Regel für „Săn Cá Mập“ verpacken:
SHORT = Break + Close + OI↑ + Spot Sell + BTC bestätigen + Failed Retest + RR≥2
LONG = Reclaim + Close + OI↑ + Spot Buy + BTC bestätigen + Successful Retest + RR≥2
Wenn eine der wichtigen Komponenten fehlt, ist der Status WAIT.
Die wichtigste Regel
Nicht in die Breakout-Kerze hinein.
Warten auf:
Close → Retest → Reject/Hold → Entry
Diese Methode hilft, die meisten Stop-Hunts zu vermeiden.
Ich werde es zu einer sehr kurzen Regel für „Săn Cá Mập“ verpacken:
SHORT = Break + Close + OI↑ + Spot Sell + BTC bestätigen + Failed Retest + RR≥2
LONG = Reclaim + Close + OI↑ + Spot Buy + BTC bestätigen + Successful Retest + RR≥2
Wenn eine der wichtigen Komponenten fehlt, ist der Status WAIT.
Nicht in die Breakout-Kerze hinein.
Warten auf:
Close → Retest → Reject/Hold → Entry
Diese Methode hilft, die meisten Stop-Hunts zu vermeiden.
Ich werde es zu einer sehr kurzen Regel für „Săn Cá Mập“ verpacken:
SHORT = Break + Close + OI↑ + Spot Sell + BTC bestätigen + Failed Retest + RR≥2
LONG = Reclaim + Close + OI↑ + Spot Buy + BTC bestätigen + Successful Retest + RR≥2
Wenn eine der wichtigen Komponenten fehlt, ist der Status WAIT.
33
·
--
$BNB 716.59 █████ große ungültigkeit
716.31 ███ Ablehnung hoch
715.17 ███ 45m hoch
714.7–715.2 ██ Supply/Retest
──────────────
713.48 ● 45m close
713.0 ── support
712.45 ★ 45m low
712.08 Spot low
711.64 ★ struktureller support
710.98
709.56
707.38
704.34 ★ Engine Low20
$BNB 716.59 █████ große ungültigkeit
716.31 ███ Ablehnung hoch
715.17 ███ 45m hoch
714.7–715.2 ██ Supply/Retest
──────────────
713.48 ● 45m close
713.0 ── support
712.45 ★ 45m low
712.08 Spot low
711.64 ★ struktureller support
710.98
709.56
707.38
704.34 ★ Engine Low20
716.31 ███ Ablehnung hoch
715.17 ███ 45m hoch
714.7–715.2 ██ Supply/Retest
──────────────
713.48 ● 45m close
713.0 ── support
712.45 ★ 45m low
712.08 Spot low
711.64 ★ struktureller support
710.98
709.56
707.38
704.34 ★ Engine Low20
68
·
--
$BTC $BNB Eins. Beide befinden sich auf einem längeren Trend nach oben, unter kurzzeitigem Momentum — Anpassung, aber noch keine Trendwende, betrachtet anhand der MA.
Zwei. BTC ist im größeren Chart das schwächere Symbol: Beide Candles haben LH+LL, sind gerade unter das Tief des letzten Tages durchgebrochen, und es gibt keine Unterstützung bis zu −15%. BNB hingegen hat am Tag weiterhin HH+HL und besitzt eine Unterstützung von 9,7% direkt unter 2,1%.
Drei, und das ist der strukturell auffälligste Punkt: Die beiden Codes haben entgegengesetzte Volumen-„Heatmaps“. BTC ist unten leer, oben dicht. BNB ist unten dicht, oben leer. Mit Beta 0,70 und einer Korrelation von ca. 0,72, die gestern gemessen wurde: Wenn BTC den Bereich 63–64k ansteuert, wird BNB kaum stillstehen können — aber der Weg von BNB wird vor der Unterstützung 699 auf die Wand treffen.
$BTC $BNB Eins. Beide befinden sich auf einem längeren Trend nach oben, unter kurzzeitigem Momentum — Anpassung, aber noch keine Trendwende, betrachtet anhand der MA.
Zwei. BTC ist im größeren Chart das schwächere Symbol: Beide Candles haben LH+LL, sind gerade unter das Tief des letzten Tages durchgebrochen, und es gibt keine Unterstützung bis zu −15%. BNB hingegen hat am Tag weiterhin HH+HL und besitzt eine Unterstützung von 9,7% direkt unter 2,1%.
Drei, und das ist der strukturell auffälligste Punkt: Die beiden Codes haben entgegengesetzte Volumen-„Heatmaps“. BTC ist unten leer, oben dicht. BNB ist unten dicht, oben leer. Mit Beta 0,70 und einer Korrelation von ca. 0,72, die gestern gemessen wurde: Wenn BTC den Bereich 63–64k ansteuert, wird BNB kaum stillstehen können — aber der Weg von BNB wird vor der Unterstützung 699 auf die Wand treffen.
Zwei. BTC ist im größeren Chart das schwächere Symbol: Beide Candles haben LH+LL, sind gerade unter das Tief des letzten Tages durchgebrochen, und es gibt keine Unterstützung bis zu −15%. BNB hingegen hat am Tag weiterhin HH+HL und besitzt eine Unterstützung von 9,7% direkt unter 2,1%.
Drei, und das ist der strukturell auffälligste Punkt: Die beiden Codes haben entgegengesetzte Volumen-„Heatmaps“. BTC ist unten leer, oben dicht. BNB ist unten dicht, oben leer. Mit Beta 0,70 und einer Korrelation von ca. 0,72, die gestern gemessen wurde: Wenn BTC den Bereich 63–64k ansteuert, wird BNB kaum stillstehen können — aber der Weg von BNB wird vor der Unterstützung 699 auf die Wand treffen.
154
Anmelden und weiter Inhalte entdecken
Krypto-Nutzer weltweit auf Binance Square kennenlernen
⚡️ Bleib in Sachen Krypto stets am Puls.
💬 Die weltgrößte Kryptobörse vertraut darauf.
👍 Erhalte verlässliche Einblicke von verifizierten Creators.
E-Mail-Adresse/Telefonnummer
Trendthemen
EtherGains70.9%InQ3
143,184 Aufrufe
1,120 Kommentare
🧭🧭🧭 Analyse 🧭🧭🧭
💡 Indikator für die Saison von Altcoins 💡
🚨🚨🚨 Das dritte Quartal (T3) ist nun abgeschlossen. ETH ist um 71% gestiegen und BTC um 43%. 🚨🚨🚨
War das der Beginn der Altcoin-Saison?
Unter den besten 100:
🌐🌐🌐 57 haben BTC in 90 Tagen outperformt
Die Altcoin-Saison beginnt bei 75, also ist es
Außerdem liegt sie nur 10 Punkte unter ihrem jährlichen Hoch bei 67 🌐🌐
💥💥💥 Aber Moment… vor einem Monat lag der Index erst bei 23!
Kann Oktober ihn auf 75 pushen? 👀💥💥💥
Bitte bleiben Sie dran
#EtherGains70.9%InQ3
$GRAM
Shamika Metting
·3 Likes
·1.1k Aufrufe
TreasuryLetsStatesFileStablecoinCertificationsEarly
7,586 Aufrufe
78 Kommentare
US10YearYieldNears5.3%
146,431 Aufrufe
1,117 Kommentare