
crypto Alpha 123
11 Beiträge
crypto Alpha 123
Melden
Nutzer blockieren
Trade eröffnen
Gelegenheitstrader
3.2 Jahre
1 Following
0 Follower
1 Like gegeben
Beiträge
Portfolio
###XAUTUSTD – Tether Gold-Preischart 🥇
Veranschaulichende Marktniveaus
Technischer Ausblick
* $4,000 – Zu beobachtende Unterstützung
* $4,050 – Referenzpreis
* $4,125 – Zu beobachtender Widerstand
* $4,300 – Höheres Aufwärtspotenzial
Dies sind veranschaulichende Niveaus, keine verifizierten Live-Preise oder garantierten Kursziele.
Ich kann auch einen XAUT-Kerzenchart mit Einstiegs-, Stop-Loss- und Kurszielzonen erstellen.
###XAUTUSTD – Tether Gold-Preischart 🥇
Veranschaulichende Marktniveaus
Technischer Ausblick
* $4,000 – Zu beobachtende Unterstützung
* $4,050 – Referenzpreis
* $4,125 – Zu beobachtender Widerstand
* $4,300 – Höheres Aufwärtspotenzial
Dies sind veranschaulichende Niveaus, keine verifizierten Live-Preise oder garantierten Kursziele.
Ich kann auch einen XAUT-Kerzenchart mit Einstiegs-, Stop-Loss- und Kurszielzonen erstellen.
Veranschaulichende Marktniveaus
Technischer Ausblick
* $4,000 – Zu beobachtende Unterstützung
* $4,050 – Referenzpreis
* $4,125 – Zu beobachtender Widerstand
* $4,300 – Höheres Aufwärtspotenzial
Dies sind veranschaulichende Niveaus, keine verifizierten Live-Preise oder garantierten Kursziele.
Ich kann auch einen XAUT-Kerzenchart mit Einstiegs-, Stop-Loss- und Kurszielzonen erstellen.
80
Übersetzung ansehen
Worked for 25s
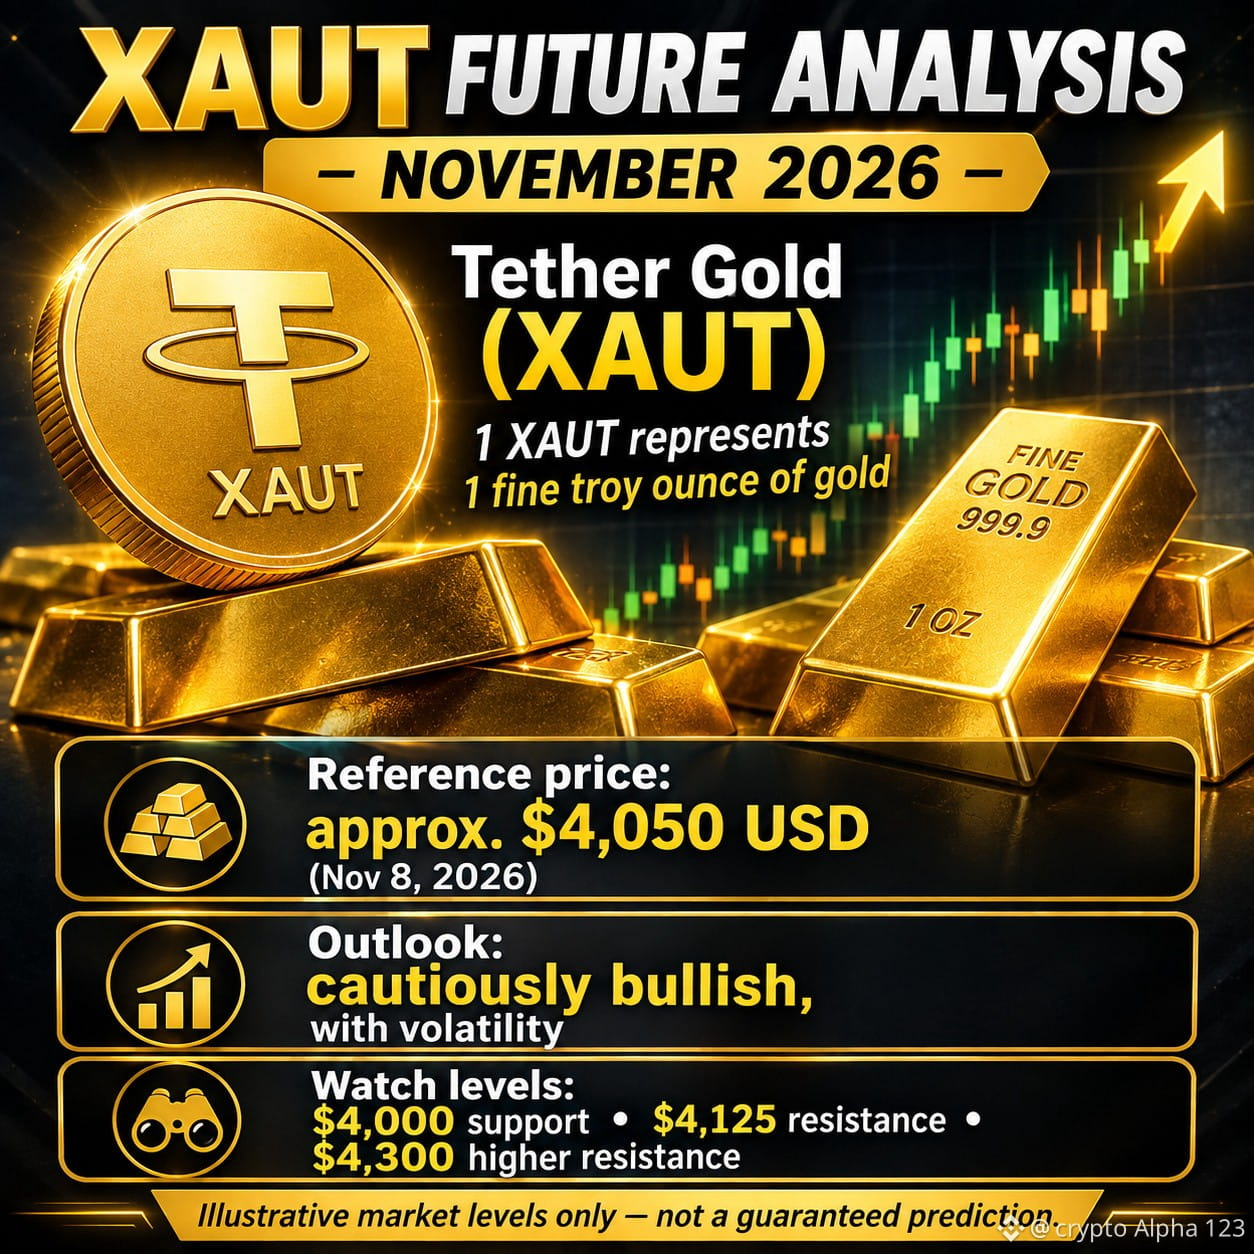
###XAUTUSTD (Tether Gold) Future Analysis – November 2026 🥇
Long-term outlook: Cautiously Bullish
Current market price: Approximately $4,050 USD per #XAUT (November 8, 2026). CoinGecko +1
### 1\. What is #XAUTUSTD is Tether Gold, a digital token backed by physical gold. Each token represents one fine troy ounce of gold. tether.io +1
### 2\. Future market outlook
* Short term: Price may remain volatile around current levels.
* Medium term: Gold demand and interest-rate changes could influence XAUT.
* Long term: XAUT may benefit if gold continues to attract demand as a store of value.
### 3\. Important market levels
| Level | Price (USD) |
| ------------------- | ----------- |
| Support to watch | $4,000 |
| Current reference | $4,050 |
| Resistance to watch | $4,125 |
| Higher resistance | $4,300 |
These are illustrative monitoring levels, not guaranteed support or resistance. CoinMarketCap +1
### 4\. Final prediction
XAUT's future depends mainly on the international gold market, inflation, interest rates and global demand for gold. Its outlook is cautiously positive, but prices can fall as well as rise.
Market reminder: This is educational market analysis, not a guaranteed forecast or a recommendation to invest.
#XAUT #TetherGold #GoldAnalysis #CryptoFuture #FuNnFuture
Worked for 25s
###XAUTUSTD (Tether Gold) Future Analysis – November 2026 🥇
Long-term outlook: Cautiously Bullish
Current market price: Approximately $4,050 USD per #XAUT (November 8, 2026). CoinGecko +1
### 1\. What is #XAUTUSTD is Tether Gold, a digital token backed by physical gold. Each token represents one fine troy ounce of gold. tether.io +1
### 2\. Future market outlook
* Short term: Price may remain volatile around current levels.
* Medium term: Gold demand and interest-rate changes could influence XAUT.
* Long term: XAUT may benefit if gold continues to attract demand as a store of value.
### 3\. Important market levels
| Level | Price (USD) |
| ------------------- | ----------- |
| Support to watch | $4,000 |
| Current reference | $4,050 |
| Resistance to watch | $4,125 |
| Higher resistance | $4,300 |
These are illustrative monitoring levels, not guaranteed support or resistance. CoinMarketCap +1
### 4\. Final prediction
XAUT's future depends mainly on the international gold market, inflation, interest rates and global demand for gold. Its outlook is cautiously positive, but prices can fall as well as rise.
Market reminder: This is educational market analysis, not a guaranteed forecast or a recommendation to invest.
#XAUT #TetherGold #GoldAnalysis #CryptoFuture #FuNnFuture
###XAUTUSTD (Tether Gold) Future Analysis – November 2026 🥇
Long-term outlook: Cautiously Bullish
Current market price: Approximately $4,050 USD per #XAUT (November 8, 2026). CoinGecko +1
### 1\. What is #XAUTUSTD is Tether Gold, a digital token backed by physical gold. Each token represents one fine troy ounce of gold. tether.io +1
### 2\. Future market outlook
* Short term: Price may remain volatile around current levels.
* Medium term: Gold demand and interest-rate changes could influence XAUT.
* Long term: XAUT may benefit if gold continues to attract demand as a store of value.
### 3\. Important market levels
| Level | Price (USD) |
| ------------------- | ----------- |
| Support to watch | $4,000 |
| Current reference | $4,050 |
| Resistance to watch | $4,125 |
| Higher resistance | $4,300 |
These are illustrative monitoring levels, not guaranteed support or resistance. CoinMarketCap +1
### 4\. Final prediction
XAUT's future depends mainly on the international gold market, inflation, interest rates and global demand for gold. Its outlook is cautiously positive, but prices can fall as well as rise.
Market reminder: This is educational market analysis, not a guaranteed forecast or a recommendation to invest.
#XAUT #TetherGold #GoldAnalysis #CryptoFuture #FuNnFuture
109
Übersetzung ansehen
We might see Huge pump dump in $BTC on 10th October .? 😂😅
We might see Huge pump dump in $BTC on 10th October .? 😂😅

72
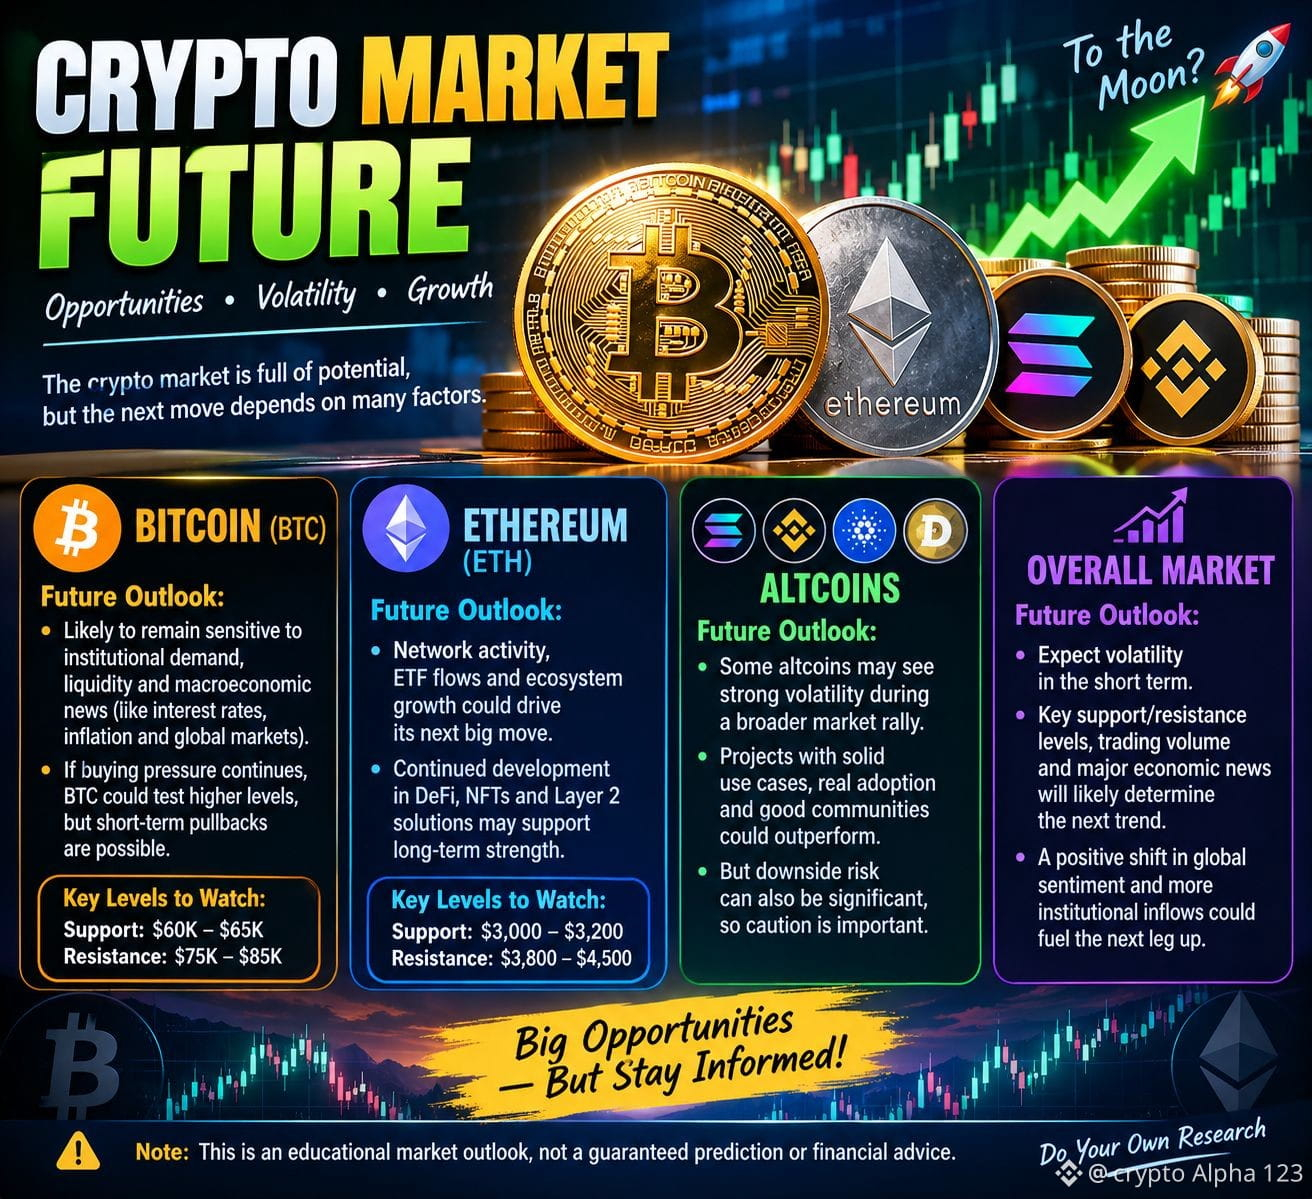
📈 Ausblick auf die Zukunft des Kryptomarkts
Kryptomarkt — Was könnte als Nächstes passieren?
🔹 Bitcoin $BTC : Die Marktrichtung könnte empfindlich bleiben in Bezug auf institutionelle Nachfrage, Liquidität und makroökonomische Nachrichten.
🔹 Ethereum $ETH : Netzwerkaktivität, ETF-Zuflüsse und das Wachstum des Ökosystems könnten seinen nächsten großen Schritt beeinflussen.
🔹 Altcoins: Einige könnten während einer breiteren Markt-Rallye eine starke Volatilität sehen, aber das Abwärtsrisiko kann ebenfalls erheblich sein.
🔹 Gesamtmarkt: Rechne mit Volatilität. Wichtige Support-/Resistance-Niveaus, das Handelsvolumen und große makroökonomische Nachrichten könnten die nächste Entwicklung bestimmen.
📈 Ausblick auf die Zukunft des Kryptomarkts
Kryptomarkt — Was könnte als Nächstes passieren?
🔹 Bitcoin $BTC : Die Marktrichtung könnte empfindlich bleiben in Bezug auf institutionelle Nachfrage, Liquidität und makroökonomische Nachrichten.
🔹 Ethereum $ETH : Netzwerkaktivität, ETF-Zuflüsse und das Wachstum des Ökosystems könnten seinen nächsten großen Schritt beeinflussen.
🔹 Altcoins: Einige könnten während einer breiteren Markt-Rallye eine starke Volatilität sehen, aber das Abwärtsrisiko kann ebenfalls erheblich sein.
🔹 Gesamtmarkt: Rechne mit Volatilität. Wichtige Support-/Resistance-Niveaus, das Handelsvolumen und große makroökonomische Nachrichten könnten die nächste Entwicklung bestimmen.
Kryptomarkt — Was könnte als Nächstes passieren?
🔹 Bitcoin $BTC : Die Marktrichtung könnte empfindlich bleiben in Bezug auf institutionelle Nachfrage, Liquidität und makroökonomische Nachrichten.
🔹 Ethereum $ETH : Netzwerkaktivität, ETF-Zuflüsse und das Wachstum des Ökosystems könnten seinen nächsten großen Schritt beeinflussen.
🔹 Altcoins: Einige könnten während einer breiteren Markt-Rallye eine starke Volatilität sehen, aber das Abwärtsrisiko kann ebenfalls erheblich sein.
🔹 Gesamtmarkt: Rechne mit Volatilität. Wichtige Support-/Resistance-Niveaus, das Handelsvolumen und große makroökonomische Nachrichten könnten die nächste Entwicklung bestimmen.
87
Übersetzung ansehen
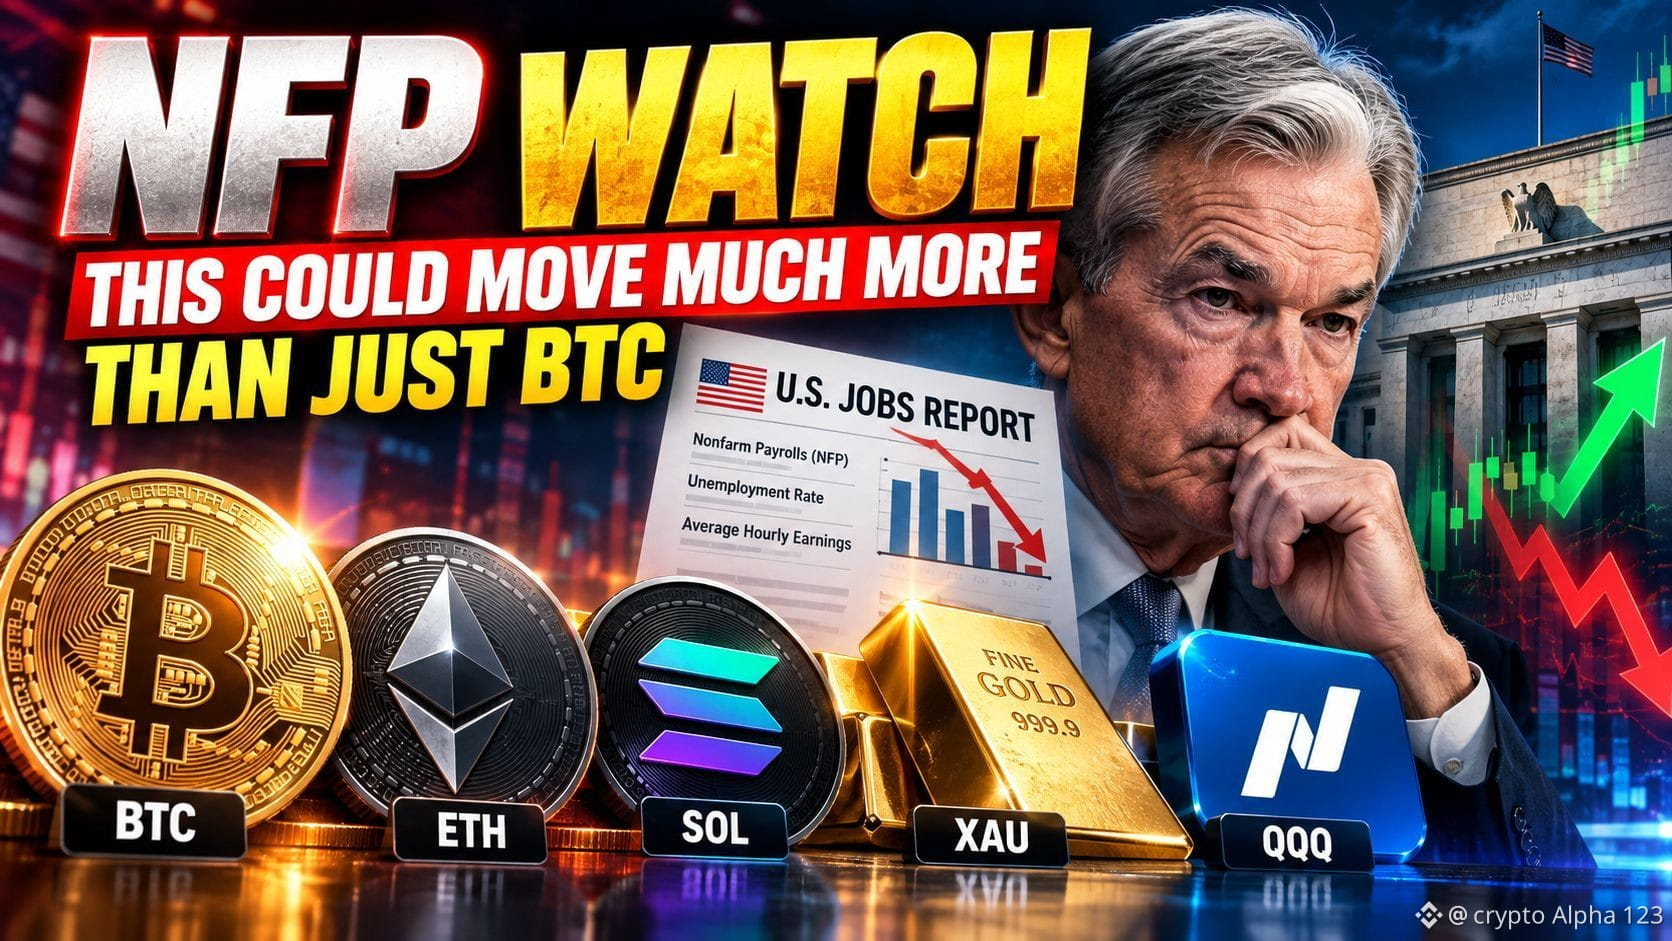
🚨 NFP WATCH — THIS PRINT COULD HIT WAY MORE THAN JUST $BTC.
September payrolls are expected to come in around +90K, down sharply from +162K in August, while unemployment is seen holding near 4.1%. Average hourly earnings are also in focus because wage pressure could change the Fed narrative fast.
Here’s the setup:
Weak NFP + softer wages
→ Fed pressure eases
→ Treasury yields can cool
→ $XAU, $ETH, $SOL, $QQQ could catch a bid
Hot NFP + sticky wages
→ rate-hike risk comes back
→ dollar/yields push higher
→ $XAU, $ETH, $SOL, $QQQ could get hit
And with the U.S. 10Y still hovering above 5.2%, this jobs report matters more than usual.
The market isn’t just trading jobs.
It’s trading the next Fed move.
NFP is the trigger. Yields are the transmission. Risk assets take the punch.
$ETH $SOL $XAU $QQQ
#nfpwatch #BitcoinRisesToward$85K #AmazonPlansToSell$8BNvidiaChips #NEARFallsToAround$4.70Down14% #EthereumFoundationLaunchesZkAPIOnMainnet
🚨 NFP WATCH — THIS PRINT COULD HIT WAY MORE THAN JUST $BTC.
September payrolls are expected to come in around +90K, down sharply from +162K in August, while unemployment is seen holding near 4.1%. Average hourly earnings are also in focus because wage pressure could change the Fed narrative fast.
Here’s the setup:
Weak NFP + softer wages
→ Fed pressure eases
→ Treasury yields can cool
→ $XAU, $ETH, $SOL, $QQQ could catch a bid
Hot NFP + sticky wages
→ rate-hike risk comes back
→ dollar/yields push higher
→ $XAU, $ETH, $SOL, $QQQ could get hit
And with the U.S. 10Y still hovering above 5.2%, this jobs report matters more than usual.
The market isn’t just trading jobs.
It’s trading the next Fed move.
NFP is the trigger. Yields are the transmission. Risk assets take the punch.
$ETH $SOL $XAU $QQQ
#nfpwatch #BitcoinRisesToward$85K #AmazonPlansToSell$8BNvidiaChips #NEARFallsToAround$4.70Down14% #EthereumFoundationLaunchesZkAPIOnMainnet
September payrolls are expected to come in around +90K, down sharply from +162K in August, while unemployment is seen holding near 4.1%. Average hourly earnings are also in focus because wage pressure could change the Fed narrative fast.
Here’s the setup:
Weak NFP + softer wages
→ Fed pressure eases
→ Treasury yields can cool
→ $XAU, $ETH, $SOL, $QQQ could catch a bid
Hot NFP + sticky wages
→ rate-hike risk comes back
→ dollar/yields push higher
→ $XAU, $ETH, $SOL, $QQQ could get hit
And with the U.S. 10Y still hovering above 5.2%, this jobs report matters more than usual.
The market isn’t just trading jobs.
It’s trading the next Fed move.
NFP is the trigger. Yields are the transmission. Risk assets take the punch.
$ETH $SOL $XAU $QQQ
#nfpwatch #BitcoinRisesToward$85K #AmazonPlansToSell$8BNvidiaChips #NEARFallsToAround$4.70Down14% #EthereumFoundationLaunchesZkAPIOnMainnet
1
82
Artikel
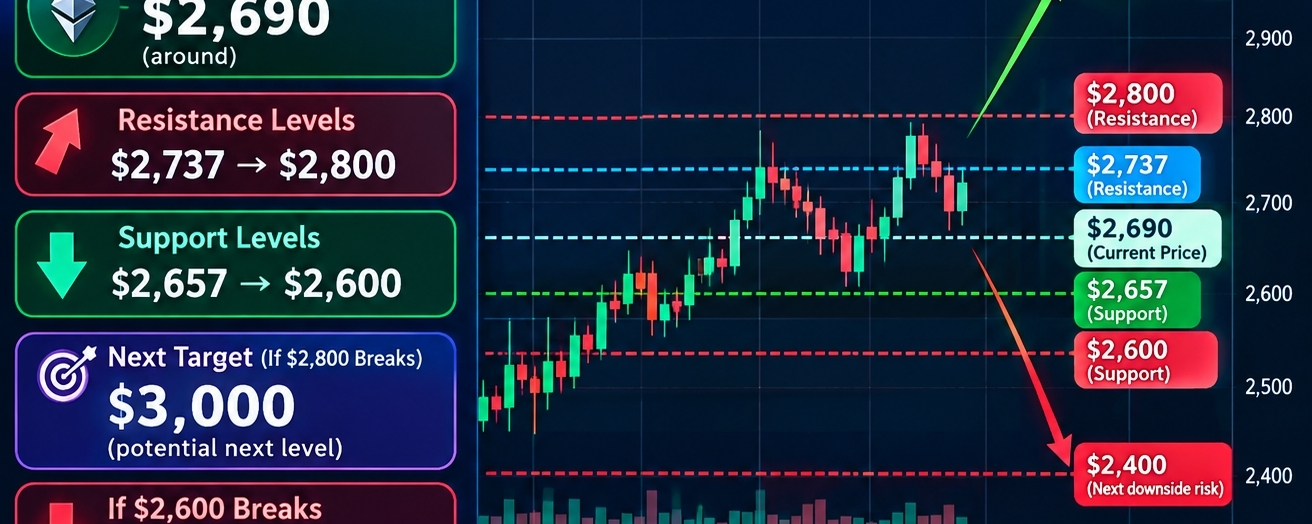
Hier ist eine kurze ETH-Prognose basierend auf den aktuellen Marktbedingungen:
ETH Nächste Prognose — Oktober 2026Hier ist eine kurze ETH-Prognose basierend auf den aktuellen Marktbedingungen:
ETH Nächste Prognose — Oktober 2026 📈
Aktuell: etwa $2.690
Widerstand: $2.737 → $2.800
Wenn ETH über $2.800 ausbricht: $3.000 könnte als nächstes Kursziel in Frage kommen.
Unterstützung: $2.657 → $2.600
Wenn $2.600 bricht: Das Abwärtsrisiko könnte Richtung der mittleren $2.400er zunehmen.
Citi hat kürzlich seine 12-Monats-$ETH -Prognose auf $3.028 angehoben, aber Prognosen sind unsicher.
Einfacher Überblick: ETH befindet sich derzeit in einer Spanne um $2.600–$2.800. Ein bestätigter Ausbruch über $2.800 wäre eine wichtige technische Entwicklung; der Verlust von $2.600 würde auf zusätzliches Abwärtsrisiko hindeuten.
Hier ist eine kurze ETH-Prognose basierend auf den aktuellen Marktbedingungen: ETH Nächste Prognose — Oktober 2026
Hier ist eine kurze ETH-Prognose basierend auf den aktuellen Marktbedingungen:
ETH Nächste Prognose — Oktober 2026 📈
Aktuell: etwa $2.690
Widerstand: $2.737 → $2.800
Wenn ETH über $2.800 ausbricht: $3.000 könnte als nächstes Kursziel in Frage kommen.
Unterstützung: $2.657 → $2.600
Wenn $2.600 bricht: Das Abwärtsrisiko könnte Richtung der mittleren $2.400er zunehmen.
Citi hat kürzlich seine 12-Monats-$ETH -Prognose auf $3.028 angehoben, aber Prognosen sind unsicher.
Einfacher Überblick: ETH befindet sich derzeit in einer Spanne um $2.600–$2.800. Ein bestätigter Ausbruch über $2.800 wäre eine wichtige technische Entwicklung; der Verlust von $2.600 würde auf zusätzliches Abwärtsrisiko hindeuten.
ETH Nächste Prognose — Oktober 2026 📈
Aktuell: etwa $2.690
Widerstand: $2.737 → $2.800
Wenn ETH über $2.800 ausbricht: $3.000 könnte als nächstes Kursziel in Frage kommen.
Unterstützung: $2.657 → $2.600
Wenn $2.600 bricht: Das Abwärtsrisiko könnte Richtung der mittleren $2.400er zunehmen.
Citi hat kürzlich seine 12-Monats-$ETH -Prognose auf $3.028 angehoben, aber Prognosen sind unsicher.
Einfacher Überblick: ETH befindet sich derzeit in einer Spanne um $2.600–$2.800. Ein bestätigter Ausbruch über $2.800 wäre eine wichtige technische Entwicklung; der Verlust von $2.600 würde auf zusätzliches Abwärtsrisiko hindeuten.
77
Übersetzung ansehen
Here’s a ready-to-post version:
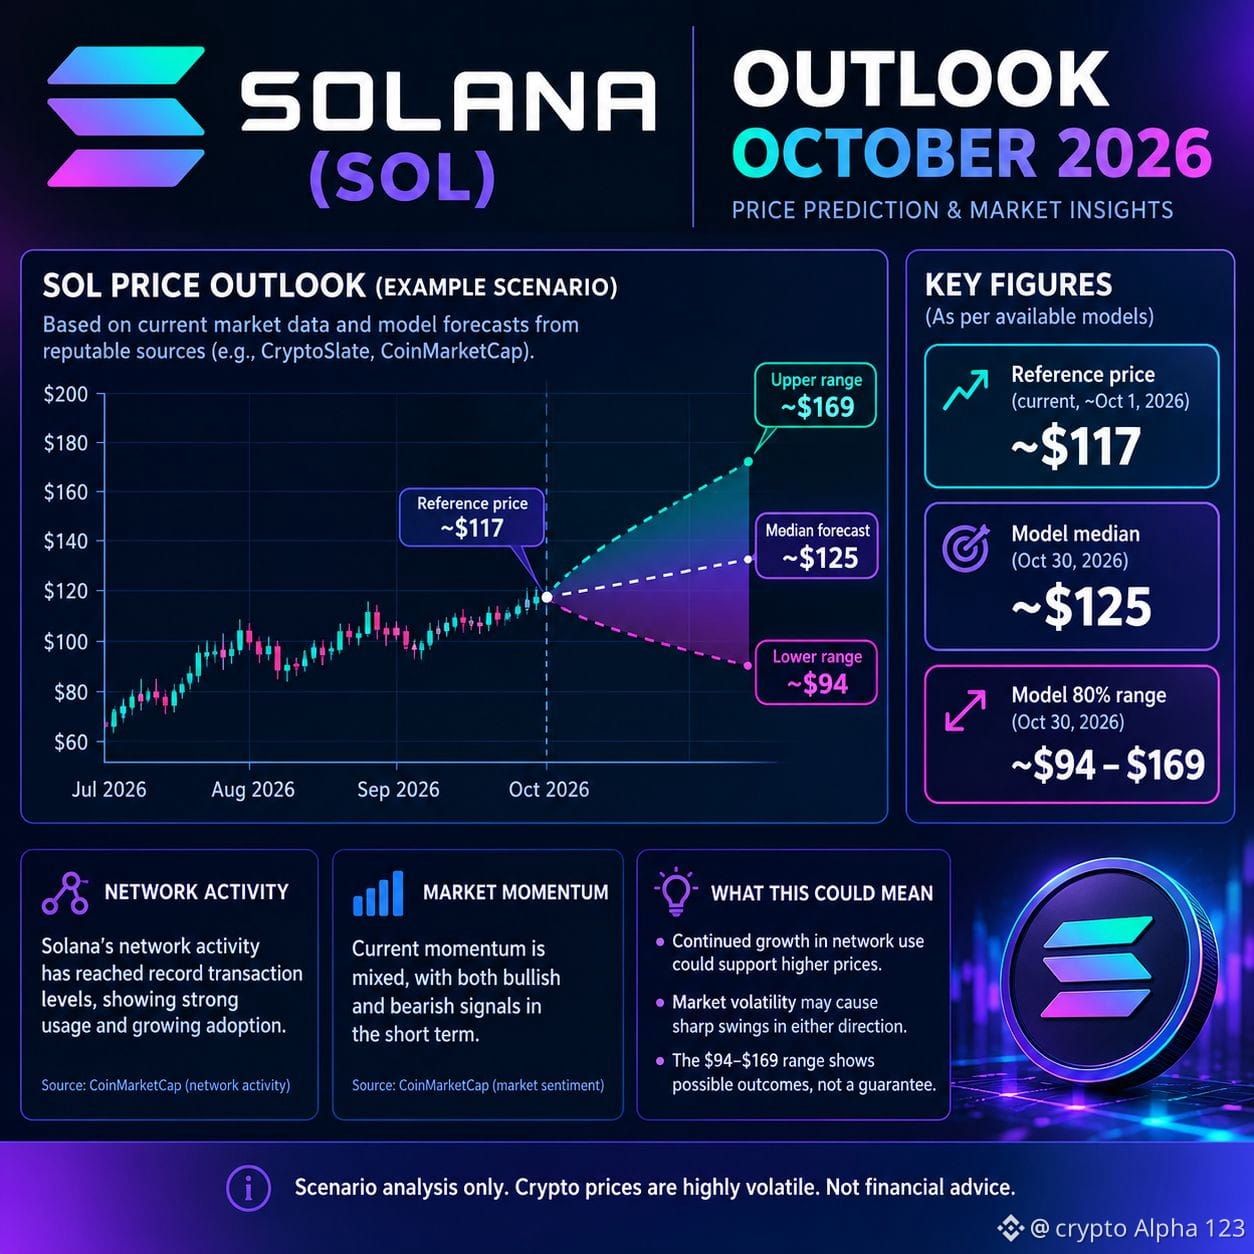
🚀 SOLANA $SOL PRICE PREDICTION — OCTOBER 2026 📈
Solana $SOL remains one of the major cryptocurrencies to watch. Based on current market models and network activity, an example October outlook places SOL around $125, with a possible model range of approximately $94–$169.
🔹 Reference price: ~$117
🎯 Model median: ~$125
📊 Possible range: ~$94–$169
⚡ Key factors: Network activity, market momentum, adoption and overall crypto-market conditions.
Remember: crypto prices can change rapidly, and predictions are estimates—not guarantees.
#Solana #SOL #Crypto #CryptoPrediction #SolanaPrediction #Blockchain #FuNnFuture
Here’s a ready-to-post version:
🚀 SOLANA $SOL PRICE PREDICTION — OCTOBER 2026 📈
Solana $SOL remains one of the major cryptocurrencies to watch. Based on current market models and network activity, an example October outlook places SOL around $125, with a possible model range of approximately $94–$169.
🔹 Reference price: ~$117
🎯 Model median: ~$125
📊 Possible range: ~$94–$169
⚡ Key factors: Network activity, market momentum, adoption and overall crypto-market conditions.
Remember: crypto prices can change rapidly, and predictions are estimates—not guarantees.
#Solana #SOL #Crypto #CryptoPrediction #SolanaPrediction #Blockchain #FuNnFuture
🚀 SOLANA $SOL PRICE PREDICTION — OCTOBER 2026 📈
Solana $SOL remains one of the major cryptocurrencies to watch. Based on current market models and network activity, an example October outlook places SOL around $125, with a possible model range of approximately $94–$169.
🔹 Reference price: ~$117
🎯 Model median: ~$125
📊 Possible range: ~$94–$169
⚡ Key factors: Network activity, market momentum, adoption and overall crypto-market conditions.
Remember: crypto prices can change rapidly, and predictions are estimates—not guarantees.
#Solana #SOL #Crypto #CryptoPrediction #SolanaPrediction #Blockchain #FuNnFuture
104
Übersetzung ansehen
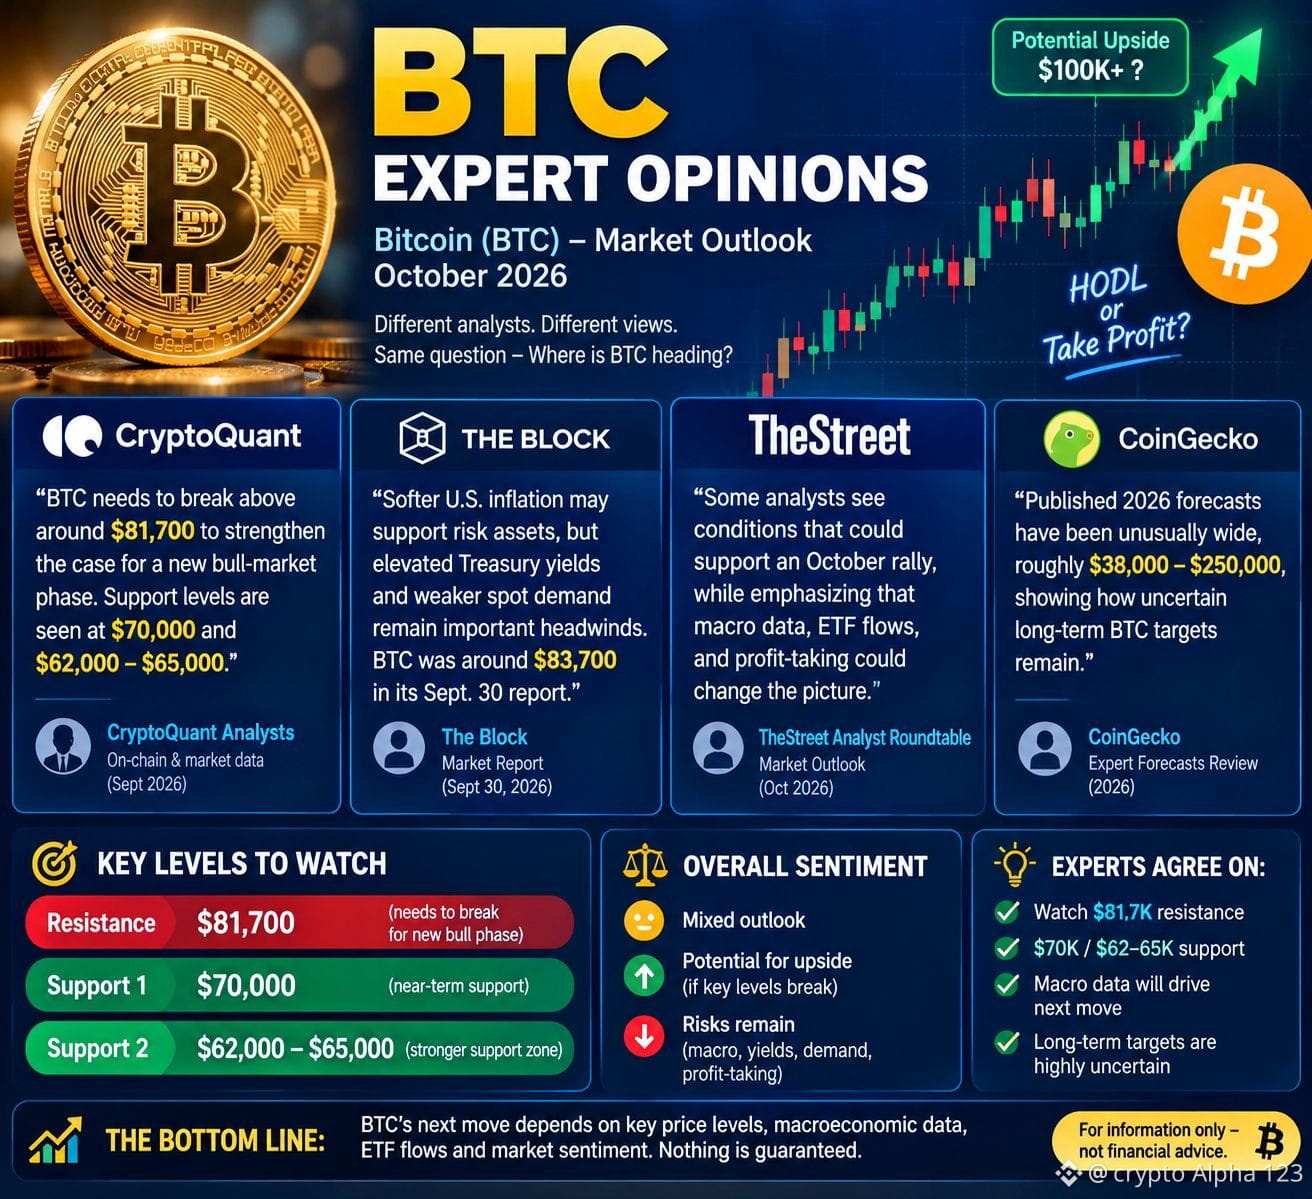
$BITCOIN ₿ Bitcoin (BTC) — Expert Outlook | October 2026
CryptoQuant: BTC needs to break above roughly $81,700 to strengthen the case for a new bull-market phase; analysts identified support around $70,000 and $62,000–$65,000.
The Block: Softer U.S. inflation may support risk assets, but elevated Treasury yields and weaker spot demand remain important headwinds. BTC was around $83,700 in its Sept. 30 report.
TheStreet's analyst roundtable: Some analysts see conditions that could support an October rally, while emphasizing that macroeconomic data, ETF flows, and profit-taking could change the picture.
CoinGecko's review of analyst forecasts: Published 2026 forecasts have been unusually wide, roughly $38,000–$250,000, showing how uncertain long-term BTC targets remain.
Bottom line: BTC's key areas to watch are $81.7K resistance and $70K / $62–65K support. These are analyst levels, not guaranteed future prices.
For information only
$BITCOIN ₿ Bitcoin (BTC) — Expert Outlook | October 2026
CryptoQuant: BTC needs to break above roughly $81,700 to strengthen the case for a new bull-market phase; analysts identified support around $70,000 and $62,000–$65,000.
The Block: Softer U.S. inflation may support risk assets, but elevated Treasury yields and weaker spot demand remain important headwinds. BTC was around $83,700 in its Sept. 30 report.
TheStreet's analyst roundtable: Some analysts see conditions that could support an October rally, while emphasizing that macroeconomic data, ETF flows, and profit-taking could change the picture.
CoinGecko's review of analyst forecasts: Published 2026 forecasts have been unusually wide, roughly $38,000–$250,000, showing how uncertain long-term BTC targets remain.
Bottom line: BTC's key areas to watch are $81.7K resistance and $70K / $62–65K support. These are analyst levels, not guaranteed future prices.
For information only
CryptoQuant: BTC needs to break above roughly $81,700 to strengthen the case for a new bull-market phase; analysts identified support around $70,000 and $62,000–$65,000.
The Block: Softer U.S. inflation may support risk assets, but elevated Treasury yields and weaker spot demand remain important headwinds. BTC was around $83,700 in its Sept. 30 report.
TheStreet's analyst roundtable: Some analysts see conditions that could support an October rally, while emphasizing that macroeconomic data, ETF flows, and profit-taking could change the picture.
CoinGecko's review of analyst forecasts: Published 2026 forecasts have been unusually wide, roughly $38,000–$250,000, showing how uncertain long-term BTC targets remain.
Bottom line: BTC's key areas to watch are $81.7K resistance and $70K / $62–65K support. These are analyst levels, not guaranteed future prices.
For information only
56
$NEAR Hier ist eine fertige Caption zum Posten:
NEAR Protocol — Future Updates 2026 🚀
🔹 Agentic Economy: Aufbau einer Infrastruktur für KI-Agenten und On-Chain-Anwendungen.
🔹 NEAR Intents: Einfacheres Cross-Chain-Trading und Asset-Transfers.
🔹 NEAR AI: Tools zum Erstellen, Bereitstellen und Monetarisieren von KI-Agenten.
🔹 Nightshade 3.0: Weiterhin Fokus auf Skalierung und Datenschutz.
🔹 Mainnet-Upgrades: Laufende Verbesserungen bei Sicherheit, Performance und Resharding.
🔹 Chain Signatures & OmniBridge: Mehr Cross-Chain-Konnektivität.
📈 Die Zukunft von NEAR konzentriert sich auf Skalierbarkeit, Interoperabilität und blockchain-basierte Anwendungen mit KI.
$NEAR Hier ist eine fertige Caption zum Posten:
NEAR Protocol — Future Updates 2026 🚀
🔹 Agentic Economy: Aufbau einer Infrastruktur für KI-Agenten und On-Chain-Anwendungen.
🔹 NEAR Intents: Einfacheres Cross-Chain-Trading und Asset-Transfers.
🔹 NEAR AI: Tools zum Erstellen, Bereitstellen und Monetarisieren von KI-Agenten.
🔹 Nightshade 3.0: Weiterhin Fokus auf Skalierung und Datenschutz.
🔹 Mainnet-Upgrades: Laufende Verbesserungen bei Sicherheit, Performance und Resharding.
🔹 Chain Signatures & OmniBridge: Mehr Cross-Chain-Konnektivität.
📈 Die Zukunft von NEAR konzentriert sich auf Skalierbarkeit, Interoperabilität und blockchain-basierte Anwendungen mit KI.
NEAR Protocol — Future Updates 2026 🚀
🔹 Agentic Economy: Aufbau einer Infrastruktur für KI-Agenten und On-Chain-Anwendungen.
🔹 NEAR Intents: Einfacheres Cross-Chain-Trading und Asset-Transfers.
🔹 NEAR AI: Tools zum Erstellen, Bereitstellen und Monetarisieren von KI-Agenten.
🔹 Nightshade 3.0: Weiterhin Fokus auf Skalierung und Datenschutz.
🔹 Mainnet-Upgrades: Laufende Verbesserungen bei Sicherheit, Performance und Resharding.
🔹 Chain Signatures & OmniBridge: Mehr Cross-Chain-Konnektivität.
📈 Die Zukunft von NEAR konzentriert sich auf Skalierbarkeit, Interoperabilität und blockchain-basierte Anwendungen mit KI.
1
244
Übersetzung ansehen
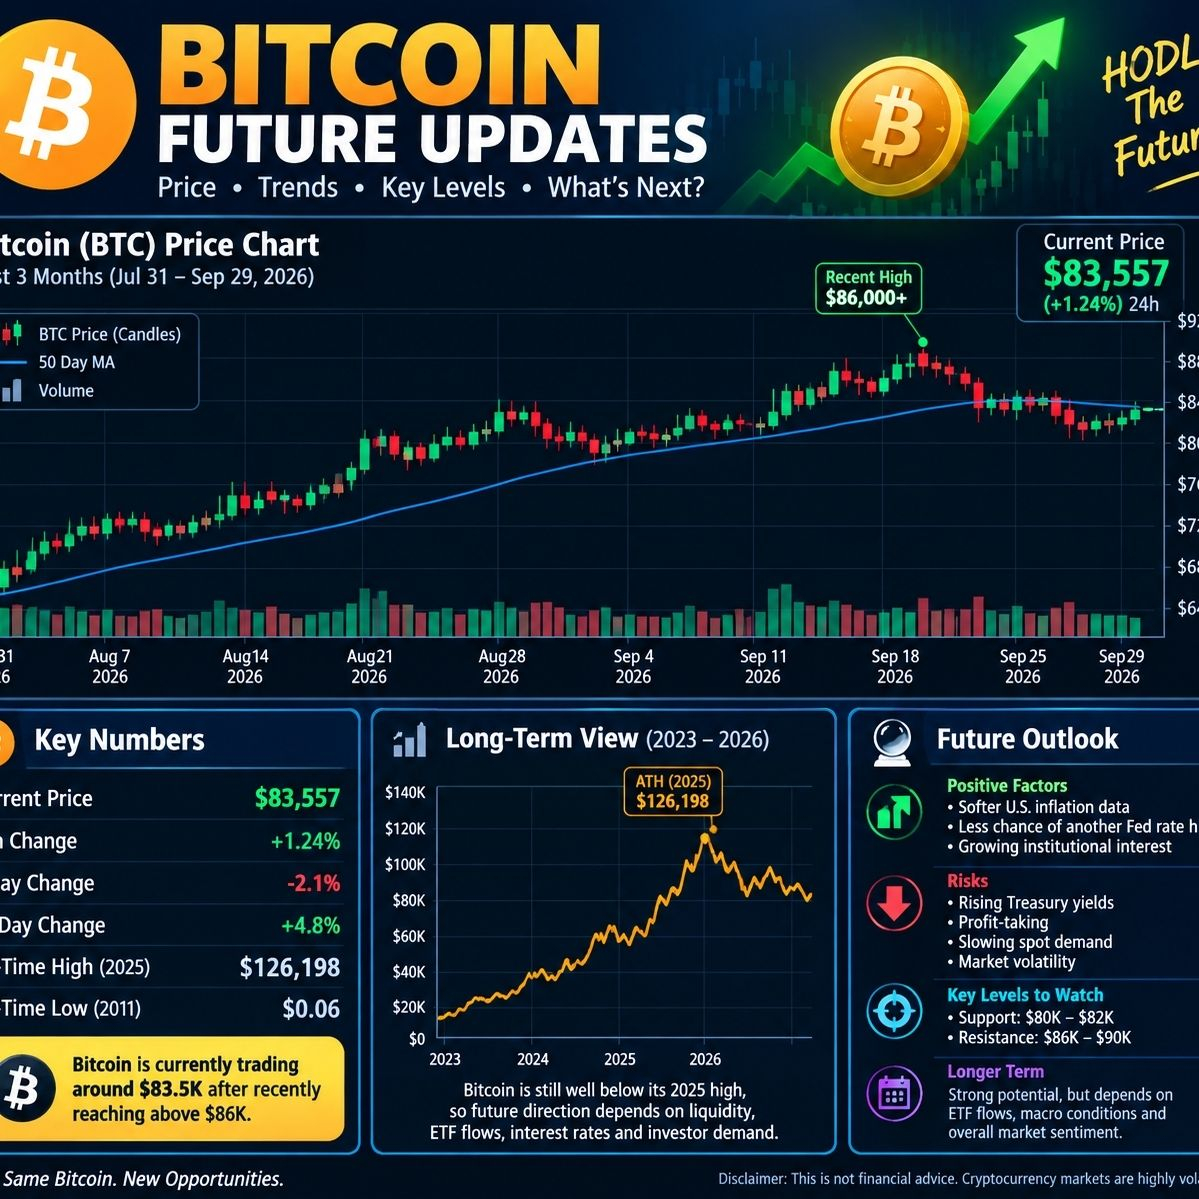
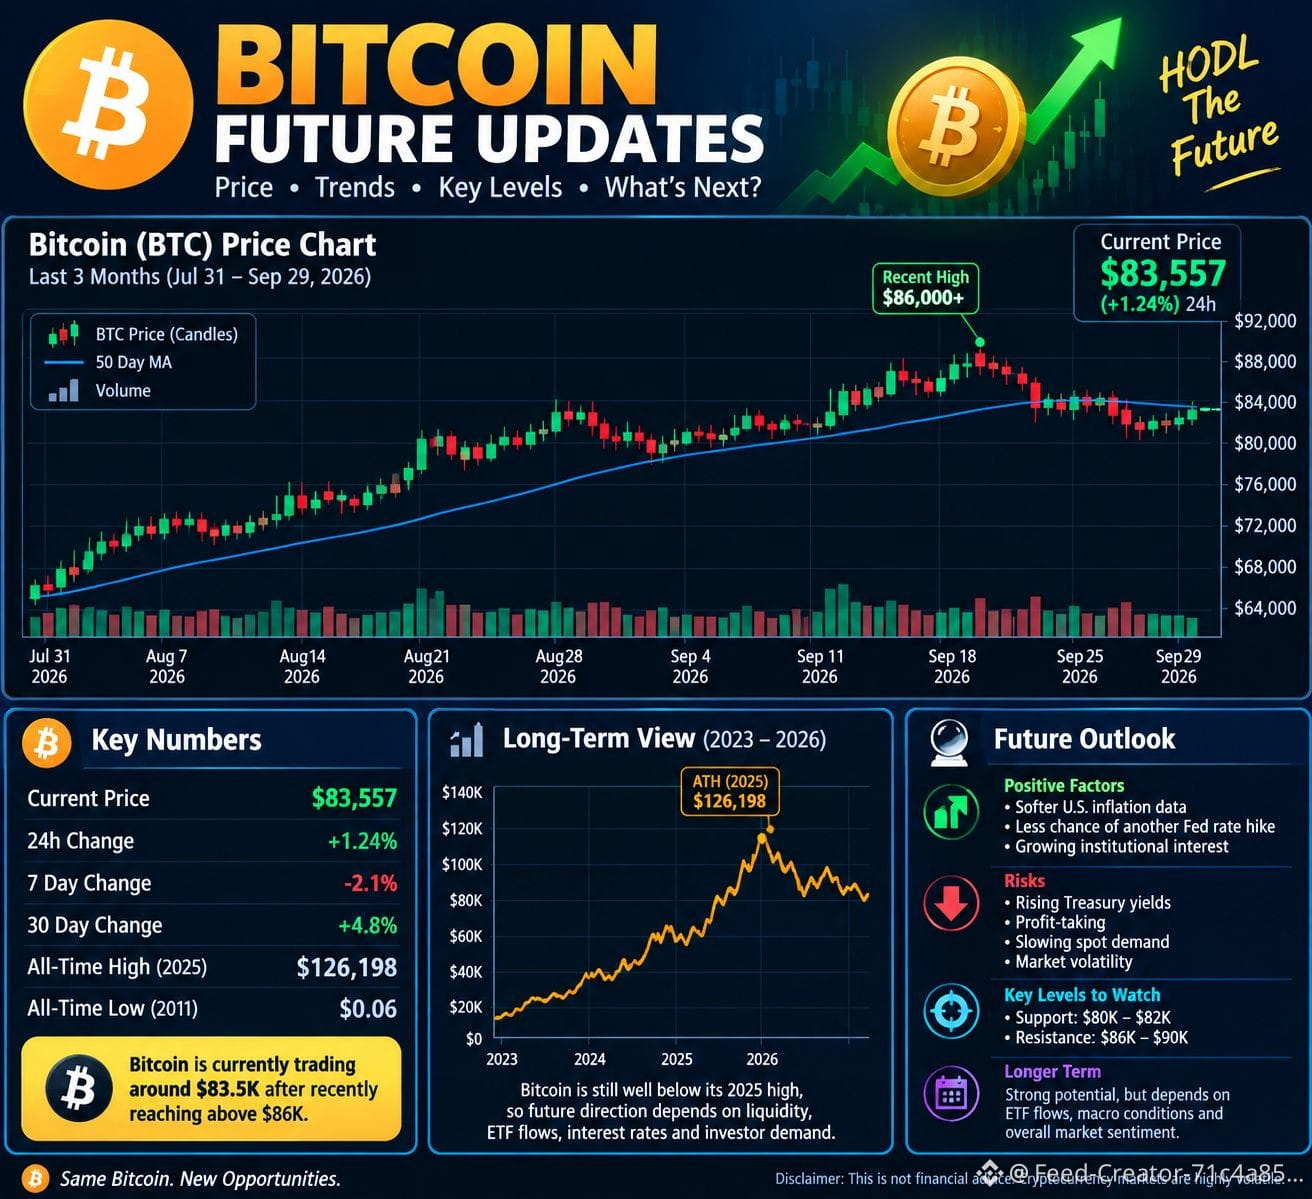
Here’s a current, neutral Bitcoin update with a chart. $BTC is around $83,557, after recently trading above $86,000; its 2025 all-time high was about $126,198. �
CoinMarketCap +1
Bitcoin price trend
BTC closing prices from July 31 through September 29, 2026.
BTC close
$84.4K
Source: StatMuse Money; current BTC price from CoinMarketCap.
📊 Bitcoin future outlook
Current area: ~$83.6K. �
CoinMarketCap
Important near-term zone: Analysts are watching roughly $80K–$82K as a key technical area. �
The Block
Positive factor: September's softer-than-expected U.S. inflation data reduced expectations for another October Fed rate hike, which can support risk assets. �
Barron's
Risk factor: Rising Treasury yields, profit-taking and slowing spot demand could create additional volatility. �
The Wall Street Journal +1
Longer-term: Bitcoin remains substantially below its October 2025 record, so future direction depends heavily on liquidity, ETF flows, interest rates and investor demand. �
CoinMarketCap +1
Important: These are market scenarios, not a guarantee of future Bitcoin prices.
Here’s a current, neutral Bitcoin update with a chart. $BTC is around $83,557, after recently trading above $86,000; its 2025 all-time high was about $126,198. �
CoinMarketCap +1
Bitcoin price trend
BTC closing prices from July 31 through September 29, 2026.
BTC close
$84.4K
Source: StatMuse Money; current BTC price from CoinMarketCap.
📊 Bitcoin future outlook
Current area: ~$83.6K. �
CoinMarketCap
Important near-term zone: Analysts are watching roughly $80K–$82K as a key technical area. �
The Block
Positive factor: September's softer-than-expected U.S. inflation data reduced expectations for another October Fed rate hike, which can support risk assets. �
Barron's
Risk factor: Rising Treasury yields, profit-taking and slowing spot demand could create additional volatility. �
The Wall Street Journal +1
Longer-term: Bitcoin remains substantially below its October 2025 record, so future direction depends heavily on liquidity, ETF flows, interest rates and investor demand. �
CoinMarketCap +1
Important: These are market scenarios, not a guarantee of future Bitcoin prices.
CoinMarketCap +1
Bitcoin price trend
BTC closing prices from July 31 through September 29, 2026.
BTC close
$84.4K
Source: StatMuse Money; current BTC price from CoinMarketCap.
📊 Bitcoin future outlook
Current area: ~$83.6K. �
CoinMarketCap
Important near-term zone: Analysts are watching roughly $80K–$82K as a key technical area. �
The Block
Positive factor: September's softer-than-expected U.S. inflation data reduced expectations for another October Fed rate hike, which can support risk assets. �
Barron's
Risk factor: Rising Treasury yields, profit-taking and slowing spot demand could create additional volatility. �
The Wall Street Journal +1
Longer-term: Bitcoin remains substantially below its October 2025 record, so future direction depends heavily on liquidity, ETF flows, interest rates and investor demand. �
CoinMarketCap +1
Important: These are market scenarios, not a guarantee of future Bitcoin prices.
61
Übersetzung ansehen
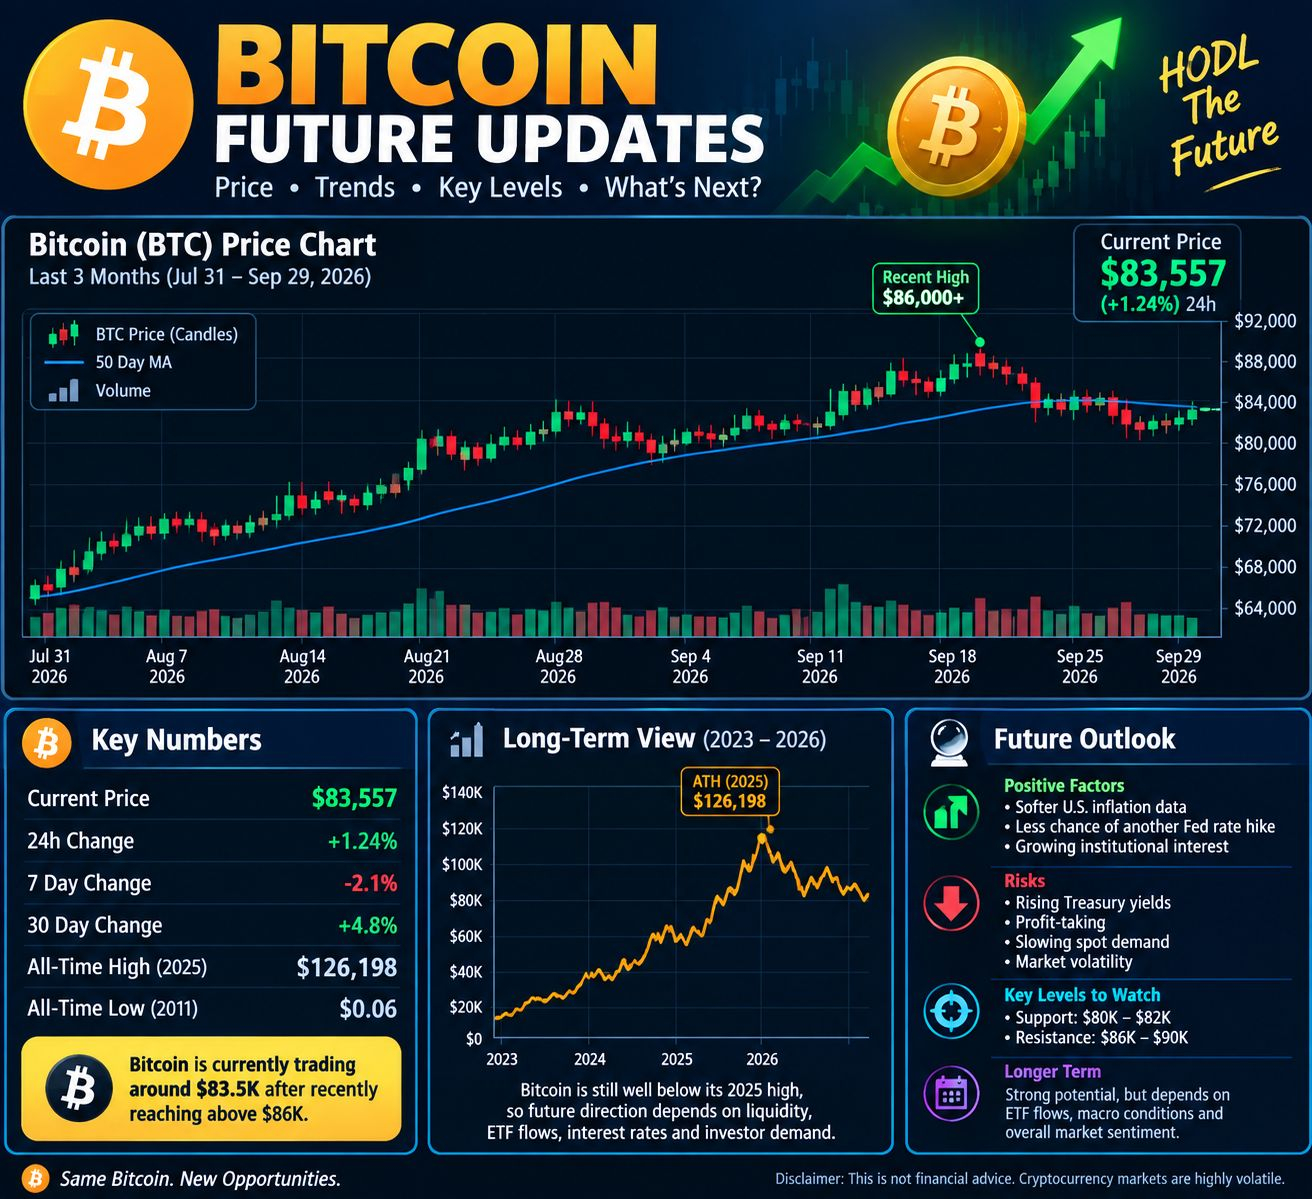
Here’s a current, neutral Bitcoin update with a chart. BTC is around $83,557, after recently trading above $86,000; its 2025 all-time high was about $126,198. �
CoinMarketCap +1
Bitcoin price trend
BTC closing prices from July 31 through September 29, 2026.
BTC close
$84.4K
Source: StatMuse Money; current BTC price from CoinMarketCap.
📊 Bitcoin future outlook
Current area: ~$83.6K. �
CoinMarketCap
Important near-term zone: Analysts are watching roughly $80K–$82K as a key technical area. �
The Block
Positive factor: September's softer-than-expected U.S. inflation data reduced expectations for another October Fed rate hike, which can support risk assets. �
Barron's
Risk factor: Rising Treasury yields, profit-taking and slowing spot demand could create additional volatility. �
The Wall Street Journal +1
Longer-term: Bitcoin remains substantially below its October 2025 record, so future direction depends heavily on liquidity, ETF flows, interest rates and investor demand. �
CoinMarketCap +1
Important: These are market scenarios, not a guarantee of future Bitcoin prices.
Here’s a current, neutral Bitcoin update with a chart. BTC is around $83,557, after recently trading above $86,000; its 2025 all-time high was about $126,198. �
CoinMarketCap +1
Bitcoin price trend
BTC closing prices from July 31 through September 29, 2026.
BTC close
$84.4K
Source: StatMuse Money; current BTC price from CoinMarketCap.
📊 Bitcoin future outlook
Current area: ~$83.6K. �
CoinMarketCap
Important near-term zone: Analysts are watching roughly $80K–$82K as a key technical area. �
The Block
Positive factor: September's softer-than-expected U.S. inflation data reduced expectations for another October Fed rate hike, which can support risk assets. �
Barron's
Risk factor: Rising Treasury yields, profit-taking and slowing spot demand could create additional volatility. �
The Wall Street Journal +1
Longer-term: Bitcoin remains substantially below its October 2025 record, so future direction depends heavily on liquidity, ETF flows, interest rates and investor demand. �
CoinMarketCap +1
Important: These are market scenarios, not a guarantee of future Bitcoin prices.
CoinMarketCap +1
Bitcoin price trend
BTC closing prices from July 31 through September 29, 2026.
BTC close
$84.4K
Source: StatMuse Money; current BTC price from CoinMarketCap.
📊 Bitcoin future outlook
Current area: ~$83.6K. �
CoinMarketCap
Important near-term zone: Analysts are watching roughly $80K–$82K as a key technical area. �
The Block
Positive factor: September's softer-than-expected U.S. inflation data reduced expectations for another October Fed rate hike, which can support risk assets. �
Barron's
Risk factor: Rising Treasury yields, profit-taking and slowing spot demand could create additional volatility. �
The Wall Street Journal +1
Longer-term: Bitcoin remains substantially below its October 2025 record, so future direction depends heavily on liquidity, ETF flows, interest rates and investor demand. �
CoinMarketCap +1
Important: These are market scenarios, not a guarantee of future Bitcoin prices.
86
Anmelden und weiter Inhalte entdecken
Krypto-Nutzer weltweit auf Binance Square kennenlernen
⚡️ Bleib in Sachen Krypto stets am Puls.
💬 Die weltgrößte Kryptobörse vertraut darauf.
👍 Erhalte verlässliche Einblicke von verifizierten Creators.
E-Mail-Adresse/Telefonnummer
Trendthemen
CPITestsDecemberRateOutlook
733,970 Aufrufe
3,530 Kommentare
Oktober-Verbraucherpreise dürften um 0,3 Prozent steigen und Fed auf Kurs für Zinserhöhung im Dezember halten
Binance News
·8 Likes
·9.4k Aufrufe
NvidiaInvestigatesAfterHuang’sAffairApology
289,991 Aufrufe
2,274 Kommentare
AnthropicRejectsIPODelayValuationinQuestion
78,363 Aufrufe
729 Kommentare