

Ismat Crypto
125 Beiträge

Ismat Crypto
Melden
Nutzer blockieren
Crypto Trader & Market Analyst. Helping you understand charts, spot trades, and daily crypto trends easily. Follow for regular market setups!
Regelmäßiger Trader
3.7 Jahre
44 Following
22 Follower
143 Like gegeben
Beiträge
Alle
Zitierungen
·
--
Übersetzung ansehen
🚀 Market Rebound Strategy: 1 to 5 Days Short-Term Outlook for BTC, ETH, & BNB!
The market is showing a strong relief bounce on the 4H charts. If you are looking for short-term swing setups over the next 1 to 5 days, here is the technical breakdown and key levels to watch for Bitcoin, Ethereum, and Binance Coin.
🎯 1. Bitcoin (BTC/USDT)
• Current Price: $78,142
• 1-5 Day Outlook: Bullish Consolidation
• Analysis: BTC found strong support at $76,325. It is currently testing the 25 MA ($78,559).
• Target Zone (1-5 Days): If BTC breaks and holds above $78,600, expect a fast move towards $79,800 and potentially a retest of the $81,000 zone.
• Invalidation: A daily close below $76,300 cancels this bullish momentum.
🎯 2. Ethereum (ETH/USDT)
• Current Price: $2,268.93
• 1-5 Day Outlook: Relief Rally Continuation
• Analysis: ETH bounced aggressively from its $2,174 local bottom. It has already reclaimed the 7 MA ($2,265).
• Target Zone (1-5 Days): Watch for a test of the 25 MA at $2,275. A clean breakout here clears the path toward $2,320 and $2,350.
• Invalidation: Dropping back below the $2,200 psychological support level.
🎯 3. BNB (BNB/USDT)
• Current Price: $711.65
• 1-5 Day Outlook: Bullish Reversal
• Analysis: BNB saw an immediate buy-back after dipping to $680. It is now stable above $710 and eyeing the 25 MA ($718).
• Target Zone (1-5 Days): Over the next few days, if BNB stays above $710, the immediate targets are $730 and $745.
• Invalidation: A breakdown below the major $690 support area.
⚠️ Risk Management Note
Short-term setups (1-5 days) depend heavily on volume. Keep an eye on BTC dominance and overall market volume before entering new positions. Always trade with a proper stop-loss!
What are your targets for this week? Let me know in the comments below! 👇
#CryptoTrading #Bitcoin #Ethereum #BNB #TechnicalAnalysis #BinanceSquare #TradingSignals #CryptoForecast
2
234
·
--
🔥 Altcoin-Momentum-Update: EVAA, MAGMA & AIOT brechen aus! 🔥
Heute sehen wir massive bullische Bewegungen bei diesen ausgewählten Token! Sehen wir uns die technischen Daten und die aktuelle Performance genauer an:
1️⃣ $EVAA (EVAA Protocol): Wird derzeit bei 1,3687 $ gehandelt, ein Plus von +11,06 %. Nachdem der Kurs ein Hoch von 1,6100 $ erreicht hatte, fand er lokale Unterstützung und konsolidiert sich im 4-Stunden-Chart solide oberhalb der 7MA (1,33 $) und der 25MA (1,28 $). Ein klarer Ausbruch zurück über 1,42 $ könnte die nächste Aufwärtswelle auslösen.
2️⃣ $MAGMA: Starker Handel bei 0,4442 $, mit einem kräftigen Plus von +18,62 % in den letzten 24 Stunden. Der Volumenanstieg ist bemerkenswert (77,72 Mio. USDT Handelsvolumen), und der Kurs hält sich stabil oberhalb der gleitenden Durchschnitte. Ein erneuter Test des jüngsten Hochs bei 0,4840 $ könnte bald anstehen.
3️⃣ $AIOT (OKZOO): Der größte Gewinner der drei, mit einem Sprung von +24,01 % auf einen Kurs von 0,0898 $. Das Handelsvolumen steigt massiv an: 1,10 Mrd. AIOT wurden gehandelt. Im 4-Stunden-Chart hat der Kurs wichtige Widerstände deutlich überwunden – ein Zeichen für starken Kaufdruck.
📊 Marktstimmung: Diese Altcoins mit mittlerer und geringer Marktkapitalisierung ziehen derzeit ein hohes Handelsvolumen an und entwickeln sich besser als viele Makro-Assets.
⚠️ Hinweis: Halte dich immer an deine Handelsstrategie und manage dein Risiko sorgfältig. Steige nicht blind an lokalen Hochs ein!
Welcher dieser drei Token sieht eurer Meinung nach am stärksten aus und könnte seinen Aufwärtstrend fortsetzen? Diskutiert gerne unten! 👇
#BinanceSquare #CryptoTrading #Altcoins #TechnicalAnalysis #EVAA #MAGMA #AIOT
1
577
·
--
Übersetzung ansehen
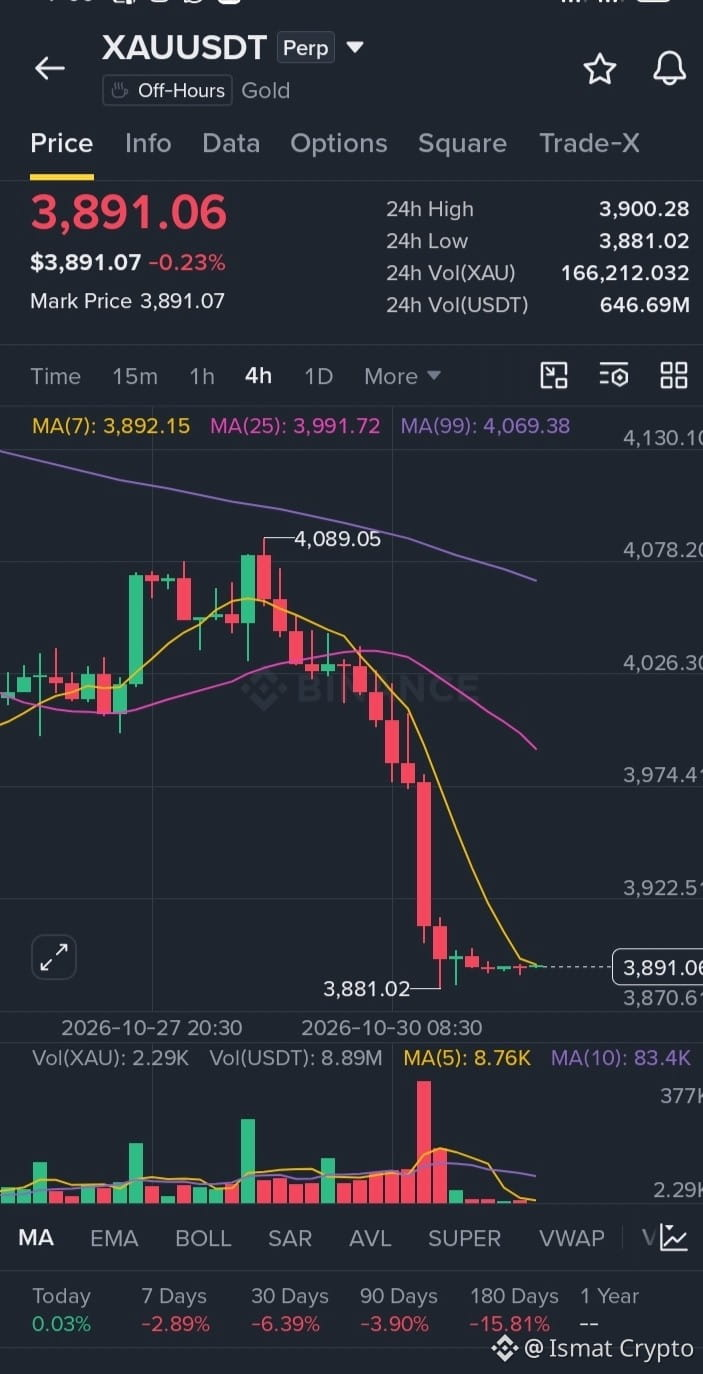
📉 XAUUSDT Under Heavy Pressure: Time to Buy or Wait?
The Gold market ($XAU) is witnessing a sharp sell-off on the 4-hour chart. The price dropped significantly from its recent high near $4,089 to the current level of $3,891.
Key Chart Takeaways:
• Massive Sell-off: Price has broken sharply below the MA(7), MA(25), and MA(99) indicators.
• Key Support: The price found temporary support at the 24h low of $3,881.02.
• High Volume: Huge red volume bars show strong selling momentum and liquidations.
• Performance: Gold is down over 2.89% this week and 6.39% over the past 30 days.
Entering longs blindly during this vertical drop carries high risk without a clear reversal signal.
💬 What’s your next move? Are you buying the dip or shorting? Let me know below!
#XAUUSDT #GoldTrading #TechnicalAnalysis #BinanceSquare
188
·
--
Übersetzung ansehen
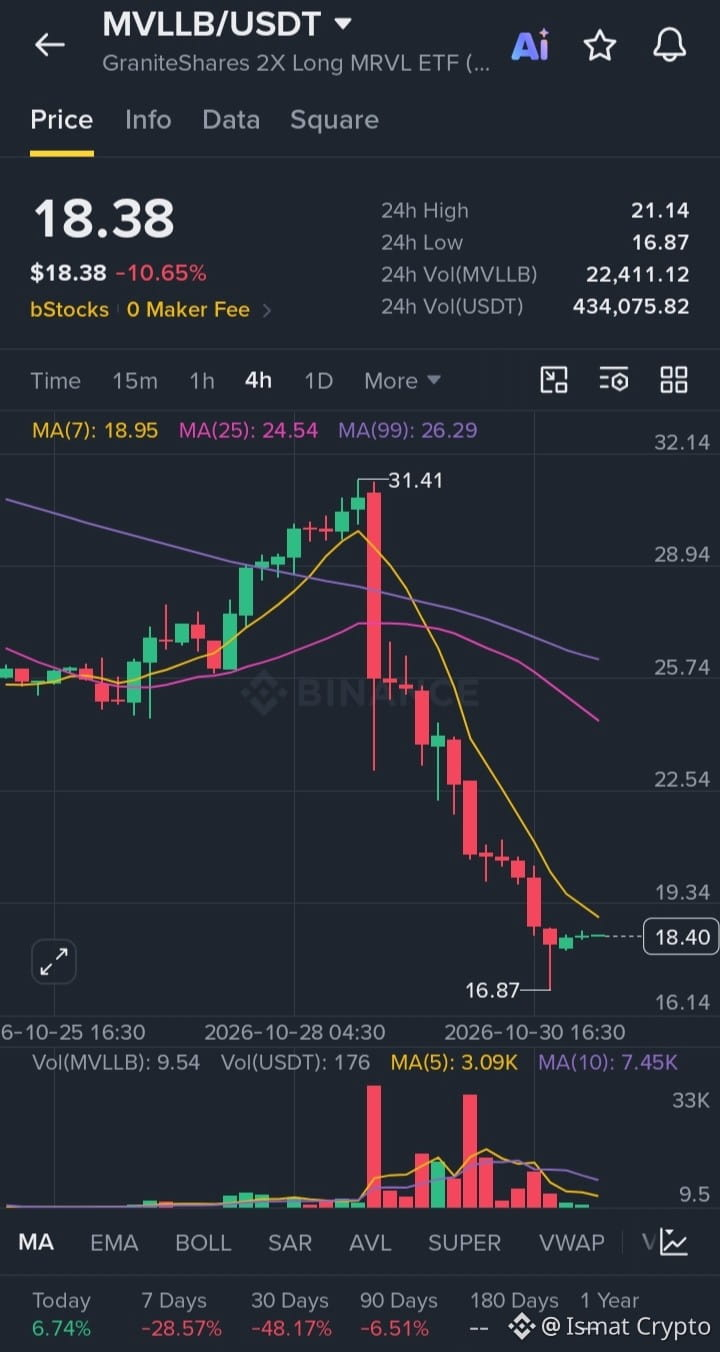
$MVLLB/USDT Analysis: Will the $16.87 Support Hold? 📉
GraniteShares 2X Long MRVL ETF ($MVLLB) has faced a significant correction recently, dropping -10.65% today to sit at $18.38.
Looking closely at the 4-hour chart, the token experienced a heavy rejection after peaking near the $31.41 resistance zone. The intense bearish momentum pushed the price below major moving averages, with the MA(7) currently tracking above the price at $18.95.
Key Technical Levels to Watch:
🔹 Immediate Support: $16.87 (Recent local bottom)
🔹 Immediate Resistance: $18.95 (MA 7) & $24.54 (MA 25)
The price is currently showing a minor relief bounce after hitting the $16.87 support floor. If the buyers manage to reclaim the $18.95 level, we could see a short-term recovery rally. However, if the $16.87 support breaks, further downside exposure is highly likely. Strict risk management is recommended.
What are your thoughts? Is this a good buy-the-dip opportunity or will it break lower? 👇
#CryptoTrading #TechnicalAnalysis #MVLLB #BinanceSquare
$MVLLB
{spot}(MVLLBUSDT)
$MVLLB /USDT Analysis: Will the $16.87 Support Hold? 📉
GraniteShares 2X Long MRVL ETF ($MVLLB ) has faced a significant correction recently, dropping -10.65% today to sit at $18.38.
Looking closely at the 4-hour chart, the token experienced a heavy rejection after peaking near the $31.41 resistance zone. The intense bearish momentum pushed the price below major moving averages, with the MA(7) currently tracking above the price at $18.95.
Key Technical Levels to Watch:
🔹 Immediate Support: $16.87 (Recent local bottom)
🔹 Immediate Resistance: $18.95 (MA 7) & $24.54 (MA 25)
The price is currently showing a minor relief bounce after hitting the $16.87 support floor. If the buyers manage to reclaim the $18.95 level, we could see a short-term recovery rally. However, if the $16.87 support breaks, further downside exposure is highly likely. Strict risk management is recommended.
What are your thoughts? Is this a good buy-the-dip opportunity or will it break lower? 👇
#CryptoTrading #TechnicalAnalysis #MVLLB #BinanceSquare
$MVLLB
1
107
·
--
Übersetzung ansehen
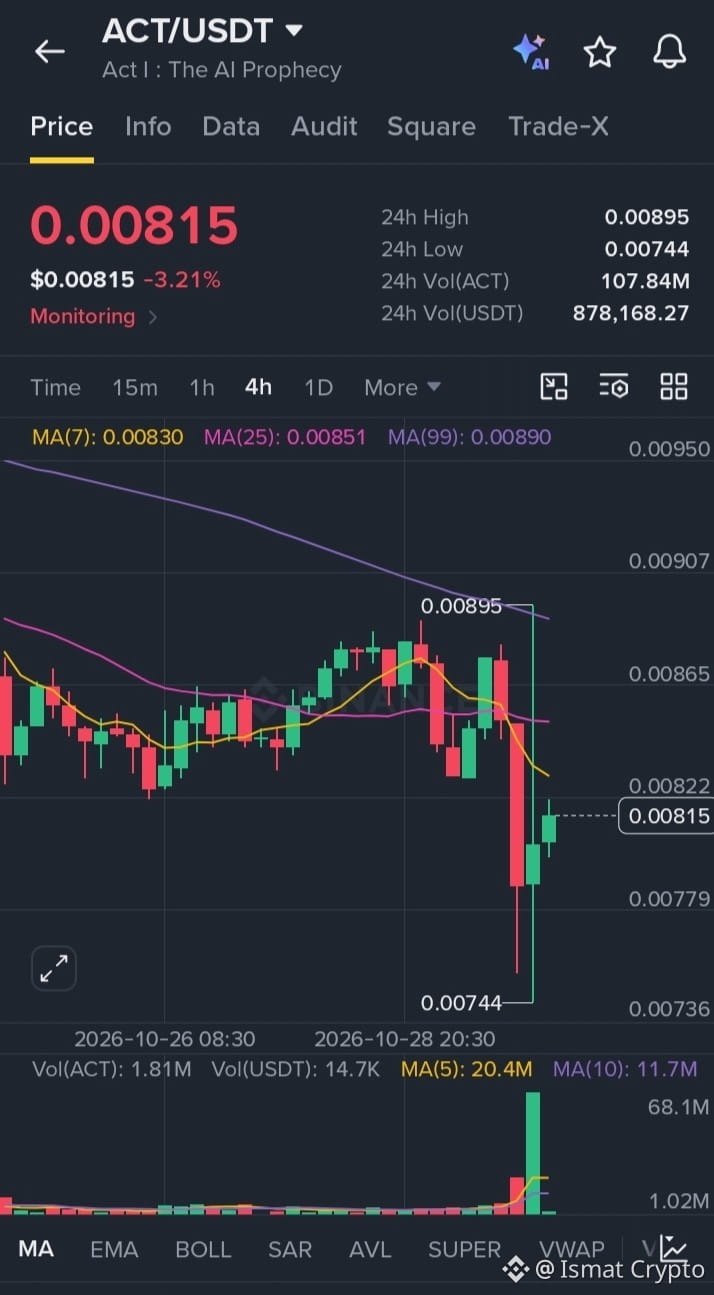
ACT/USDT Spot Setup: Mid-Term Accumulation Zone
Market analysis indicates that ACT (Act I: The AI Prophecy) is currently showing strong signs of stabilization around its local support level. After a healthy correction, the price is consolidating in a key accumulation zone, presenting an excellent risk-to-reward ratio for patient investors looking for solid gains.
Trade Details:
• Token: ACT/USDT
• Current Price: $0.00815
• Entry Zone: $0.00780 - $0.00820
• Holding Period: 45 to 60 Days ⏳
• Target Potential: 50% - 100%+ potential bounce from this accumulation area.
Why hold ACT right now?
1. Strong Support Base: The chart shows immediate buyers stepping in near the $0.00744 low, making this a high-probability reversal zone.
2. AI Narrative: As an AI-driven project, it holds strong mid-term narrative momentum.
3. Patience Pays: This is not a scalping trade. Giving it 45–60 days allows the market structure to completely mature and break out of the current consolidation.
Always manage your risk properly and spot-buy in parts.
#ACTUSDT #CryptoAnalysis #BinanceSquare #Altcoins #CryptoTrading
454
·
--
Übersetzung ansehen
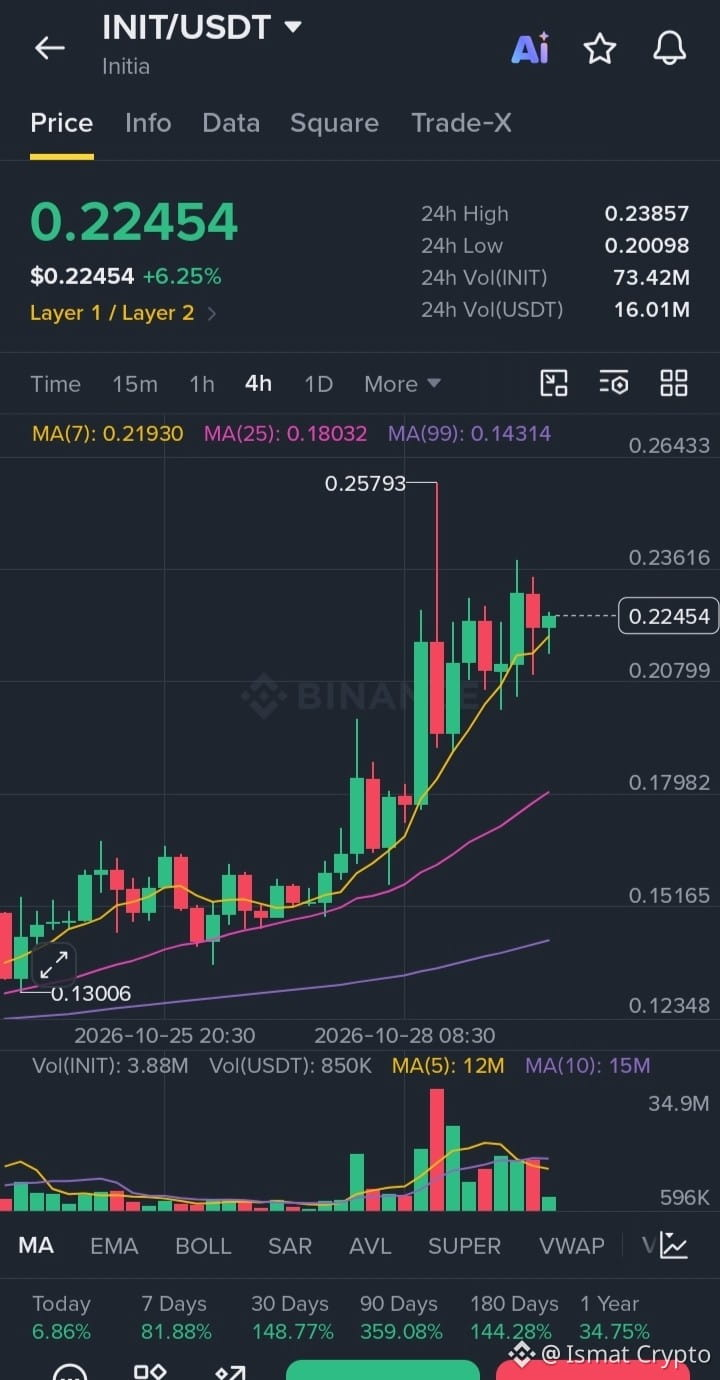
🚀 $INIT is on FIRE! +359% in 90 days is absolutely insane! 👇
The INIT/USDT 4H chart is showing textbook bullish momentum right now. We are up +6.25% today, currently trading at $0.22454.
Why I am highly bullish on this:
• Trend Alignment: MA(7) is riding perfectly above MA(25) and MA(99).
• Heavy Volume: Over 16M+ USDT traded in the last 24 hours. Buyers are in full control!
• Performance: 7D (+81%) | 30D (+148%) | 90D (+359%).
🎯 My Next Target: As long as it holds above $0.21, the next major leg up will easily test $0.26+. Don't FOMO, look for entries on healthy dips!
💬 What’s your play here? Are you buying the dip or waiting? Let me know below!
👉 Drop a FOLLOW and LIKE so you don't miss the next market alpha! 📈
#INIT #BinanceSquare #CryptoTrading #TechnicalAnalysis #Bullish
$INIT
{spot}(INITUSDT)
🚀 $INIT is on FIRE! +359% in 90 days is absolutely insane! 👇
The INIT/USDT 4H chart is showing textbook bullish momentum right now. We are up +6.25% today, currently trading at $0.22454.
Why I am highly bullish on this:
• Trend Alignment: MA(7) is riding perfectly above MA(25) and MA(99).
• Heavy Volume: Over 16M+ USDT traded in the last 24 hours. Buyers are in full control!
• Performance: 7D (+81%) | 30D (+148%) | 90D (+359%).
🎯 My Next Target: As long as it holds above $0.21, the next major leg up will easily test $0.26+. Don't FOMO, look for entries on healthy dips!
💬 What’s your play here? Are you buying the dip or waiting? Let me know below!
👉 Drop a FOLLOW and LIKE so you don't miss the next market alpha! 📈
#INIT #BinanceSquare #CryptoTrading #TechnicalAnalysis #Bullish
$INIT
357
·
--
Übersetzung ansehen
Gold ($XAUUSDT) is looking interesting on the 4H chart right now. After that solid pump from the $3,979 area, the price has cooled down a bit and is currently consolidating around $4,059.
It's basically hugging the 7 MA, showing that the market is waiting for the next big trigger. Here is what I’m keeping an eye on:
On the upside, $4,089 is the immediate ceiling. We need a clean 4-hour candle close above this recent high to confirm that the bulls are still in control and heading toward the 99 MA around $4,102.
If it pulls back, the zone between $4,031 and $4,045 should act as decent short-term support, thanks to the 25 MA. As long as we hold above $4,030, the short-term structure still looks intact. But if that breaks, we might see it retest the $3,979 level again.
For now, it feels like a waiting game. Expect some sideways chopping before the next real move happens. Keep your risk managed as always!
What are you guys doing here? Buying the dip or waiting to short the top? Let me know below! 👇
#XAUUSDT #Gold #Trading #TechnicalAnalysis #Binance
$XAU
{future}(XAUUSDT)
Gold ($XAUUSDT) is looking interesting on the 4H chart right now. After that solid pump from the $3,979 area, the price has cooled down a bit and is currently consolidating around $4,059.
It's basically hugging the 7 MA, showing that the market is waiting for the next big trigger. Here is what I’m keeping an eye on:
On the upside, $4,089 is the immediate ceiling. We need a clean 4-hour candle close above this recent high to confirm that the bulls are still in control and heading toward the 99 MA around $4,102.
If it pulls back, the zone between $4,031 and $4,045 should act as decent short-term support, thanks to the 25 MA. As long as we hold above $4,030, the short-term structure still looks intact. But if that breaks, we might see it retest the $3,979 level again.
For now, it feels like a waiting game. Expect some sideways chopping before the next real move happens. Keep your risk managed as always!
What are you guys doing here? Buying the dip or waiting to short the top? Let me know below! 👇
#XAUUSDT #Gold #Trading #TechnicalAnalysis #Binance
$XAU
250
·
--
Übersetzung ansehen
SKHYNIX is absolutely on fire right now! Up over +7.53% today!
Just looking at the 4H chart for SKHYNIXUSDT and the bulls are completely dominating the scene. We just pumped straight to a 24h high of 1,111.29 and currently holding strong around 1,102.86.
Look at that volume! A massive 1.44B USDT in 24 hours confirms this isn’t a fakeout—real money is stepping in. The price has cleanly broken above the MA(7) and MA(25), showing strong, organic buying momentum.
📈 My Personal Take:
The chart structure looks incredibly strong for a solid medium-term bag. I am personally looking at this as a high-potential holding for the next 45 to 60 days. The consolidation looks healthy, and this breakout could trigger a much bigger macro move.
What’s your game plan here? Are you jumping into the long train now, or waiting for a healthy retest around the 1,040 support zone? Let me know your targets below! 👇
#SKHYNIXUSDT #CryptoTrading #PositionTrading #Binance #Altcoins #Bullish #CryptoHolding
$SKHYNIX
{future}(SKHYNIXUSDT)
SKHYNIX is absolutely on fire right now! Up over +7.53% today!
Just looking at the 4H chart for SKHYNIXUSDT and the bulls are completely dominating the scene. We just pumped straight to a 24h high of 1,111.29 and currently holding strong around 1,102.86.
Look at that volume! A massive 1.44B USDT in 24 hours confirms this isn’t a fakeout—real money is stepping in. The price has cleanly broken above the MA(7) and MA(25), showing strong, organic buying momentum.
📈 My Personal Take:
The chart structure looks incredibly strong for a solid medium-term bag. I am personally looking at this as a high-potential holding for the next 45 to 60 days. The consolidation looks healthy, and this breakout could trigger a much bigger macro move.
What’s your game plan here? Are you jumping into the long train now, or waiting for a healthy retest around the 1,040 support zone? Let me know your targets below! 👇
#SKHYNIXUSDT #CryptoTrading #PositionTrading #Binance #Altcoins #Bullish #CryptoHolding
$SKHYNIX
323
·
--
Übersetzung ansehen
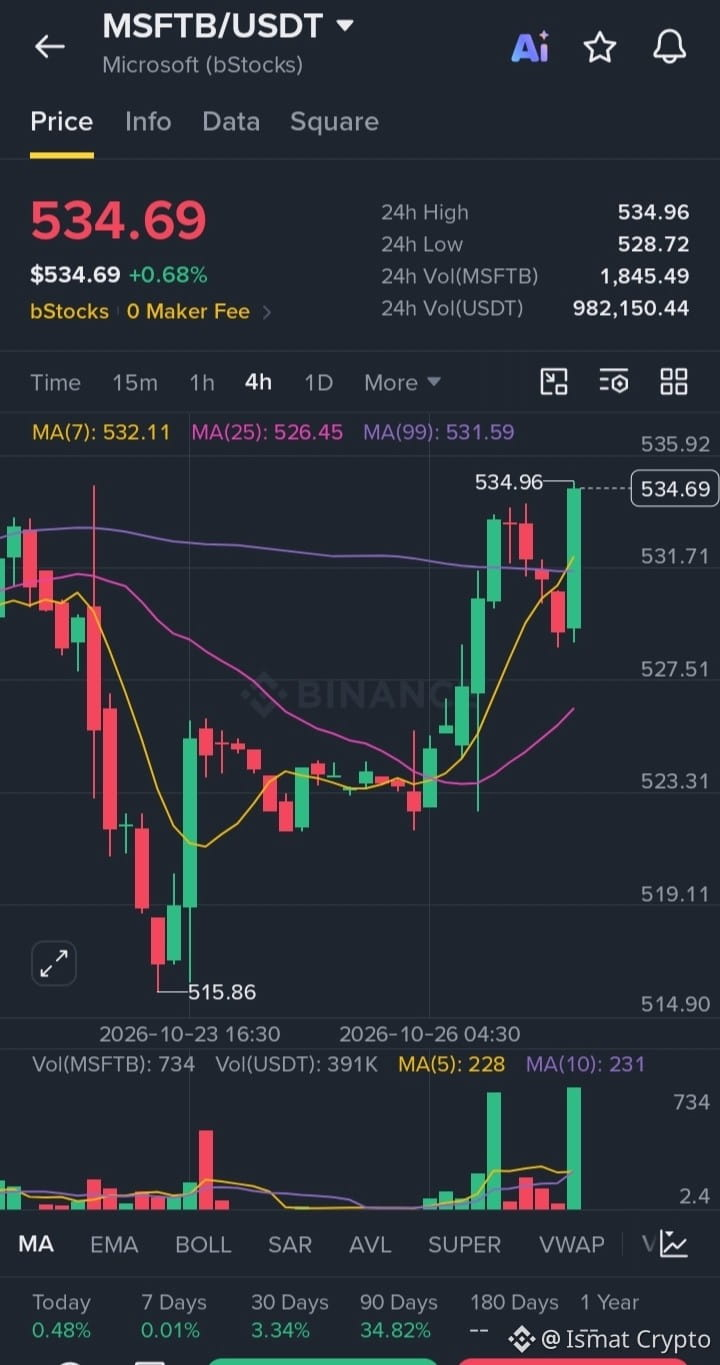
MSFTB/USDT Analysis: Bullish Momentum Gathering Pace!
1. A quick look at the 4-hour chart shows highly optimistic signals.
2. After hitting a local bottom at $515.86, the price has strongly recovered.
3. The tokenized stock is currently trading in green at $534.69 (+0.68%).
4. Buyers have successfully pushed the price above the key MA(99) line at $531.59.
5. This major cross-over signals a strong medium-term trend reversal.
6. Immediate short-term support is well-maintained by the MA(7) at $532.11.
7. The market is now actively testing its 24h high resistance at $534.96.
8. A clean 4-hour candle close above this level could trigger a major breakout.
9. 24h USDT trading volume has picked up rapidly, approaching nearly $1M.
10. If a temporary rejection happens, strong support lies between $531 and $532.
11. The overall chart structure remains heavily in favor of the buyers right now.
12. Keep this pair on your watchlist for potential continuation entries today!
What are your targets for MSFTB? Let's discuss in the comments below! 👇
$MSFTB
{spot}(MSFTBUSDT)
MSFTB/USDT Analysis: Bullish Momentum Gathering Pace!
1. A quick look at the 4-hour chart shows highly optimistic signals.
2. After hitting a local bottom at $515.86, the price has strongly recovered.
3. The tokenized stock is currently trading in green at $534.69 (+0.68%).
4. Buyers have successfully pushed the price above the key MA(99) line at $531.59.
5. This major cross-over signals a strong medium-term trend reversal.
6. Immediate short-term support is well-maintained by the MA(7) at $532.11.
7. The market is now actively testing its 24h high resistance at $534.96.
8. A clean 4-hour candle close above this level could trigger a major breakout.
9. 24h USDT trading volume has picked up rapidly, approaching nearly $1M.
10. If a temporary rejection happens, strong support lies between $531 and $532.
11. The overall chart structure remains heavily in favor of the buyers right now.
12. Keep this pair on your watchlist for potential continuation entries today!
What are your targets for MSFTB? Let's discuss in the comments below! 👇
$MSFTB
44
·
--
Übersetzung ansehen
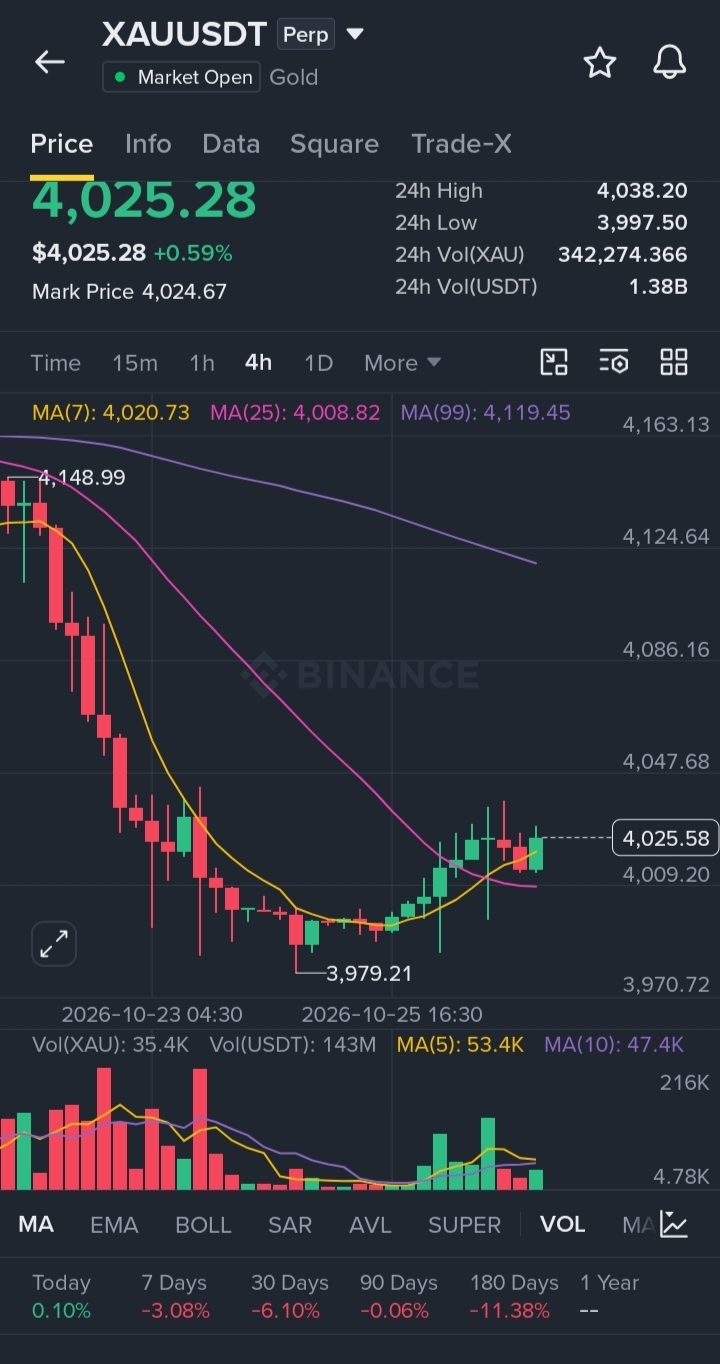
🥇 Huge Move Coming on Gold ($XAU) – Buy and Hold Strategy!
Thousands of tokens come and go, but nothing matches the ultimate stability and trust of Gold ($XAU). Gold is, and always will be, the safest haven. Looking at the current chart setup, missing this accumulation zone could be a massive missed opportunity!
If you look closely at the 4H chart, Gold has established a rock-solid bottom (support) around the 3,979 level. After a clean rejection from that lower zone, the candles are now steadily reversing upwards, currently trading at 4,025. This is a clear indicator that institutional buyers and whales are stepping back into the market.
💡 My Personal Strategy (Long-Term Plan):
I am not looking for quick scalps or stressful daily trading here. Real wealth is created when you buy a premium asset at the right level and let time do the work. My plan is to Buy and Hold this position for at least 45 to 60 days.
* Buy Zone: The current price (4,025) down to the 4,000 psychological level is a perfect entry area.
* Holding Period: 45 to 60 Days.
* Targets: In the coming weeks, we can easily expect a rally back towards 4,080, followed by a test of 4,150+.
This is the kind of trade that lets you sleep peacefully while your portfolio grows. Stay away from the market noise, secure your entry at good levels, and let patience reward you.
What is your take on this? Are you joining this 60-day holding blueprint? Let me know in the comments below! 👇
#GoldTrading #XAUUSDT #CryptoInvesting #TradingSignal #BinanceSquare
$XAU
{future}(XAUUSDT)
🥇 Huge Move Coming on Gold ($XAU ) – Buy and Hold Strategy!
Thousands of tokens come and go, but nothing matches the ultimate stability and trust of Gold ($XAU ). Gold is, and always will be, the safest haven. Looking at the current chart setup, missing this accumulation zone could be a massive missed opportunity!
If you look closely at the 4H chart, Gold has established a rock-solid bottom (support) around the 3,979 level. After a clean rejection from that lower zone, the candles are now steadily reversing upwards, currently trading at 4,025. This is a clear indicator that institutional buyers and whales are stepping back into the market.
💡 My Personal Strategy (Long-Term Plan):
I am not looking for quick scalps or stressful daily trading here. Real wealth is created when you buy a premium asset at the right level and let time do the work. My plan is to Buy and Hold this position for at least 45 to 60 days.
* Buy Zone: The current price (4,025) down to the 4,000 psychological level is a perfect entry area.
* Holding Period: 45 to 60 Days.
* Targets: In the coming weeks, we can easily expect a rally back towards 4,080, followed by a test of 4,150+.
This is the kind of trade that lets you sleep peacefully while your portfolio grows. Stay away from the market noise, secure your entry at good levels, and let patience reward you.
What is your take on this? Are you joining this 60-day holding blueprint? Let me know in the comments below! 👇
#GoldTrading #XAUUSDT #CryptoInvesting #TradingSignal #BinanceSquare
$XAU
183
·
--
Übersetzung ansehen
Congratulations everyone 💐
Congratulations everyone 💐


Binance TG Community
·
--
Gewinnerliste der Binance-Square-Mid-Autumn-Kampagne
🎂 Liebe Binancianer, vielen Dank an alle, die an unserer Moon-Cake-Kreationskampagne auf Binance Square teilgenommen haben! 🎉 Eure Kreativität und die fantastischen Kuchendesigns haben dieses Fest zu etwas ganz Besonderem gemacht. 💛 🏆 Die 250 glücklichen Gewinner wurden bekannt gegeben! Herzlichen Glückwunsch an alle Gewinner und ein großes Dankeschön an alle, die mitgemacht und ihre Kreativität mit uns geteilt haben! 🥳
Die Prämien werden innerhalb von 10 Tagen nach dieser Ankündigung verteilt.
Dein Square-Benutzername lautet:
@Cripp
@CazadorSobresRojos
@OlexanderL
@MariiaL
Die Prämien werden innerhalb von 10 Tagen nach dieser Ankündigung verteilt.
Dein Square-Benutzername lautet:
@Cripp
@CazadorSobresRojos
@OlexanderL
@MariiaL

·
--
📊 Markt-Check: 3 Charts mit explosivem Potenzial! Wohin fließt das Geld als Nächstes?
Ich beobachte die 4-Stunden-Charts von $CHIP, $ERA und $NIGHT genau. Alle drei zeigen starkes Momentum, befinden sich aber in sehr unterschiedlichen Phasen:
🔹 CHIP -> Parabolischer Ausbruch (hohes Risiko, hohe Gewinnchancen)
🔹 ERA -> Akkumulations-/Erholungsphase nach der Korrektur
🔹 NIGHT -> Umkehrversuch, der auf wichtigen Widerstand an der MA(99) trifft
Schreibt eure Prognose unten in die Kommentare: Welcher dieser Coins legt als Nächstes um 2x zu? 🚀👇
#BinanceSquare #CryptoMarket #TechnicalAnalysis
$CHIP
{spot}(CHIPUSDT)
$ERA
{spot}(ERAUSDT)
$NIGHT
{spot}(NIGHTUSDT)
📊 Markt-Check: 3 Charts mit explosivem Potenzial! Wohin fließt das Geld als Nächstes?
Ich beobachte die 4-Stunden-Charts von $CHIP , $ERA und $NIGHT genau. Alle drei zeigen starkes Momentum, befinden sich aber in sehr unterschiedlichen Phasen:
🔹 CHIP -> Parabolischer Ausbruch (hohes Risiko, hohe Gewinnchancen)
🔹 ERA -> Akkumulations-/Erholungsphase nach der Korrektur
🔹 NIGHT -> Umkehrversuch, der auf wichtigen Widerstand an der MA(99) trifft
Schreibt eure Prognose unten in die Kommentare: Welcher dieser Coins legt als Nächstes um 2x zu? 🚀👇
#BinanceSquare #CryptoMarket #TechnicalAnalysis
$CHIP
$ERA
$NIGHT
530
·
--
Übersetzung ansehen
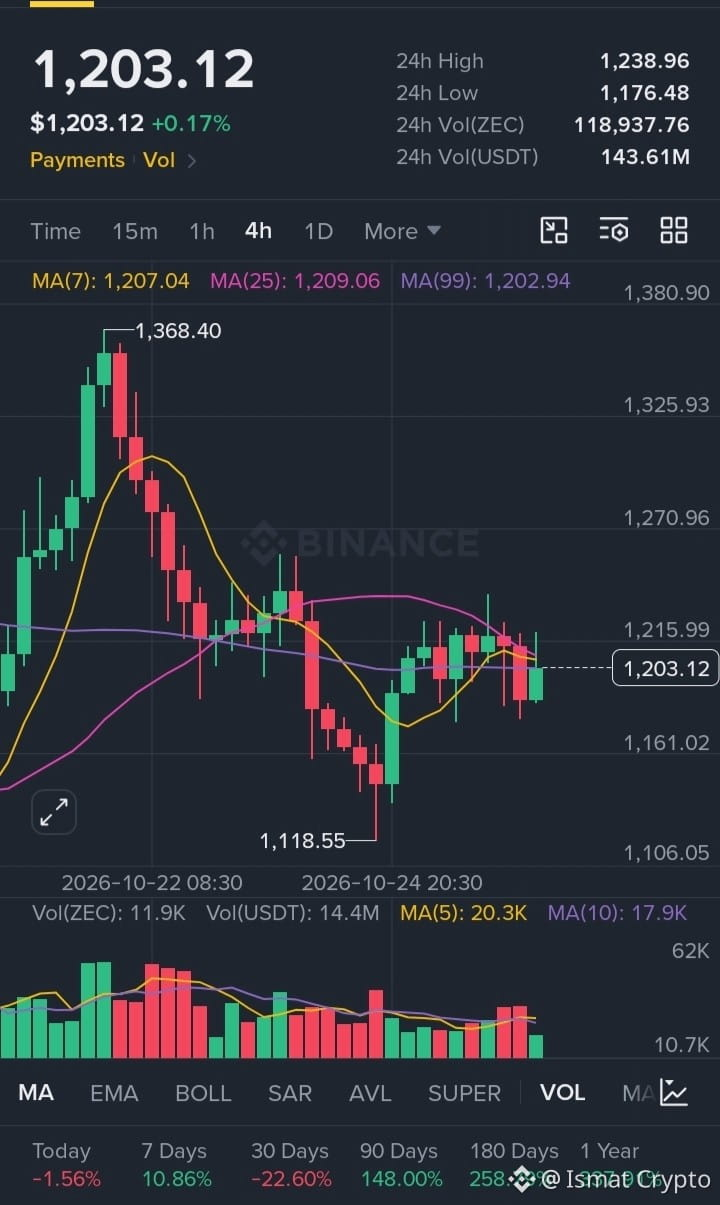
ZEC/USDT is currently consolidating at a very crucial level around 1,203.
The current structure suggests that the downside is limited and a strong upward rally is brewing.
My strategy here is simple: accumulate at current prices and hold it for at least 45 to 60 days.
Mid-term targets look highly promising as the market prepares for the next leg up. Secure your entries and let the market do its work! 📊
#ZEC #Crypto #TradingInsights #SpotTrading #Binance
$ZEC
{spot}(ZECUSDT)
ZEC/USDT is currently consolidating at a very crucial level around 1,203.
The current structure suggests that the downside is limited and a strong upward rally is brewing.
My strategy here is simple: accumulate at current prices and hold it for at least 45 to 60 days.
Mid-term targets look highly promising as the market prepares for the next leg up. Secure your entries and let the market do its work! 📊
#ZEC #Crypto #TradingInsights #SpotTrading #Binance
$ZEC
278
·
--
Übersetzung ansehen
#BinancePick in and now placing my forecasts for the #BinancePick challenge! 🌟 The 1M USDC prize pool is massive. Wishing good luck to everyone participating. Drop your top coin predictions in the comments! 🪙✨
#BinancePick in and now placing my forecasts for the #BinancePick challenge! 🌟 The 1M USDC prize pool is massive. Wishing good luck to everyone participating. Drop your top coin predictions in the comments! 🪙✨

3
·
--
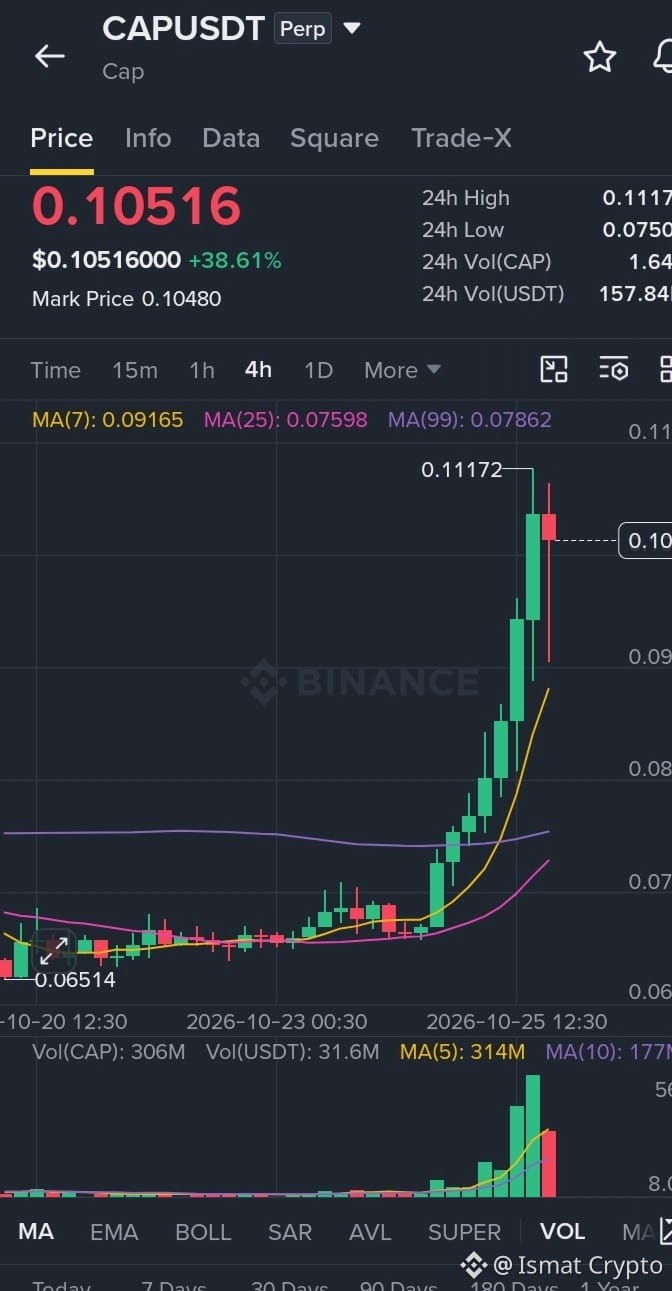
CAP/USDT zeigt sich heute äußerst stark: Der Kurs ist um über 38 % gestiegen und liegt derzeit bei etwa 0,10516 $.
Auf dem 4-Stunden-Chart wird der Ausbruch durch einen massiven Anstieg des Handelsvolumens gestützt. Das 24-Stunden-Volumen erreichte 1,64 Mrd. CAP. Der Kurs hat die kurzfristigen gleitenden Durchschnitte problemlos überwunden, und diese drehen nun nach oben und bilden eine solide Unterstützungszone.
Kurzzeitig erreichte der Kurs ein Hoch von 0,11172 $, und aktuell konsolidiert der Markt knapp darunter. Können die Käufer den Kurs über der psychologisch wichtigen Marke von 0,100 $ halten, könnte es bald einen weiteren Anstieg auf neue Höchststände geben. Nach einer derart starken Rallye ist es jedoch auch ratsam, auf einen gesunden erneuten Test der Unterstützungsniveaus zu achten.
Was haltet ihr von dieser Bewegung? Setzt ihr auf das Momentum oder wartet ihr auf einen Rücksetzer?
#CAPUSDT #Crypto #Trading #TechnicalAnalysis #BinanceSquare
$CAP
{future}(CAPUSDT)
CAP/USDT zeigt sich heute äußerst stark: Der Kurs ist um über 38 % gestiegen und liegt derzeit bei etwa 0,10516 $.
Auf dem 4-Stunden-Chart wird der Ausbruch durch einen massiven Anstieg des Handelsvolumens gestützt. Das 24-Stunden-Volumen erreichte 1,64 Mrd. CAP. Der Kurs hat die kurzfristigen gleitenden Durchschnitte problemlos überwunden, und diese drehen nun nach oben und bilden eine solide Unterstützungszone.
Kurzzeitig erreichte der Kurs ein Hoch von 0,11172 $, und aktuell konsolidiert der Markt knapp darunter. Können die Käufer den Kurs über der psychologisch wichtigen Marke von 0,100 $ halten, könnte es bald einen weiteren Anstieg auf neue Höchststände geben. Nach einer derart starken Rallye ist es jedoch auch ratsam, auf einen gesunden erneuten Test der Unterstützungsniveaus zu achten.
Was haltet ihr von dieser Bewegung? Setzt ihr auf das Momentum oder wartet ihr auf einen Rücksetzer?
#CAPUSDT #Crypto #Trading #TechnicalAnalysis #BinanceSquare
$CAP
331
·
--
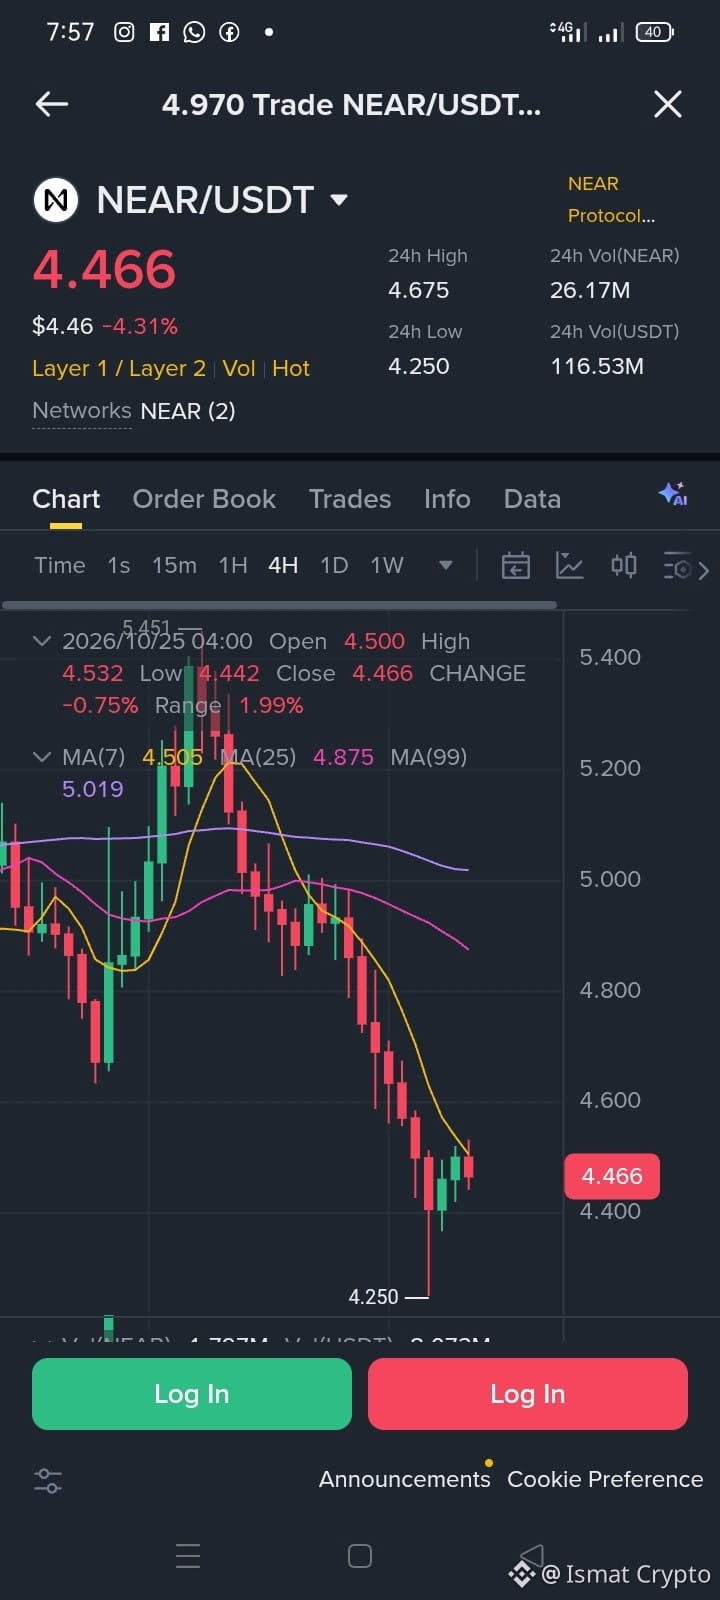
🚨 NEAR vs. ICP: Ist das der ultimative Dip oder eine gefährliche Falle? 🤔
Ein Blick auf die Charts zeigt: Sowohl NEAR als auch ICP stehen heute unter starkem Abwärtsdruck. NEAR/USDT wird derzeit bei etwa $4.466 (-4.31 %) gehandelt, während ICP/USDT auf $2.642 (-3.37 %) gefallen ist.
Beide Layer-1-Giganten befinden sich an kritischen Unterstützungszonen. Diese plötzliche Marktkorrektur macht viele Kleinanleger nervös, aber erfahrene Anleger wissen: Maximale Panik bietet oft auch maximale Chancen. 📉
Bereiten die Wale einen kräftigen Aufschwung vor, oder stehen uns noch weitere Verluste bevor, bevor eine Trendwende einsetzt? Für Spot-Trader war es in der Vergangenheit meist die profitabelste Strategie, an Tagen mit roten Zahlen solide Projekte anzuhäufen.
👇 Was machst du jetzt?
Verkaufst du panisch, hältst du durch oder kaufst du gierig diesen Dip? Schreib mir deine Kursziele in die Kommentare! Vergiss nicht, diesen Beitrag zu liken und zu folgen, um weitere tägliche Updates zu erhalten. 👁️🗨️
#NEAR $NEAR #ICP $ICP #KryptoAnalyse #KaufeDenDip #BinanceSquare
$NEAR
{spot}(NEARUSDT)
🚨 NEAR vs. ICP: Ist das der ultimative Dip oder eine gefährliche Falle? 🤔
Ein Blick auf die Charts zeigt: Sowohl NEAR als auch ICP stehen heute unter starkem Abwärtsdruck. NEAR/USDT wird derzeit bei etwa $4.466 (-4.31 %) gehandelt, während ICP/USDT auf $2.642 (-3.37 %) gefallen ist.
Beide Layer-1-Giganten befinden sich an kritischen Unterstützungszonen. Diese plötzliche Marktkorrektur macht viele Kleinanleger nervös, aber erfahrene Anleger wissen: Maximale Panik bietet oft auch maximale Chancen. 📉
Bereiten die Wale einen kräftigen Aufschwung vor, oder stehen uns noch weitere Verluste bevor, bevor eine Trendwende einsetzt? Für Spot-Trader war es in der Vergangenheit meist die profitabelste Strategie, an Tagen mit roten Zahlen solide Projekte anzuhäufen.
👇 Was machst du jetzt?
Verkaufst du panisch, hältst du durch oder kaufst du gierig diesen Dip? Schreib mir deine Kursziele in die Kommentare! Vergiss nicht, diesen Beitrag zu liken und zu folgen, um weitere tägliche Updates zu erhalten. 👁️🗨️
#NEAR $NEAR #ICP $ICP #KryptoAnalyse #KaufeDenDip #BinanceSquare
$NEAR
2
914
·
--
Übersetzung ansehen
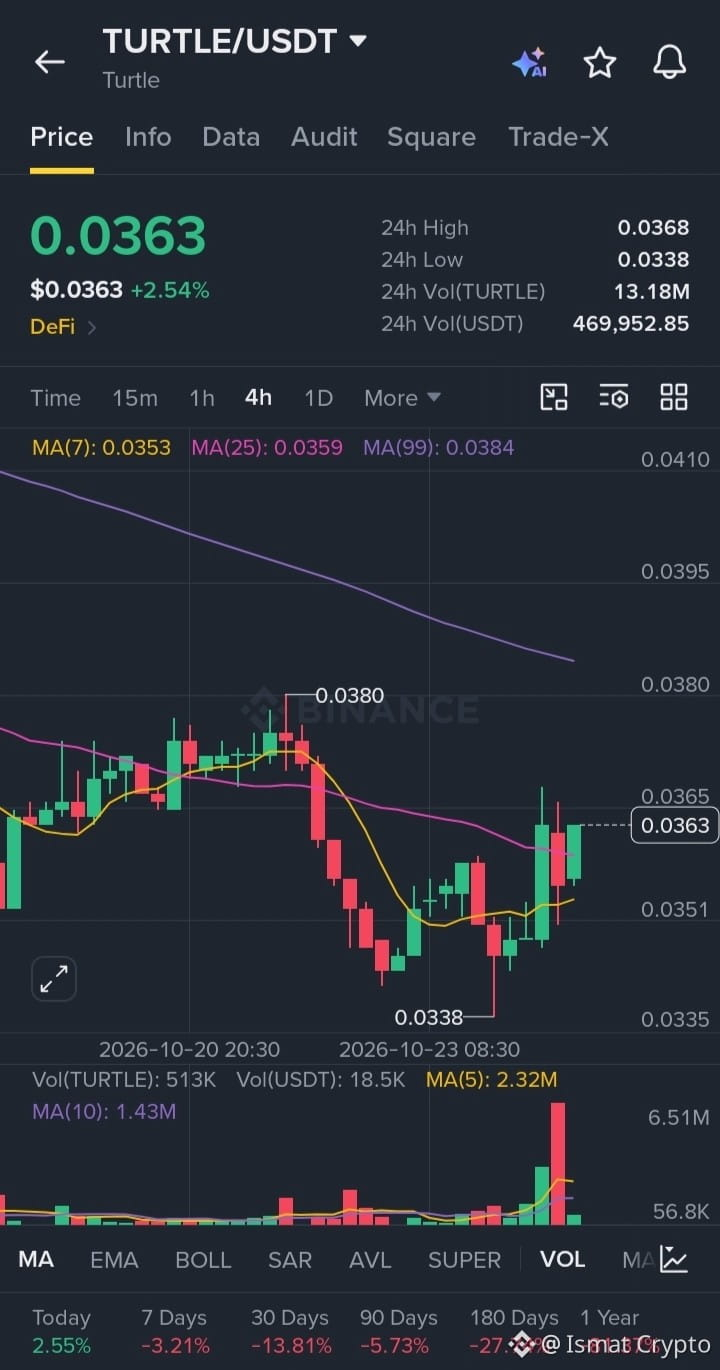
Slow and steady wins the race! 🐢
$TURTLE is flashing some solid signs of recovery on the 4H chart, holding a steady +2.54% gain today. Volume is picking up, and the momentum is looking clean.
⚠️ Crucial Strategy: For the best results, patience is key with this one. Make sure to hold it for at least 45 to 60 days after buying to catch the full potential of this move. 📉⏳
Eyes on the immediate resistance next! 📈
What are your thoughts on this hold? Let me know below! 👇
#TURTLE #Crypto #Trading #BinanceSquare #Altcoins #CryptoInvesting
$TURTLE
{spot}(TURTLEUSDT)
Slow and steady wins the race! 🐢
$TURTLE is flashing some solid signs of recovery on the 4H chart, holding a steady +2.54% gain today. Volume is picking up, and the momentum is looking clean.
⚠️ Crucial Strategy: For the best results, patience is key with this one. Make sure to hold it for at least 45 to 60 days after buying to catch the full potential of this move. 📉⏳
Eyes on the immediate resistance next! 📈
What are your thoughts on this hold? Let me know below! 👇
#TURTLE #Crypto #Trading #BinanceSquare #Altcoins #CryptoInvesting
$TURTLE
2
272
·
--
Übersetzung ansehen
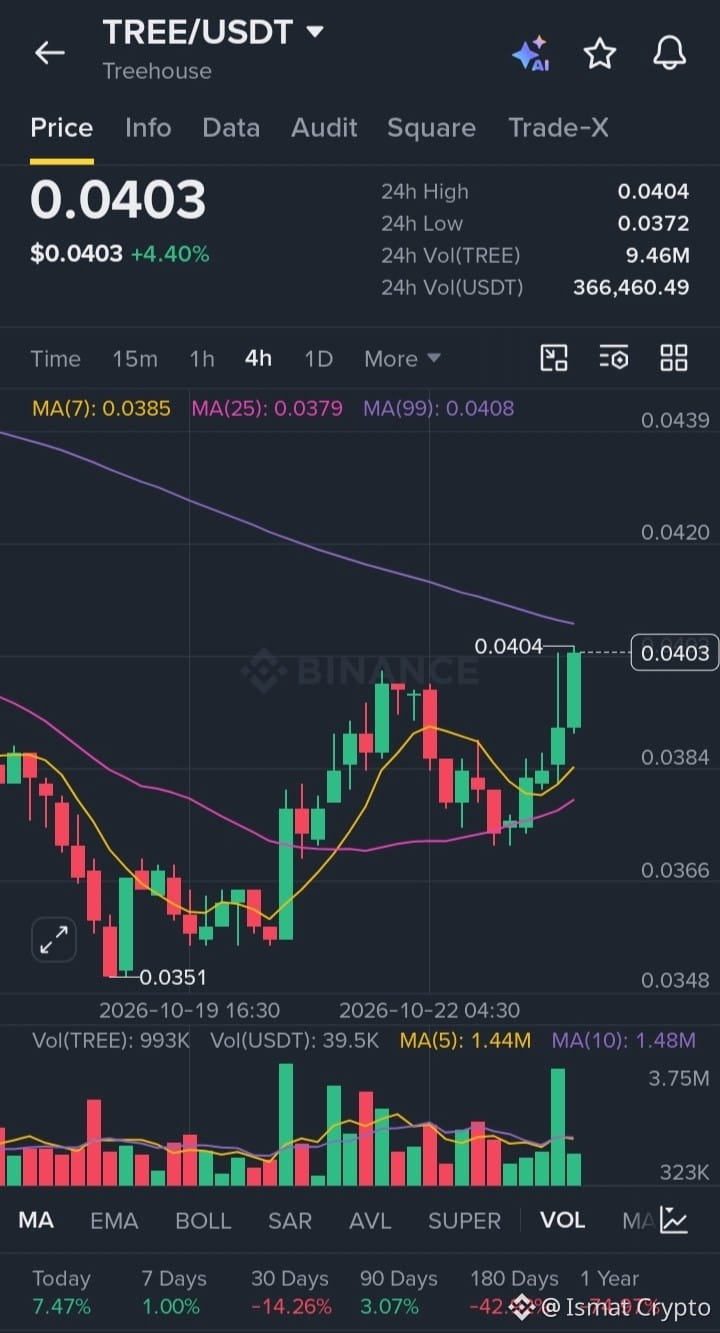
Looking at the TREE/USDT chart right now, and things are starting to look interesting. The price is sitting around 0.0403, showing a decent 4.40% recovery.
If you notice the 4h timeframe, it recently bounced back well from the 0.0351 support level. Right now, it's successfully trading above both the MA(7) and MA(25) lines, which is a good sign of short-term bullish momentum.
Volume is also picking up slightly compared to previous days. It looks like the accumulation phase at lower levels is almost done, and a solid breakout could be on the cards soon.
My plan for this one is pretty straightforward. I am looking to buy some here and hold it patiently for the next 45 to 60 days. This target gives the market enough time to break through local resistance levels and print a proper rally.
As always, spot trading requires patience, so no need to panic on small daily moves. Just buy, hold, and let the setup play out. What do you guys think about TREE? Are you holding or skipping this one?
#TREEUSDT #CryptoTrading #SpotHolding #BinanceSquare
$TREE
{spot}(TREEUSDT)
Looking at the TREE/USDT chart right now, and things are starting to look interesting. The price is sitting around 0.0403, showing a decent 4.40% recovery.
If you notice the 4h timeframe, it recently bounced back well from the 0.0351 support level. Right now, it's successfully trading above both the MA(7) and MA(25) lines, which is a good sign of short-term bullish momentum.
Volume is also picking up slightly compared to previous days. It looks like the accumulation phase at lower levels is almost done, and a solid breakout could be on the cards soon.
My plan for this one is pretty straightforward. I am looking to buy some here and hold it patiently for the next 45 to 60 days. This target gives the market enough time to break through local resistance levels and print a proper rally.
As always, spot trading requires patience, so no need to panic on small daily moves. Just buy, hold, and let the setup play out. What do you guys think about TREE? Are you holding or skipping this one?
#TREEUSDT #CryptoTrading #SpotHolding #BinanceSquare
$TREE
2
2
277
·
--
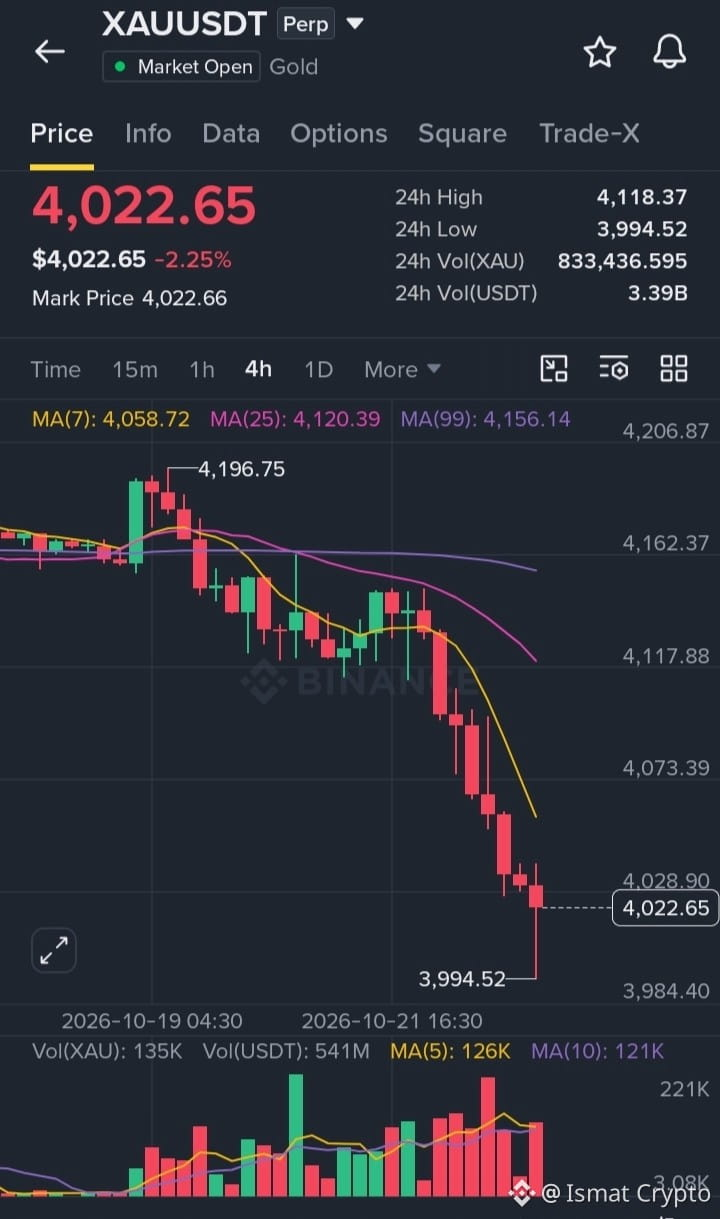
Meine Einschätzung zu Gold (XAUUSDT) – Perfekter Dip zum Kaufen! 📉🚀
Gold gerät gerade unter Druck und wird bei 4.022,65 gehandelt (minus 2,25 %).
Der 4-Stunden-Chart ist bearish und testet ein jüngstes Tief bei etwa 3.994,52.
Die Kurse liegen unter wichtigen gleitenden Durchschnitten – ein Zeichen für kurzfristige Panik.
Doch hier ist mein Plan: Ich sehe diesen Rückgang als attraktive Rabattzone!
Wenn du hier kaufst, solltest du die Position 45 bis 60 Tage halten.
Von diesem Niveau aus sieht diese mittelfristige Strategie äußerst profitabel aus.
Die höheren Zeitebenen sehen stark aus, und eine deutliche Erholung wird bald erwartet.
Wir könnten problemlos eine Erholung in Richtung der Widerstandszone bei 4.118+ anpeilen.
Vermeide einen hohen Hebel; Spot-Käufe oder ein konservativer Ansatz sind hier die kluge Wahl.
Kaufst du diesen 2-Monats-Dip mit mir oder wartest du noch? Schreib es in die Kommentare! 👇
#Gold #XAUUSDT #TradingStrategy #BinanceSquare #CryptoCommunity
$XAU
{future}(XAUUSDT)
Meine Einschätzung zu Gold (XAUUSDT) – Perfekter Dip zum Kaufen! 📉🚀
Gold gerät gerade unter Druck und wird bei 4.022,65 gehandelt (minus 2,25 %).
Der 4-Stunden-Chart ist bearish und testet ein jüngstes Tief bei etwa 3.994,52.
Die Kurse liegen unter wichtigen gleitenden Durchschnitten – ein Zeichen für kurzfristige Panik.
Doch hier ist mein Plan: Ich sehe diesen Rückgang als attraktive Rabattzone!
Wenn du hier kaufst, solltest du die Position 45 bis 60 Tage halten.
Von diesem Niveau aus sieht diese mittelfristige Strategie äußerst profitabel aus.
Die höheren Zeitebenen sehen stark aus, und eine deutliche Erholung wird bald erwartet.
Wir könnten problemlos eine Erholung in Richtung der Widerstandszone bei 4.118+ anpeilen.
Vermeide einen hohen Hebel; Spot-Käufe oder ein konservativer Ansatz sind hier die kluge Wahl.
Kaufst du diesen 2-Monats-Dip mit mir oder wartest du noch? Schreib es in die Kommentare! 👇
#Gold #XAUUSDT #TradingStrategy #BinanceSquare #CryptoCommunity
$XAU
1
251
·
--
🚀 DIE 3 TOP-PERFORMER-COINS HEUTE: KAUFCHANCE ODER FALLE? 🚨
Der Markt bewegt sich schnell! Hier sind die heutigen Top-Gewinner im 4-Stunden-Chart:
⚡ $BMT: Steht bei 0,02750 $ (+27,55 %). Massiver Ausbruch beim Handelsvolumen! Die Bullen peilen als Nächstes über 0,030 $ an.
🔥 $SOXSB: Explodiert auf 52,70 $ (+19,85 %). Bildet konstant höhere Tiefs. Das Momentum ist extrem stark.
💎 $GTC: Wird bei 0,29503 $ gehandelt (+8,79 %). Erholt sich stetig. Wenn der Kurs die Marke von 0,300 $ durchbricht, ist mit einer starken Rally zu rechnen!
⚠️ Warnung: Die Volatilität ist extrem hoch. Nicht blind aus FOMO einsteigen – setzt unbedingt einen strikten Stop-Loss!
👇 Welchen Coin haltet ihr? Schreibt eure Kursziele unten in die Kommentare!
👉 FOLGT MIR für tägliche Alpha-Updates und starke Signale! 🔥
#BinanceSquare #CryptoTrading #BMT #GTC #WhaleAlert #BullRun
1
414
Anmelden und weiter Inhalte entdecken
Krypto-Nutzer weltweit auf Binance Square kennenlernen
⚡️ Bleib in Sachen Krypto stets am Puls.
💬 Die weltgrößte Kryptobörse vertraut darauf.
👍 Erhalte verlässliche Einblicke von verifizierten Creators.
E-Mail-Adresse/Telefonnummer
Trendthemen
BinanceProcesses$4.65BWithdrawals
10,386 Aufrufe
79 Kommentare
Binance verarbeitet nach Wiederaufnahme Auszahlungen in Höhe von 4,65 Milliarden US-Dollar – Nettoabfluss von 3,64 Milliarden US-Dollar entspricht 2,1 % der Vermögenswerte im Wert von 171 Milliarden US-Dollar
Binance News
·32 Likes
·8.6k Aufrufe
WithdrawalsBack: 15 networks live
5,604 Aufrufe
112 Kommentare
BinanceUpdatesProofofReservesAddresses
95,828 Aufrufe
1,374 Kommentare