

HTrader0
78 Beiträge

HTrader0
Melden
Nutzer blockieren
Crypto Infulencer❤️
15 Following
50 Follower
28 Like gegeben
Beiträge
Alle
Zitierungen
·
--
Übersetzung ansehen
I told You If U are Missed You Are Regret
Buy Now For some Amount this make you Rich
$LYN
#foryoupage
#TrendingTopic
#TrendingPredictions
I told You If U are Missed You Are Regret
Buy Now For some Amount this make you Rich
$LYN
#foryoupage
#TrendingTopic
#TrendingPredictions
Buy Now For some Amount this make you Rich
$LYN
#foryoupage
#TrendingTopic
#TrendingPredictions
1
436
·
--

Artikel
Übersetzung ansehen
OCTOBER 2026 CRYPTO MARKET OUTLOOK — BULLISH OR BEARISH?October has arrived, and the biggest question for crypto traders is simple:
Will Bitcoin continue its recovery, or is another major correction coming?
After a strong Q3 recovery, BTC entered October around the $84K–$85K area. Bitcoin gained more than 40% during Q3, while U.S. spot Bitcoin ETFs recorded around $2.4B of weekly inflows in late September — their strongest weekly inflow since October 2025.
But the market is not risk-free.
🟢 WHY OCTOBER COULD BE BULLISH
The biggest positive factor is institutional demand.
ETF inflows have returned strongly, showing that large capital is still willing to accumulate BTC. Binance Research also noted that BTC reclaimed important weekly trend levels, although confirmation still depends on whether demand continues.
Another positive development came from U.S. inflation.
August PCE inflation came in at 3.4% YoY, below the expected 3.7%, which reduced immediate expectations for an October Federal Reserve rate hike.
Historically, October has also been a strong month for Bitcoin, although historical seasonality is not a guarantee of future performance.
🔴 BUT THERE IS A RISK
Bitcoin has already made a large recovery.
That means some holders may use higher prices to take profits. At the same time, Treasury yields remain elevated and oil prices have created additional macro uncertainty. Binance Research specifically highlighted the importance of BTC holding its reclaimed weekly trend level while yields remain above 5%.
So the October move may not be a straight pump.
We could see:
Liquidity sweep → correction → accumulation → expansion
before the next major directional move.
🎯 MY OCTOBER MARKET FRAMEWORK
I am watching $80K–$82K as a major BTC support/liquidity area.
🟢 Bullish scenario
If BTC:
Holds $80K–$82K
→ Reclaims $86K
→ Builds acceptance above it
→ Spot/ETF demand continues
then the market can start targeting higher liquidity.
Potential upside areas to watch:
$96K–$100K
and, if momentum becomes strong:
$110K–$112K
These are scenario levels, not guaranteed targets.
⚪ Neutral scenario
BTC remains trapped between major liquidity zones:
$80K–$96K
In this environment, expect:
Range → liquidity sweeps → fake breakouts → reversals
This would favor waiting for confirmation instead of chasing candles.
🔴 Bearish scenario
The important warning would be:
BTC loses $80K–$82K + accepts below the zone.
If price breaks the level but immediately recovers, that could simply be a liquidity sweep.
But if price accepts below it and recovery attempts fail, downside liquidity becomes more important.
Potential lower areas to monitor:
$72K–$68K
and deeper:
$62K–$58K
🧠 THE REAL GAME IN OCTOBER
For me, the question isn't simply:
“Bullish or bearish?”
The better question is:
“Where is liquidity, and what does price do after taking it?”
Watch:
• External liquidity
• Internal liquidity
• BTC.D
• ETF flows
• CVD
• Open Interest
• Funding
• Liquidation clusters
• Delta / order flow
• Acceptance vs rejection
If liquidity is swept and aggressive selling cannot push price lower, that tells us something.
If buyers attack a level but cannot create acceptance above it, that also tells us something.
Price reaction after liquidity is more important than the liquidity level itself.
🔥 OCTOBER 2026 BIAS
My framework is:
🟢 BULLISH — BUT CONDITIONAL
I don't expect October to simply go up every day.
The key area I'm watching is:
$80K–$82K
Above and holding this zone → bullish continuation remains possible.
Below it with acceptance → bearish correction scenario becomes increasingly relevant.
Don't trade the prediction. Trade the confirmation.
By Hami 👑
#Bitcoin #BTC #Crypto #CryptoMarket #October2026 #BitcoinAnalysis #BTCUSDT #Trading #Liquidity #Orderflow
OCTOBER 2026 CRYPTO MARKET OUTLOOK — BULLISH OR BEARISH?
October has arrived, and the biggest question for crypto traders is simple:
Will Bitcoin continue its recovery, or is another major correction coming?
After a strong Q3 recovery, BTC entered October around the $84K–$85K area. Bitcoin gained more than 40% during Q3, while U.S. spot Bitcoin ETFs recorded around $2.4B of weekly inflows in late September — their strongest weekly inflow since October 2025.
But the market is not risk-free.
🟢 WHY OCTOBER COULD BE BULLISH
The biggest positive factor is institutional demand.
ETF inflows have returned strongly, showing that large capital is still willing to accumulate BTC. Binance Research also noted that BTC reclaimed important weekly trend levels, although confirmation still depends on whether demand continues.
Another positive development came from U.S. inflation.
August PCE inflation came in at 3.4% YoY, below the expected 3.7%, which reduced immediate expectations for an October Federal Reserve rate hike.
Historically, October has also been a strong month for Bitcoin, although historical seasonality is not a guarantee of future performance.
🔴 BUT THERE IS A RISK
Bitcoin has already made a large recovery.
That means some holders may use higher prices to take profits. At the same time, Treasury yields remain elevated and oil prices have created additional macro uncertainty. Binance Research specifically highlighted the importance of BTC holding its reclaimed weekly trend level while yields remain above 5%.
So the October move may not be a straight pump.
We could see:
Liquidity sweep → correction → accumulation → expansion
before the next major directional move.
🎯 MY OCTOBER MARKET FRAMEWORK
I am watching $80K–$82K as a major BTC support/liquidity area.
🟢 Bullish scenario
If BTC:
Holds $80K–$82K
→ Reclaims $86K
→ Builds acceptance above it
→ Spot/ETF demand continues
then the market can start targeting higher liquidity.
Potential upside areas to watch:
$96K–$100K
and, if momentum becomes strong:
$110K–$112K
These are scenario levels, not guaranteed targets.
⚪ Neutral scenario
BTC remains trapped between major liquidity zones:
$80K–$96K
In this environment, expect:
Range → liquidity sweeps → fake breakouts → reversals
This would favor waiting for confirmation instead of chasing candles.
🔴 Bearish scenario
The important warning would be:
BTC loses $80K–$82K + accepts below the zone.
If price breaks the level but immediately recovers, that could simply be a liquidity sweep.
But if price accepts below it and recovery attempts fail, downside liquidity becomes more important.
Potential lower areas to monitor:
$72K–$68K
and deeper:
$62K–$58K
🧠 THE REAL GAME IN OCTOBER
For me, the question isn't simply:
“Bullish or bearish?”
The better question is:
“Where is liquidity, and what does price do after taking it?”
Watch:
• External liquidity
• Internal liquidity
• BTC.D
• ETF flows
• CVD
• Open Interest
• Funding
• Liquidation clusters
• Delta / order flow
• Acceptance vs rejection
If liquidity is swept and aggressive selling cannot push price lower, that tells us something.
If buyers attack a level but cannot create acceptance above it, that also tells us something.
Price reaction after liquidity is more important than the liquidity level itself.
🔥 OCTOBER 2026 BIAS
My framework is:
🟢 BULLISH — BUT CONDITIONAL
I don't expect October to simply go up every day.
The key area I'm watching is:
$80K–$82K
Above and holding this zone → bullish continuation remains possible.
Below it with acceptance → bearish correction scenario becomes increasingly relevant.
Don't trade the prediction. Trade the confirmation.
By Hami 👑
#Bitcoin #BTC #Crypto #CryptoMarket #October2026 #BitcoinAnalysis #BTCUSDT #Trading #Liquidity #Orderflow
Will Bitcoin continue its recovery, or is another major correction coming?
After a strong Q3 recovery, BTC entered October around the $84K–$85K area. Bitcoin gained more than 40% during Q3, while U.S. spot Bitcoin ETFs recorded around $2.4B of weekly inflows in late September — their strongest weekly inflow since October 2025.
But the market is not risk-free.
🟢 WHY OCTOBER COULD BE BULLISH
The biggest positive factor is institutional demand.
ETF inflows have returned strongly, showing that large capital is still willing to accumulate BTC. Binance Research also noted that BTC reclaimed important weekly trend levels, although confirmation still depends on whether demand continues.
Another positive development came from U.S. inflation.
August PCE inflation came in at 3.4% YoY, below the expected 3.7%, which reduced immediate expectations for an October Federal Reserve rate hike.
Historically, October has also been a strong month for Bitcoin, although historical seasonality is not a guarantee of future performance.
🔴 BUT THERE IS A RISK
Bitcoin has already made a large recovery.
That means some holders may use higher prices to take profits. At the same time, Treasury yields remain elevated and oil prices have created additional macro uncertainty. Binance Research specifically highlighted the importance of BTC holding its reclaimed weekly trend level while yields remain above 5%.
So the October move may not be a straight pump.
We could see:
Liquidity sweep → correction → accumulation → expansion
before the next major directional move.
🎯 MY OCTOBER MARKET FRAMEWORK
I am watching $80K–$82K as a major BTC support/liquidity area.
🟢 Bullish scenario
If BTC:
Holds $80K–$82K
→ Reclaims $86K
→ Builds acceptance above it
→ Spot/ETF demand continues
then the market can start targeting higher liquidity.
Potential upside areas to watch:
$96K–$100K
and, if momentum becomes strong:
$110K–$112K
These are scenario levels, not guaranteed targets.
⚪ Neutral scenario
BTC remains trapped between major liquidity zones:
$80K–$96K
In this environment, expect:
Range → liquidity sweeps → fake breakouts → reversals
This would favor waiting for confirmation instead of chasing candles.
🔴 Bearish scenario
The important warning would be:
BTC loses $80K–$82K + accepts below the zone.
If price breaks the level but immediately recovers, that could simply be a liquidity sweep.
But if price accepts below it and recovery attempts fail, downside liquidity becomes more important.
Potential lower areas to monitor:
$72K–$68K
and deeper:
$62K–$58K
🧠 THE REAL GAME IN OCTOBER
For me, the question isn't simply:
“Bullish or bearish?”
The better question is:
“Where is liquidity, and what does price do after taking it?”
Watch:
• External liquidity
• Internal liquidity
• BTC.D
• ETF flows
• CVD
• Open Interest
• Funding
• Liquidation clusters
• Delta / order flow
• Acceptance vs rejection
If liquidity is swept and aggressive selling cannot push price lower, that tells us something.
If buyers attack a level but cannot create acceptance above it, that also tells us something.
Price reaction after liquidity is more important than the liquidity level itself.
🔥 OCTOBER 2026 BIAS
My framework is:
🟢 BULLISH — BUT CONDITIONAL
I don't expect October to simply go up every day.
The key area I'm watching is:
$80K–$82K
Above and holding this zone → bullish continuation remains possible.
Below it with acceptance → bearish correction scenario becomes increasingly relevant.
Don't trade the prediction. Trade the confirmation.
By Hami 👑
#Bitcoin #BTC #Crypto #CryptoMarket #October2026 #BitcoinAnalysis #BTCUSDT #Trading #Liquidity #Orderflow
78
·
--

Artikel
Übersetzung ansehen
: ETF inflows drive BTC past $84,000 — holders explore daily returns of $3,500 via FTMININGRecently, geopolitical tensions, inflationary pressures, and shifts in U.S. interest rate policy dampened market risk appetite, causing Bitcoin to retreat rapidly from its highs and briefly drop to around $76,000.
However, as some of these pressures eased and capital flowed back into asset markets, BTC not only reclaimed the $80,000 level but also broke past $84,000 on September 21. The latest market data shows Bitcoin briefly surpassing $85,000, hitting an eight-month high.
Meanwhile, U.S. spot Bitcoin ETFs saw a resurgence in inflows; on September 18 alone, net inflows totaled approximately $433 million, with Fidelity’s FBTC attracting about $310.7 million and BlackRock’s IBIT drawing in roughly $108.4 million.
This indicates that Bitcoin is regaining investor attention following the earlier period of market strain. Increasingly viewed as a high-volatility growth asset, Bitcoin is well-positioned for a rebound amidst expectations of looser liquidity conditions.
After BTC breaks $84,000: How can holders explore yield opportunities?
Despite the market recovery, many investors are reluctant to rely solely on price appreciation for profits. BTC holders are increasingly exploring ways to generate passive income from their cryptocurrency holdings, seeking to unlock greater value from their digital assets while awaiting further market gains.
follow for more thanks 😘👍
: ETF inflows drive BTC past $84,000 — holders explore daily returns of $3,500 via FTMINING
Recently, geopolitical tensions, inflationary pressures, and shifts in U.S. interest rate policy dampened market risk appetite, causing Bitcoin to retreat rapidly from its highs and briefly drop to around $76,000.
However, as some of these pressures eased and capital flowed back into asset markets, BTC not only reclaimed the $80,000 level but also broke past $84,000 on September 21. The latest market data shows Bitcoin briefly surpassing $85,000, hitting an eight-month high.
Meanwhile, U.S. spot Bitcoin ETFs saw a resurgence in inflows; on September 18 alone, net inflows totaled approximately $433 million, with Fidelity’s FBTC attracting about $310.7 million and BlackRock’s IBIT drawing in roughly $108.4 million.
This indicates that Bitcoin is regaining investor attention following the earlier period of market strain. Increasingly viewed as a high-volatility growth asset, Bitcoin is well-positioned for a rebound amidst expectations of looser liquidity conditions.
After BTC breaks $84,000: How can holders explore yield opportunities?
Despite the market recovery, many investors are reluctant to rely solely on price appreciation for profits. BTC holders are increasingly exploring ways to generate passive income from their cryptocurrency holdings, seeking to unlock greater value from their digital assets while awaiting further market gains.
follow for more thanks 😘👍
However, as some of these pressures eased and capital flowed back into asset markets, BTC not only reclaimed the $80,000 level but also broke past $84,000 on September 21. The latest market data shows Bitcoin briefly surpassing $85,000, hitting an eight-month high.
Meanwhile, U.S. spot Bitcoin ETFs saw a resurgence in inflows; on September 18 alone, net inflows totaled approximately $433 million, with Fidelity’s FBTC attracting about $310.7 million and BlackRock’s IBIT drawing in roughly $108.4 million.
This indicates that Bitcoin is regaining investor attention following the earlier period of market strain. Increasingly viewed as a high-volatility growth asset, Bitcoin is well-positioned for a rebound amidst expectations of looser liquidity conditions.
After BTC breaks $84,000: How can holders explore yield opportunities?
Despite the market recovery, many investors are reluctant to rely solely on price appreciation for profits. BTC holders are increasingly exploring ways to generate passive income from their cryptocurrency holdings, seeking to unlock greater value from their digital assets while awaiting further market gains.
follow for more thanks 😘👍
100
·
--

Artikel
Übersetzung ansehen
Here’s how much President Trump is up on his Bitcoin betWhile President Donald Trump’ cryptocurrency wallet has been diminishing for years, the latest September 22 disclosur revealed that the commander-in-chief has quietly built up a major indirect BitCoin (BTC) investment.
Specifically, the billionaire Republican purchased up to $115,000 worth of Strategy (NASDAQ: MSTR) stock in late July, approximately one month after a strong BTC rally reignited optimism about digital assist and sent Michael Saylor’s company higher.
Indeed, MSTR shares were changing hands at $91.67 on July 24 – at the time of President Trump’s earlier and smaller purchase – and at $98.65 three days later – the time of the second and larger investment.
With Strategy stock closing at $167.33 on September 22 – the most recent regular session – the U.S. commander-in-chief could have seen a $12,380 profit on the first buy and up to $69,619 on the second.
Here’s how much President Trump is up on his Bitcoin bet
While President Donald Trump’ cryptocurrency wallet has been diminishing for years, the latest September 22 disclosur revealed that the commander-in-chief has quietly built up a major indirect BitCoin (BTC) investment.
Specifically, the billionaire Republican purchased up to $115,000 worth of Strategy (NASDAQ: MSTR) stock in late July, approximately one month after a strong BTC rally reignited optimism about digital assist and sent Michael Saylor’s company higher.
Indeed, MSTR shares were changing hands at $91.67 on July 24 – at the time of President Trump’s earlier and smaller purchase – and at $98.65 three days later – the time of the second and larger investment.
With Strategy stock closing at $167.33 on September 22 – the most recent regular session – the U.S. commander-in-chief could have seen a $12,380 profit on the first buy and up to $69,619 on the second.
Specifically, the billionaire Republican purchased up to $115,000 worth of Strategy (NASDAQ: MSTR) stock in late July, approximately one month after a strong BTC rally reignited optimism about digital assist and sent Michael Saylor’s company higher.
Indeed, MSTR shares were changing hands at $91.67 on July 24 – at the time of President Trump’s earlier and smaller purchase – and at $98.65 three days later – the time of the second and larger investment.
With Strategy stock closing at $167.33 on September 22 – the most recent regular session – the U.S. commander-in-chief could have seen a $12,380 profit on the first buy and up to $69,619 on the second.
96
·
--

Artikel
Übersetzung ansehen
XRP reclaims $100 billion market cap; Here’s what’s nextXRP climbed back above the $100 billion market capitalization mark on September 23, 2026, as the price rallied nearly 4% over the previous 24 hours and reached $1.6, a level not seen since February.
One of the stronger performers among major cryptocurrencies, XRP significantly outperformed Bitcoin (BTC), which gained 0.8% over the same period. Trading volume also rose, with approximately $7.69 billion worth of XRP changing hands over the past 24 hours.
XRP whale and network activity skyrockets
The rally appears to be driven primarily by whale activity. Namely, approximately 1,900 transactions worth more than $100,000 were recorded during the move, representing the strongest level of high-value transaction activity in roughly a month, according to a Santiment Intelligence DATA report.
Network growth has also accelerated, with 3,647 new wallets created during the period, with the same data also mentioning that tokenized assets and RLUSD balances on the XRP Ledger (XRPL) reached roughly $4.26 billion.
Institutional access to XRP is also expanding. Notably, Bitwise submitted an updated XRP ETF registration to the U.S. Securities and Exchange Commission (SEC) on September 18, adding to the growing number of exchange-traded products providing investors with exposure to the cryptocurrency.
XRP reclaims $100 billion market cap; Here’s what’s next
XRP climbed back above the $100 billion market capitalization mark on September 23, 2026, as the price rallied nearly 4% over the previous 24 hours and reached $1.6, a level not seen since February.
One of the stronger performers among major cryptocurrencies, XRP significantly outperformed Bitcoin (BTC), which gained 0.8% over the same period. Trading volume also rose, with approximately $7.69 billion worth of XRP changing hands over the past 24 hours.
XRP whale and network activity skyrockets
The rally appears to be driven primarily by whale activity. Namely, approximately 1,900 transactions worth more than $100,000 were recorded during the move, representing the strongest level of high-value transaction activity in roughly a month, according to a Santiment Intelligence DATA report.
Network growth has also accelerated, with 3,647 new wallets created during the period, with the same data also mentioning that tokenized assets and RLUSD balances on the XRP Ledger (XRPL) reached roughly $4.26 billion.
Institutional access to XRP is also expanding. Notably, Bitwise submitted an updated XRP ETF registration to the U.S. Securities and Exchange Commission (SEC) on September 18, adding to the growing number of exchange-traded products providing investors with exposure to the cryptocurrency.
One of the stronger performers among major cryptocurrencies, XRP significantly outperformed Bitcoin (BTC), which gained 0.8% over the same period. Trading volume also rose, with approximately $7.69 billion worth of XRP changing hands over the past 24 hours.
XRP whale and network activity skyrockets
The rally appears to be driven primarily by whale activity. Namely, approximately 1,900 transactions worth more than $100,000 were recorded during the move, representing the strongest level of high-value transaction activity in roughly a month, according to a Santiment Intelligence DATA report.
Network growth has also accelerated, with 3,647 new wallets created during the period, with the same data also mentioning that tokenized assets and RLUSD balances on the XRP Ledger (XRPL) reached roughly $4.26 billion.
Institutional access to XRP is also expanding. Notably, Bitwise submitted an updated XRP ETF registration to the U.S. Securities and Exchange Commission (SEC) on September 18, adding to the growing number of exchange-traded products providing investors with exposure to the cryptocurrency.
1
306
·
--

Artikel
XRP-Preisprognose: Nach 2 Milliarden US-Dollar Aufladung durch Wale innerhalb von 96 StundenXRP rückt erneut in den Fokus, nachdem Whale-Wallets innerhalb von 96 Stunden etwa 1,54 Milliarden Tokens im Wert von rund 2,2 Milliarden US-Dollar angesammelt haben – ein Schritt, der die bullische Argumentation für die Kryptowährung gestärkt hat, während sie nahe 1,41 US-Dollar handelt.
Die Akkumulation erfolgt zu einem Zeitpunkt, an dem sich die Marktstimmung bei digitalen Vermögenswerten verbessert hat: Anleger kehren zunehmend zu riskanteren Assets zurück.
Das Ausmaß der Kaufaktivität hat Spekulationen befeuert, dass große Inhaber sich für einen möglichen weiteren Anstieg nach XRP’s jüngster Erholung positionieren.
XRP-Preisprognose: Nach 2 Milliarden US-Dollar Aufladung durch Wale innerhalb von 96 Stunden
XRP rückt erneut in den Fokus, nachdem Whale-Wallets innerhalb von 96 Stunden etwa 1,54 Milliarden Tokens im Wert von rund 2,2 Milliarden US-Dollar angesammelt haben – ein Schritt, der die bullische Argumentation für die Kryptowährung gestärkt hat, während sie nahe 1,41 US-Dollar handelt.
Die Akkumulation erfolgt zu einem Zeitpunkt, an dem sich die Marktstimmung bei digitalen Vermögenswerten verbessert hat: Anleger kehren zunehmend zu riskanteren Assets zurück.
Das Ausmaß der Kaufaktivität hat Spekulationen befeuert, dass große Inhaber sich für einen möglichen weiteren Anstieg nach XRP’s jüngster Erholung positionieren.
Die Akkumulation erfolgt zu einem Zeitpunkt, an dem sich die Marktstimmung bei digitalen Vermögenswerten verbessert hat: Anleger kehren zunehmend zu riskanteren Assets zurück.
Das Ausmaß der Kaufaktivität hat Spekulationen befeuert, dass große Inhaber sich für einen möglichen weiteren Anstieg nach XRP’s jüngster Erholung positionieren.
4
9
10.2k
·
--
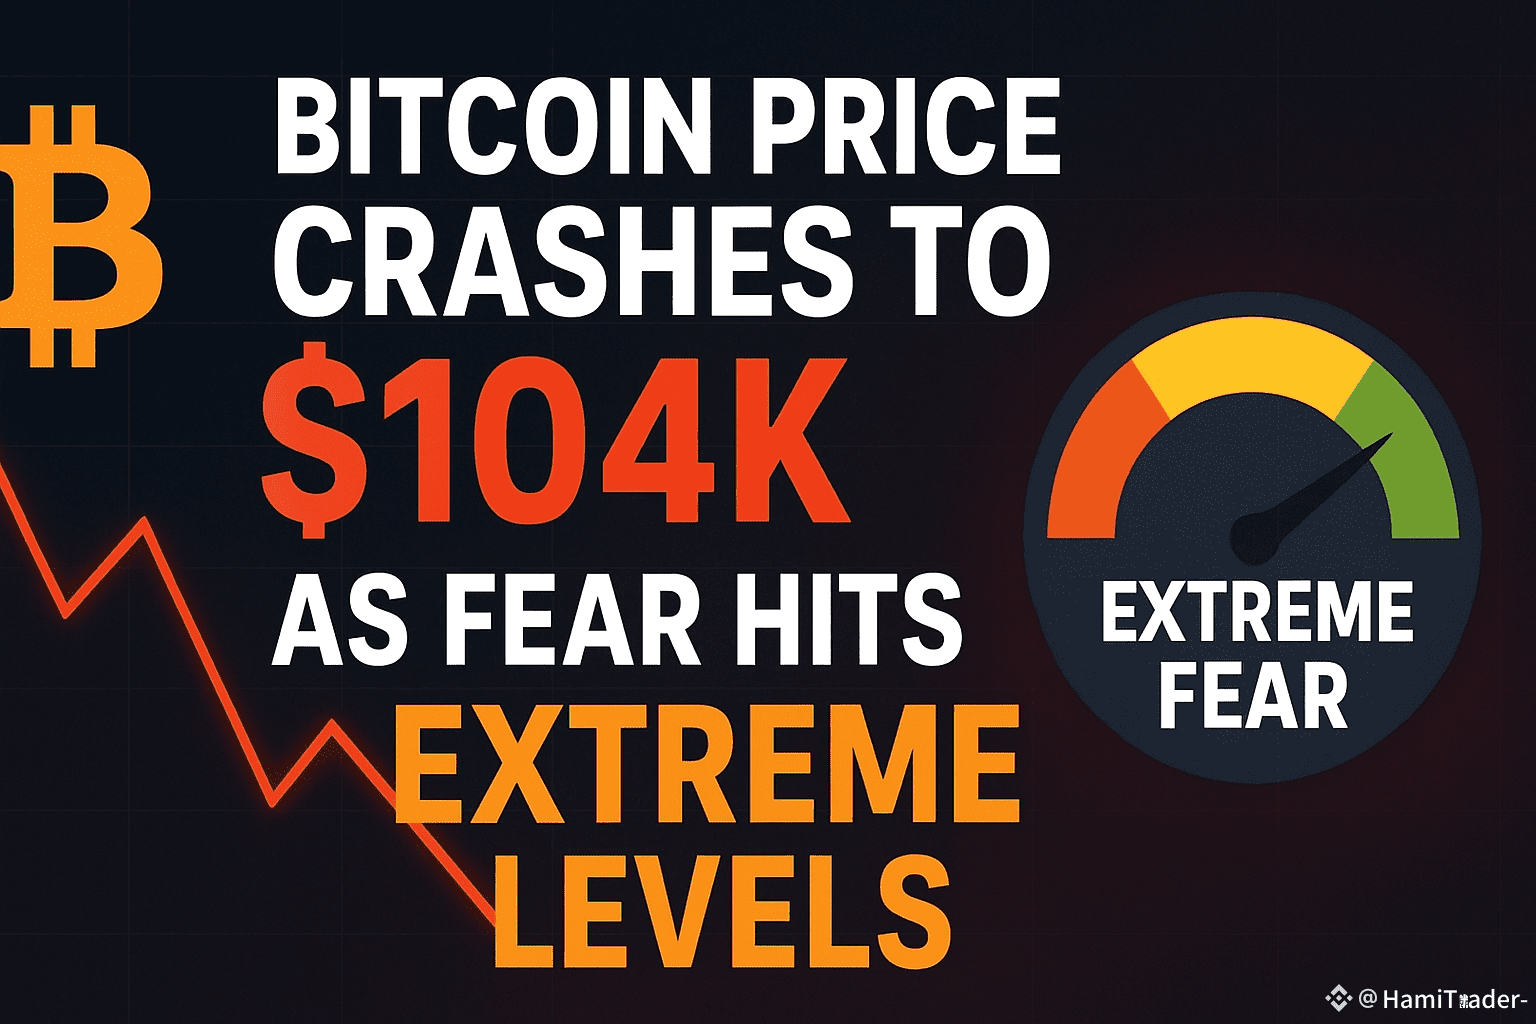
📰 Bitcoin-Preis stürzt auf 104.000 $ ab, da Angst extreme Levels erreicht
Bitcoin ist von seinem Hoch von 126.000 $ vor nur zwei Wochen auf etwa 104.000 $ gefallen, was den steilsten Rückgang seit Monaten markiert.
Der Angst- und Gier-Index zeigt jetzt 22/100 – „Extreme Angst“, was auf hohe Marktangst hinweist.
Der Crash folgte Trumps 100% Zöllen auf China, was einen massiven Krypto-Verkauf auslöste – BTC fiel um 12%, und Altcoins bis zu 40%.
Analysten warnen, dass Bitcoin weiter auf den Bereich von 90.000 $–80.000 $ fallen könnte, da technische Indikatoren eine starke bärische Dynamik und ein „Todeskreuz“-Muster zeigen.
In der Zwischenzeit hat Gold neue Höchststände erreicht (4.350 $) und übertrifft Bitcoin inmitten globaler Risikoaversion.$BTC
#USBitcoinReservesSurge
$BTC
{spot}(BTCUSDT)
📰 Bitcoin-Preis stürzt auf 104.000 $ ab, da Angst extreme Levels erreicht
Bitcoin ist von seinem Hoch von 126.000 $ vor nur zwei Wochen auf etwa 104.000 $ gefallen, was den steilsten Rückgang seit Monaten markiert.
Der Angst- und Gier-Index zeigt jetzt 22/100 – „Extreme Angst“, was auf hohe Marktangst hinweist.
Der Crash folgte Trumps 100% Zöllen auf China, was einen massiven Krypto-Verkauf auslöste – BTC fiel um 12%, und Altcoins bis zu 40%.
Analysten warnen, dass Bitcoin weiter auf den Bereich von 90.000 $–80.000 $ fallen könnte, da technische Indikatoren eine starke bärische Dynamik und ein „Todeskreuz“-Muster zeigen.
In der Zwischenzeit hat Gold neue Höchststände erreicht (4.350 $) und übertrifft Bitcoin inmitten globaler Risikoaversion.$BTC
#USBitcoinReservesSurge
$BTC
Bitcoin ist von seinem Hoch von 126.000 $ vor nur zwei Wochen auf etwa 104.000 $ gefallen, was den steilsten Rückgang seit Monaten markiert.
Der Angst- und Gier-Index zeigt jetzt 22/100 – „Extreme Angst“, was auf hohe Marktangst hinweist.
Der Crash folgte Trumps 100% Zöllen auf China, was einen massiven Krypto-Verkauf auslöste – BTC fiel um 12%, und Altcoins bis zu 40%.
Analysten warnen, dass Bitcoin weiter auf den Bereich von 90.000 $–80.000 $ fallen könnte, da technische Indikatoren eine starke bärische Dynamik und ein „Todeskreuz“-Muster zeigen.
In der Zwischenzeit hat Gold neue Höchststände erreicht (4.350 $) und übertrifft Bitcoin inmitten globaler Risikoaversion.$BTC
#USBitcoinReservesSurge
$BTC
7
·
--
Der Bitcoin-Preis fällt auf $104K, da die Markangst extreme Niveaus erreichtBitcoin ist von seinem Rekordhoch von $126.000 vor nur zwei Wochen auf etwa $104.000 gefallen, was die schärfste Korrektur seit Monaten markiert.
Laut dem Bitcoin Fear & Greed Index ist das Sentiment auf 22/100 gefallen, was es fest in der Zone der "extremen Angst" platziert – ein Niveau, das oft während Markttiefs zu sehen ist.
Der Rückgang begann, nachdem Präsident Trump 100 % Zölle auf chinesische Importe angekündigt hatte, was einen massiven Krypto-Verkauf auslöste. Bitcoin fiel kurzzeitig um 12 %, während mehrere Altcoins um über 40 % sanken.
Analysten warnen, dass Bitcoin noch die $90K–$80K-Niveaus testen könnte, da der Momentum nachlässt und ein bärischer "Death Cross" auf den Charts entsteht. In der Zwischenzeit hat Gold neue Höchststände über $4.350 erreicht und übertrifft Bitcoin inmitten globaler Unsicherheit.$BTC
Der Bitcoin-Preis fällt auf $104K, da die Markangst extreme Niveaus erreicht
Bitcoin ist von seinem Rekordhoch von $126.000 vor nur zwei Wochen auf etwa $104.000 gefallen, was die schärfste Korrektur seit Monaten markiert.
Laut dem Bitcoin Fear & Greed Index ist das Sentiment auf 22/100 gefallen, was es fest in der Zone der "extremen Angst" platziert – ein Niveau, das oft während Markttiefs zu sehen ist.
Der Rückgang begann, nachdem Präsident Trump 100 % Zölle auf chinesische Importe angekündigt hatte, was einen massiven Krypto-Verkauf auslöste. Bitcoin fiel kurzzeitig um 12 %, während mehrere Altcoins um über 40 % sanken.
Analysten warnen, dass Bitcoin noch die $90K–$80K-Niveaus testen könnte, da der Momentum nachlässt und ein bärischer "Death Cross" auf den Charts entsteht. In der Zwischenzeit hat Gold neue Höchststände über $4.350 erreicht und übertrifft Bitcoin inmitten globaler Unsicherheit.$BTC
Laut dem Bitcoin Fear & Greed Index ist das Sentiment auf 22/100 gefallen, was es fest in der Zone der "extremen Angst" platziert – ein Niveau, das oft während Markttiefs zu sehen ist.
Der Rückgang begann, nachdem Präsident Trump 100 % Zölle auf chinesische Importe angekündigt hatte, was einen massiven Krypto-Verkauf auslöste. Bitcoin fiel kurzzeitig um 12 %, während mehrere Altcoins um über 40 % sanken.
Analysten warnen, dass Bitcoin noch die $90K–$80K-Niveaus testen könnte, da der Momentum nachlässt und ein bärischer "Death Cross" auf den Charts entsteht. In der Zwischenzeit hat Gold neue Höchststände über $4.350 erreicht und übertrifft Bitcoin inmitten globaler Unsicherheit.$BTC
19
·
--
Bullisch
BDXNUSDT
Einstieg: $0.03481
SL: $0.02785
TP1:0.03655
TP2:0.03829
TP3:0.04177
TP4:0.04873
TP5:0.05570
TP6:0.06962
#PowellRemarks
$BDXN
BDXNUSDT
Einstieg: $0.03481
SL: $0.02785
TP1:0.03655
TP2:0.03829
TP3:0.04177
TP4:0.04873
TP5:0.05570
TP6:0.06962
#PowellRemarks
$BDXN
Einstieg: $0.03481
SL: $0.02785
TP1:0.03655
TP2:0.03829
TP3:0.04177
TP4:0.04873
TP5:0.05570
TP6:0.06962
#PowellRemarks
$BDXN
1
204
·
--
Bullisch
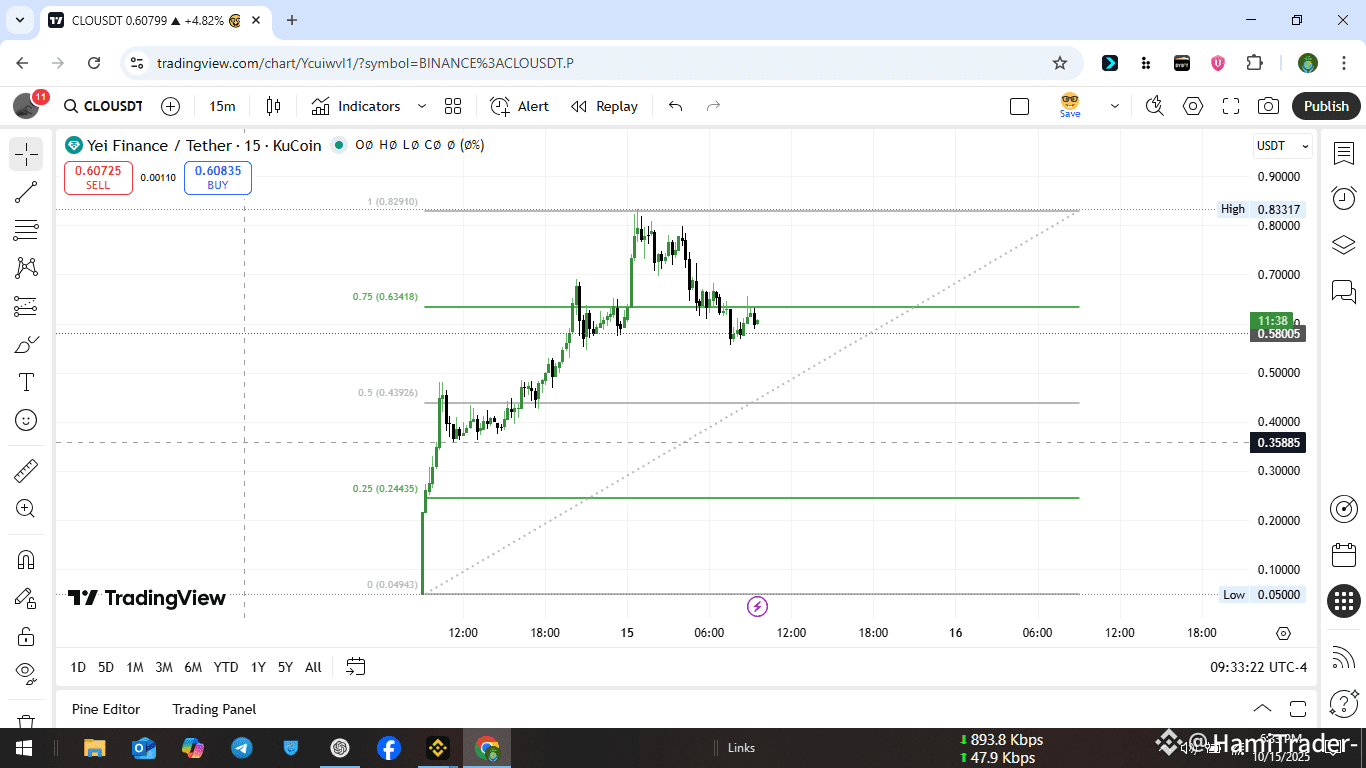
⚠️ CLO/USDT Schnelles Update — Call getroffen 🎯
Unser vorheriges CLO/USDT Setup hat perfekt funktioniert — der Preis respektierte die 50% FVG Zone und erreichte das CISD Ziel genau wie geplant. ✅
Wenn Sie es verpasst haben, überprüfen Sie den vorherigen Beitrag für vollständige Setup-Details. 👀
Jetzt beobachten wir eine mögliche Rückeroberung der 50% Zone — wenn bestätigt, werden wir nach neuen Long-Scalp-Einstiegen in Richtung intraday Widerstand suchen.
Bleiben Sie scharf und managen Sie das Risiko sorgfältig. 📉💼
$CLO
{future}(CLOUSDT)
#PowellRemarks #CryptoMarketAnalysis
⚠️ CLO/USDT Schnelles Update — Call getroffen 🎯
Unser vorheriges CLO/USDT Setup hat perfekt funktioniert — der Preis respektierte die 50% FVG Zone und erreichte das CISD Ziel genau wie geplant. ✅
Wenn Sie es verpasst haben, überprüfen Sie den vorherigen Beitrag für vollständige Setup-Details. 👀
Jetzt beobachten wir eine mögliche Rückeroberung der 50% Zone — wenn bestätigt, werden wir nach neuen Long-Scalp-Einstiegen in Richtung intraday Widerstand suchen.
Bleiben Sie scharf und managen Sie das Risiko sorgfältig. 📉💼
$CLO
#PowellRemarks #CryptoMarketAnalysis
Unser vorheriges CLO/USDT Setup hat perfekt funktioniert — der Preis respektierte die 50% FVG Zone und erreichte das CISD Ziel genau wie geplant. ✅
Wenn Sie es verpasst haben, überprüfen Sie den vorherigen Beitrag für vollständige Setup-Details. 👀
Jetzt beobachten wir eine mögliche Rückeroberung der 50% Zone — wenn bestätigt, werden wir nach neuen Long-Scalp-Einstiegen in Richtung intraday Widerstand suchen.
Bleiben Sie scharf und managen Sie das Risiko sorgfältig. 📉💼
$CLO
#PowellRemarks #CryptoMarketAnalysis
567
·
--
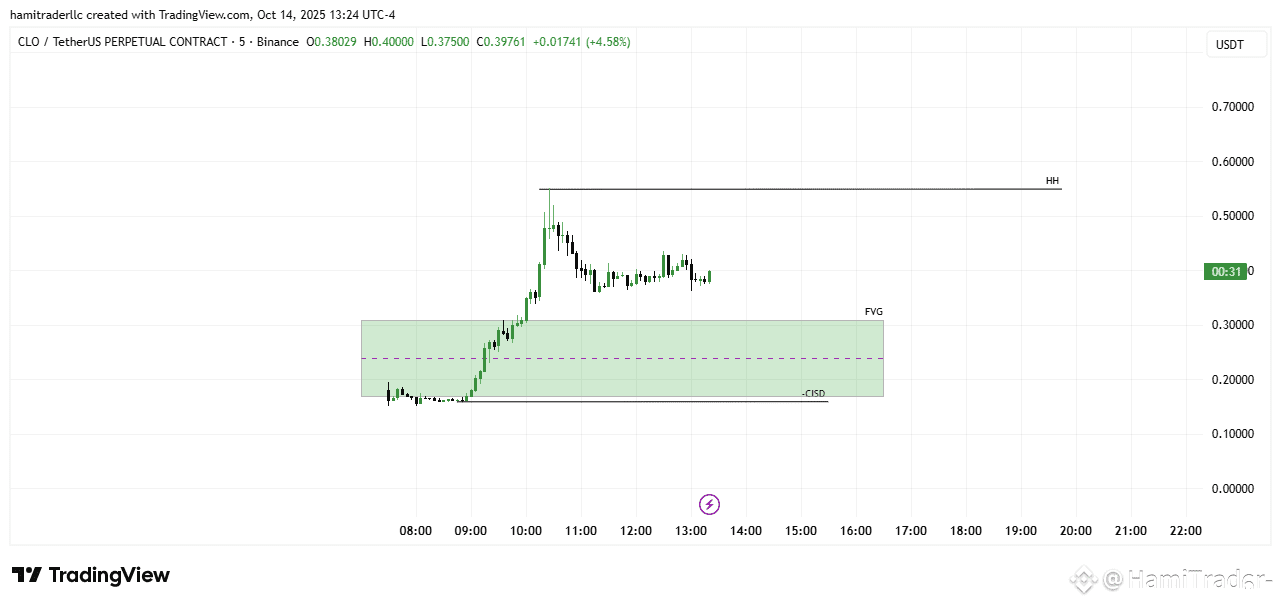
⚠️ CLO/USDT Schnelles Update ⚠️
Warten auf FVG 50% Füllung — wenn der Preis 50% erreicht und den Körper nach dem Sweep schließt,
dann nach Short-Einstiegen in Richtung CISD-Niveau Ausschau halten 🩸
Scalp-Setup nur — bleib wachsam und manage das Risiko sorgfältig. 📉💼
#MarketPullback #PowellRemarks $CLO
⚠️ CLO/USDT Schnelles Update ⚠️
Warten auf FVG 50% Füllung — wenn der Preis 50% erreicht und den Körper nach dem Sweep schließt,
dann nach Short-Einstiegen in Richtung CISD-Niveau Ausschau halten 🩸
Scalp-Setup nur — bleib wachsam und manage das Risiko sorgfältig. 📉💼
#MarketPullback #PowellRemarks $CLO
Warten auf FVG 50% Füllung — wenn der Preis 50% erreicht und den Körper nach dem Sweep schließt,
dann nach Short-Einstiegen in Richtung CISD-Niveau Ausschau halten 🩸
Scalp-Setup nur — bleib wachsam und manage das Risiko sorgfältig. 📉💼
#MarketPullback #PowellRemarks $CLO
618
·
--
Bullisch
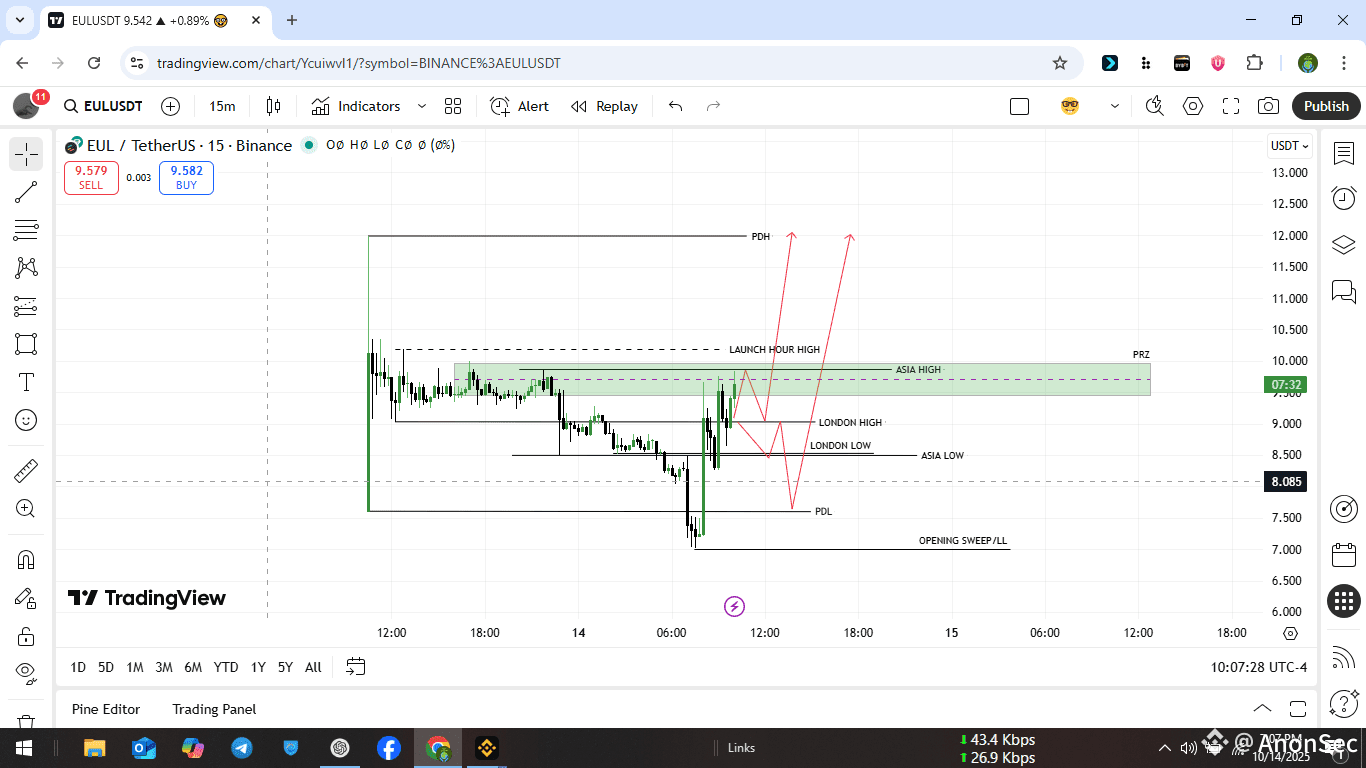
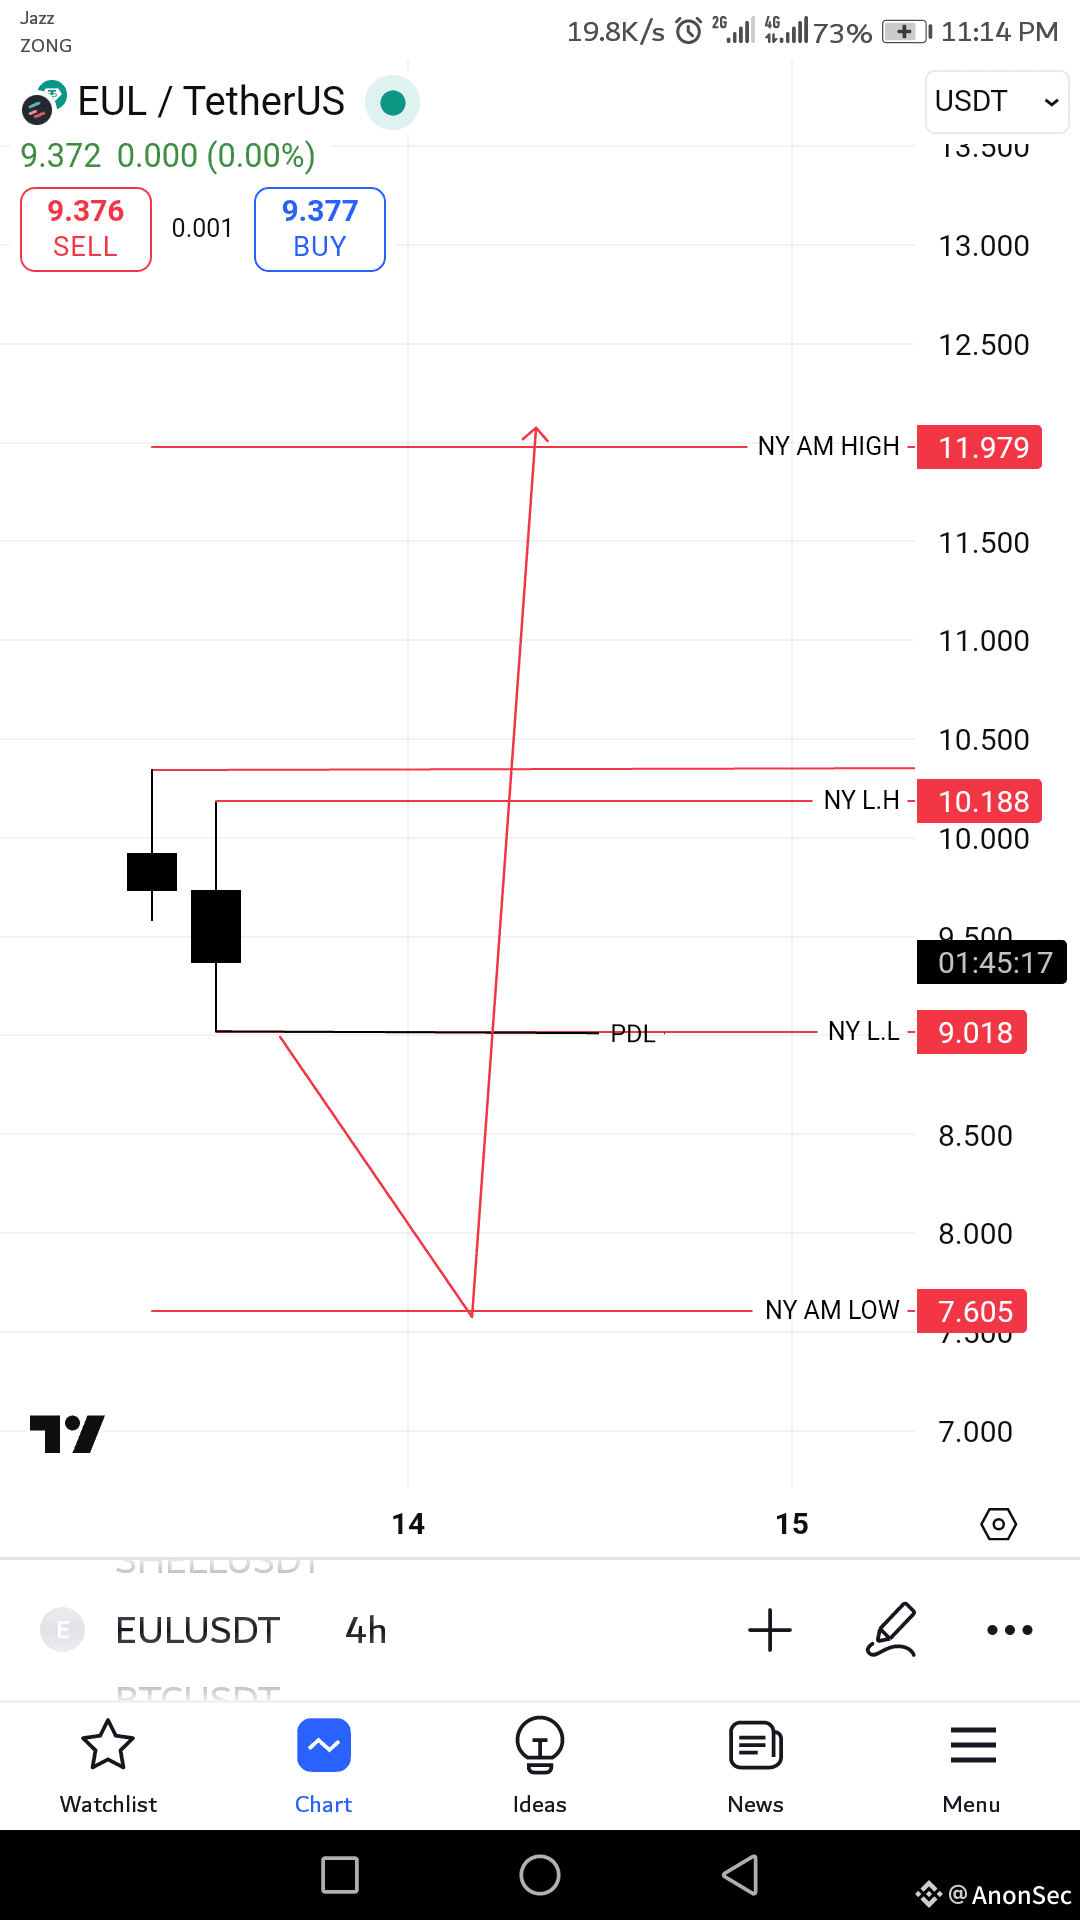
🚨 2. Krone-Anruf-Alarm 💸🔥
Wenn du meinem letzten Anruf gefolgt bist, sitzt du bereits auf massiven Gewinnen! 💰
Aber wenn du diesen Beitrag zum ersten Mal siehst, schau nicht nur zu—handle jetzt! ⚡
Überprüfe mein Profil und sieh dir die vorherigen Anrufe selbst an.
Der nächste große Schritt wird geladen…
$EUL
{spot}(EULUSDT)
bereitet sich auf eine massive bullische Welle vor — #EULBinanceHODLer 📈🚀 #MarketPullback
🚨 2. Krone-Anruf-Alarm 💸🔥
Wenn du meinem letzten Anruf gefolgt bist, sitzt du bereits auf massiven Gewinnen! 💰
Aber wenn du diesen Beitrag zum ersten Mal siehst, schau nicht nur zu—handle jetzt! ⚡
Überprüfe mein Profil und sieh dir die vorherigen Anrufe selbst an.
Der nächste große Schritt wird geladen…
$EUL
bereitet sich auf eine massive bullische Welle vor — #EULBinanceHODLer 📈🚀 #MarketPullback
Wenn du meinem letzten Anruf gefolgt bist, sitzt du bereits auf massiven Gewinnen! 💰
Aber wenn du diesen Beitrag zum ersten Mal siehst, schau nicht nur zu—handle jetzt! ⚡
Überprüfe mein Profil und sieh dir die vorherigen Anrufe selbst an.
Der nächste große Schritt wird geladen…
$EUL
bereitet sich auf eine massive bullische Welle vor — #EULBinanceHODLer 📈🚀 #MarketPullback
227
·
--
Bullisch
AUGEN DARAUF💸📈
Wenn du diesen Beitrag ignorierst und die Gelegenheit verpasst, wirst du jederzeit bedauern, dass du bald massive bullische Entwicklungen beobachtest.
$EUL
{spot}(EULUSDT)
#EULBinanceHODLer
AUGEN DARAUF💸📈
Wenn du diesen Beitrag ignorierst und die Gelegenheit verpasst, wirst du jederzeit bedauern, dass du bald massive bullische Entwicklungen beobachtest.
$EUL
#EULBinanceHODLer
Wenn du diesen Beitrag ignorierst und die Gelegenheit verpasst, wirst du jederzeit bedauern, dass du bald massive bullische Entwicklungen beobachtest.
$EUL
#EULBinanceHODLer
93
·
--
🇨🇳⚔️🇺🇸 Der kommende Sturm: China vs. Die Vereinigten Staaten — Ein neues Zeitalter des Krieges?
Einführung
Die Welt steht an einem gefährlichen Scheideweg. Die Vereinigten Staaten, die lange Zeit herrschende globale Supermacht, sehen sich einem unermüdlichen Herausforderer gegenüber — China.
Was als Handelskonkurrenz begann, hat sich zu einer umfassenden Konfrontation entwickelt: wirtschaftlich, technologisch, militärisch und ideologisch.
💰 Trumps 100% Zollschock auf China!
Der letzte Schritt des ehemaligen US-Präsidenten Donald Trump — ein Zoll von 100% auf chinesische Waren — hat die Handelskonflikte neu entfacht. Das Ziel: US-Industrien schützen und die Wirtschaft Pekings unter Druck setzen. Doch Experten warnen, dass dies nach hinten losgehen könnte, globale Inflation anheizen und die Lieferketten erschüttern könnte. China könnte bald zurückschlagen… Der Handelskrieg ist noch nicht vorbei — er hat gerade erst begonnen. 🇺🇸⚔️🇨🇳
#TrumpTariffs
🇨🇳⚔️🇺🇸 Der kommende Sturm: China vs. Die Vereinigten Staaten — Ein neues Zeitalter des Krieges?
Einführung
Die Welt steht an einem gefährlichen Scheideweg. Die Vereinigten Staaten, die lange Zeit herrschende globale Supermacht, sehen sich einem unermüdlichen Herausforderer gegenüber — China.
Was als Handelskonkurrenz begann, hat sich zu einer umfassenden Konfrontation entwickelt: wirtschaftlich, technologisch, militärisch und ideologisch.
💰 Trumps 100% Zollschock auf China!
Der letzte Schritt des ehemaligen US-Präsidenten Donald Trump — ein Zoll von 100% auf chinesische Waren — hat die Handelskonflikte neu entfacht. Das Ziel: US-Industrien schützen und die Wirtschaft Pekings unter Druck setzen. Doch Experten warnen, dass dies nach hinten losgehen könnte, globale Inflation anheizen und die Lieferketten erschüttern könnte. China könnte bald zurückschlagen… Der Handelskrieg ist noch nicht vorbei — er hat gerade erst begonnen. 🇺🇸⚔️🇨🇳
#TrumpTariffs
Einführung
Die Welt steht an einem gefährlichen Scheideweg. Die Vereinigten Staaten, die lange Zeit herrschende globale Supermacht, sehen sich einem unermüdlichen Herausforderer gegenüber — China.
Was als Handelskonkurrenz begann, hat sich zu einer umfassenden Konfrontation entwickelt: wirtschaftlich, technologisch, militärisch und ideologisch.
💰 Trumps 100% Zollschock auf China!
Der letzte Schritt des ehemaligen US-Präsidenten Donald Trump — ein Zoll von 100% auf chinesische Waren — hat die Handelskonflikte neu entfacht. Das Ziel: US-Industrien schützen und die Wirtschaft Pekings unter Druck setzen. Doch Experten warnen, dass dies nach hinten losgehen könnte, globale Inflation anheizen und die Lieferketten erschüttern könnte. China könnte bald zurückschlagen… Der Handelskrieg ist noch nicht vorbei — er hat gerade erst begonnen. 🇺🇸⚔️🇨🇳
#TrumpTariffs

2
961
·
--
Bullisch
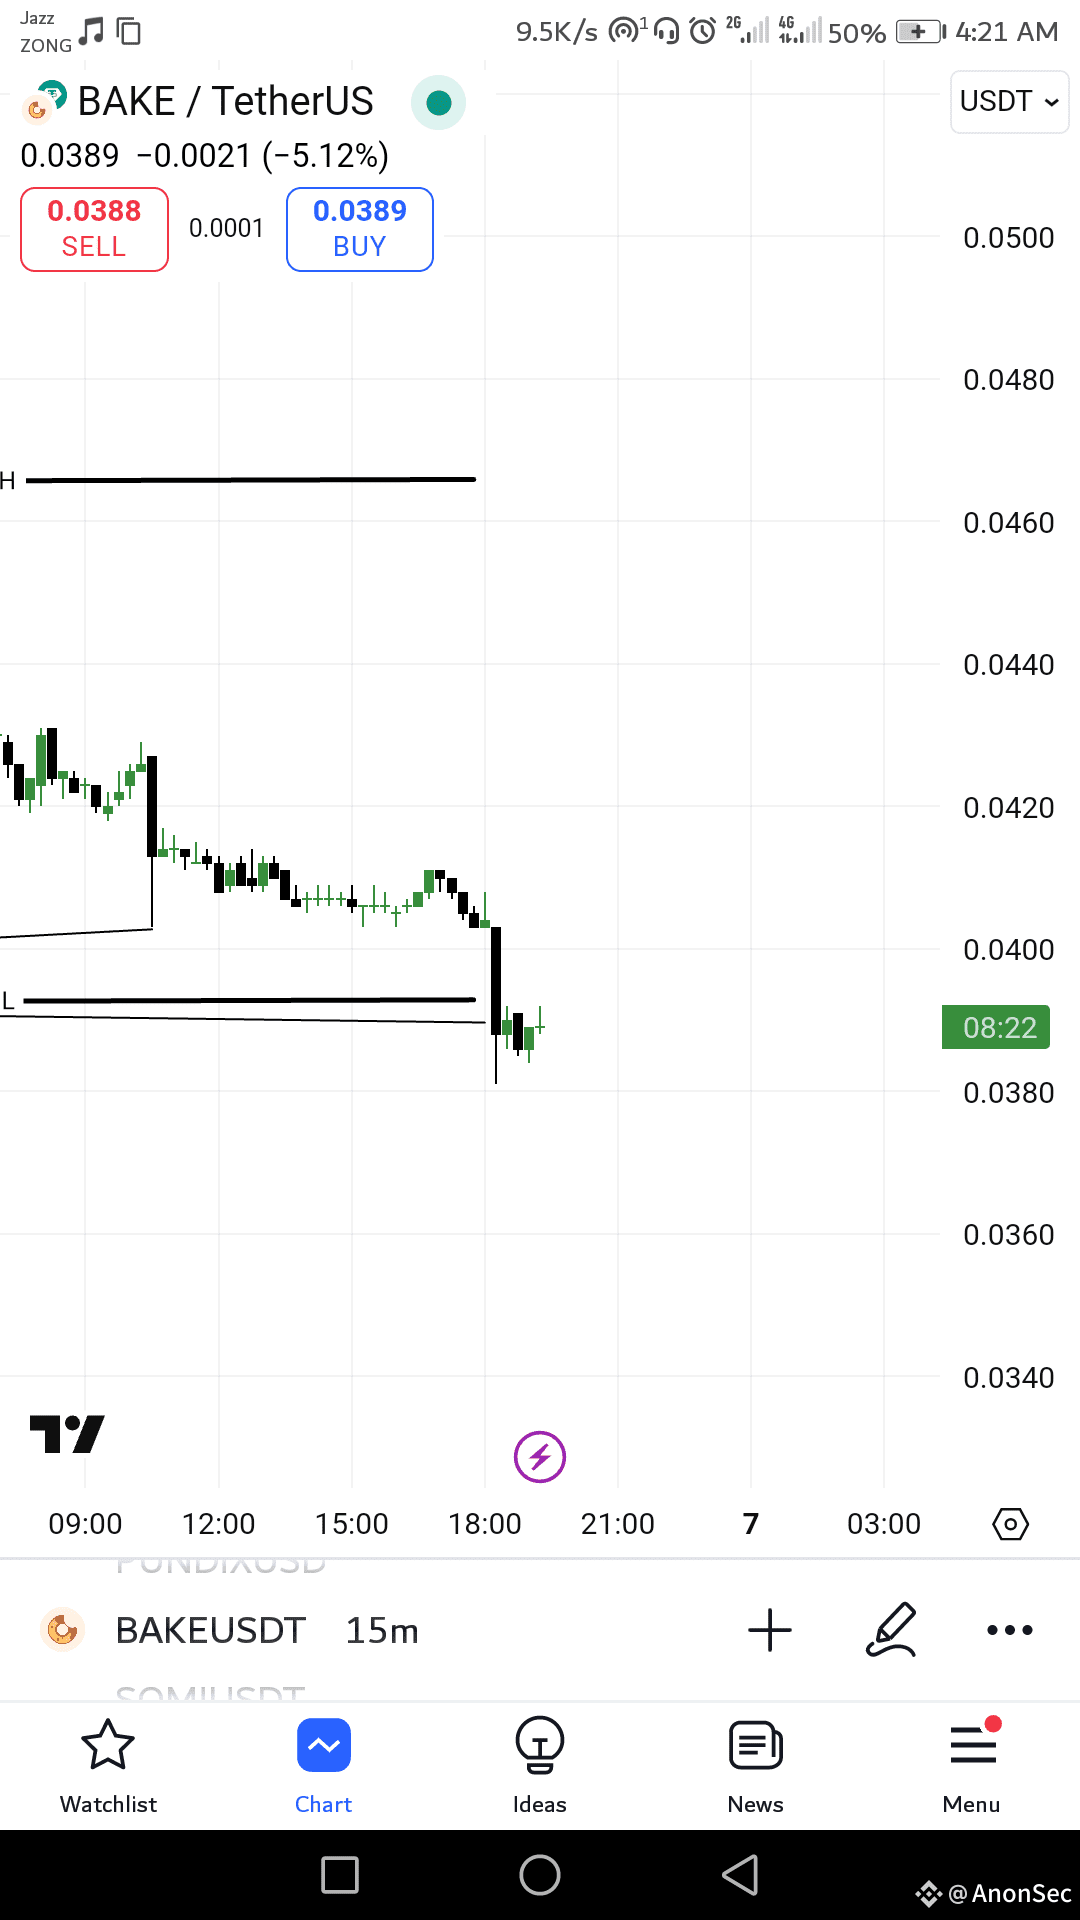
#Bake Zeigt ebenfalls einen bärischen Flex, aber der mögliche Preis könnte von 0:0375 auf 0365 steigen. Wenn du kaufst, halte und nimm den Gewinn.
Bleib dran für weitere Informationen, drücke den Folgen-Button,❣️
Lass uns sehen
$BAKE
#BinanceHODLerOPEN
#USNonFarmPayrollReport
#MarketPullback
#ListedCompaniesAltcoinTreasury
#Bake Zeigt ebenfalls einen bärischen Flex, aber der mögliche Preis könnte von 0:0375 auf 0365 steigen. Wenn du kaufst, halte und nimm den Gewinn.
Bleib dran für weitere Informationen, drücke den Folgen-Button,❣️
Lass uns sehen
$BAKE
#BinanceHODLerOPEN
#USNonFarmPayrollReport
#MarketPullback
#ListedCompaniesAltcoinTreasury
Bleib dran für weitere Informationen, drücke den Folgen-Button,❣️
Lass uns sehen
$BAKE
#BinanceHODLerOPEN
#USNonFarmPayrollReport
#MarketPullback
#ListedCompaniesAltcoinTreasury
619
·
--
Bärisch
Handelsplan
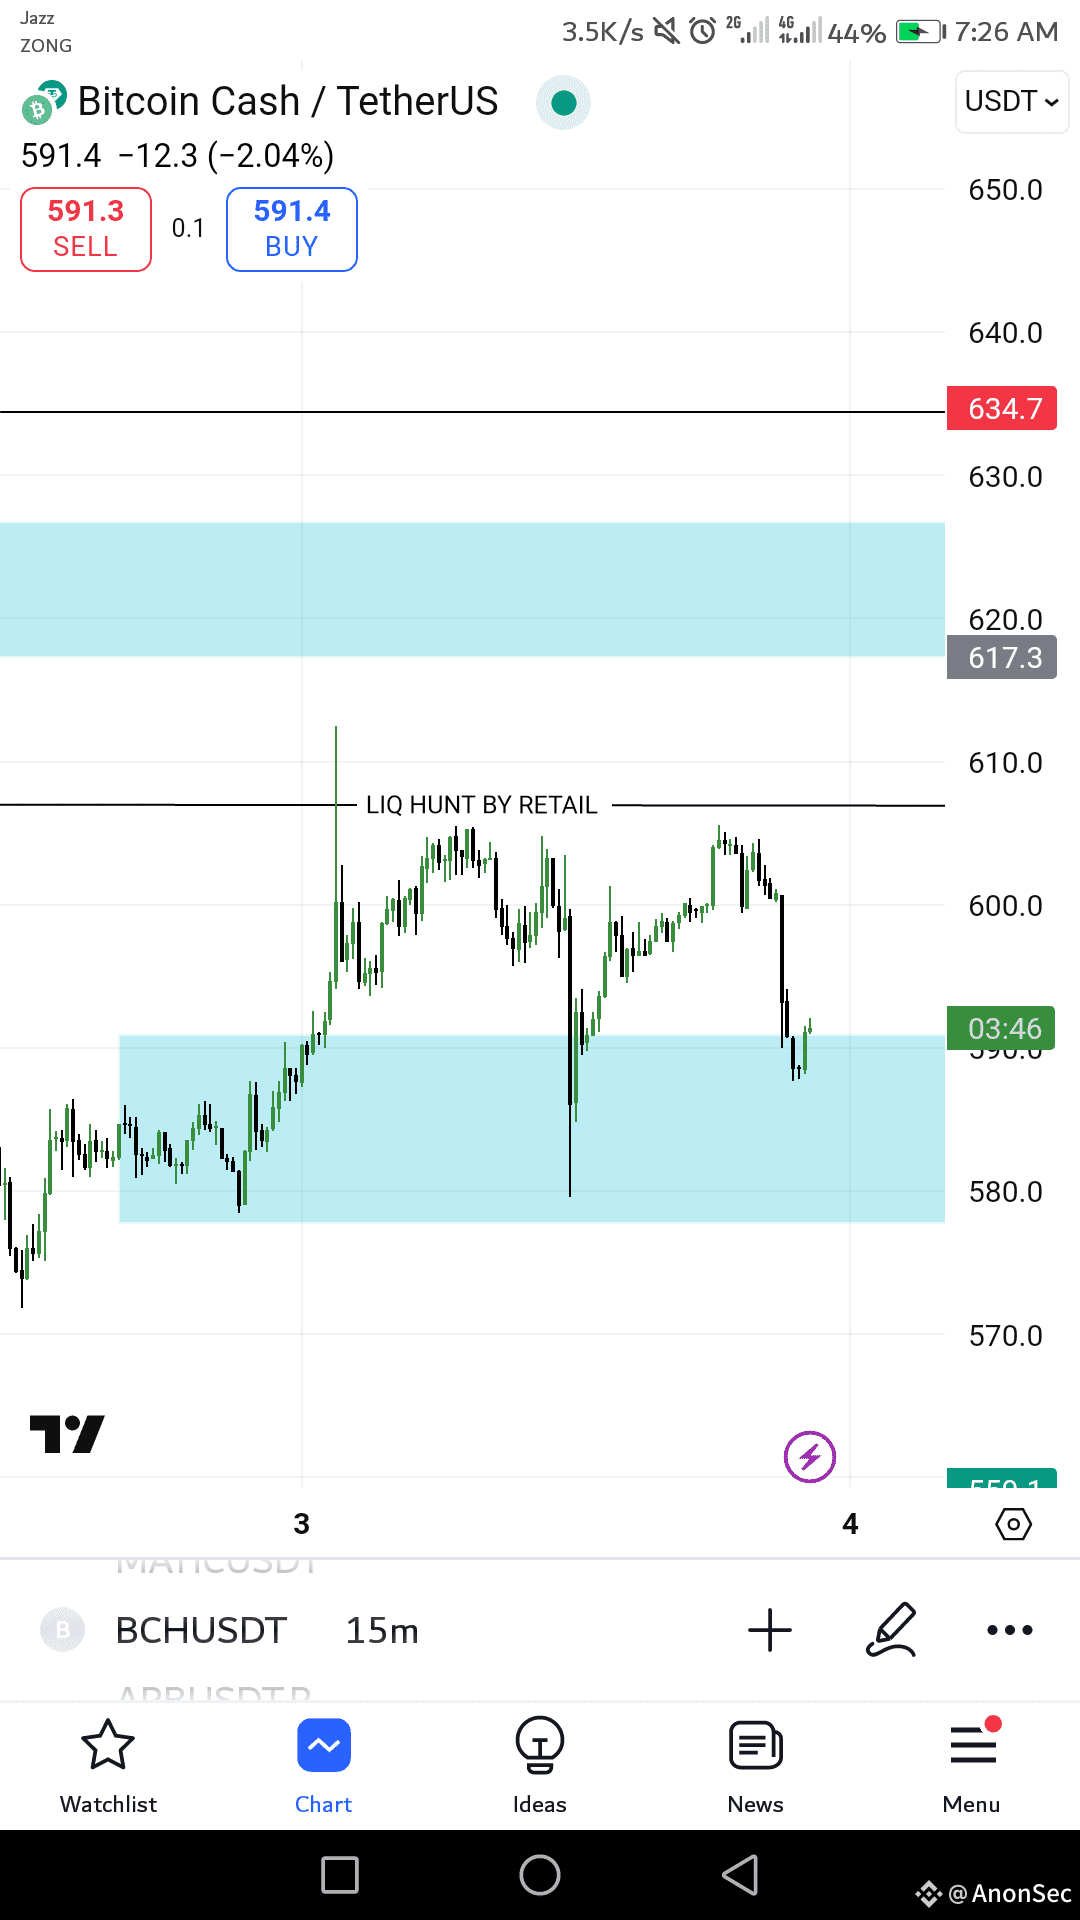
#BCH BCH ist auch Jagd Einzelhandelsöffnungsaufträge und zeigt jetzt ein bärisches Momentum, respektiert aber auch mein OB in 3 Mal. Mein Slot ist auf Verkaufsseite geöffnet.
Deshalb nehme Position, um das letzte HH oder SW hoch in beliebiger Menge zu erreichen, aber das Verkaufsziel ist $640 und Setzen TP 70% Verhältnis. Wenn du TP nach meiner Vorhersage nimmst, vergiss mich nicht in deinen Gebeten🔥
Konsistenz, Geduld ist das echte Spiel, also behalte BCH im Auge.
$BCH
{spot}(BCHUSDT)
Handelsplan
#BCH BCH ist auch Jagd Einzelhandelsöffnungsaufträge und zeigt jetzt ein bärisches Momentum, respektiert aber auch mein OB in 3 Mal. Mein Slot ist auf Verkaufsseite geöffnet.
Deshalb nehme Position, um das letzte HH oder SW hoch in beliebiger Menge zu erreichen, aber das Verkaufsziel ist $640 und Setzen TP 70% Verhältnis. Wenn du TP nach meiner Vorhersage nimmst, vergiss mich nicht in deinen Gebeten🔥
Konsistenz, Geduld ist das echte Spiel, also behalte BCH im Auge.
$BCH
#BCH BCH ist auch Jagd Einzelhandelsöffnungsaufträge und zeigt jetzt ein bärisches Momentum, respektiert aber auch mein OB in 3 Mal. Mein Slot ist auf Verkaufsseite geöffnet.
Deshalb nehme Position, um das letzte HH oder SW hoch in beliebiger Menge zu erreichen, aber das Verkaufsziel ist $640 und Setzen TP 70% Verhältnis. Wenn du TP nach meiner Vorhersage nimmst, vergiss mich nicht in deinen Gebeten🔥
Konsistenz, Geduld ist das echte Spiel, also behalte BCH im Auge.
$BCH
169
·
--
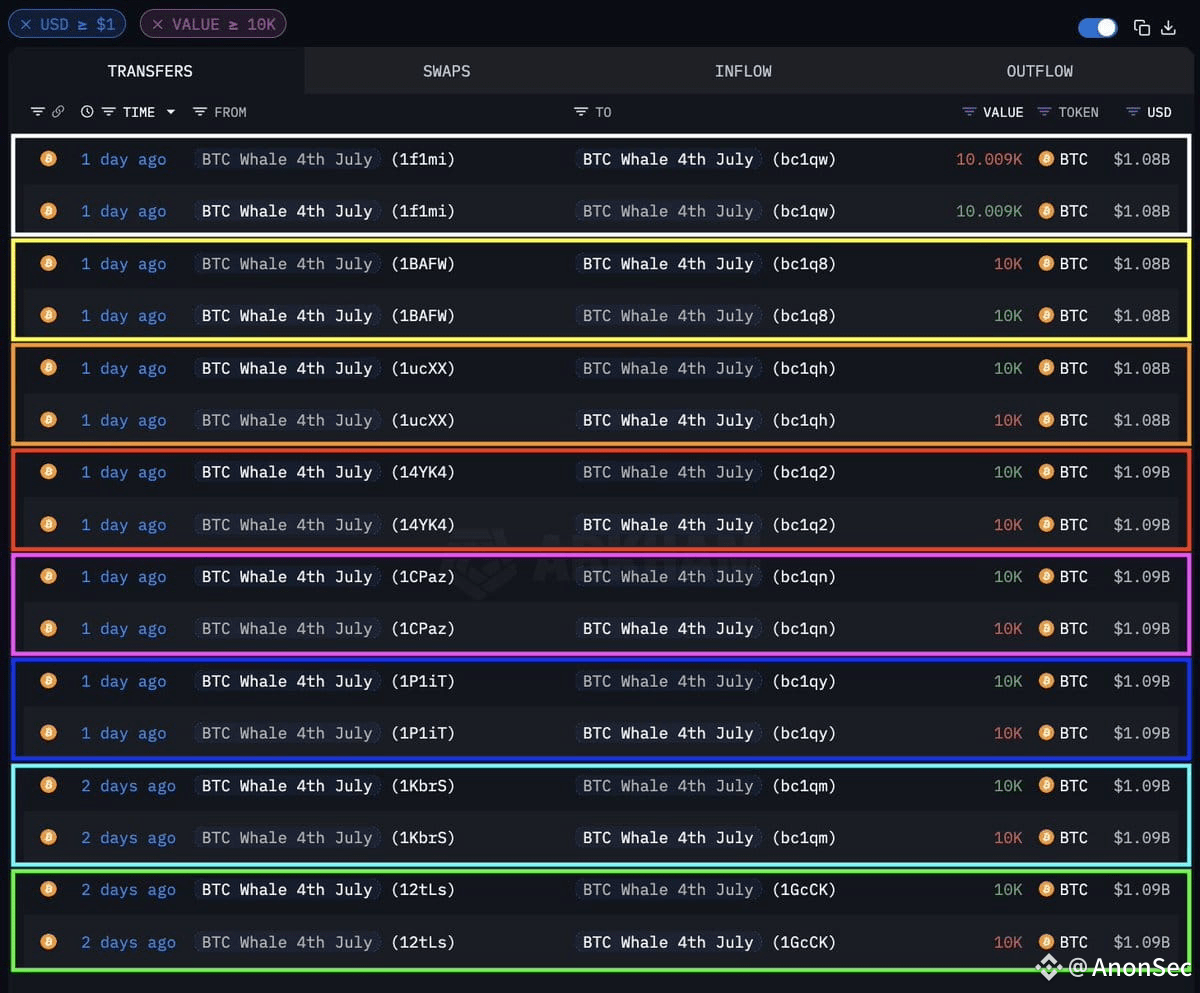
GERADE EINGEGANGEN: Ungefähr 8 Milliarden Dollar in Bitcoin wurden gestern transferiert, wahrscheinlich aufgrund eines Adressformat-Upgrades von Legacy zu bc1q, laut Arkham. Es gibt keine Hinweise darauf, dass große Investoren verkaufen.
$BTC #OneBigBeautifulBill #BTCWhaleMovement #SpotVSFuturesStrategy #BTC #BinanceHODLerSAHARA
GERADE EINGEGANGEN: Ungefähr 8 Milliarden Dollar in Bitcoin wurden gestern transferiert, wahrscheinlich aufgrund eines Adressformat-Upgrades von Legacy zu bc1q, laut Arkham. Es gibt keine Hinweise darauf, dass große Investoren verkaufen.
$BTC #OneBigBeautifulBill #BTCWhaleMovement #SpotVSFuturesStrategy #BTC #BinanceHODLerSAHARA
$BTC #OneBigBeautifulBill #BTCWhaleMovement #SpotVSFuturesStrategy #BTC #BinanceHODLerSAHARA
1
28
·
--
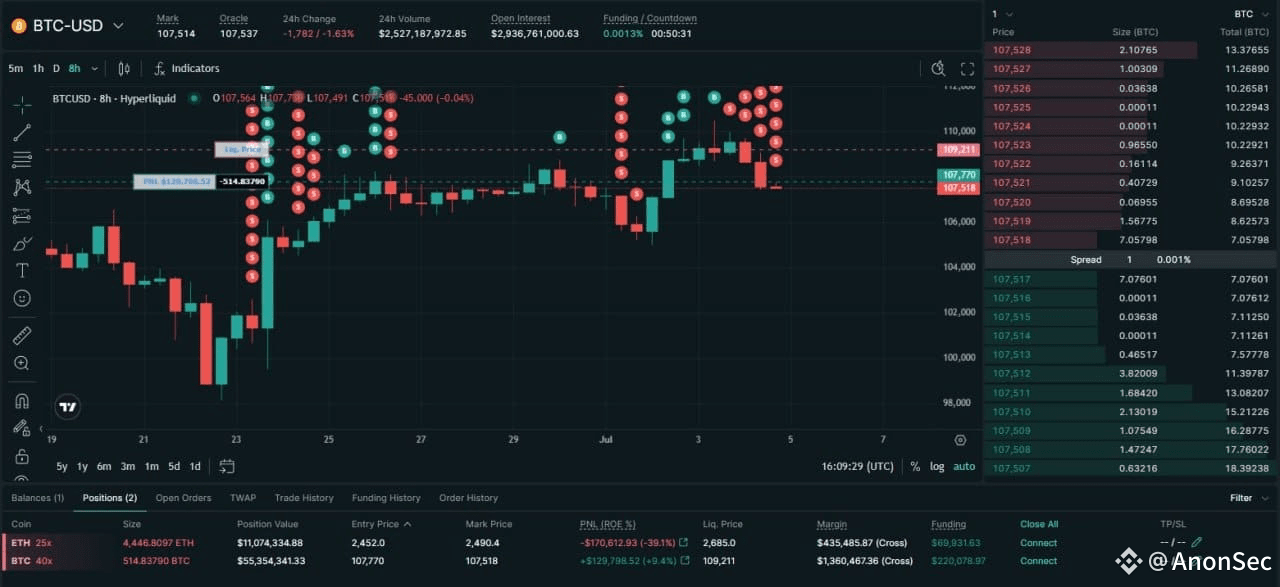
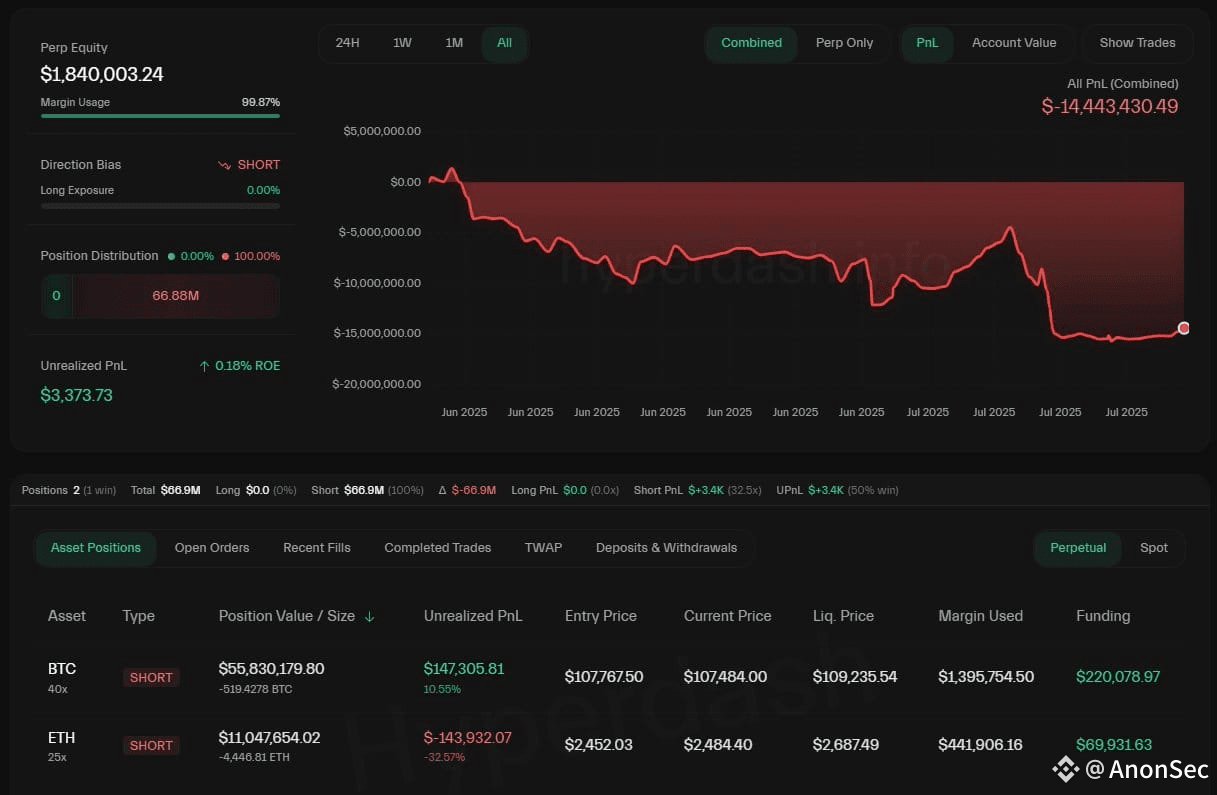
Nachdem der unbekannte Wal 10 Mal hintereinander teilweise liquidiert wurde, hat er erneut seine $BTC (40x) und $ETH (25x) Short-Positionen erhöht.
Er hat in diesem Handel 16 Mio. $ verloren und insgesamt liegt er derzeit über
#NFPWatch #TrumpVsMusk #DYMBinanceHODL #REX-OSPREYSolanaETF #OneBigBeautifulBill
Nachdem der unbekannte Wal 10 Mal hintereinander teilweise liquidiert wurde, hat er erneut seine $BTC (40x) und $ETH (25x) Short-Positionen erhöht.
Er hat in diesem Handel 16 Mio. $ verloren und insgesamt liegt er derzeit über
#NFPWatch #TrumpVsMusk #DYMBinanceHODL #REX-OSPREYSolanaETF #OneBigBeautifulBill
Er hat in diesem Handel 16 Mio. $ verloren und insgesamt liegt er derzeit über
#NFPWatch #TrumpVsMusk #DYMBinanceHODL #REX-OSPREYSolanaETF #OneBigBeautifulBill
3
·
--
18 Uhr BUCHEN SIE IHREN GEWINN
18 Uhr BUCHEN SIE IHREN GEWINN

Ahsanali1997
·
--
Halte immer noch
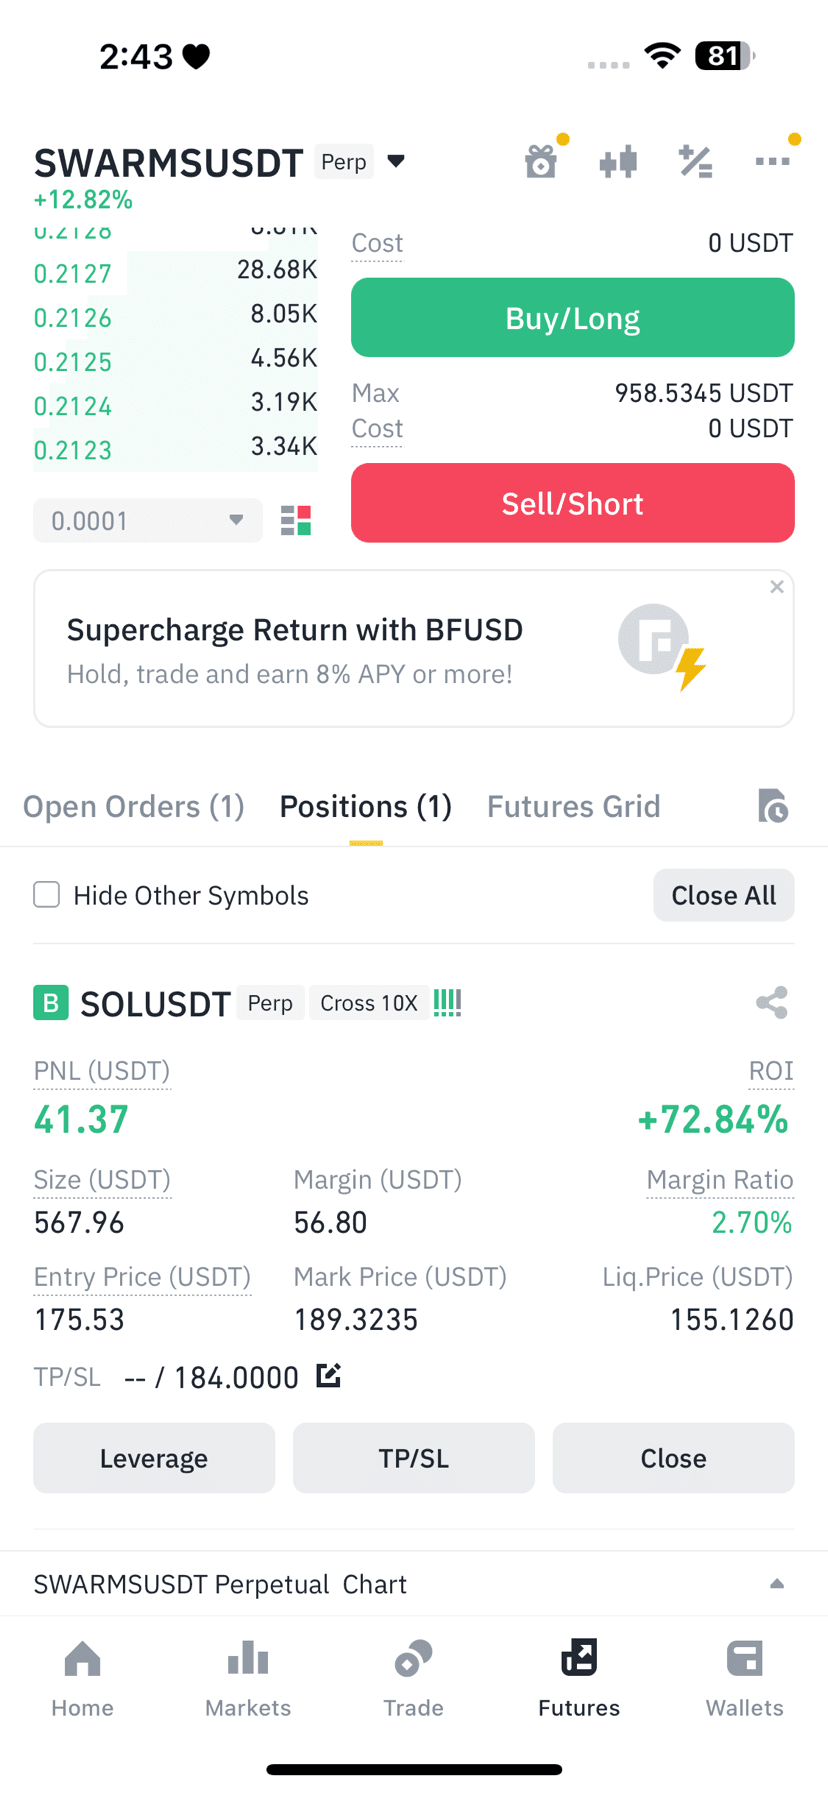
Anleitung, bitte? Soll ich jetzt schließen?
#sol
Anleitung, bitte? Soll ich jetzt schließen?
#sol
3
Anmelden und weiter Inhalte entdecken
Krypto-Nutzer weltweit auf Binance Square kennenlernen
⚡️ Bleib in Sachen Krypto stets am Puls.
💬 Die weltgrößte Kryptobörse vertraut darauf.
👍 Erhalte verlässliche Einblicke von verifizierten Creators.
E-Mail-Adresse/Telefonnummer
Trendthemen
EtherGains70.9%InQ3
176,981 Aufrufe
1,187 Kommentare
🧭🧭🧭 Analyse 🧭🧭🧭
💡 Indikator für die Saison von Altcoins 💡
🚨🚨🚨 Das dritte Quartal (T3) ist nun abgeschlossen. ETH ist um 71% gestiegen und BTC um 43%. 🚨🚨🚨
War das der Beginn der Altcoin-Saison?
Unter den besten 100:
🌐🌐🌐 57 haben BTC in 90 Tagen outperformt
Die Altcoin-Saison beginnt bei 75, also ist es
Außerdem liegt sie nur 10 Punkte unter ihrem jährlichen Hoch bei 67 🌐🌐
💥💥💥 Aber Moment… vor einem Monat lag der Index erst bei 23!
Kann Oktober ihn auf 75 pushen? 👀💥💥💥
Bitte bleiben Sie dran
#EtherGains70.9%InQ3
$GRAM
Shamika Metting
·3 Likes
·1.1k Aufrufe
TreasuryLetsStatesFileStablecoinCertificationsEarly
11,616 Aufrufe
93 Kommentare
US10YearYieldNears5.3%
160,399 Aufrufe
1,161 Kommentare