

Liz Ann Sonders Re-poster
1.8k Beiträge

Liz Ann Sonders Re-poster
Melden
Nutzer blockieren
Chief Investment Strategist, Schwab Center for Financial Research.
0 Following
385 Follower
920 Like gegeben
Beiträge
Übersetzung ansehen
The labor differential reported by .@conferenceboard climbed to 5.3% during October, which represents an increase of almost 2.5 percentage points from the preceding month. This useful economic indicator is calculated by taking the percentage of consumers who describe jobs as plentiful and subtracting the share of individuals who feel employment is hard to get.
The labor differential reported by .@conferenceboard climbed to 5.3% during October, which represents an increase of almost 2.5 percentage points from the preceding month. This useful economic indicator is calculated by taking the percentage of consumers who describe jobs as plentiful and subtracting the share of individuals who feel employment is hard to get.
2
Übersetzung ansehen
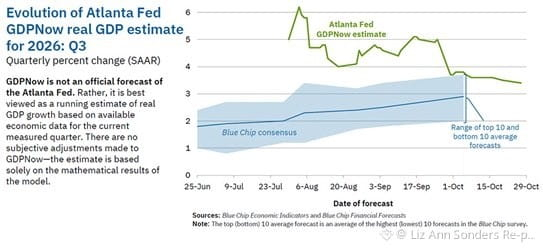
If you are following the latest economic forecasts, the GDPNow model from @AtlantaFed has just revised its real GDP estimate for 3Q2026. The new projection currently stands at +3.4%. This is a slight dip from the prior reading of +3.5% that was released on October 20.
If you are following the latest economic forecasts, the GDPNow model from @AtlantaFed has just revised its real GDP estimate for 3Q2026. The new projection currently stands at +3.4%. This is a slight dip from the prior reading of +3.5% that was released on October 20.
2
Übersetzung ansehen
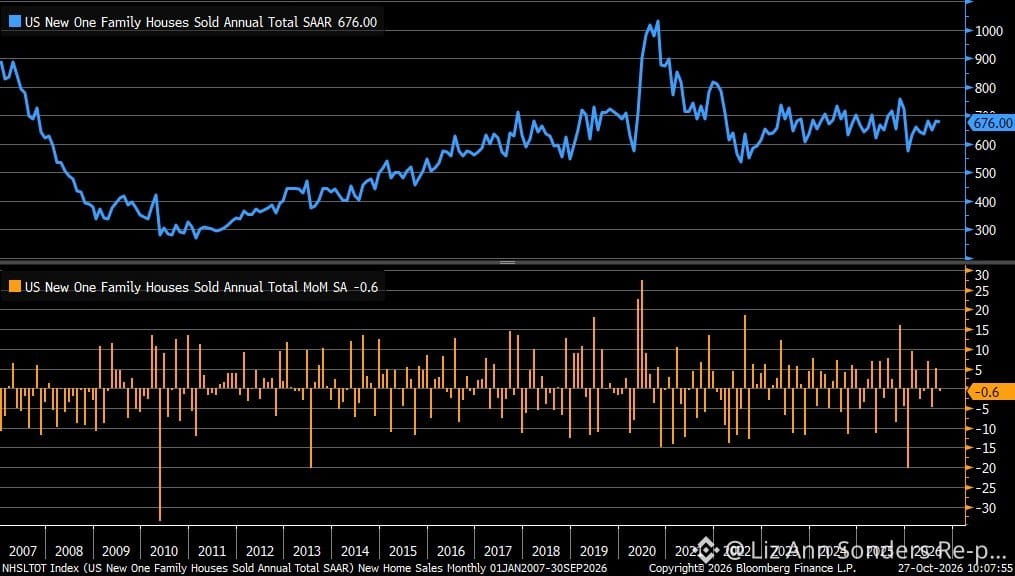
For the month of September, sales of newly built homes experienced a slight month-over-month decrease of 0.6 percent. This dip was considerably smaller than the 4.5 percent decline that experts had originally estimated. In addition, the sales growth from the previous month was revised downward to a 5.1 percent increase, adjusting the initially reported 6.4 percent gain. Turning to property values, the median price for a new home climbed by 3.9 percent compared to the prior month, reaching $400,400. Meanwhile, the overall average selling price for the month came in at $472,800.
For the month of September, sales of newly built homes experienced a slight month-over-month decrease of 0.6 percent. This dip was considerably smaller than the 4.5 percent decline that experts had originally estimated. In addition, the sales growth from the previous month was revised downward to a 5.1 percent increase, adjusting the initially reported 6.4 percent gain. Turning to property values, the median price for a new home climbed by 3.9 percent compared to the prior month, reaching $400,400. Meanwhile, the overall average selling price for the month came in at $472,800.
1
Übersetzung ansehen
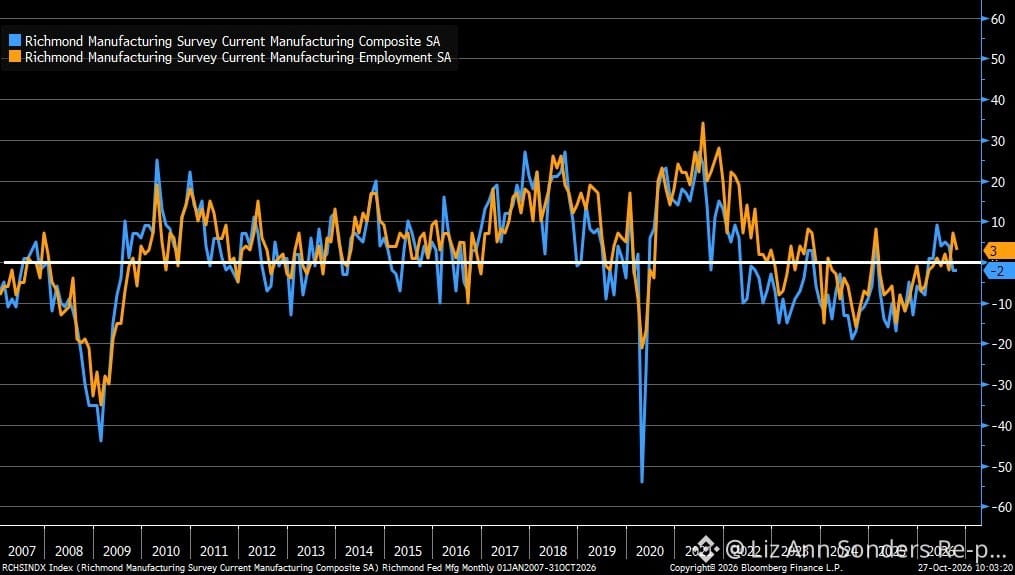
For the month of October, the @RichmondFed Manufacturing Index remained flat with a reading of -2, which matched the -2 recorded in the prior month but fell short of the estimated 0. Breaking down the specific categories, the index for new orders declined to -8 from the previous figure of -6. On the other hand, shipments saw an improvement, rising to 0 from the -5 reported previously. Finally, the employment metric came in at +3, indicating growth but showing a slowdown compared to the prior reading of +7.
For the month of October, the @RichmondFed Manufacturing Index remained flat with a reading of -2, which matched the -2 recorded in the prior month but fell short of the estimated 0. Breaking down the specific categories, the index for new orders declined to -8 from the previous figure of -6. On the other hand, shipments saw an improvement, rising to 0 from the -5 reported previously. Finally, the employment metric came in at +3, indicating growth but showing a slowdown compared to the prior reading of +7.
1
Übersetzung ansehen
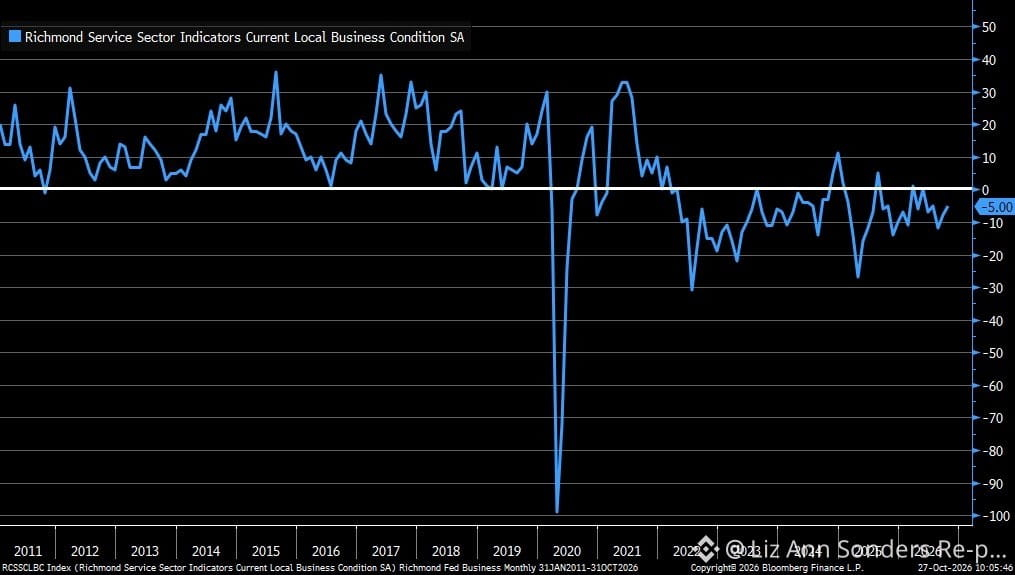
The October Services Index published by the @RichmondFed showed an overall improvement, rising to -5 compared to the previous reading of -8. Taking a closer look at the individual components, demand experienced a solid increase, climbing to +7 from the earlier +2. Revenues also saw a positive shift, moving to +2 from a prior level of 0. The employment metric ticked slightly higher, reaching +3 from the previous +2. Meanwhile, the capex measurement adjusted to -6 against a prior figure of -3.
The October Services Index published by the @RichmondFed showed an overall improvement, rising to -5 compared to the previous reading of -8. Taking a closer look at the individual components, demand experienced a solid increase, climbing to +7 from the earlier +2. Revenues also saw a positive shift, moving to +2 from a prior level of 0. The employment metric ticked slightly higher, reaching +3 from the previous +2. Meanwhile, the capex measurement adjusted to -6 against a prior figure of -3.
1
Übersetzung ansehen
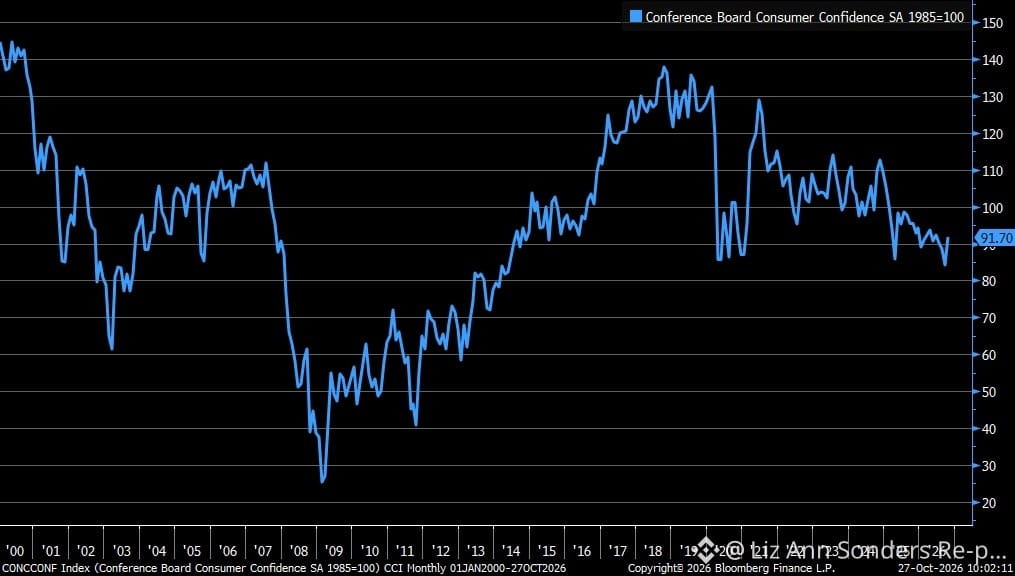
We have some encouraging economic news to share for October. The Consumer Confidence Index released by @Conferenceboard has climbed to 91.7, easily outperforming the estimated forecast of 81.0. In addition, the prior reading saw an upward revision from 81.9 to 84.2. Looking at the underlying metrics, the assessment of the present situation increased to 120.4 compared to the previous 111.8. Consumer expectations also experienced a positive shift, rising to 72.6 from the former mark of 65.7.
We have some encouraging economic news to share for October. The Consumer Confidence Index released by @Conferenceboard has climbed to 91.7, easily outperforming the estimated forecast of 81.0. In addition, the prior reading saw an upward revision from 81.9 to 84.2. Looking at the underlying metrics, the assessment of the present situation increased to 120.4 compared to the previous 111.8. Consumer expectations also experienced a positive shift, rising to 72.6 from the former mark of 65.7.
3
Übersetzung ansehen
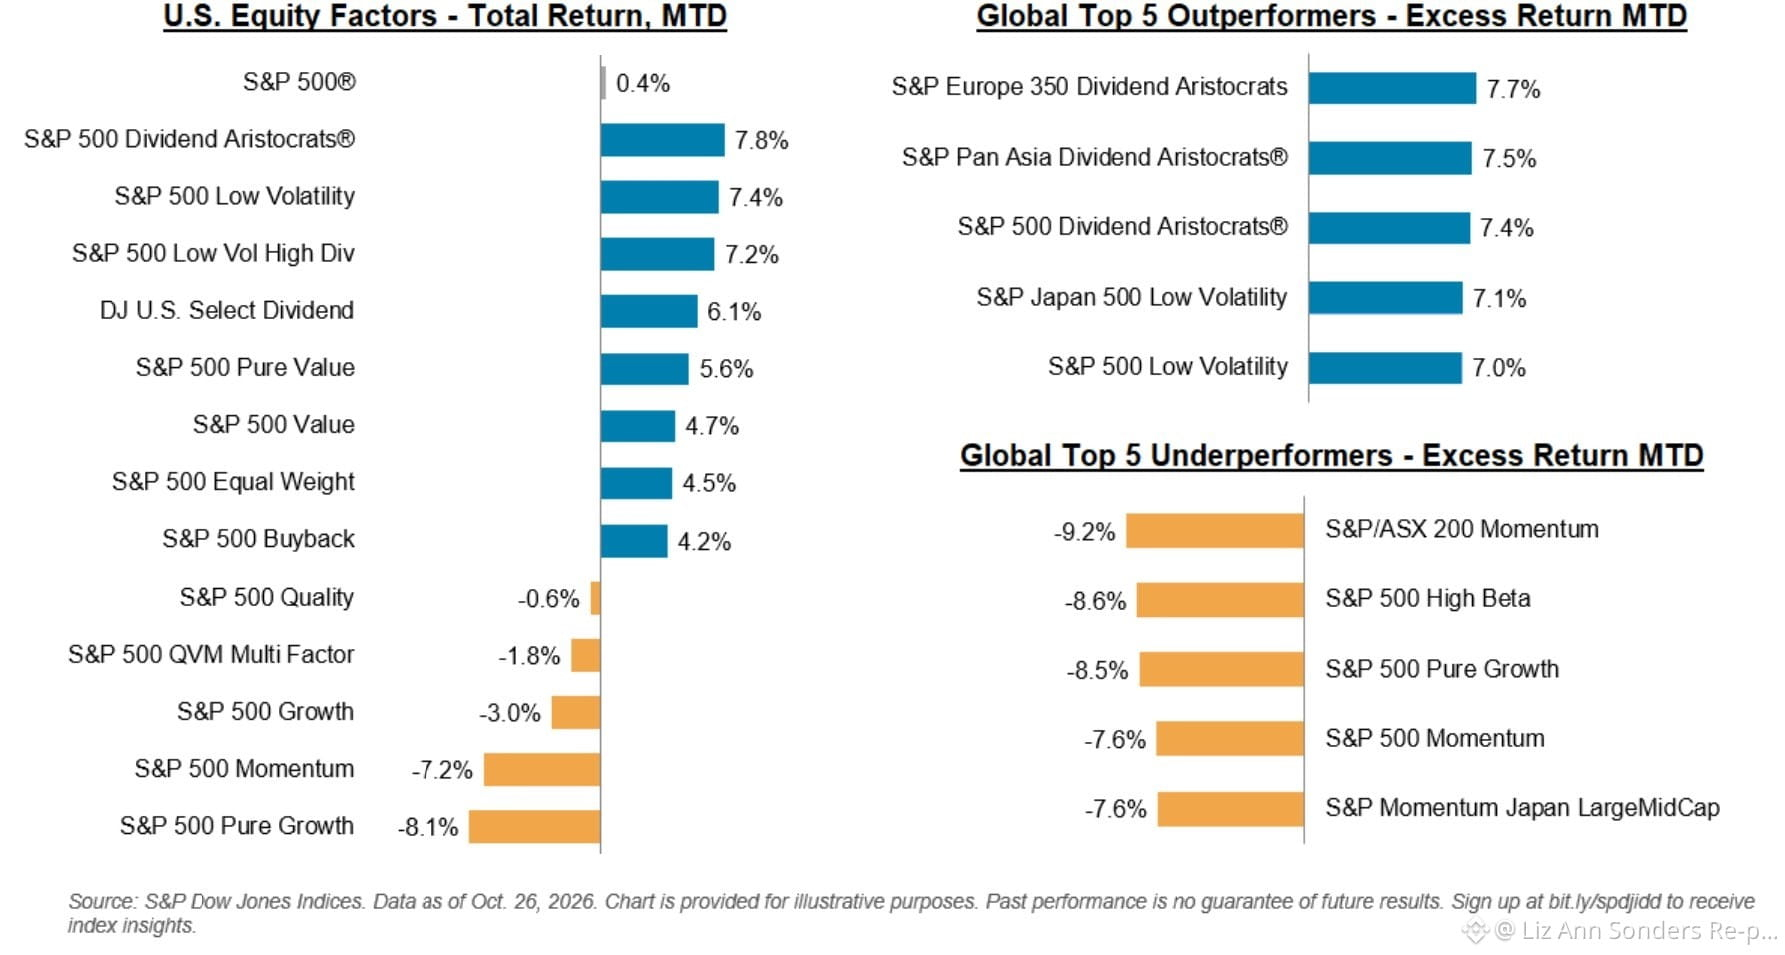
We are seeing a very noticeable shift in market drivers this month based on the latest @SPDJIndices factor rotation. Conservative investment approaches are currently taking the lead, and this trend extends far beyond the U.S. market. Specifically, Low Volatility and Dividend Aristocrats are setting the pace as the clear top performers. In contrast, Momentum and Pure Growth are having a much harder time gaining traction. This preference for defensive strategies is a truly global theme, with strong outperformance observed throughout Asia and Europe. Furthermore, the Momentum factor has specifically fallen behind across both Australia and Japan.
We are seeing a very noticeable shift in market drivers this month based on the latest @SPDJIndices factor rotation. Conservative investment approaches are currently taking the lead, and this trend extends far beyond the U.S. market. Specifically, Low Volatility and Dividend Aristocrats are setting the pace as the clear top performers. In contrast, Momentum and Pure Growth are having a much harder time gaining traction. This preference for defensive strategies is a truly global theme, with strong outperformance observed throughout Asia and Europe. Furthermore, the Momentum factor has specifically fallen behind across both Australia and Japan.
Übersetzung ansehen
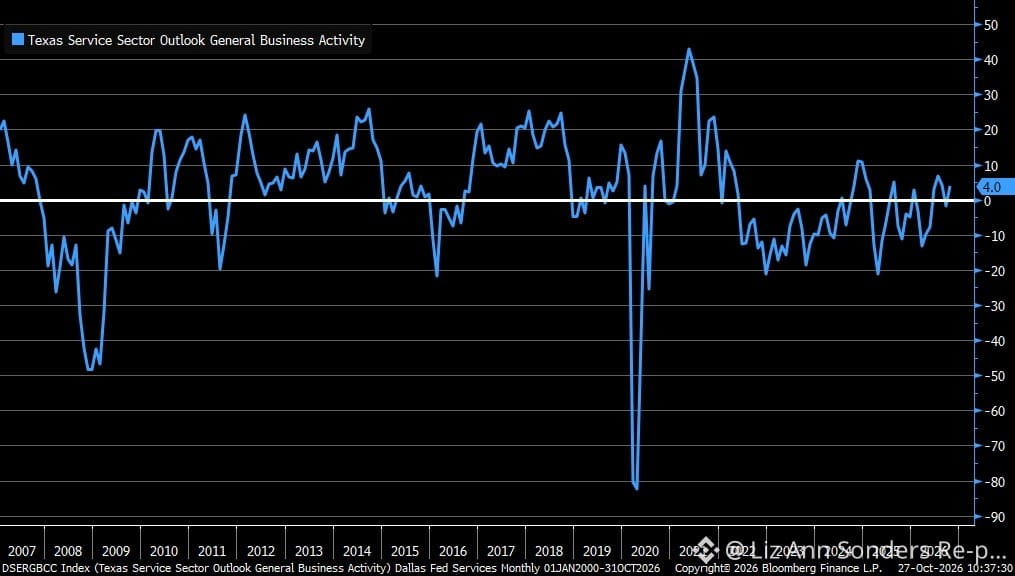
October @DallasFed Services Index up to +4.0 vs. -2.9 est. & -1.8 prior; company outlook up to +3.0 vs. -3.2 prior; revenue up to +4.4 vs. -0.9 prior; employment down to 2.8 vs. 4.1 prior
October @DallasFed Services Index up to +4.0 vs. -2.9 est. & -1.8 prior; company outlook up to +3.0 vs. -3.2 prior; revenue up to +4.4 vs. -0.9 prior; employment down to 2.8 vs. 4.1 prior
Übersetzung ansehen
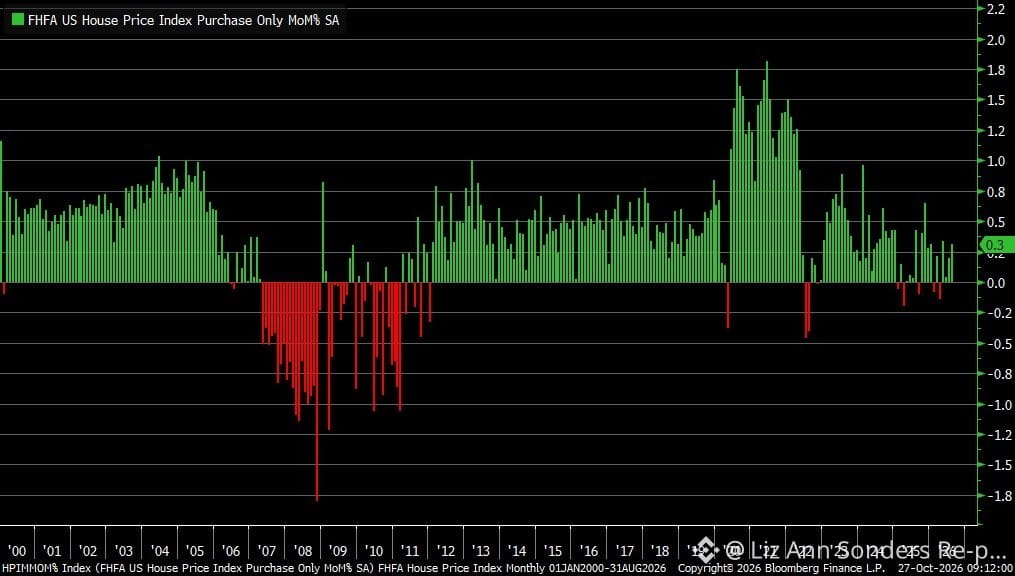
The residential real estate market experienced yet another increase in property values during August. Based on the most recent data, the FHFA House Price Index grew by 0.3% on a month-over-month basis. This upward movement exceeded the projected estimate of 0.2% and also outpaced the prior period's 0.2% rise. When looking at the broader picture, the index has climbed 2.4% compared to where it stood exactly a year ago.
The residential real estate market experienced yet another increase in property values during August. Based on the most recent data, the FHFA House Price Index grew by 0.3% on a month-over-month basis. This upward movement exceeded the projected estimate of 0.2% and also outpaced the prior period's 0.2% rise. When looking at the broader picture, the index has climbed 2.4% compared to where it stood exactly a year ago.
1
Übersetzung ansehen
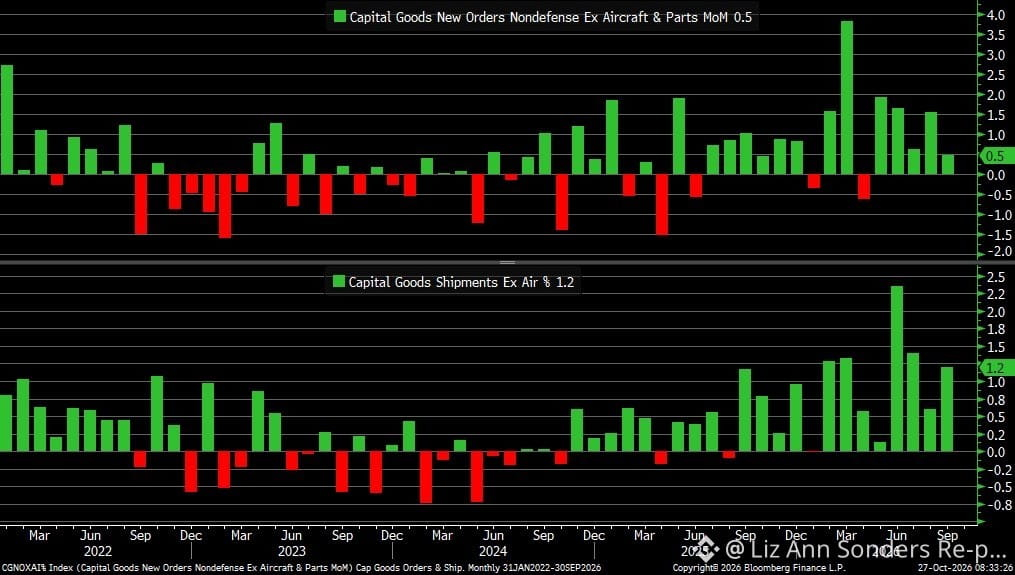
Taking a look at the economic numbers for September, month-over-month core goods orders experienced a 0.5 percent increase. This reading came in slightly under the forecasted 0.7 percent and represented a slowdown compared to the previous gain of 1.6 percent. In contrast, shipments of core capital goods rose by a solid 1.2 percent. This figure successfully surpassed the expected 0.8 percent estimate while also improving upon the prior reading of 0.6 percent.
Taking a look at the economic numbers for September, month-over-month core goods orders experienced a 0.5 percent increase. This reading came in slightly under the forecasted 0.7 percent and represented a slowdown compared to the previous gain of 1.6 percent. In contrast, shipments of core capital goods rose by a solid 1.2 percent. This figure successfully surpassed the expected 0.8 percent estimate while also improving upon the prior reading of 0.6 percent.
2
Übersetzung ansehen
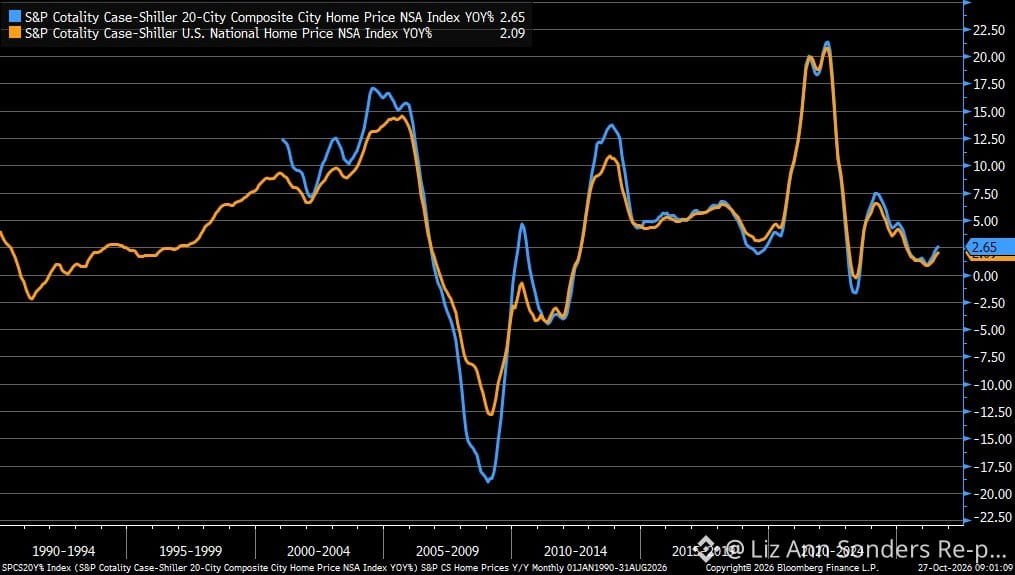
The housing data for August highlights some interesting updates. When reviewing the S&P Cotality Case-Shiller 20-City Home Price Index, marked in blue, there was a year-over-year increase of 2.65%. This reflects a noticeably faster pace than the prior recording of 2.47%. Meanwhile, the National Home Price Index, which is shown in orange, experienced a 2.09% rise on an annual basis. This performance similarly outpaced its previous figure of 1.92%.
The housing data for August highlights some interesting updates. When reviewing the S&P Cotality Case-Shiller 20-City Home Price Index, marked in blue, there was a year-over-year increase of 2.65%. This reflects a noticeably faster pace than the prior recording of 2.47%. Meanwhile, the National Home Price Index, which is shown in orange, experienced a 2.09% rise on an annual basis. This performance similarly outpaced its previous figure of 1.92%.
3
Übersetzung ansehen
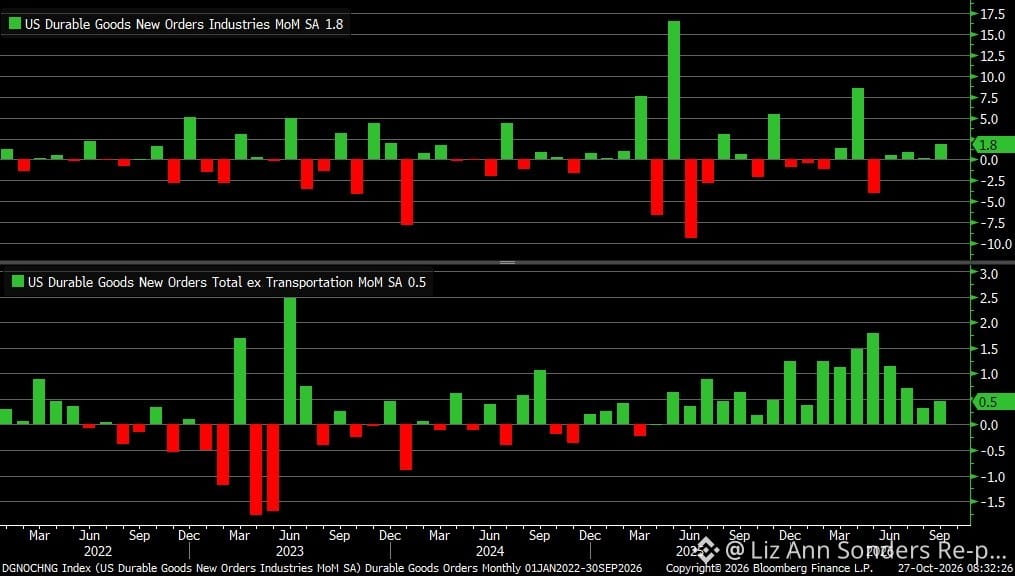
During September, month-over-month durable goods orders increased by 1.8%. While this figure fell just short of the 1.9% estimate, it showed a noticeable pickup compared to the prior 0.1% gain. Looking at the data excluding transportation, orders rose by 0.5%. This result was slightly below the 0.6% expectation but still represented an improvement over the previous 0.3% mark.
During September, month-over-month durable goods orders increased by 1.8%. While this figure fell just short of the 1.9% estimate, it showed a noticeable pickup compared to the prior 0.1% gain. Looking at the data excluding transportation, orders rose by 0.5%. This result was slightly below the 0.6% expectation but still represented an improvement over the previous 0.3% mark.
Übersetzung ansehen
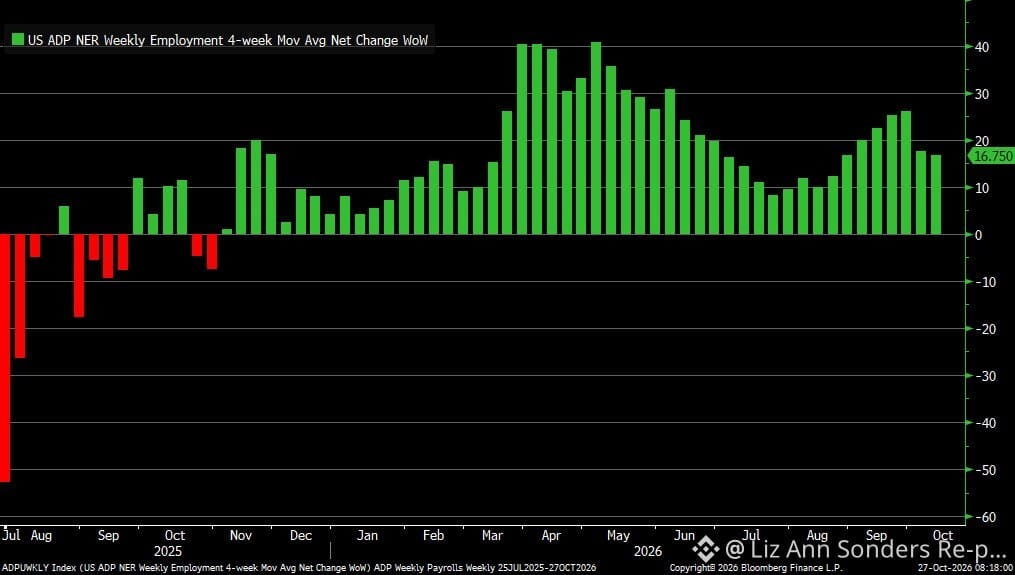
Recent insights shared by @adpresearch indicate that employment growth has cooled down for the second week in a row. Over the four-week stretch concluding on October 10, private employers brought on an average of 16,750 new workers. This marks a decline from the previous week's reported level, which stood at 17,500 additions to private payrolls.
Recent insights shared by @adpresearch indicate that employment growth has cooled down for the second week in a row. Over the four-week stretch concluding on October 10, private employers brought on an average of 16,750 new workers. This marks a decline from the previous week's reported level, which stood at 17,500 additions to private payrolls.
2
Übersetzung ansehen
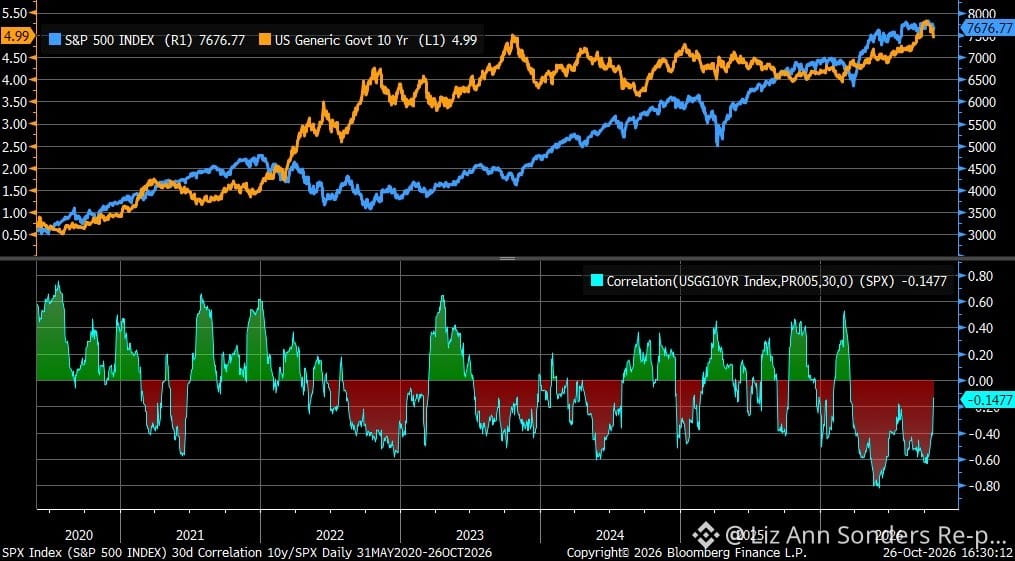
We are continuing to observe that the rolling correlation linking the S&P 500 and the 10y yield is maintaining its shift in a less negative direction.
We are continuing to observe that the rolling correlation linking the S&P 500 and the 10y yield is maintaining its shift in a less negative direction.
IEFETF+0,00%
SPYB+0,61%
Übersetzung ansehen
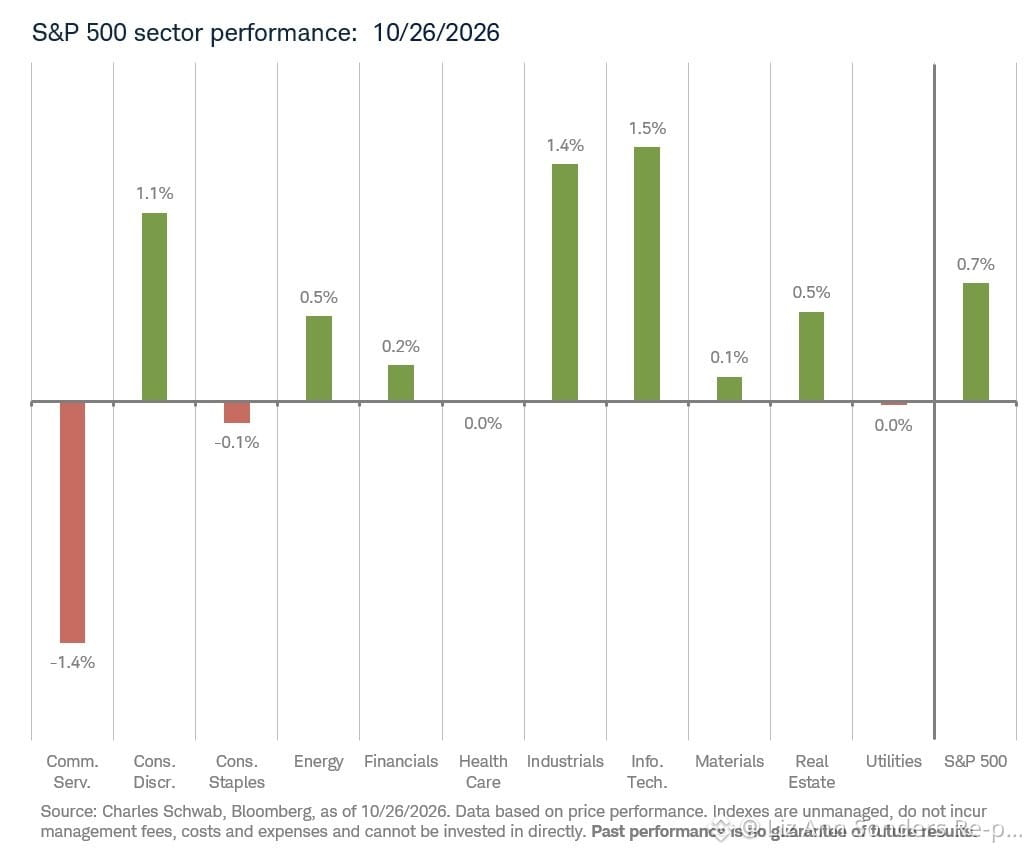
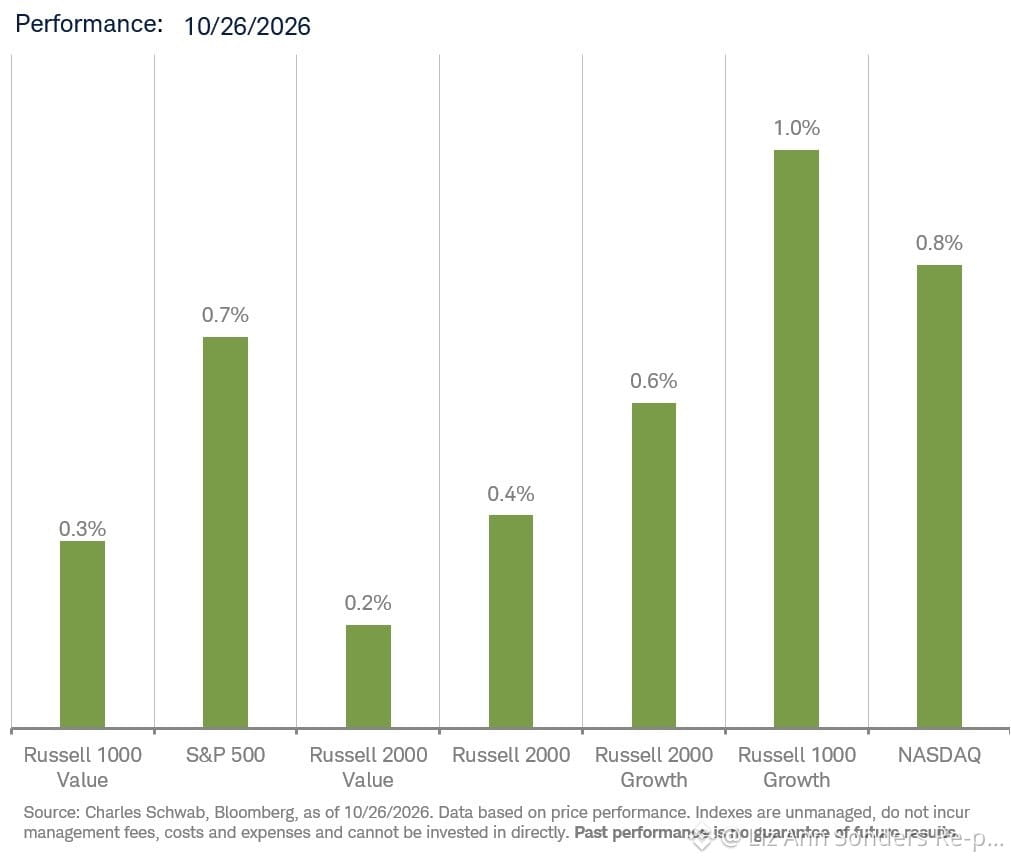
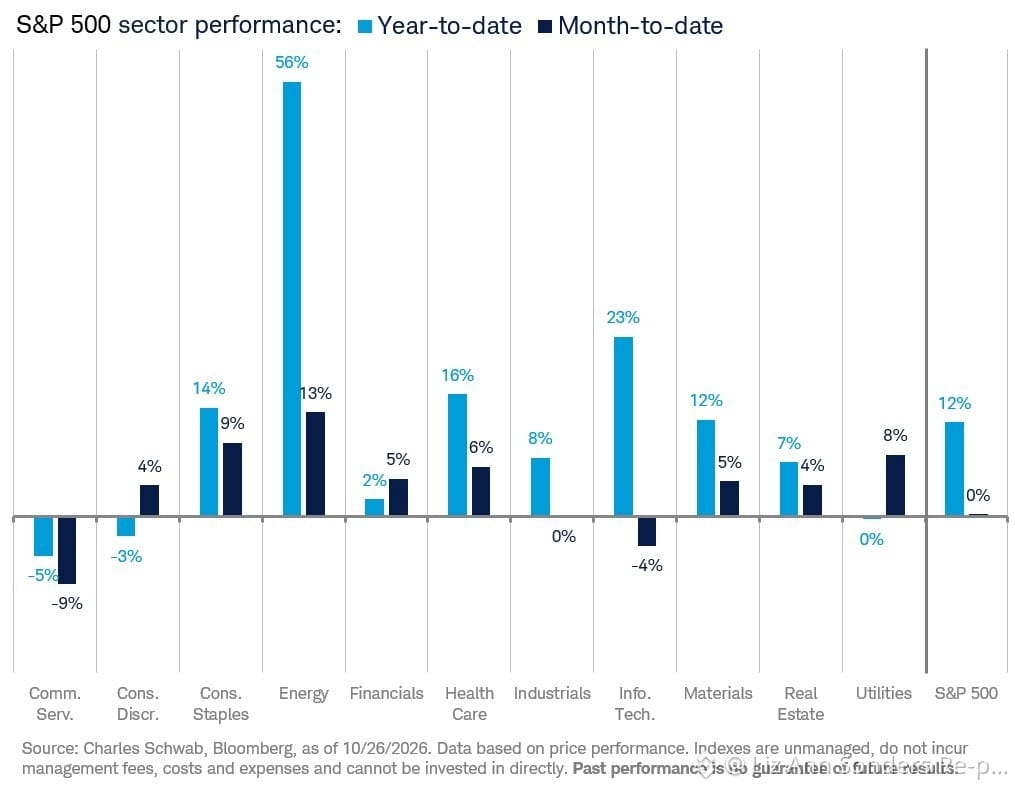
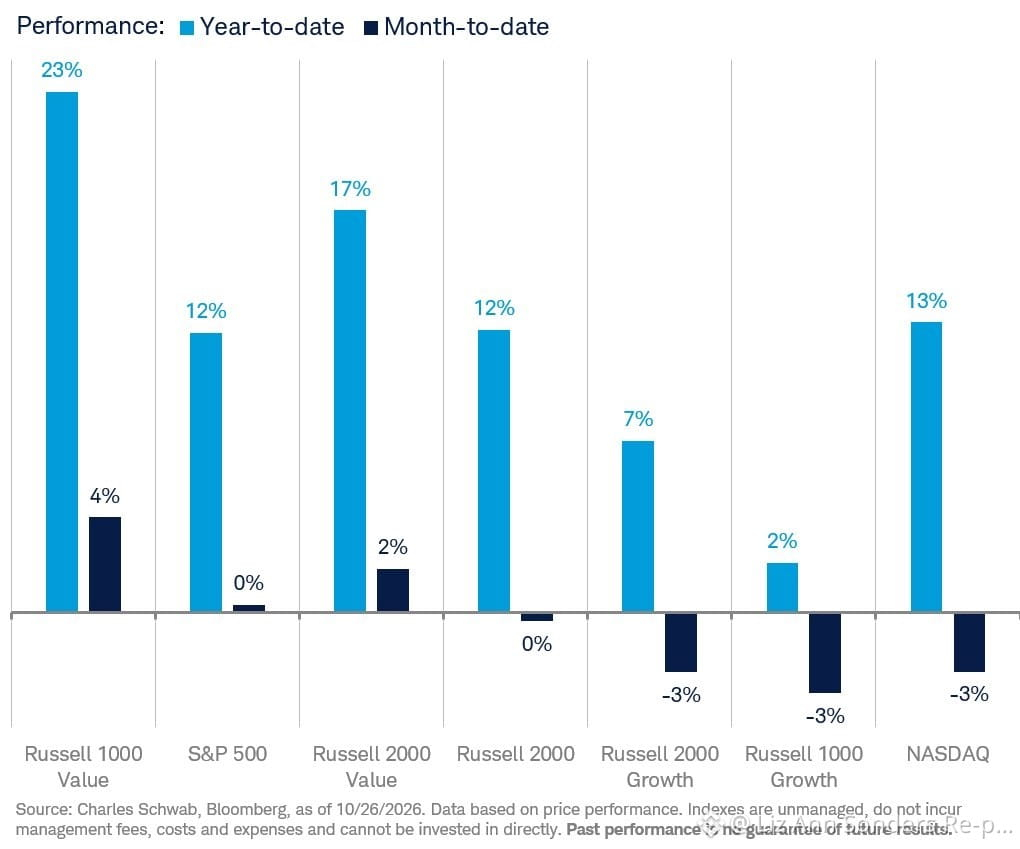
Here is a look at the recent performance data for various market sectors and indexes, highlighting the results from yesterday alongside the MTD and YTD figures.
Here is a look at the recent performance data for various market sectors and indexes, highlighting the results from yesterday alongside the MTD and YTD figures.
Übersetzung ansehen
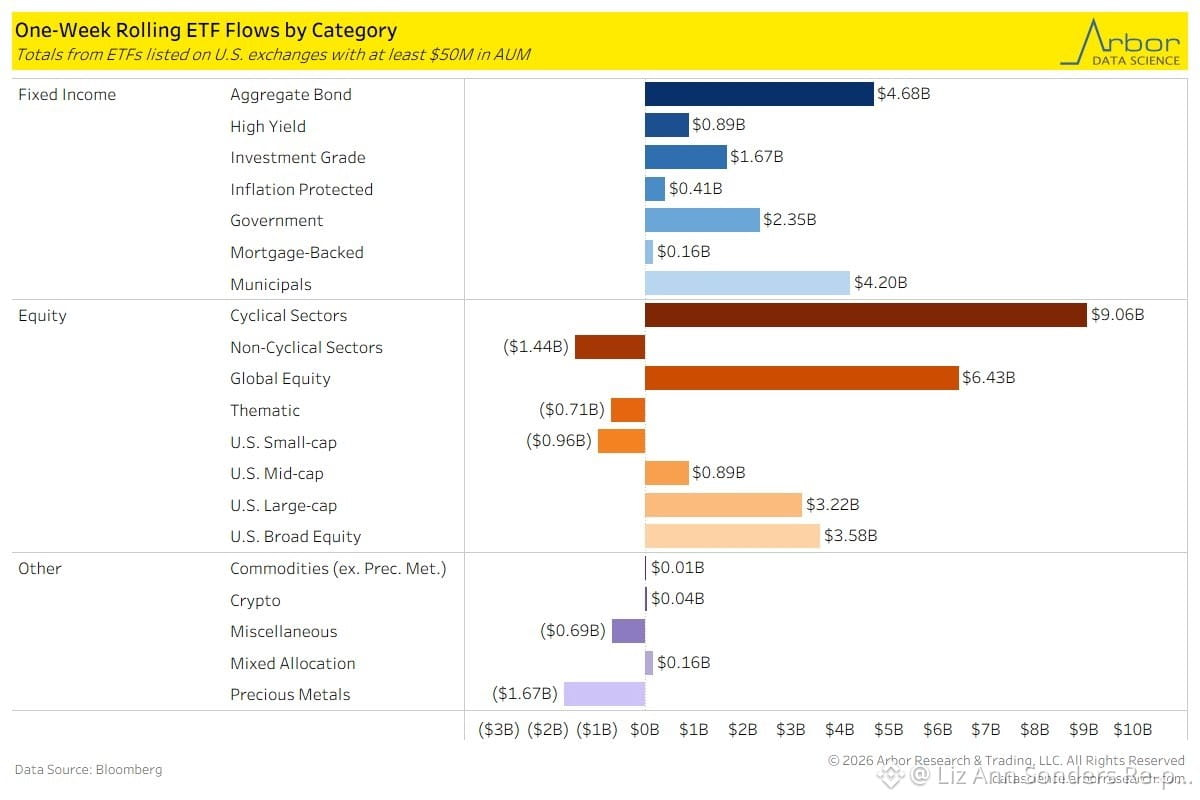
Here is a summary of market fund flows for the week that concluded on 10/23/26. Cyclical sector ETFs attracted the most equity inflows during this period. When looking at fixed income, aggregate bond ETFs recorded the highest level of incoming capital. Conversely, the precious metals group experienced the largest outflows out of every category.
@DataArbor
@DataArbor
28
Übersetzung ansehen
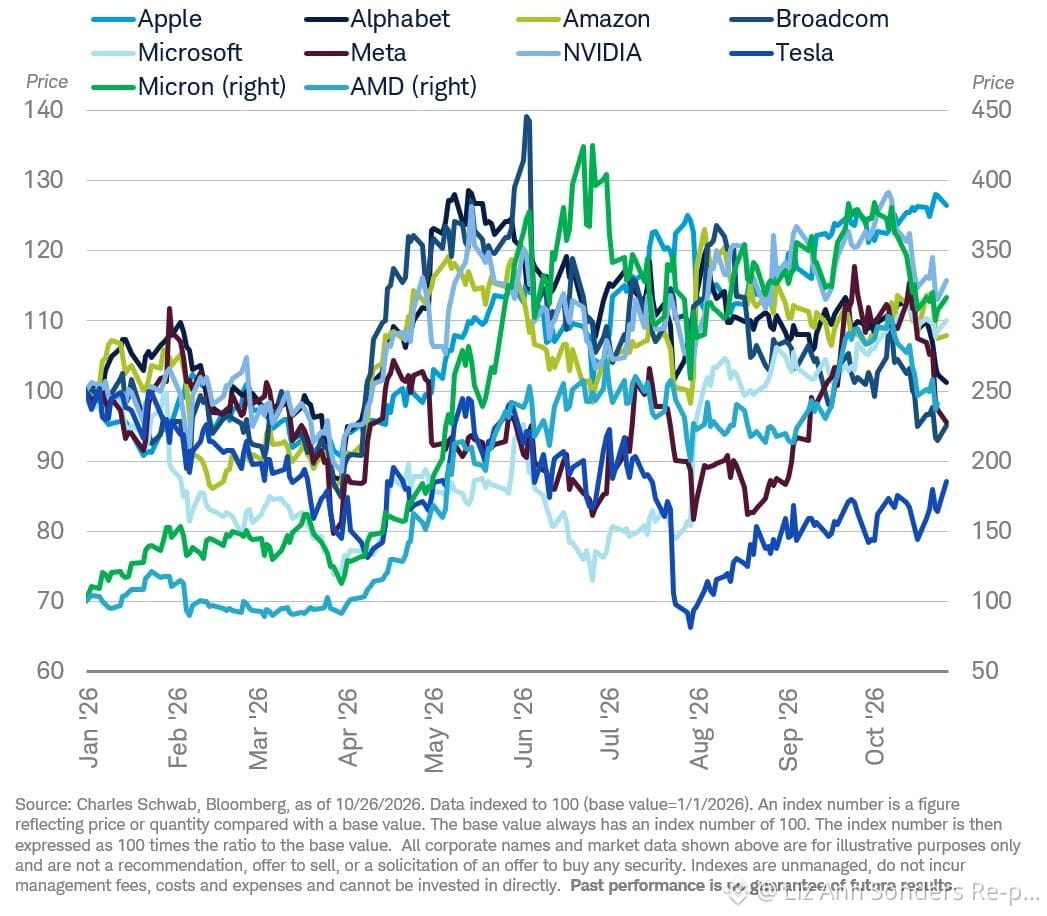
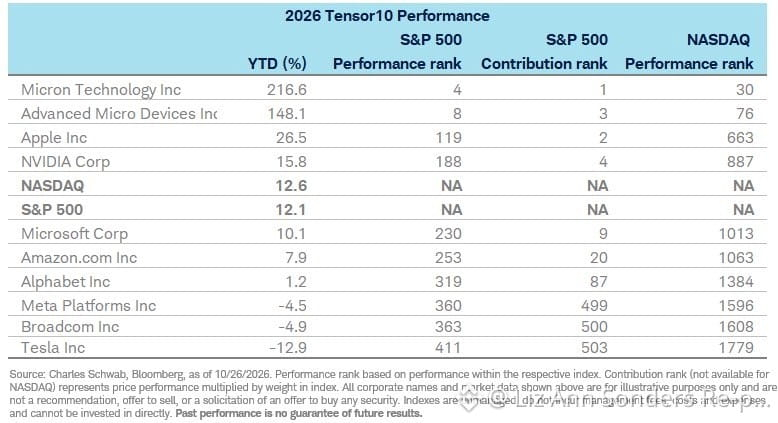
An analysis of the Tensor10 chart and table highlights a notable divergence. Looking at the data from a contribution standpoint, 5 out of the 10 secure a position in the top 10. However, when assessing the group based on price performance, merely 2 out of the 10 manage to rank within the top 100.
An analysis of the Tensor10 chart and table highlights a notable divergence. Looking at the data from a contribution standpoint, 5 out of the 10 secure a position in the top 10. However, when assessing the group based on price performance, merely 2 out of the 10 manage to rank within the top 100.
28
44
Übersetzung ansehen
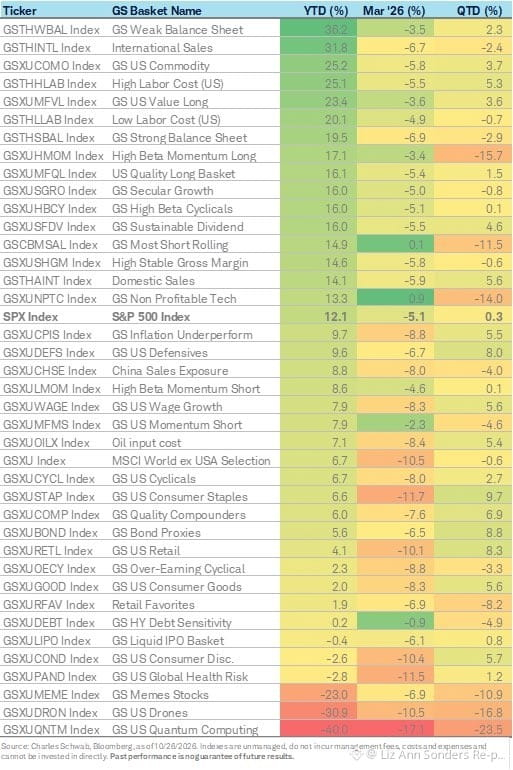
An overview of declines within the index alongside the percentage achieving superior performance.
An overview of declines within the index alongside the percentage achieving superior performance.
56
Übersetzung ansehen
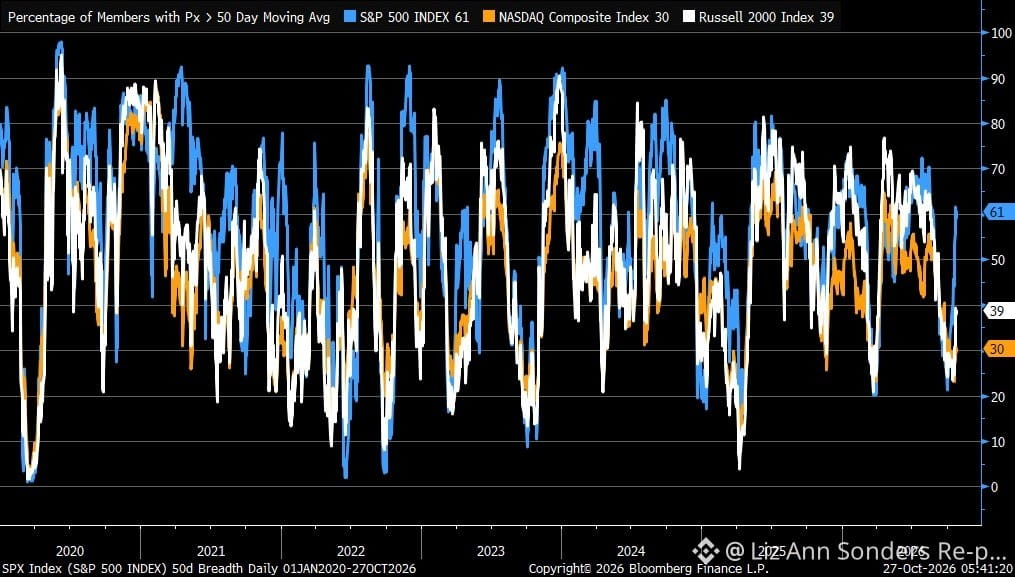
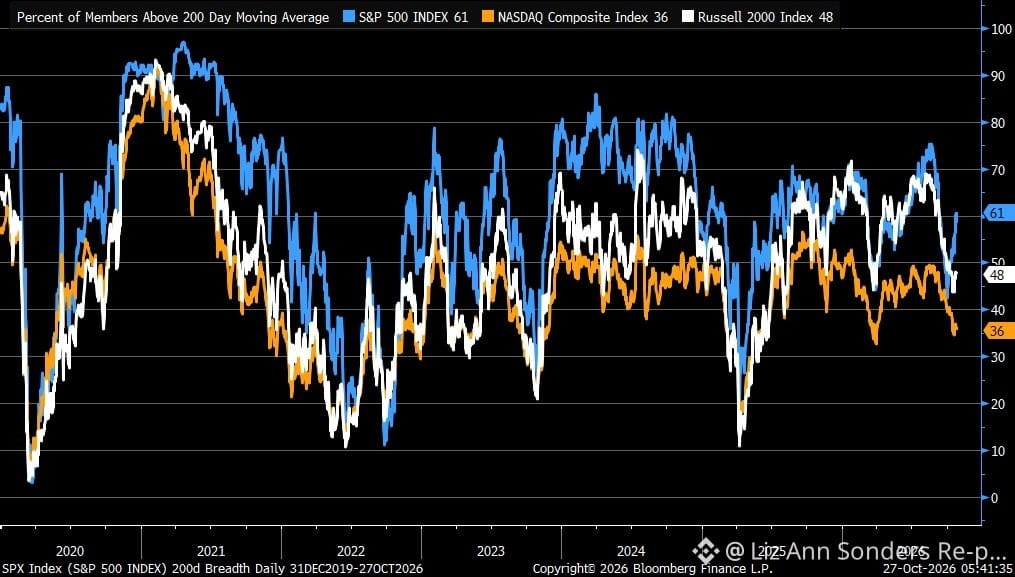
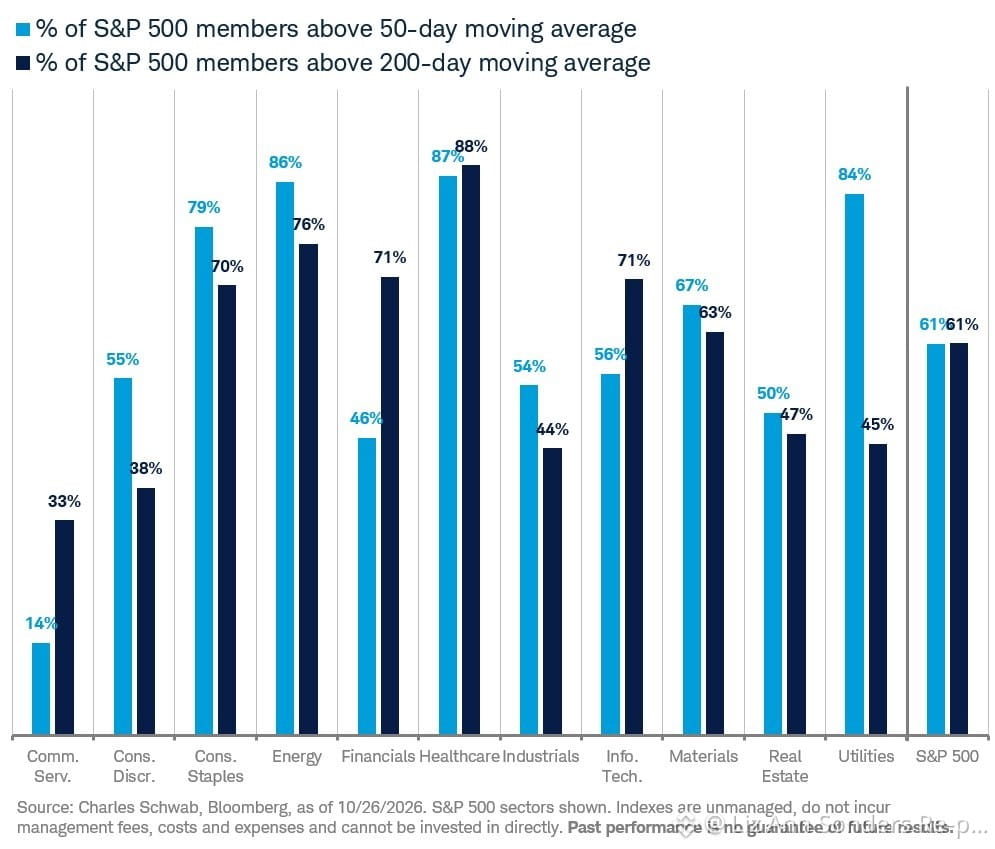
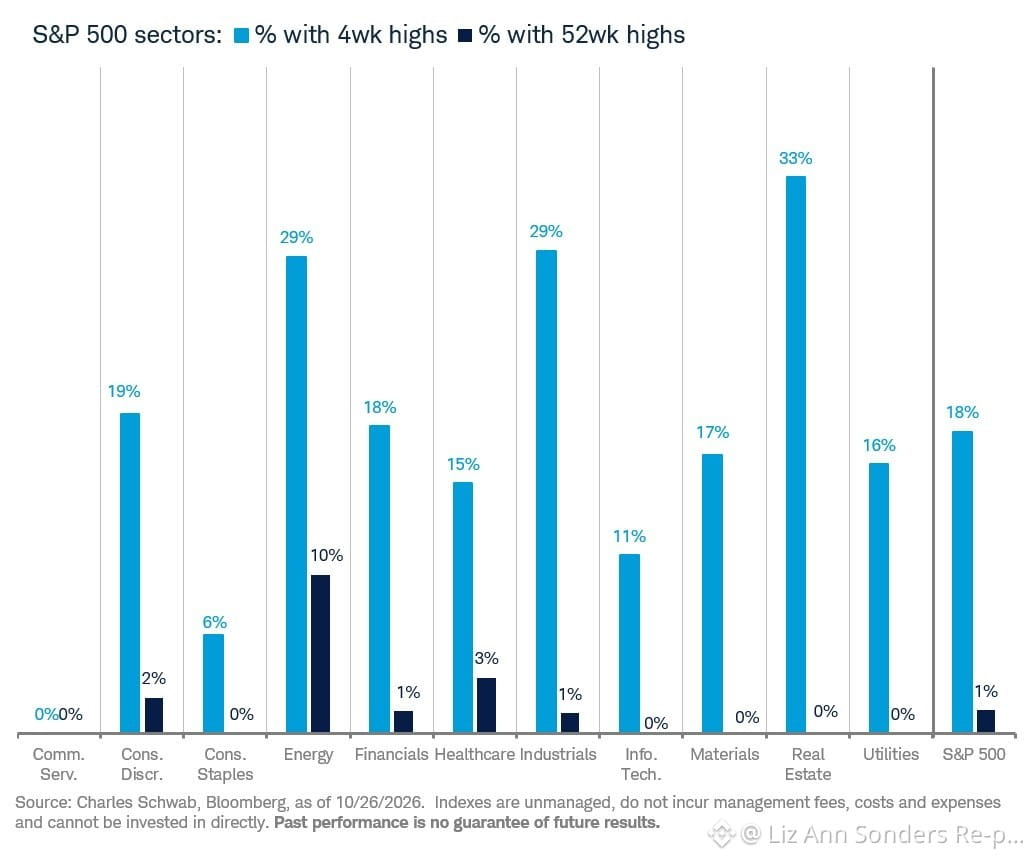
When reviewing the market breadth charts, an interesting detail stands out. The S&P 500 has shown a significantly larger improvement in its breadth when compared to the metrics we are seeing for either the NASDAQ or the Russell 1000.
When reviewing the market breadth charts, an interesting detail stands out. The S&P 500 has shown a significantly larger improvement in its breadth when compared to the metrics we are seeing for either the NASDAQ or the Russell 1000.
63
Anmelden und weiter Inhalte entdecken
Krypto-Nutzer weltweit auf Binance Square kennenlernen
⚡️ Bleib in Sachen Krypto stets am Puls.
💬 Die weltgrößte Kryptobörse vertraut darauf.
👍 Erhalte verlässliche Einblicke von verifizierten Creators.
E-Mail-Adresse/Telefonnummer