

Fitsum alemayehu
624 Beiträge

Fitsum alemayehu
x account @Fitsum_17 | Finding opportunities before they become obvious | Crypto | Market behavior | ETH
Gelegenheitstrader
3.6 Jahre
10 Following
85 Follower
797 Like gegeben
Beiträge
Alle
Zitierungen
Fitsum alemayehu
·
--
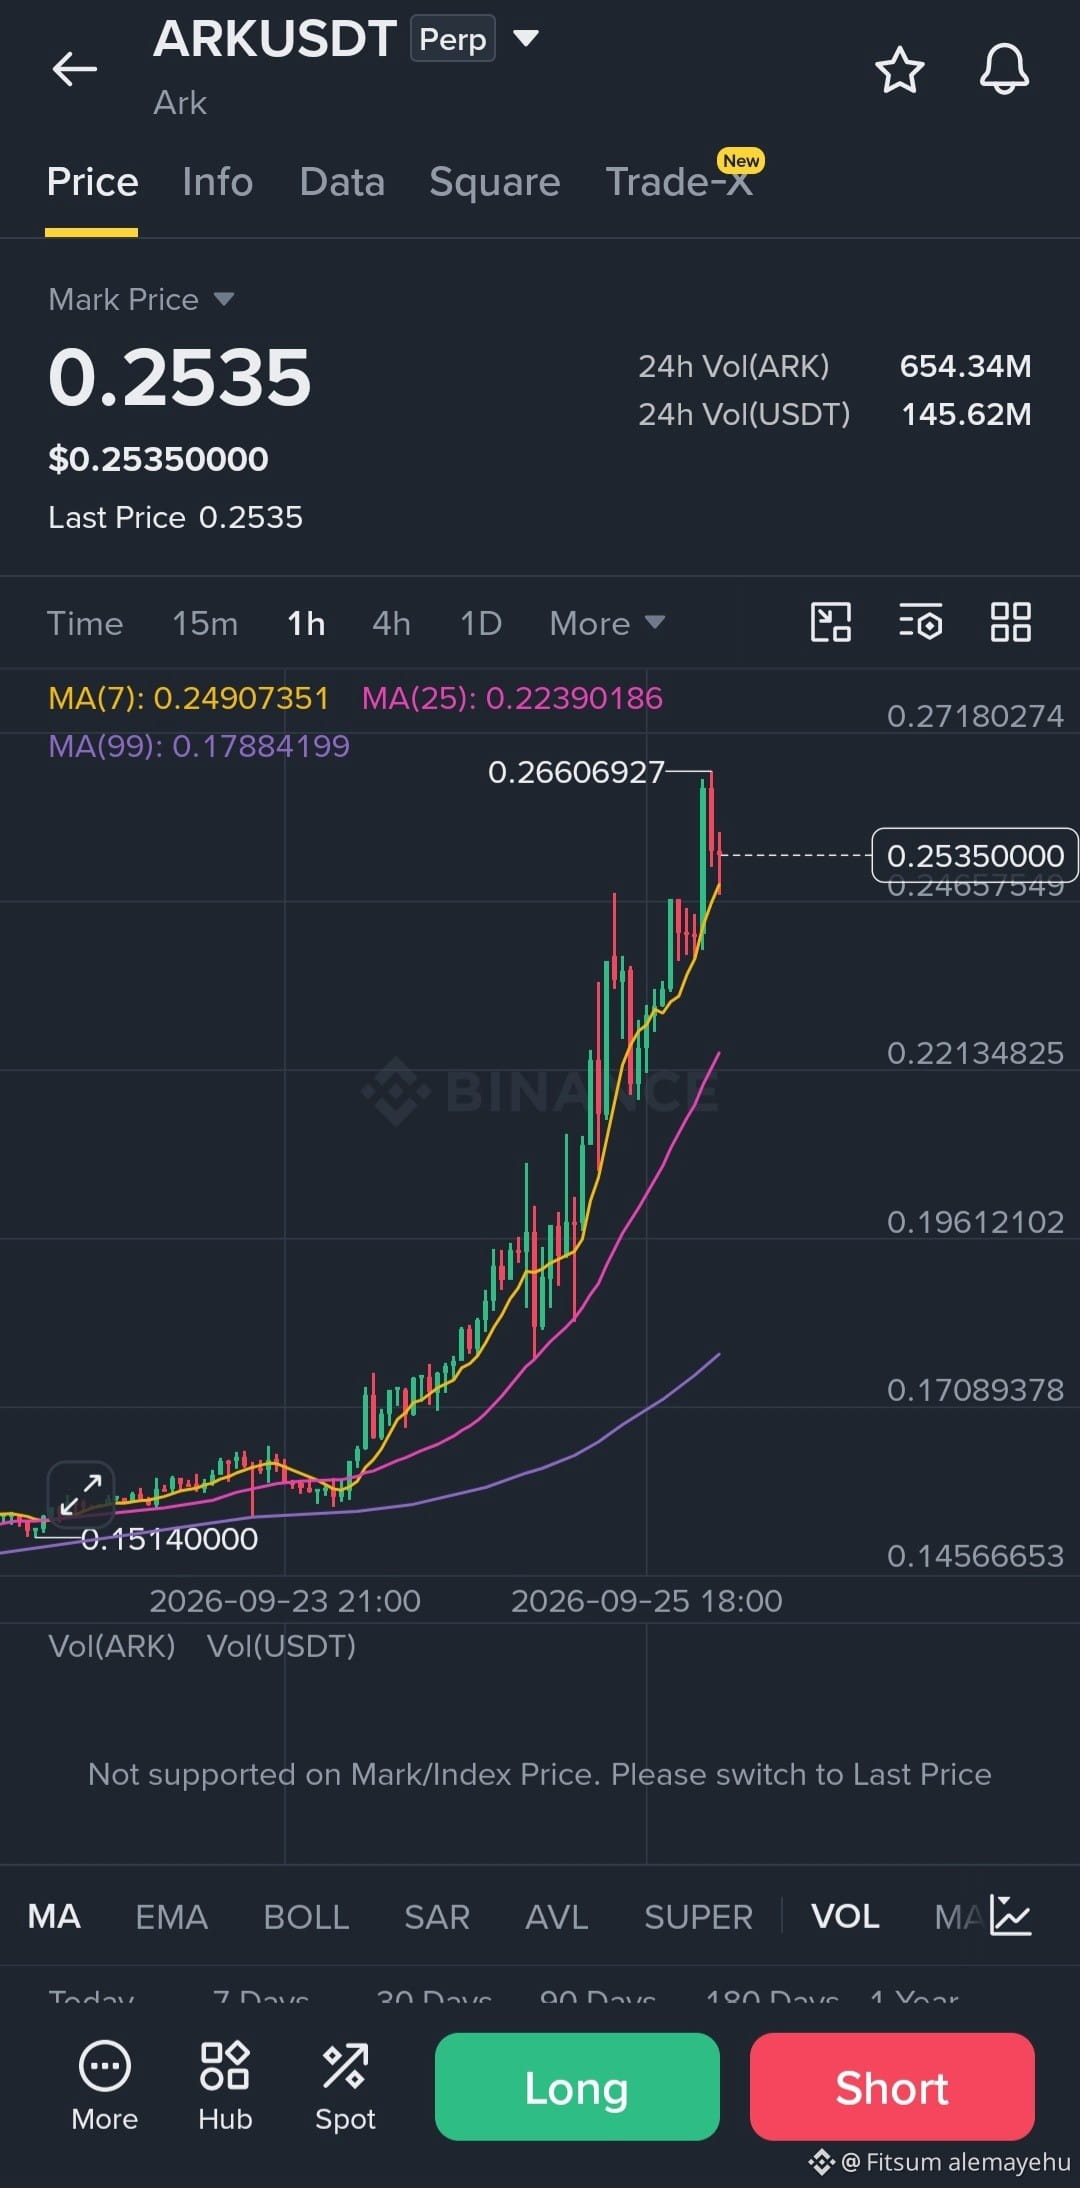
Bullisch🔥 ARK/USDT ARK drängt in einen neuen höheren Bereich
📈 SIGNAL
Bias: 🟢 Bullisch
Einstieg: $0.246 – $0.251
TP1: $0.266
TP2: $0.272
TP3: $0.285
SL: $0.238
ARK handelt derzeit um $0.2535, nachdem es zu einem starken 1H-Rallye aus dem Bereich um $0.15 gekommen ist. Der Preis hat kürzlich $0.2661 erreicht, bevor es zu einem Rücksetzer kam.
Der Trend bleibt stark bullisch: MA(7) $0.2491, MA(25) $0.2239 und MA(99) $0.1788 liegen alle unter dem aktuellen Kurs.
🔎 TECHNISCHE BEGRÜNDUNG
ARK zeichnet eine starke Abfolge aus höheren Hochs und höheren Tiefs, wobei der Preis gut oberhalb aller drei wichtigen 1H-gleitenden Durchschnitte bleibt.
Der unmittelbare Widerstand liegt bei $0.2661. Ein sauberer Ausbruch und ein Retest über dieses Hoch würden die Fortsetzungs-Setups Richtung $0.272–$0.285 stärken.
Wenn der Preis zuerst zurücksetzt, ist der Bereich $0.246–$0.251 rund um MA7 die Zone, auf die Käufer achten sollten.
Ein Verlust von $0.238 würde die bullische Struktur schwächen und auf eine tiefere Korrektur hindeuten.
⚠️ Verfolge den vertikalen Move nicht. Risikomanagement ist entscheidend.
#ARK #ARKUSDT #Trading #CryptoTrading $ARK
📈 SIGNAL
Bias: 🟢 Bullisch
Einstieg: $0.246 – $0.251
TP1: $0.266
TP2: $0.272
TP3: $0.285
SL: $0.238
ARK handelt derzeit um $0.2535, nachdem es zu einem starken 1H-Rallye aus dem Bereich um $0.15 gekommen ist. Der Preis hat kürzlich $0.2661 erreicht, bevor es zu einem Rücksetzer kam.
Der Trend bleibt stark bullisch: MA(7) $0.2491, MA(25) $0.2239 und MA(99) $0.1788 liegen alle unter dem aktuellen Kurs.
🔎 TECHNISCHE BEGRÜNDUNG
ARK zeichnet eine starke Abfolge aus höheren Hochs und höheren Tiefs, wobei der Preis gut oberhalb aller drei wichtigen 1H-gleitenden Durchschnitte bleibt.
Der unmittelbare Widerstand liegt bei $0.2661. Ein sauberer Ausbruch und ein Retest über dieses Hoch würden die Fortsetzungs-Setups Richtung $0.272–$0.285 stärken.
Wenn der Preis zuerst zurücksetzt, ist der Bereich $0.246–$0.251 rund um MA7 die Zone, auf die Käufer achten sollten.
Ein Verlust von $0.238 würde die bullische Struktur schwächen und auf eine tiefere Korrektur hindeuten.
⚠️ Verfolge den vertikalen Move nicht. Risikomanagement ist entscheidend.
#ARK #ARKUSDT #Trading #CryptoTrading $ARK
Fitsum alemayehu
·
--
Bullisch🔥 HYPE/USDT-KÄUFER SIND IM KAMPF IMMER NOCH DABEI
📈 SIGNAL
Bias: 🟢 Bullisch
Einstieg: $93.20 – $93.70
TP1: $94.88
TP2: $96.00
TP3: $98.00
SL: $90.80
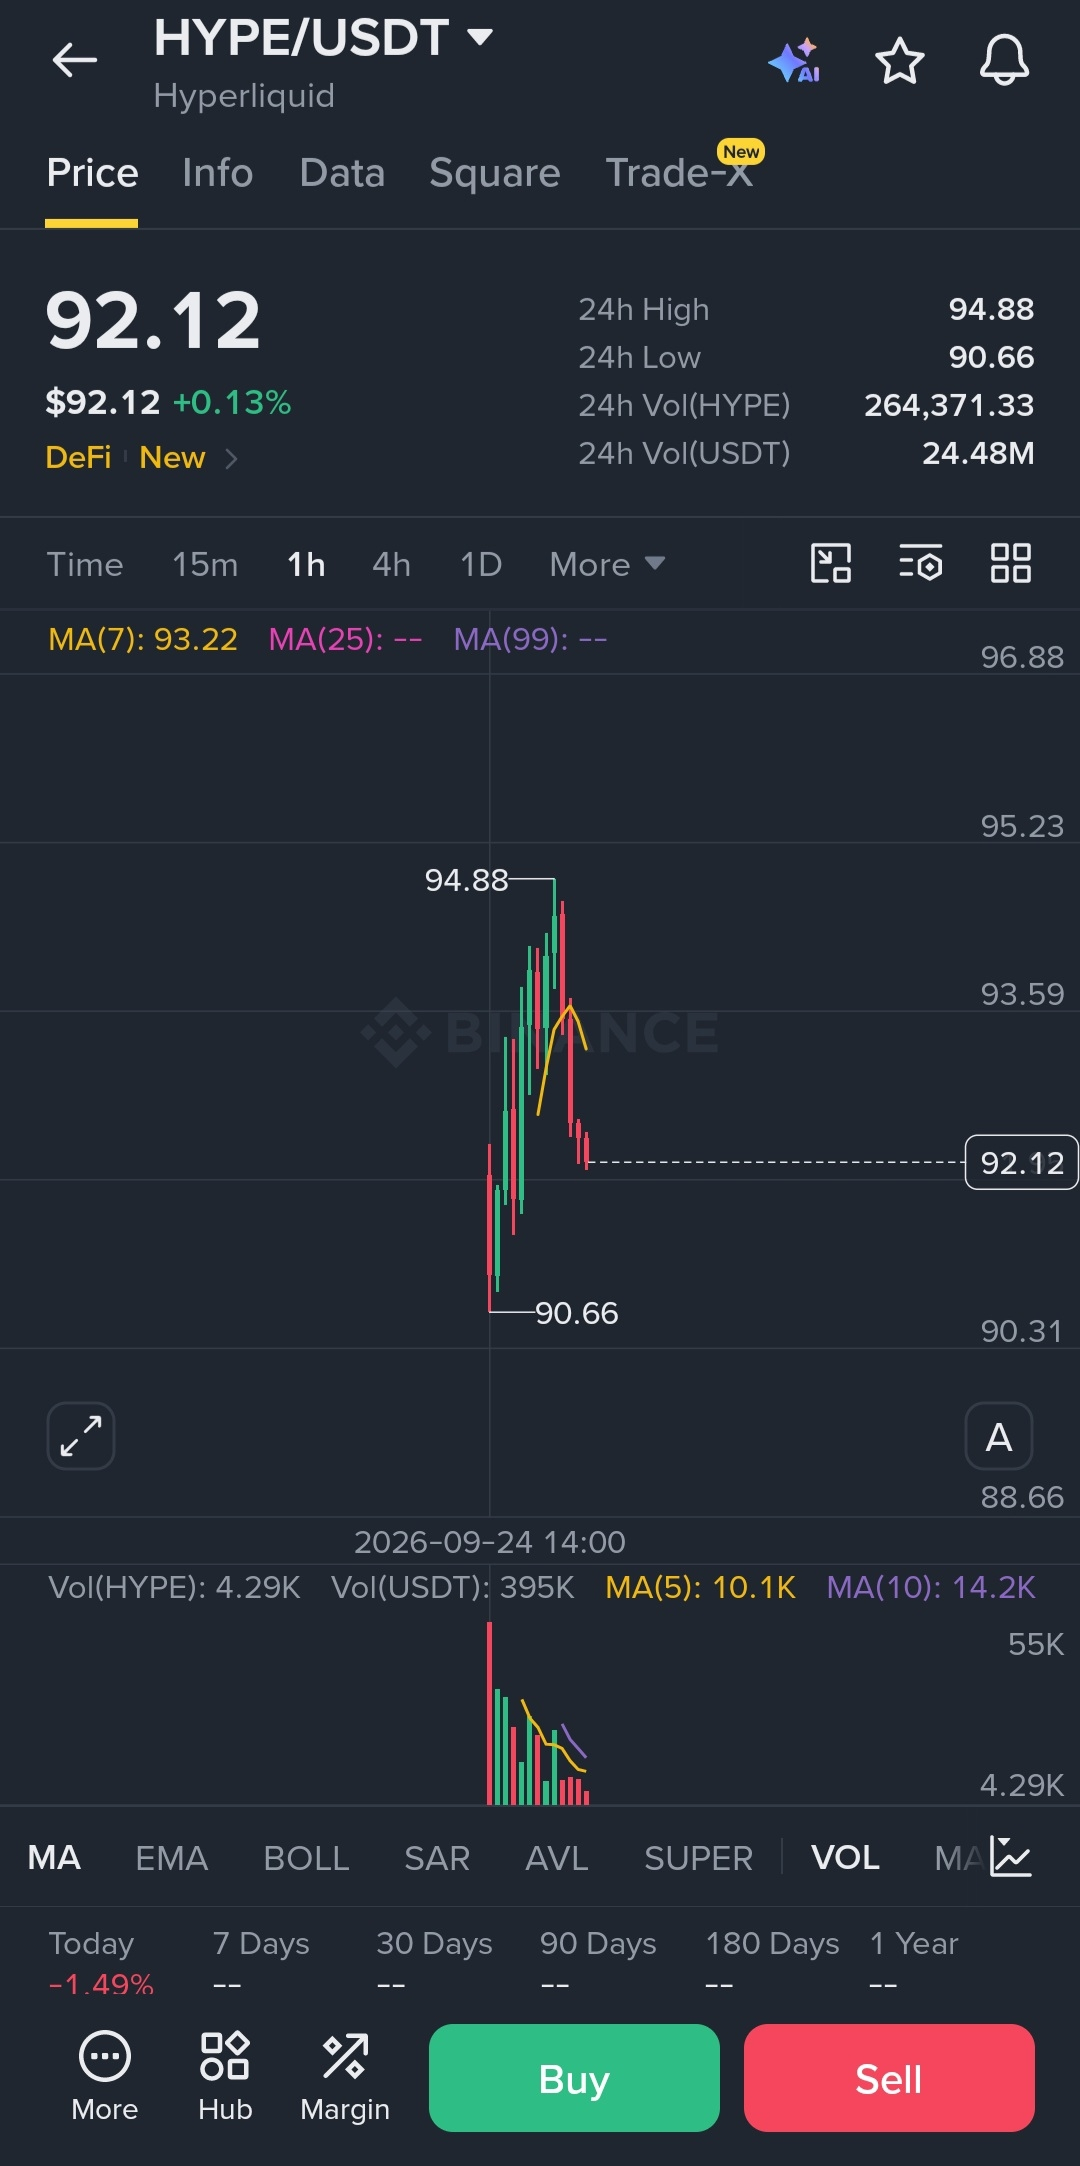
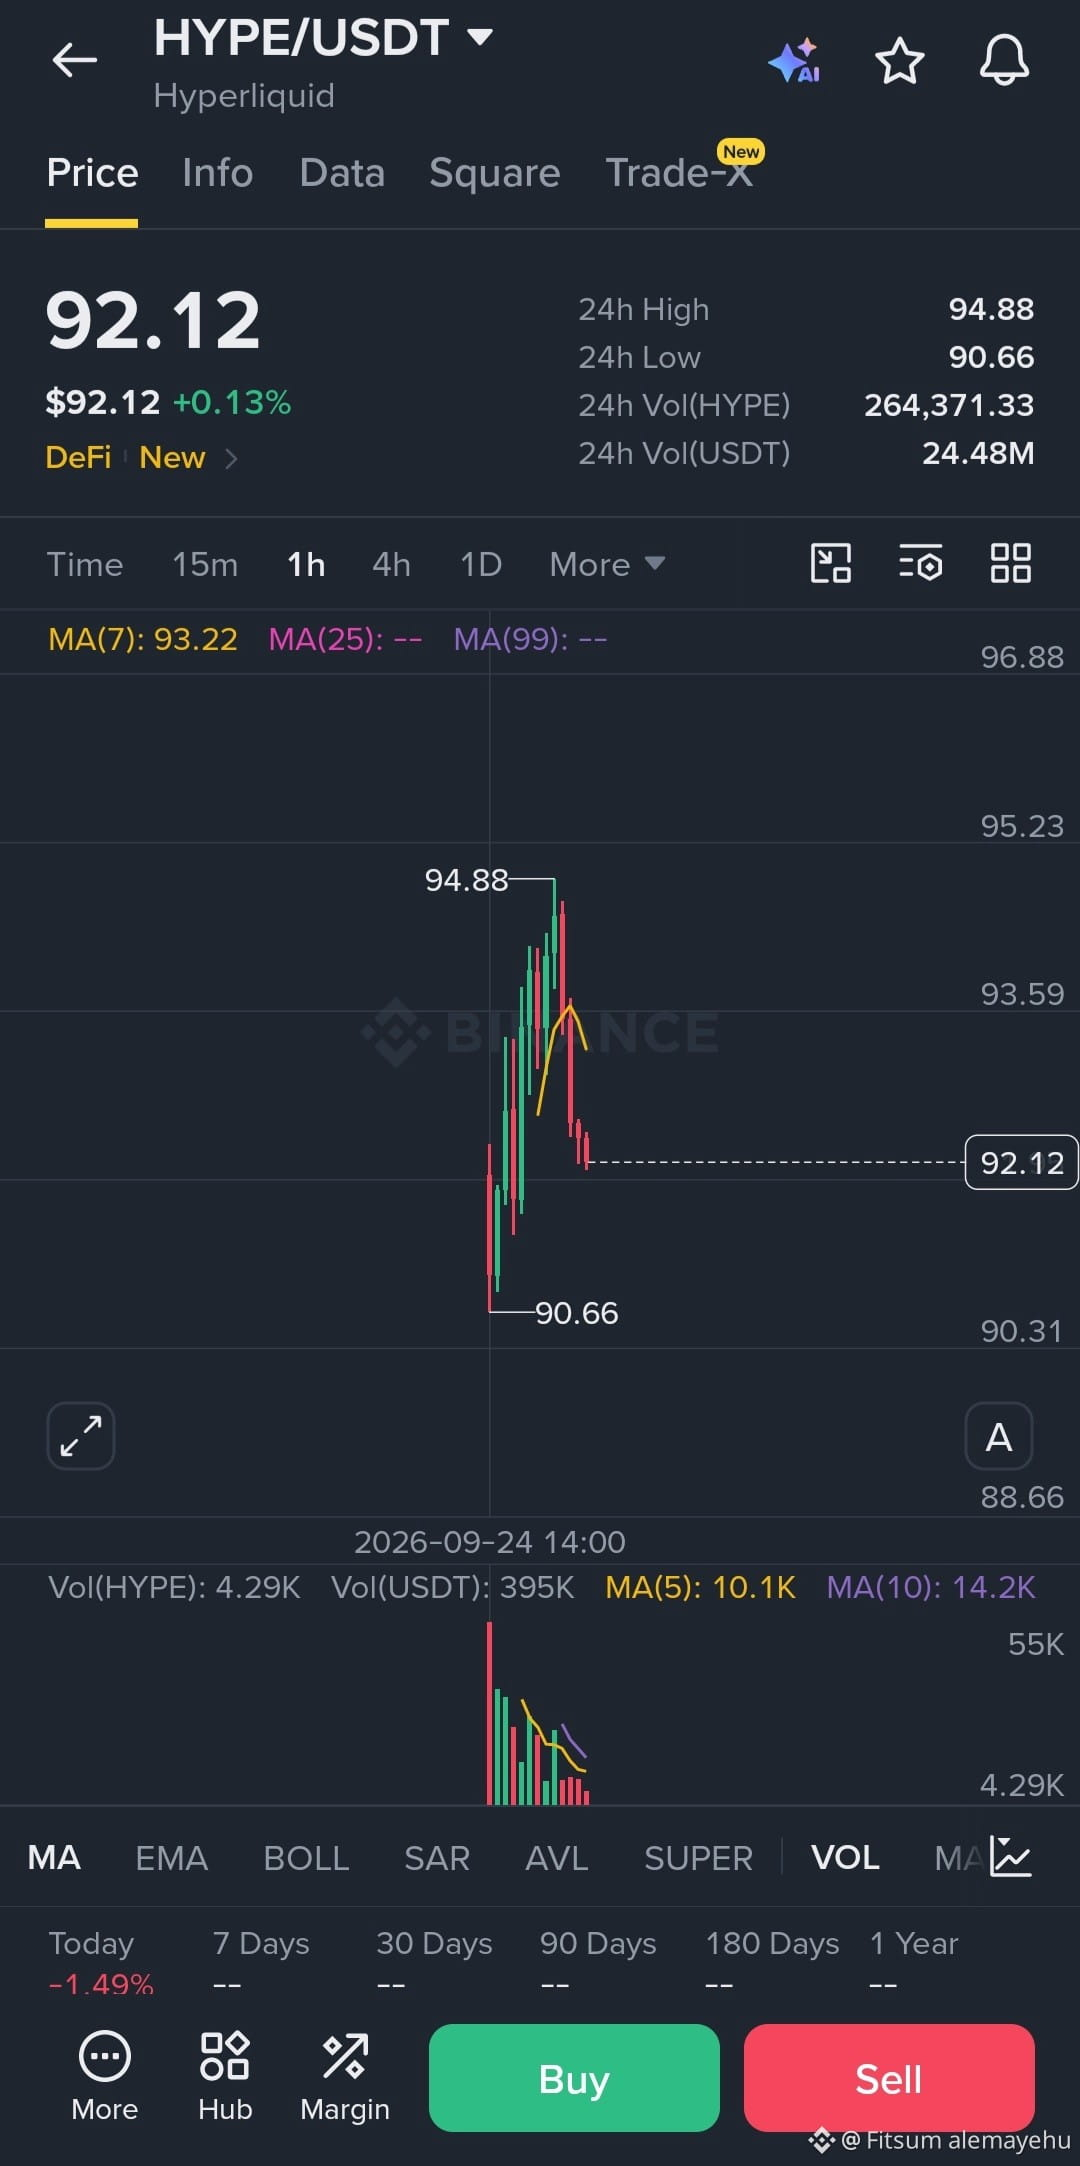
HYPE wird derzeit um $92.12 gehandelt, nachdem es gestern den Binance-Spot-Markt gelauncht hat und bis auf $94.88 gestiegen ist.
Nach dem ersten Listing-Spike zog sich der Kurs zurück Richtung $90.66 und prallte wieder ab. Auf dem 1H-Chart liegt HYPE nun um den MA(7) bei $93.22, daher müssen die Bullen diesen Bereich zurückerobern, bevor der nächste Push kommt.
🔎 TECHNISCHE BEGRÜNDUNG
Das Listing hat eine starke anfängliche Handelsspanne zwischen $90.66 und $94.88 geschaffen. Nach der Ablehnung vom Hoch zieht HYPE sich zurück, statt komplett einzubrechen.
Der entscheidende Auslöser ist eine 1H-Rückeroberung und ein Halten über $93.20–$93.70. Wenn Käufer $94.88 durchbrechen und es erfolgreich als Unterstützung retesten, könnte die neue Preisfindungsphase sich Richtung $96 und potenziell $98 ausdehnen.
Wenn HYPE $91.80 verliert, wird das bullische Setup ungültig, und das Tief des Listing-Tages um $90.66 könnte wieder in den Fokus rücken.
⚠️ HYPE ist nach dem Binance-Listing immer noch äußerst frisch, daher kann die Volatilität aggressiv sein. Jage nicht den ersten Ausbruch hinterher: Warte auf Bestätigung und steuere dein Risiko.
#HYPE #Hyperliquid #HYPEUSDT #Trading #CryptoTrading $HYPE
📈 SIGNAL
Bias: 🟢 Bullisch
Einstieg: $93.20 – $93.70
TP1: $94.88
TP2: $96.00
TP3: $98.00
SL: $90.80
HYPE wird derzeit um $92.12 gehandelt, nachdem es gestern den Binance-Spot-Markt gelauncht hat und bis auf $94.88 gestiegen ist.
Nach dem ersten Listing-Spike zog sich der Kurs zurück Richtung $90.66 und prallte wieder ab. Auf dem 1H-Chart liegt HYPE nun um den MA(7) bei $93.22, daher müssen die Bullen diesen Bereich zurückerobern, bevor der nächste Push kommt.
🔎 TECHNISCHE BEGRÜNDUNG
Das Listing hat eine starke anfängliche Handelsspanne zwischen $90.66 und $94.88 geschaffen. Nach der Ablehnung vom Hoch zieht HYPE sich zurück, statt komplett einzubrechen.
Der entscheidende Auslöser ist eine 1H-Rückeroberung und ein Halten über $93.20–$93.70. Wenn Käufer $94.88 durchbrechen und es erfolgreich als Unterstützung retesten, könnte die neue Preisfindungsphase sich Richtung $96 und potenziell $98 ausdehnen.
Wenn HYPE $91.80 verliert, wird das bullische Setup ungültig, und das Tief des Listing-Tages um $90.66 könnte wieder in den Fokus rücken.
⚠️ HYPE ist nach dem Binance-Listing immer noch äußerst frisch, daher kann die Volatilität aggressiv sein. Jage nicht den ersten Ausbruch hinterher: Warte auf Bestätigung und steuere dein Risiko.
#HYPE #Hyperliquid #HYPEUSDT #Trading #CryptoTrading $HYPE
Fitsum alemayehu
·
--
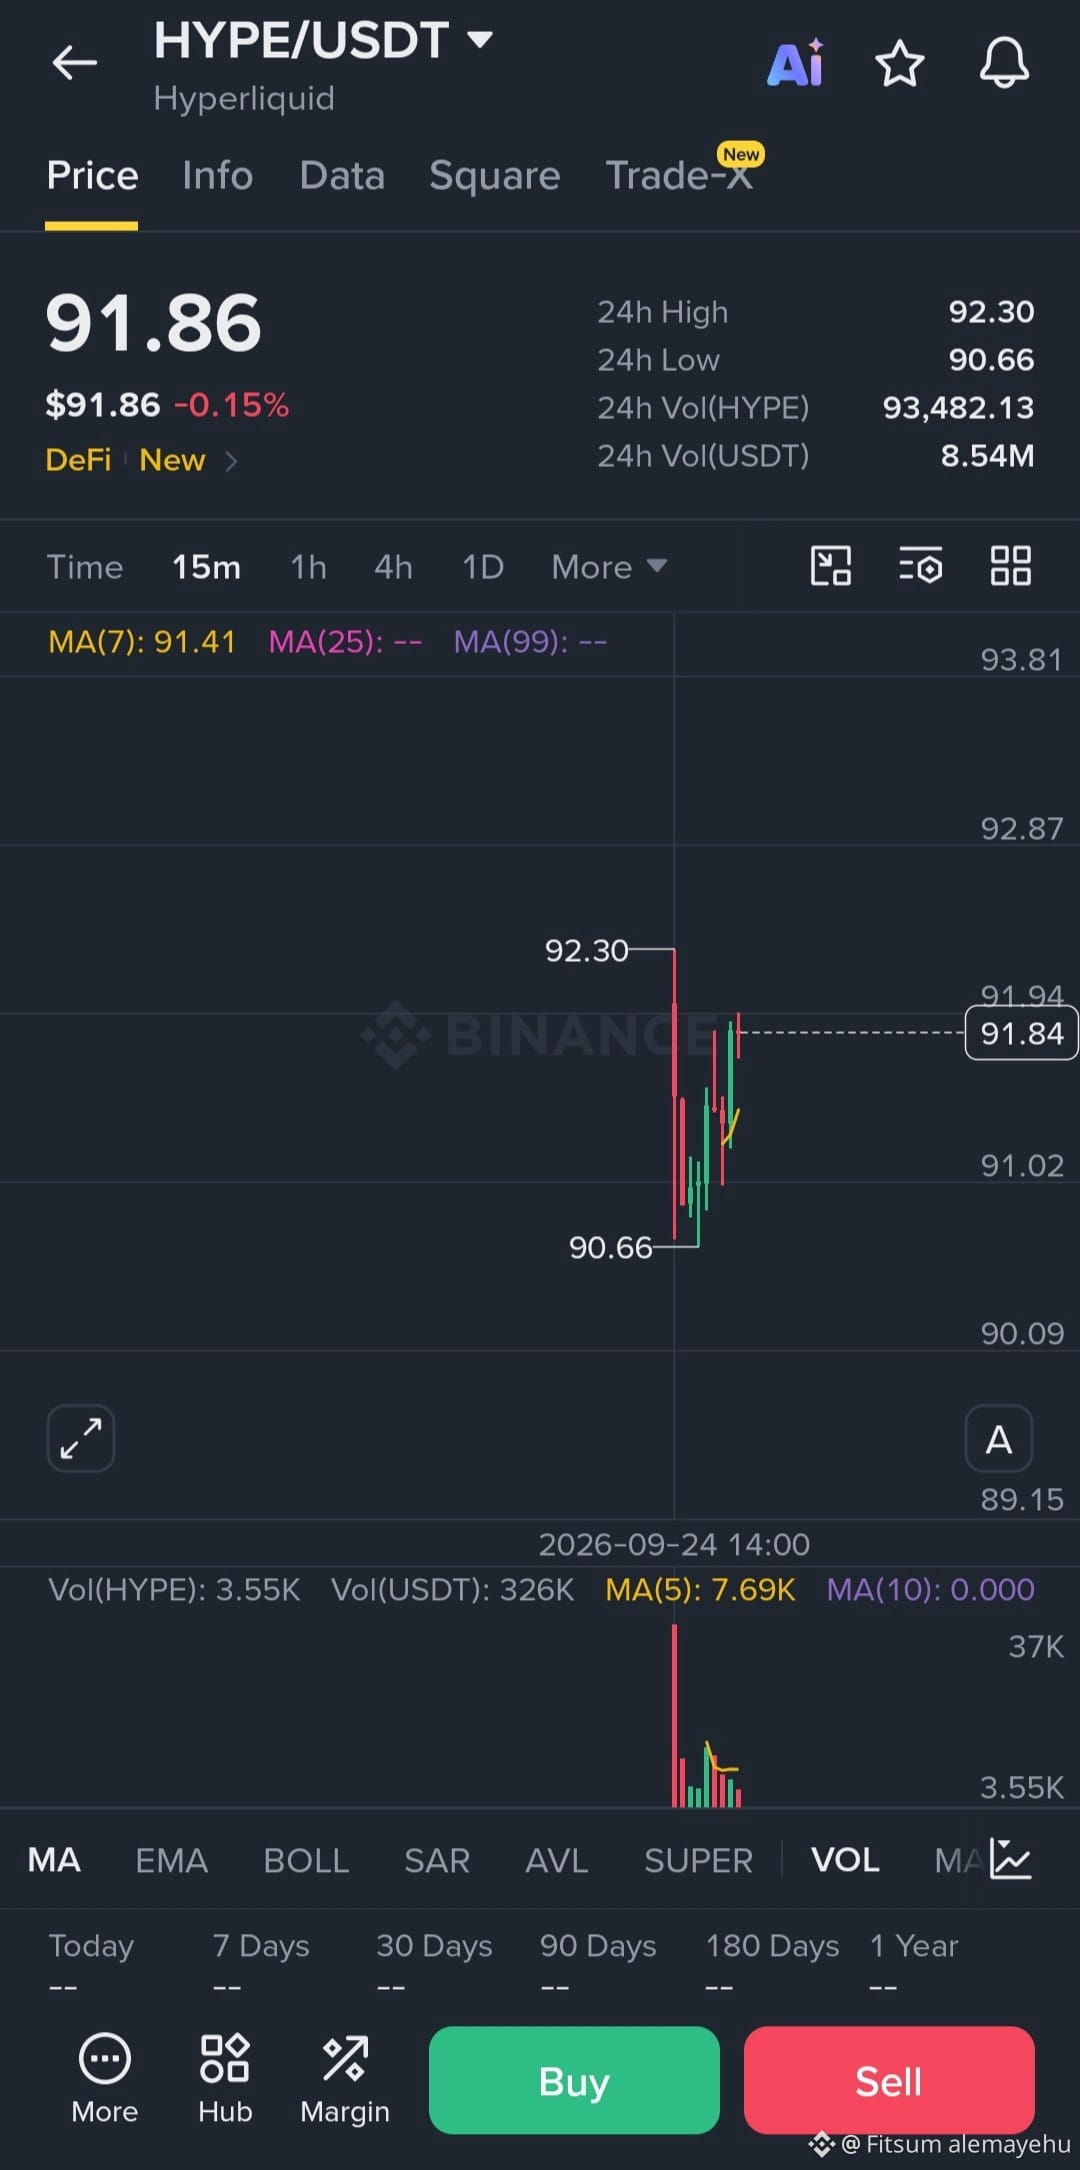
Bullisch🔥 HYPE/USDT HYPE FÄHRT DIE RÜCKSCHLÄGE ZURÜCK NACH DEM $90.66 DROP
📈 SIGNAL
Bias: 🟢 Bullisch
Entry: $91.40 – $91.70
TP1: $92.30
TP2: $92.90
TP3: $93.80
SL: $90.60
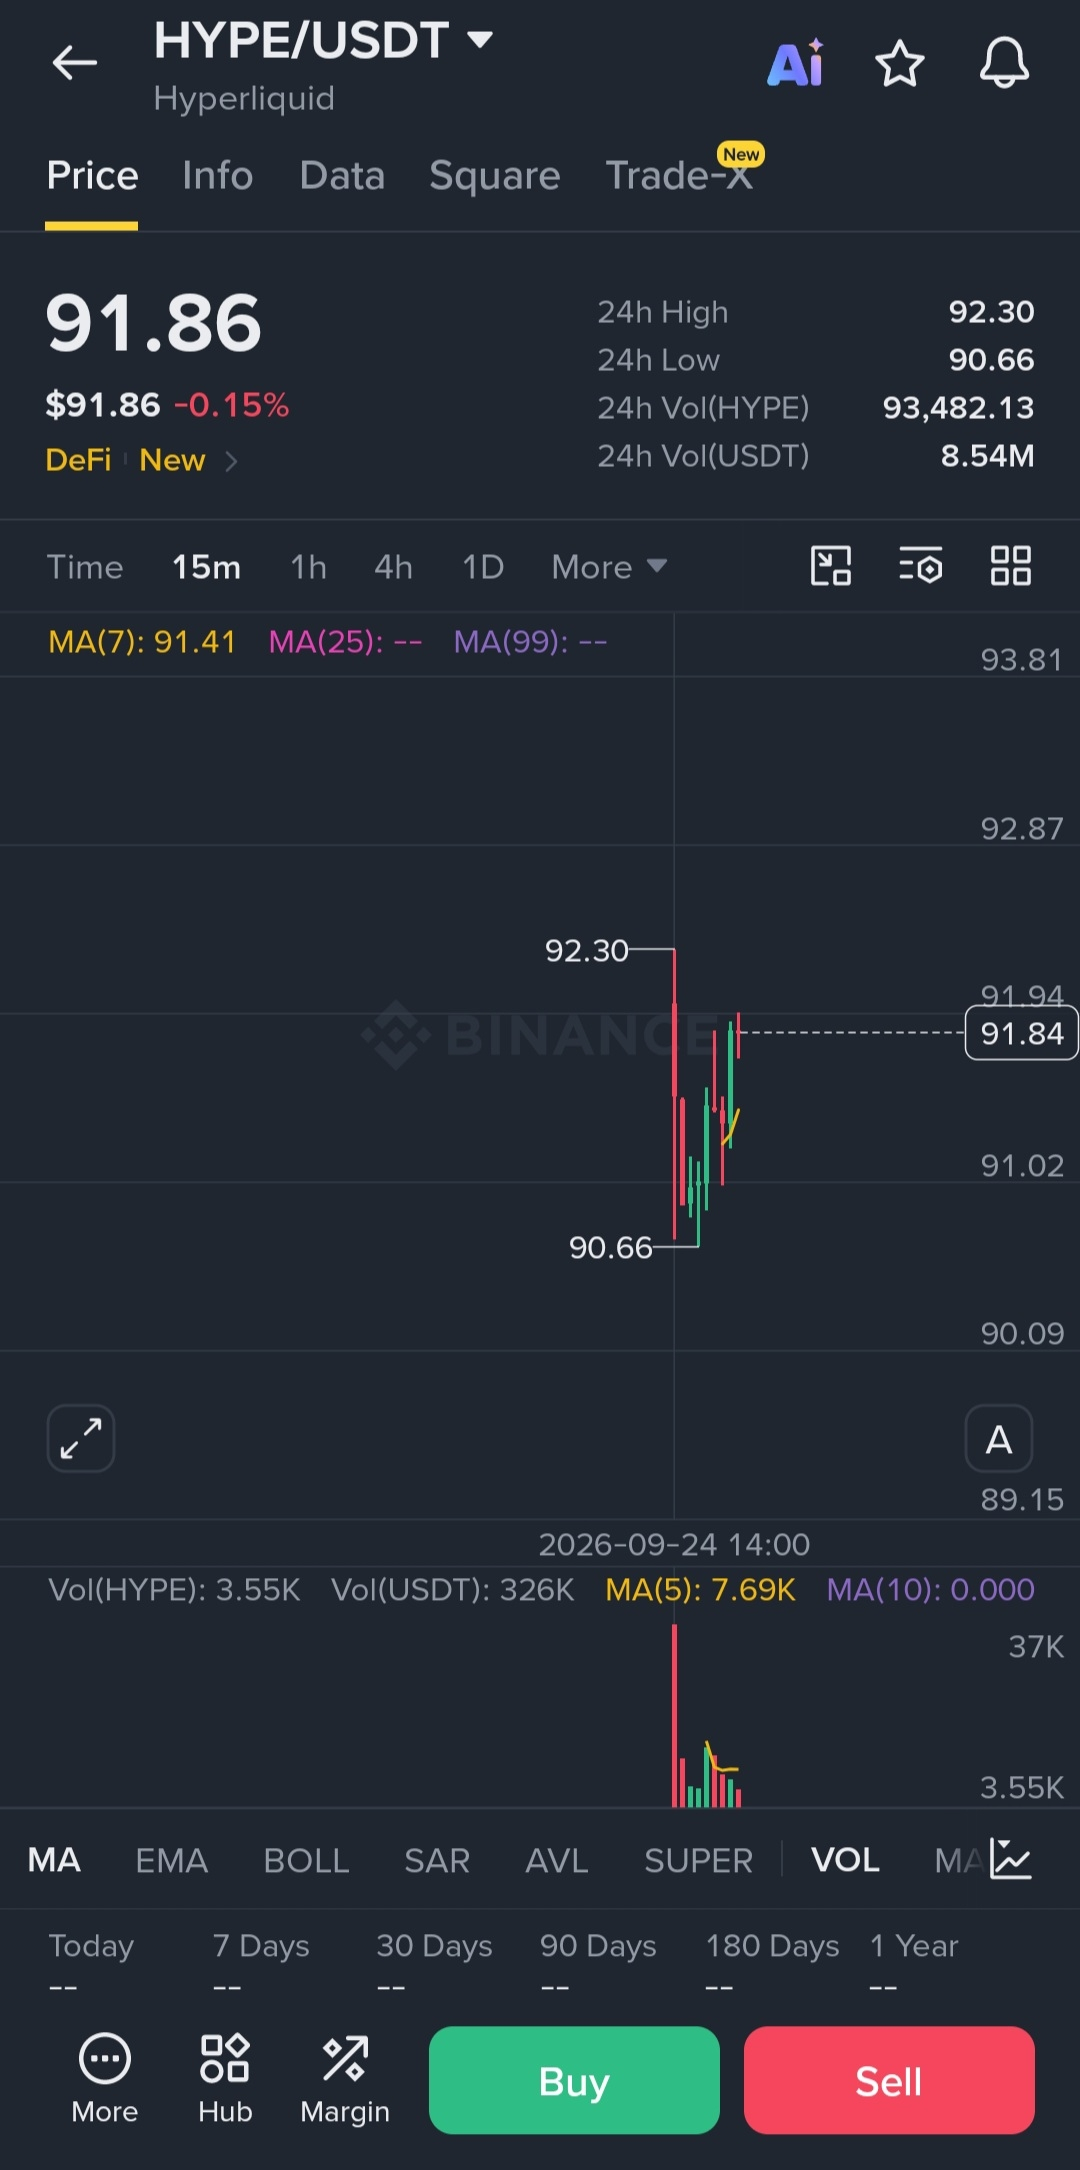
HYPE handelt derzeit um $91.86, nachdem es nach der scharfen Abweisung vom Hoch bei $92.30 und dem schnellen Rücksetzer auf $90.66 zu einem kurzen Comeback kam.
Auf dem 15M-Chart hat sich der Kurs wieder über das MA(7) bei $91.41 zurückgeholt, was zeigt, dass Käufer versuchen, die kurzfristige Kontrolle zurückzugewinnen. Aber das Hoch bei $92.30 bleibt weiterhin der entscheidende Widerstand.
🔎 TECHNISCHE BEGRÜNDUNG
Der starke Selloff von $92.30 auf $90.66 wurde von einer schnellen Erholung gefolgt, und die Käufer halten nun über dem kurzfristigen MA.
Der wichtige Auslöser ist ein sauberes 15M-Close über $92.30. Wenn diese Marke bricht und bei einem Retest hält, könnte HYPE weiter in Richtung $92.90 und möglicherweise $93.80 drücken.
Wenn der Kurs $90.60 verliert, ist das bullische Setup ungültig und die jüngste Erholung könnte sich in einen weiteren Abwärtsimpuls verwandeln.
⚠️ Chase nicht den ersten Breakout. Warte auf Bestätigung und einen sauberen Retest – besonders bei der Volatilität in einem neu aktivierten Paar.
#HYPE #Hyperliquid #HYPEUSDT #Crypto #CryptoTrading $HYPE
📈 SIGNAL
Bias: 🟢 Bullisch
Entry: $91.40 – $91.70
TP1: $92.30
TP2: $92.90
TP3: $93.80
SL: $90.60
HYPE handelt derzeit um $91.86, nachdem es nach der scharfen Abweisung vom Hoch bei $92.30 und dem schnellen Rücksetzer auf $90.66 zu einem kurzen Comeback kam.
Auf dem 15M-Chart hat sich der Kurs wieder über das MA(7) bei $91.41 zurückgeholt, was zeigt, dass Käufer versuchen, die kurzfristige Kontrolle zurückzugewinnen. Aber das Hoch bei $92.30 bleibt weiterhin der entscheidende Widerstand.
🔎 TECHNISCHE BEGRÜNDUNG
Der starke Selloff von $92.30 auf $90.66 wurde von einer schnellen Erholung gefolgt, und die Käufer halten nun über dem kurzfristigen MA.
Der wichtige Auslöser ist ein sauberes 15M-Close über $92.30. Wenn diese Marke bricht und bei einem Retest hält, könnte HYPE weiter in Richtung $92.90 und möglicherweise $93.80 drücken.
Wenn der Kurs $90.60 verliert, ist das bullische Setup ungültig und die jüngste Erholung könnte sich in einen weiteren Abwärtsimpuls verwandeln.
⚠️ Chase nicht den ersten Breakout. Warte auf Bestätigung und einen sauberen Retest – besonders bei der Volatilität in einem neu aktivierten Paar.
#HYPE #Hyperliquid #HYPEUSDT #Crypto #CryptoTrading $HYPE
Fitsum alemayehu
·
--
Bullisch🔥 BCH/USDT BITCOIN CASH TESTET $350
📈 SIGNAL
Bias: 🟢 Bullisch
Einstieg: $334 – $338
TP1: $350
TP2: $365
TP3: $380
SL: $326
Bitcoin Cash handelt derzeit um $341.72, nachdem es einen starken Ausbruch aus dem $260-Bereich gegeben hat. BCH stieß auf ein jüngstes Hoch von $349.92 vor und konsolidiert nun direkt unter diesem Widerstand.
Im 1H-Chart befindet sich der Kurs um die MA(7) herum bei $341.74, während die MA(25) bei $310.26 und die MA(99) bei $268.61 liegt. Die gleitenden Durchschnitte sind klar bullisch, aber der starke Rallye-Impuls bedeutet: Den aktuellen Preis hinterherzulaufen, birgt ein höheres Risiko.
🔎 TECHNISCHE BEGRÜNDUNG
BCH ist stark nach oben gedreht und hält sich gut oberhalb von MA25 und MA99. Die entscheidende Schlacht findet jetzt in der Widerstandszone $349–$350 statt.
Ein sauberer Ausbruch und ein anschließender Retest über $350 würde das bullische Fortsetzungs-Setup stärken. Wenn BCH zuerst zurücksetzt und den Bereich $334–$338 hält, könnte das einen besseren, risikokontrollierten Einstieg bieten, statt direkt in den Pump hineinzukaufen.
Wenn der Kurs $326 verliert, schwächt sich das bullische Setup ab und ein tieferer Rücksetzer wird möglich.
⚠️ Verfolge den Ausbruch nicht. Warte auf Bestätigung, schütze dein Kapital und manage das Risiko richtig.
#BCH #BitcoinCash #BCHUSDT #CryptoTrading $BCH
📈 SIGNAL
Bias: 🟢 Bullisch
Einstieg: $334 – $338
TP1: $350
TP2: $365
TP3: $380
SL: $326
Bitcoin Cash handelt derzeit um $341.72, nachdem es einen starken Ausbruch aus dem $260-Bereich gegeben hat. BCH stieß auf ein jüngstes Hoch von $349.92 vor und konsolidiert nun direkt unter diesem Widerstand.
Im 1H-Chart befindet sich der Kurs um die MA(7) herum bei $341.74, während die MA(25) bei $310.26 und die MA(99) bei $268.61 liegt. Die gleitenden Durchschnitte sind klar bullisch, aber der starke Rallye-Impuls bedeutet: Den aktuellen Preis hinterherzulaufen, birgt ein höheres Risiko.
🔎 TECHNISCHE BEGRÜNDUNG
BCH ist stark nach oben gedreht und hält sich gut oberhalb von MA25 und MA99. Die entscheidende Schlacht findet jetzt in der Widerstandszone $349–$350 statt.
Ein sauberer Ausbruch und ein anschließender Retest über $350 würde das bullische Fortsetzungs-Setup stärken. Wenn BCH zuerst zurücksetzt und den Bereich $334–$338 hält, könnte das einen besseren, risikokontrollierten Einstieg bieten, statt direkt in den Pump hineinzukaufen.
Wenn der Kurs $326 verliert, schwächt sich das bullische Setup ab und ein tieferer Rücksetzer wird möglich.
⚠️ Verfolge den Ausbruch nicht. Warte auf Bestätigung, schütze dein Kapital und manage das Risiko richtig.
#BCH #BitcoinCash #BCHUSDT #CryptoTrading $BCH
Fitsum alemayehu
·
--
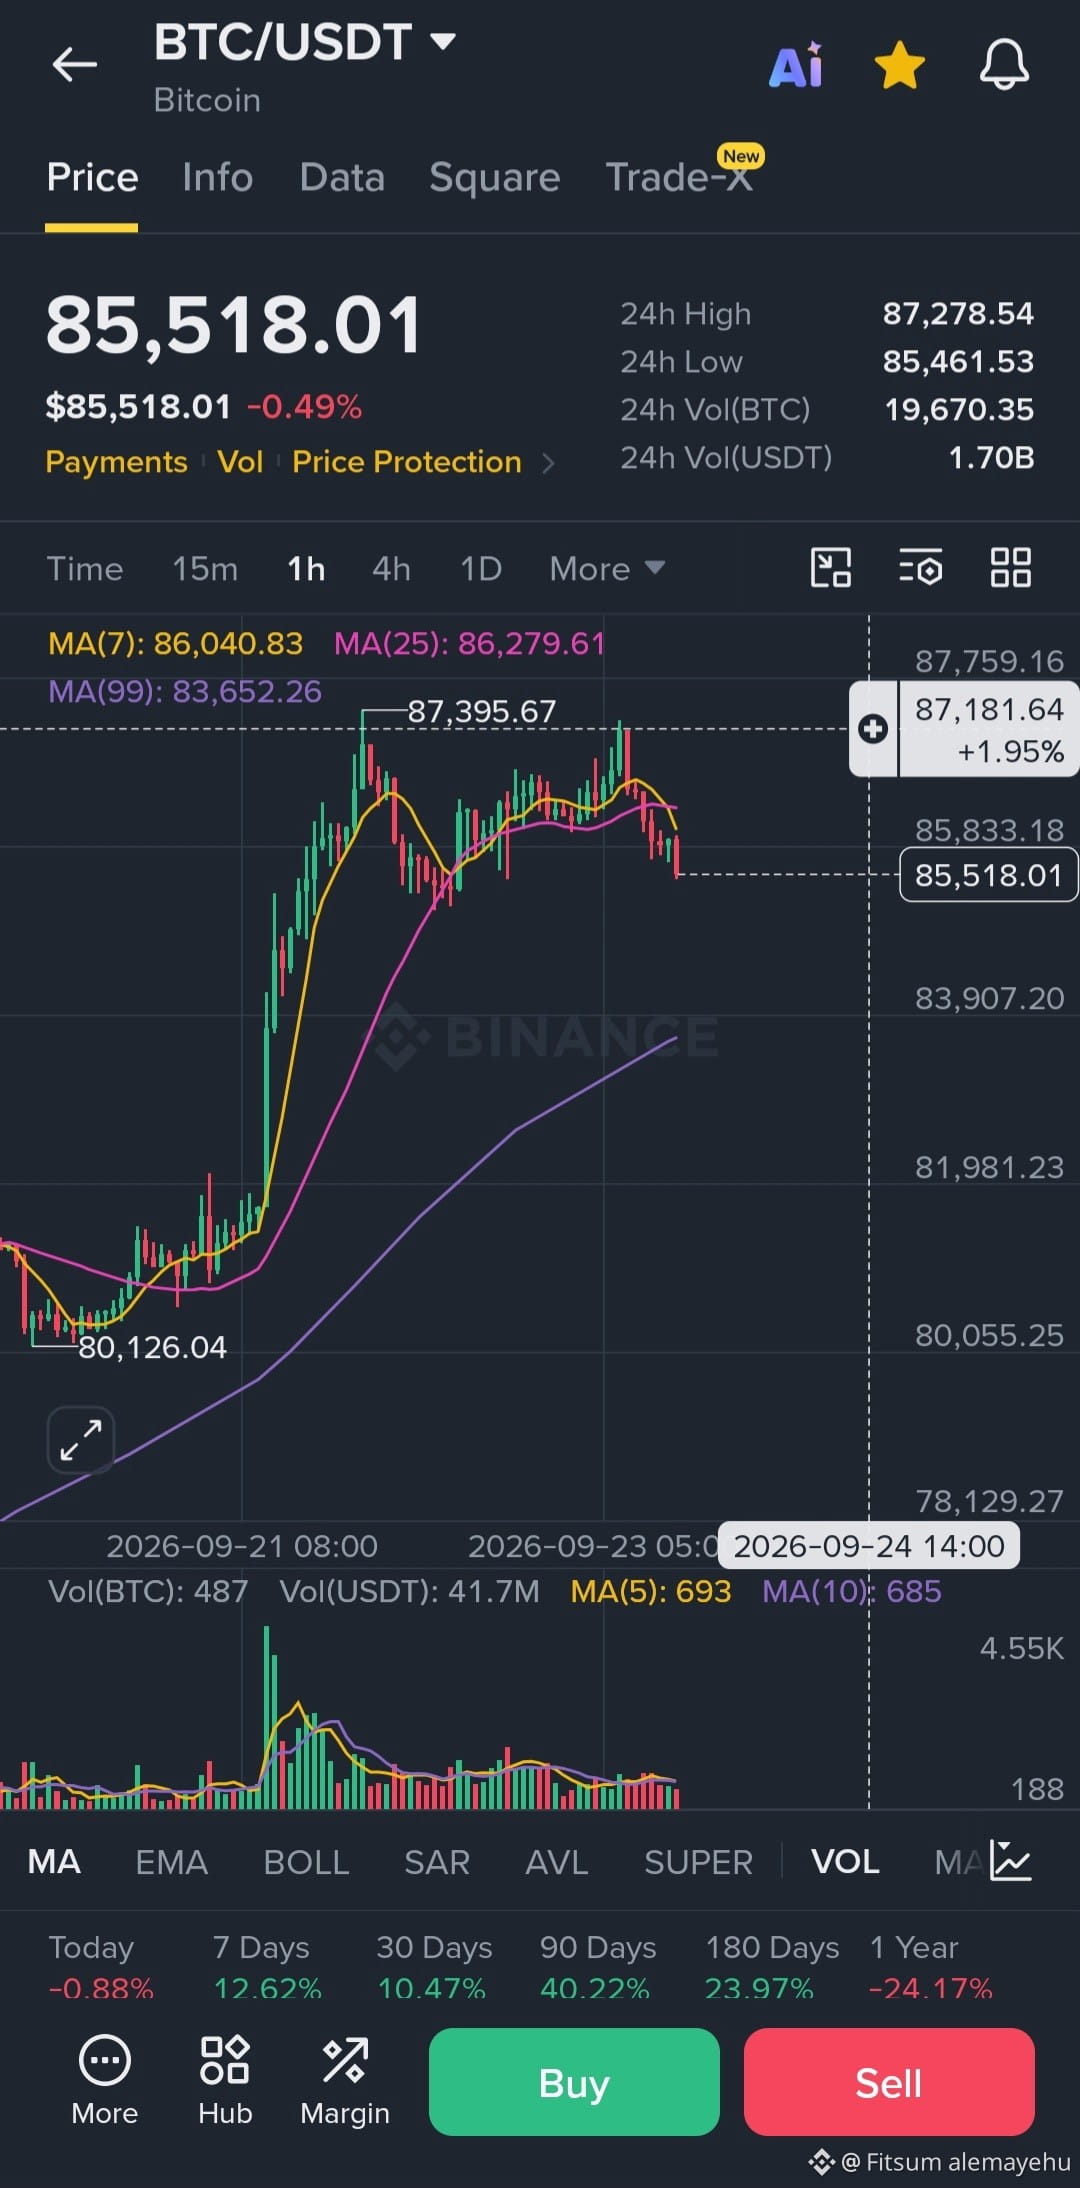
Bullisch🔥 BTC/USDT BULLS HALTEN DIE ERHOLUNG
📈 SIGNAL
Bias: 🟢 Bullisch
Einstieg: $85,500 – $85,900
TP1: $87,000
TP2: $87,400
TP3: $88,200
SL: $84,900
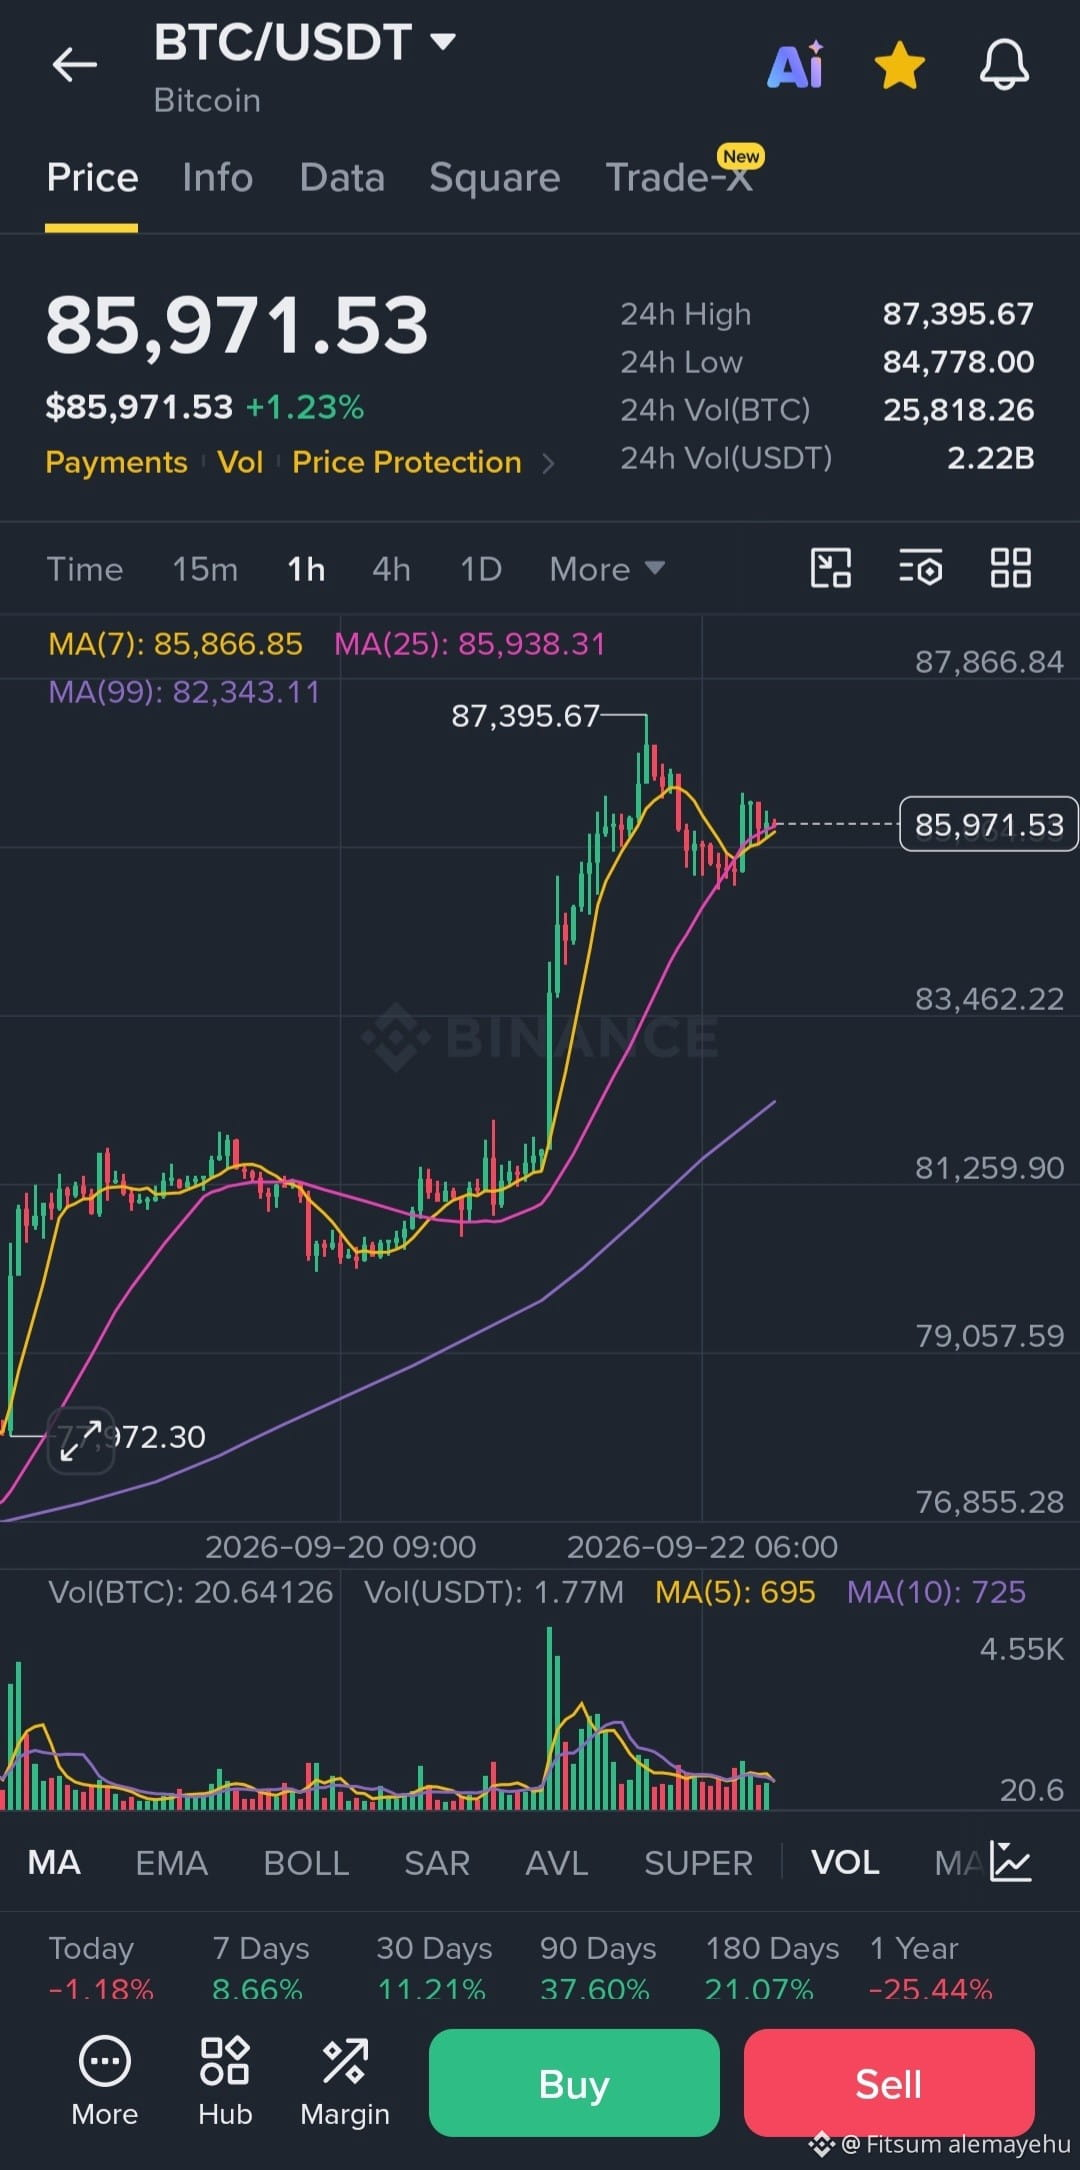
Bitcoin wird um $85,971 gehandelt, 1,23% im Plus auf dem 1H-Chart, nachdem es sich vom Tief bei $84,778 erholt hat.
BTC hält derzeit um den MA(7) bei $85,867 und den MA(25) bei $85,938, während der MA(99) deutlich tiefer bei $82,343 liegt. Die kurzfristige Struktur bleibt konstruktiv, aber BTC muss die jüngste Hochmarke bei $87,395 noch überwinden.
🔎 TECHNISCHE BEGRÜNDUNG
BTC hat eine starke Aufwärtsbewegung gemacht und konsolidiert nun nahe den kurzfristigen gleitenden Durchschnitten, statt den Anstieg sofort wieder abzugeben.
Ein sauberes Halten über $85,500–$85,900 würde die bullische Struktur intakt halten. Der entscheidende Test ist $87,395: Ein klarer Ausbruch und ein Halten über dieser Marke könnten den Weg in Richtung $88,200 öffnen.
Andererseits würde das Verfehlen von $84,900 das Setup schwächen und darauf hindeuten, dass die aktuelle Konsolidierung in eine tiefere Korrektur übergehen könnte.
⚠️ Verfolge den Ausbruch nicht. Schütze dein Kapital und manage das Risiko richtig.
#BTC #Bitcoin #BTCUSDT #Trading #CryptoTrading $BTC
📈 SIGNAL
Bias: 🟢 Bullisch
Einstieg: $85,500 – $85,900
TP1: $87,000
TP2: $87,400
TP3: $88,200
SL: $84,900
Bitcoin wird um $85,971 gehandelt, 1,23% im Plus auf dem 1H-Chart, nachdem es sich vom Tief bei $84,778 erholt hat.
BTC hält derzeit um den MA(7) bei $85,867 und den MA(25) bei $85,938, während der MA(99) deutlich tiefer bei $82,343 liegt. Die kurzfristige Struktur bleibt konstruktiv, aber BTC muss die jüngste Hochmarke bei $87,395 noch überwinden.
🔎 TECHNISCHE BEGRÜNDUNG
BTC hat eine starke Aufwärtsbewegung gemacht und konsolidiert nun nahe den kurzfristigen gleitenden Durchschnitten, statt den Anstieg sofort wieder abzugeben.
Ein sauberes Halten über $85,500–$85,900 würde die bullische Struktur intakt halten. Der entscheidende Test ist $87,395: Ein klarer Ausbruch und ein Halten über dieser Marke könnten den Weg in Richtung $88,200 öffnen.
Andererseits würde das Verfehlen von $84,900 das Setup schwächen und darauf hindeuten, dass die aktuelle Konsolidierung in eine tiefere Korrektur übergehen könnte.
⚠️ Verfolge den Ausbruch nicht. Schütze dein Kapital und manage das Risiko richtig.
#BTC #Bitcoin #BTCUSDT #Trading #CryptoTrading $BTC
Fitsum alemayehu
·
--
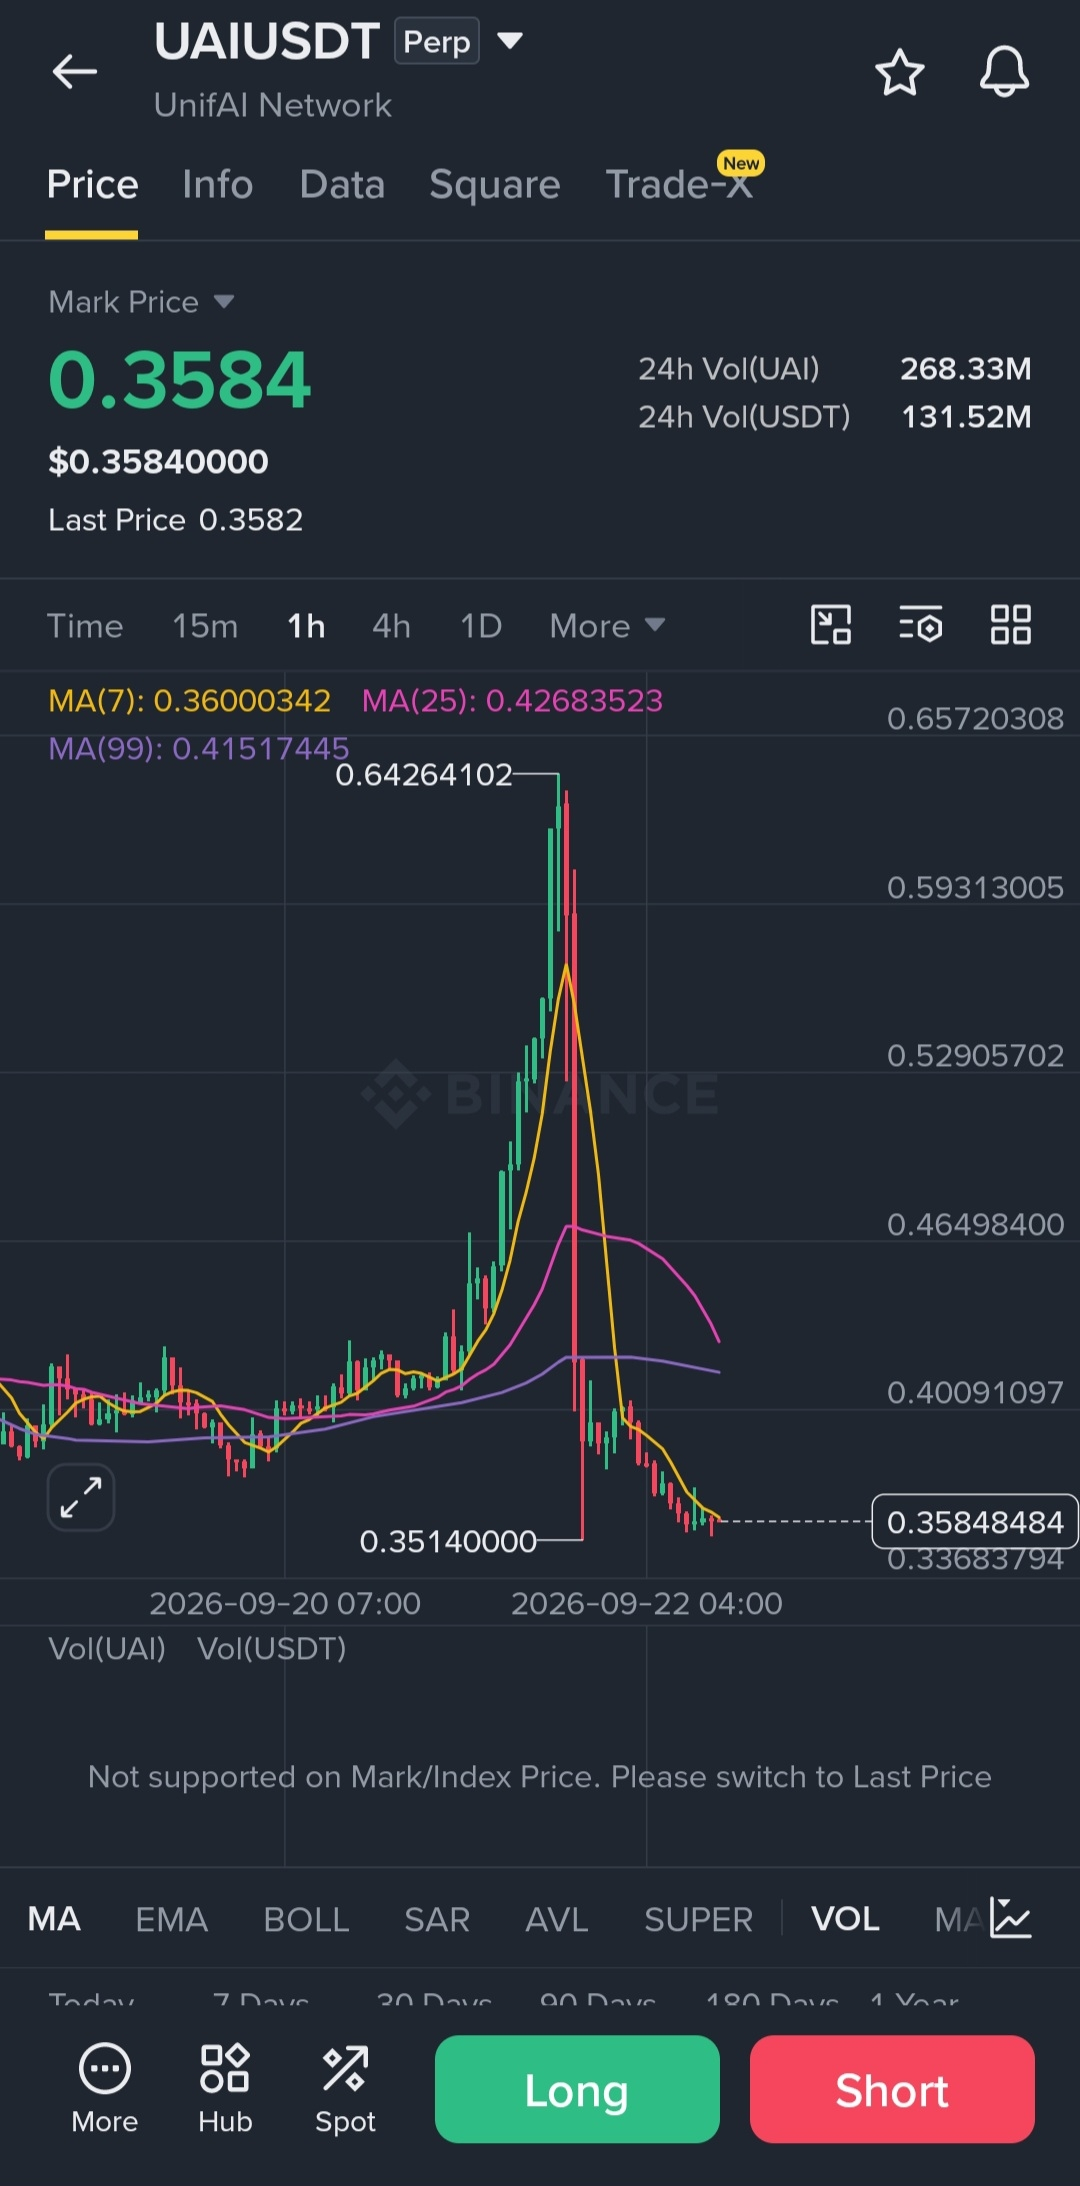
Bärisch🔻 UAI/USDT DER PUMP WURDE HART ABGEWIESEN
📉 SIGNAL
Bias: Bearish
Entry: $0.360 – $0.375
TP1: $0.3514
TP2: $0.3387
TP3: $0.3200
SL: $0.3900
UAI hat sich nach dem massiven Spike auf $0.6426 vollständig umgedreht. Der Preis liegt jetzt bei etwa $0.3584, und der Chart zeigt eine scharfe Zurückweisung, gefolgt von konstant niedrigeren Kursen.
Die 1H-Struktur ist inzwischen bärisch geworden:
MA(7): $0.3600
MA(25): $0.4268
MA(99): $0.4152
Der Preis liegt nun unter allen drei gleitenden Durchschnitten, während MA(25) und MA(99) weit über dem Preis bleiben. Das zeigt, dass die Verkäufer die Kontrolle über die kurzfristige Struktur übernommen haben.
🔎 TECHNISCHE BEGRÜNDUNG
Die Zurückweisung von $0.6426 war aggressiv, und UAI hat es nicht geschafft, die $0.40–$0.41-Region zurückzuerobern.
Eine Zurückweisung bei $0.360–$0.375, gefolgt von einem weiteren Bruch unter $0.3514, könnte den Weg zu den nächsten Abwärtsniveaus öffnen.
Damit das bärische Setup gültig bleibt, müssen Verkäufer den Preis unter der $0.39–$0.41-Zone halten. Eine starke Rückeroberung über diesem Bereich würde das Setup schwächen.
⚠️ Verfolge den Breakdown nicht. Bestätige die Bewegung und manage das Risiko sorgfältig.
#UAI #UAIUSDT #UnifAI #Futures #CryptoTrading $UAI
📉 SIGNAL
Bias: Bearish
Entry: $0.360 – $0.375
TP1: $0.3514
TP2: $0.3387
TP3: $0.3200
SL: $0.3900
UAI hat sich nach dem massiven Spike auf $0.6426 vollständig umgedreht. Der Preis liegt jetzt bei etwa $0.3584, und der Chart zeigt eine scharfe Zurückweisung, gefolgt von konstant niedrigeren Kursen.
Die 1H-Struktur ist inzwischen bärisch geworden:
MA(7): $0.3600
MA(25): $0.4268
MA(99): $0.4152
Der Preis liegt nun unter allen drei gleitenden Durchschnitten, während MA(25) und MA(99) weit über dem Preis bleiben. Das zeigt, dass die Verkäufer die Kontrolle über die kurzfristige Struktur übernommen haben.
🔎 TECHNISCHE BEGRÜNDUNG
Die Zurückweisung von $0.6426 war aggressiv, und UAI hat es nicht geschafft, die $0.40–$0.41-Region zurückzuerobern.
Eine Zurückweisung bei $0.360–$0.375, gefolgt von einem weiteren Bruch unter $0.3514, könnte den Weg zu den nächsten Abwärtsniveaus öffnen.
Damit das bärische Setup gültig bleibt, müssen Verkäufer den Preis unter der $0.39–$0.41-Zone halten. Eine starke Rückeroberung über diesem Bereich würde das Setup schwächen.
⚠️ Verfolge den Breakdown nicht. Bestätige die Bewegung und manage das Risiko sorgfältig.
#UAI #UAIUSDT #UnifAI #Futures #CryptoTrading $UAI
Fitsum alemayehu
·
--
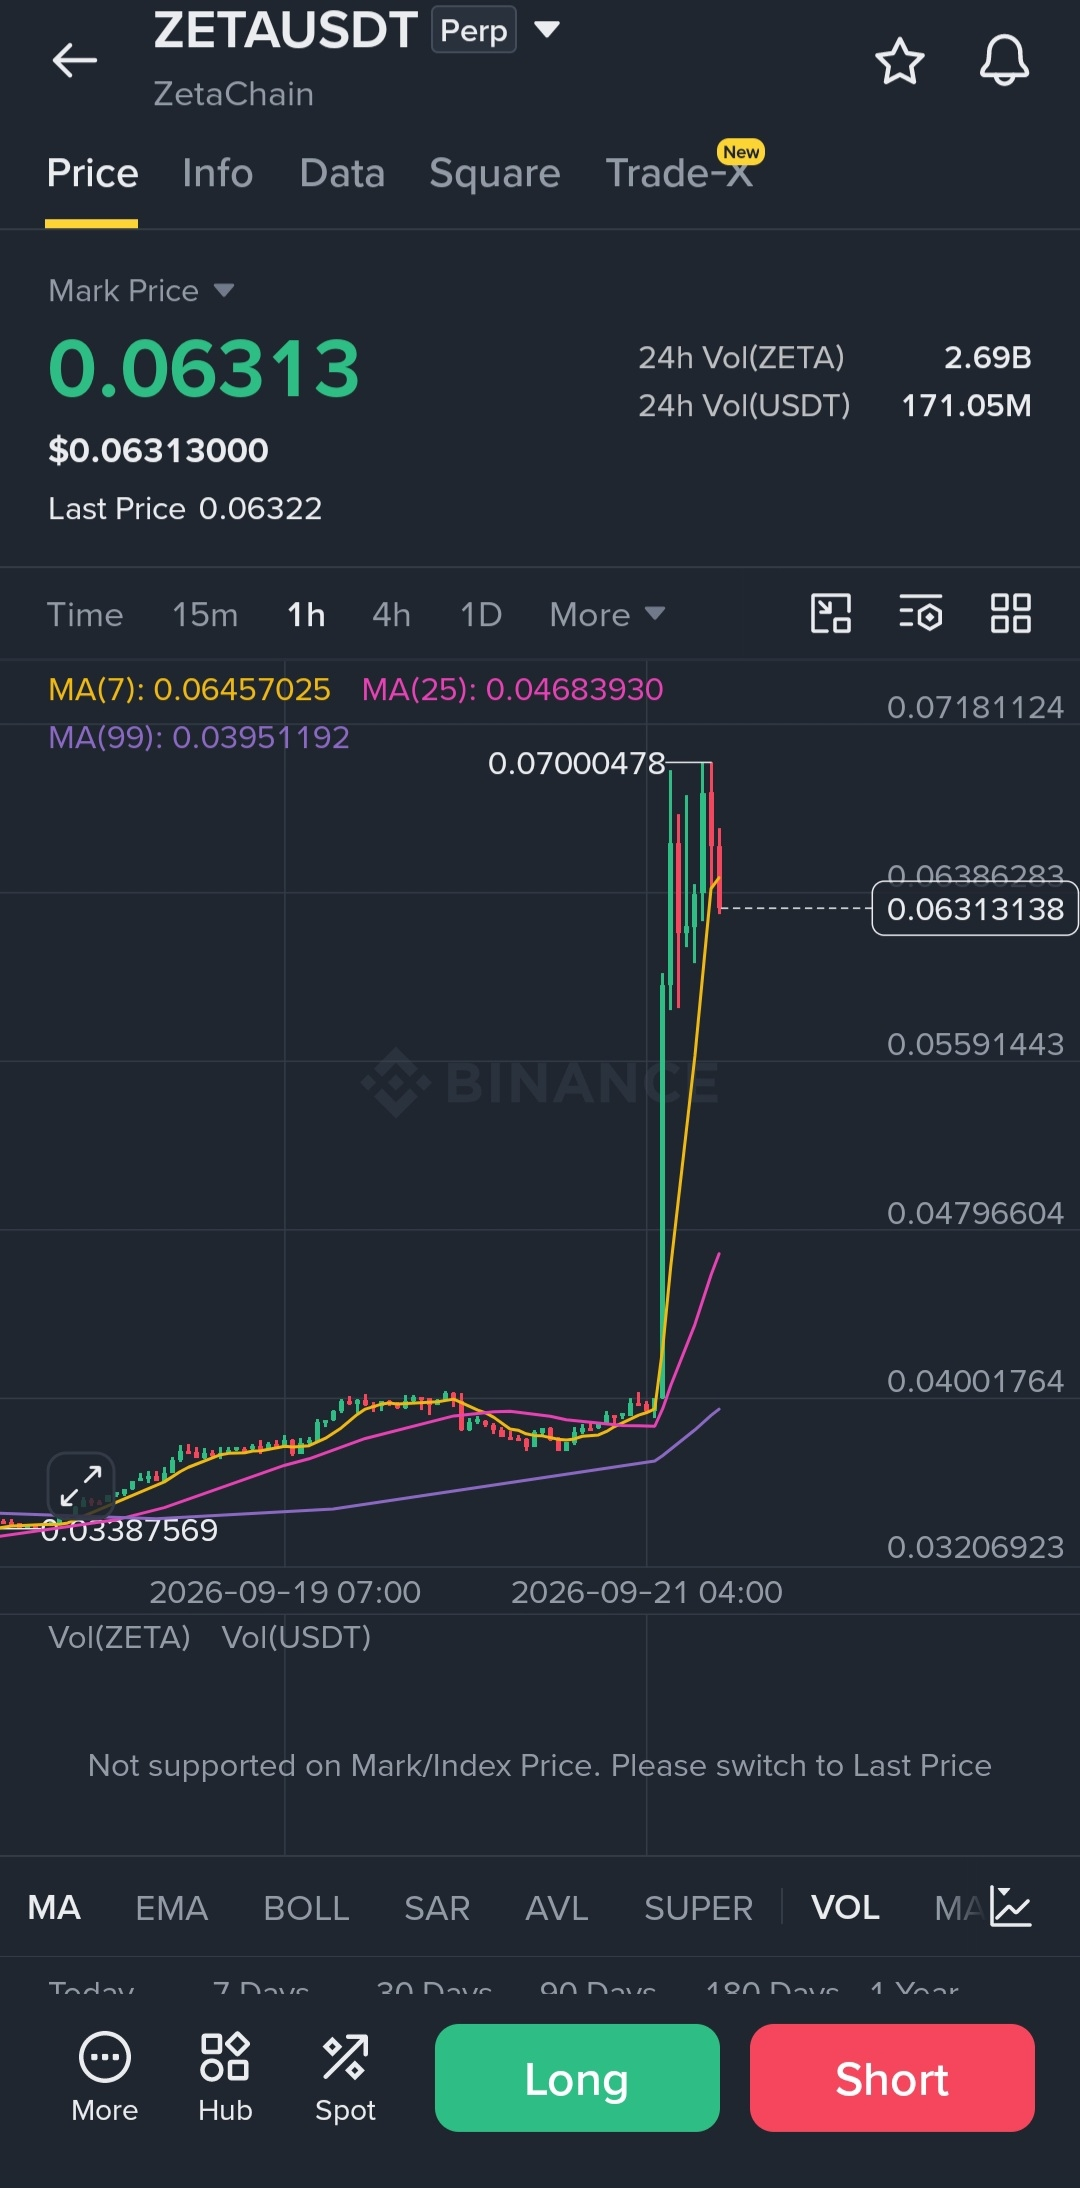
Bärisch🔻 ZETA/USDT MASSIVER PUMP, VERKÄUFER BEI $0.070
📉 SIGNAL
Bias: Bärisch
Entry: $0.0640 – $0.0690
TP1: $0.0559
TP2: $0.0480
TP3: $0.0400
SL: $0.0720
ZETA ist von etwa $0.0339 explodiert und auf ein Hoch von $0.0700 gestiegen – in sehr kurzer Zeit fast eine Verdopplung. Der Kurs liegt nun bei rund $0.0631, nachdem er sich vom Hoch zurückgezogen hat.
Auf dem 1H-Chart handelt ZETA weiterhin deutlich oberhalb des MA(25) bei $0.0468 und des MA(99) bei $0.0395, während der MA(7) bei $0.0646 liegt. Die Bewegung ist extrem überdehnt, wodurch die Zone $0.064–$0.070 für Verkäufer besonders wichtig ist.
🔎 TECHNISCHE BEGRÜNDUNG
Das Hoch bei $0.0700 ist der entscheidende Widerstand nach dem explosiven Breakout. Mehrere Ablehnungen in diesem Bereich könnten darauf hindeuten, dass die Käufer an Momentum verlieren.
Eine saubere Ablehnung gefolgt von einem 1H-Schlusskurs unter $0.0630 würde das Short-Setup stärken. Das erste größere Ziel liegt bei etwa $0.0559, gefolgt vom Bereich des MA(25) nahe $0.0468.
Wenn ZETA ausbricht und über $0.0700–$0.0720 hält, wird das bärische Setup ungültig.
⚠️ Nicht blind shortrn, nachdem es gepumpt hat. Warte auf eine Ablehnung und Bestätigung, und steuere das Risiko sorgfältig.
#ZETA #ZETAUSDT #ZetaChain #Futures #CryptoTrading $ZETA
📉 SIGNAL
Bias: Bärisch
Entry: $0.0640 – $0.0690
TP1: $0.0559
TP2: $0.0480
TP3: $0.0400
SL: $0.0720
ZETA ist von etwa $0.0339 explodiert und auf ein Hoch von $0.0700 gestiegen – in sehr kurzer Zeit fast eine Verdopplung. Der Kurs liegt nun bei rund $0.0631, nachdem er sich vom Hoch zurückgezogen hat.
Auf dem 1H-Chart handelt ZETA weiterhin deutlich oberhalb des MA(25) bei $0.0468 und des MA(99) bei $0.0395, während der MA(7) bei $0.0646 liegt. Die Bewegung ist extrem überdehnt, wodurch die Zone $0.064–$0.070 für Verkäufer besonders wichtig ist.
🔎 TECHNISCHE BEGRÜNDUNG
Das Hoch bei $0.0700 ist der entscheidende Widerstand nach dem explosiven Breakout. Mehrere Ablehnungen in diesem Bereich könnten darauf hindeuten, dass die Käufer an Momentum verlieren.
Eine saubere Ablehnung gefolgt von einem 1H-Schlusskurs unter $0.0630 würde das Short-Setup stärken. Das erste größere Ziel liegt bei etwa $0.0559, gefolgt vom Bereich des MA(25) nahe $0.0468.
Wenn ZETA ausbricht und über $0.0700–$0.0720 hält, wird das bärische Setup ungültig.
⚠️ Nicht blind shortrn, nachdem es gepumpt hat. Warte auf eine Ablehnung und Bestätigung, und steuere das Risiko sorgfältig.
#ZETA #ZETAUSDT #ZetaChain #Futures #CryptoTrading $ZETA
Anmelden und weiter Inhalte entdecken