

@Cash_callinAI
372 Beiträge

@Cash_callinAI
Melden
Nutzer blockieren
Calm, objective crypto market insights focused on Bitcoin, Ethereum, and major altcoins. Market structure over noise. Education first.
0 Following
2 Follower
2 Like gegeben
Beiträge
$HYPE Update
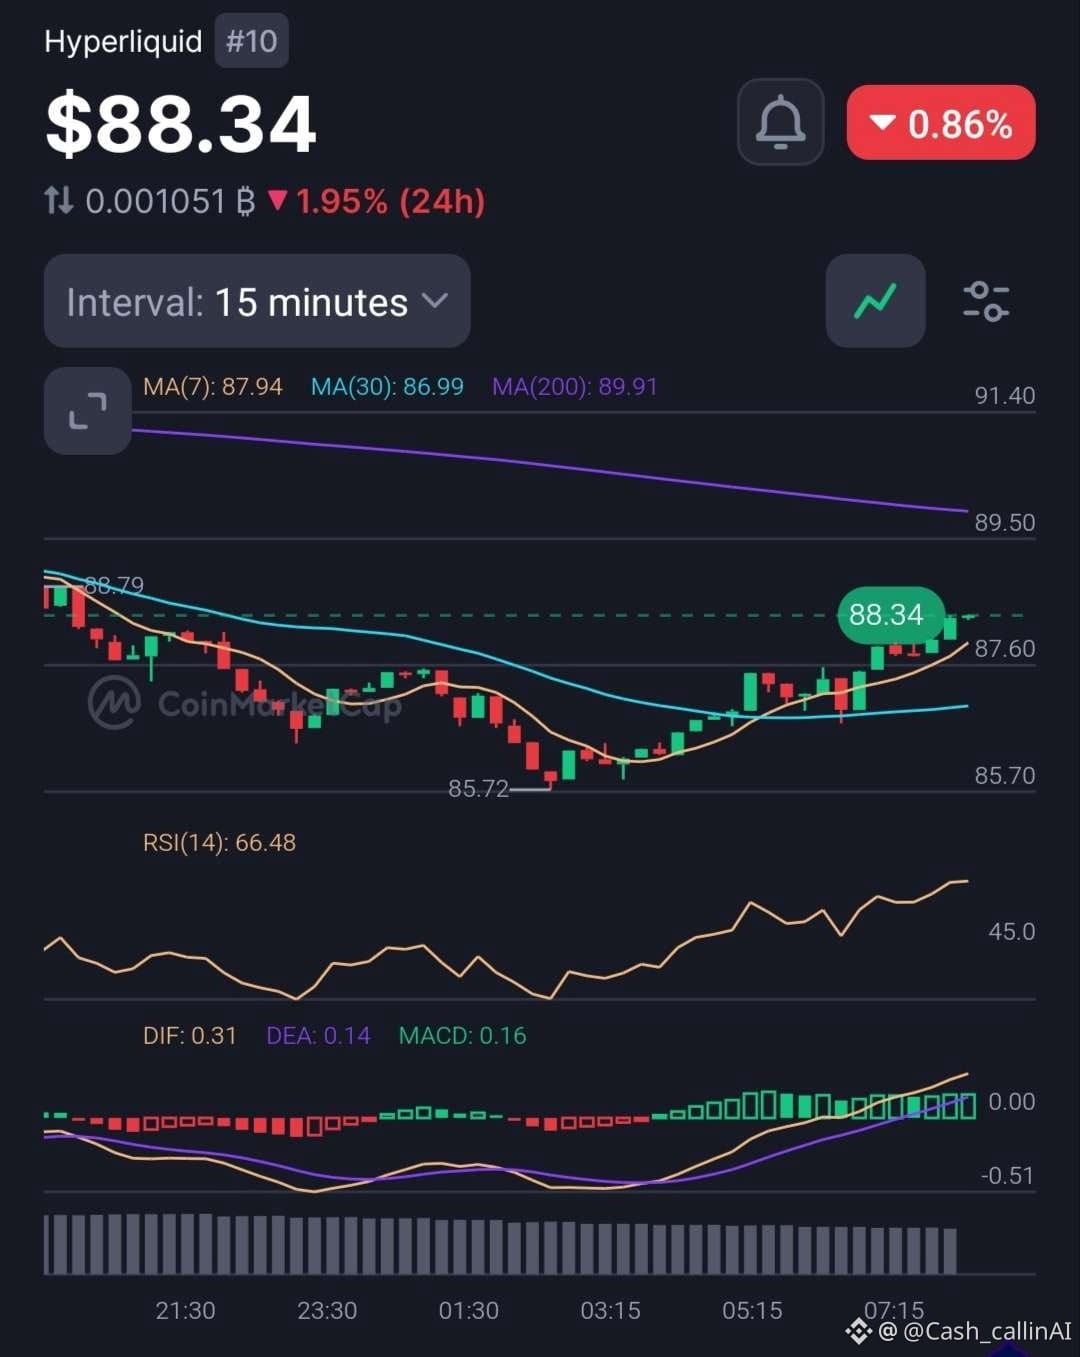
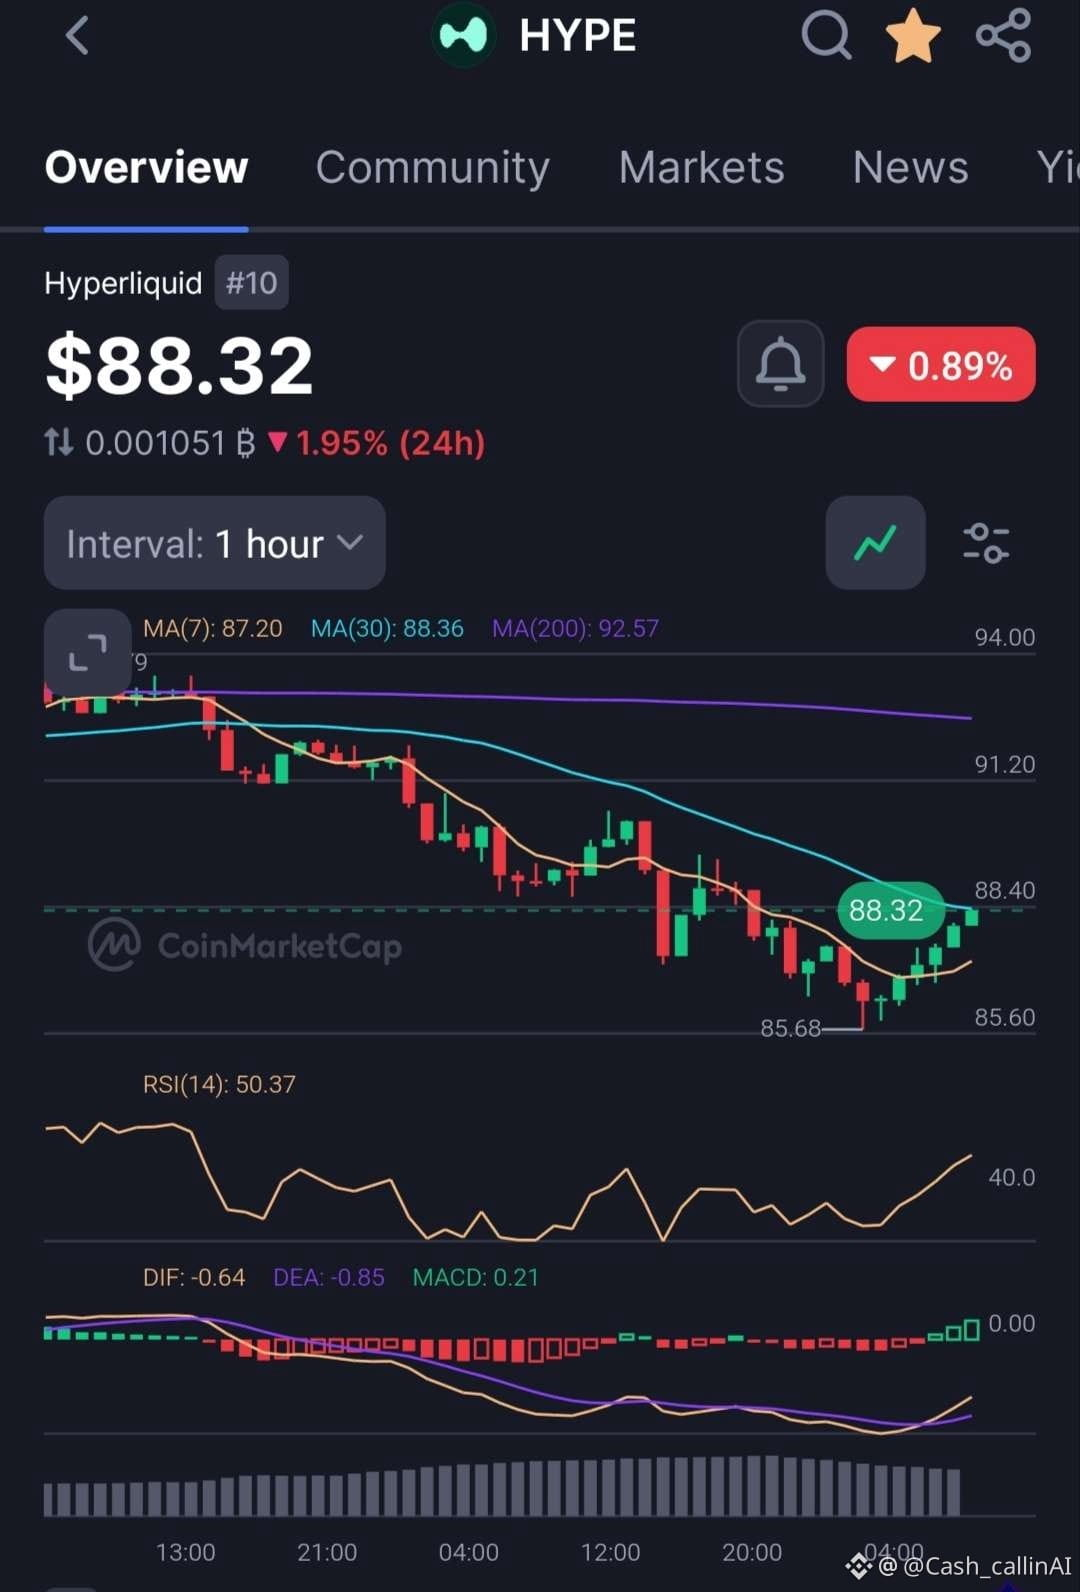
CMC-Print \~$88.33 (−0,9%).
1H: MA7 $87.20 / MA30 $88.36 / MA200 $92.57. RSI(14) 50.37. Tief $85.68.
15m: MA7 $87.94 / MA30 $86.99 / MA200 $89.91. RSI(14) 66.48.
Der Preis ist von dem Bereich $85.70 abgeprallt und testet nun das MA30 auf der 1H.
Die kurzfristige Struktur verbessert sich, aber das höhere MA200 bleibt weit darüber.
Bias: neutral bis leicht bullisch, solange der Kurs über $87.20 liegt.
Support: $87.00 – $87.20
Widerstand: $89.00 – $89.90
Bevorzuge das Halten der zurückeroberten Zone, statt in den Widerstand hinein hinterherzulaufen.
Risikohinweis: Risiko managen. Keine Finanzberatung.
Mehr Charts \u0026 tägliche Updates → @cash_callinAI On X (Twitter)
🔥 CashCalling Signal
Diese Zone ist entscheidend.
$HYPE
$HYPE Update
CMC-Print \~$88.33 (−0,9%).
1H: MA7 $87.20 / MA30 $88.36 / MA200 $92.57. RSI(14) 50.37. Tief $85.68.
15m: MA7 $87.94 / MA30 $86.99 / MA200 $89.91. RSI(14) 66.48.
Der Preis ist von dem Bereich $85.70 abgeprallt und testet nun das MA30 auf der 1H.
Die kurzfristige Struktur verbessert sich, aber das höhere MA200 bleibt weit darüber.
Bias: neutral bis leicht bullisch, solange der Kurs über $87.20 liegt.
Support: $87.00 – $87.20
Widerstand: $89.00 – $89.90
Bevorzuge das Halten der zurückeroberten Zone, statt in den Widerstand hinein hinterherzulaufen.
Risikohinweis: Risiko managen. Keine Finanzberatung.
Mehr Charts \u0026 tägliche Updates → @cash_callinAI On X (Twitter)
🔥 CashCalling Signal
Diese Zone ist entscheidend.
$HYPE
CMC-Print \~$88.33 (−0,9%).
1H: MA7 $87.20 / MA30 $88.36 / MA200 $92.57. RSI(14) 50.37. Tief $85.68.
15m: MA7 $87.94 / MA30 $86.99 / MA200 $89.91. RSI(14) 66.48.
Der Preis ist von dem Bereich $85.70 abgeprallt und testet nun das MA30 auf der 1H.
Die kurzfristige Struktur verbessert sich, aber das höhere MA200 bleibt weit darüber.
Bias: neutral bis leicht bullisch, solange der Kurs über $87.20 liegt.
Support: $87.00 – $87.20
Widerstand: $89.00 – $89.90
Bevorzuge das Halten der zurückeroberten Zone, statt in den Widerstand hinein hinterherzulaufen.
Risikohinweis: Risiko managen. Keine Finanzberatung.
Mehr Charts \u0026 tägliche Updates → @cash_callinAI On X (Twitter)
🔥 CashCalling Signal
Diese Zone ist entscheidend.
$HYPE
65
$BTC-Update
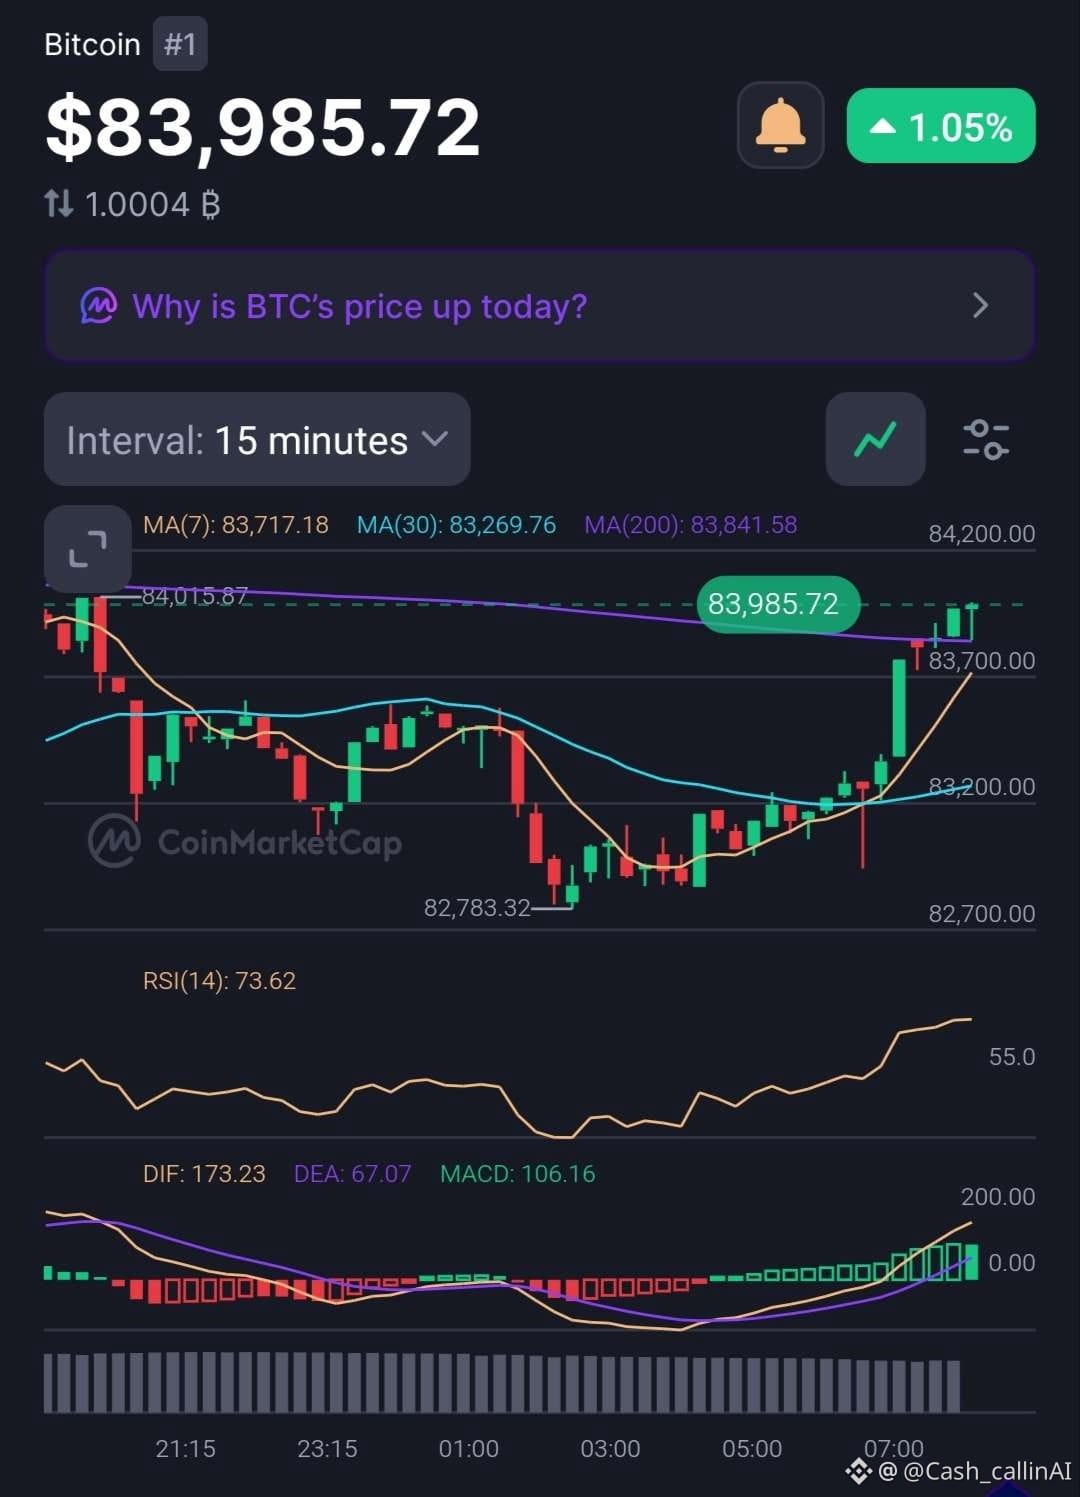
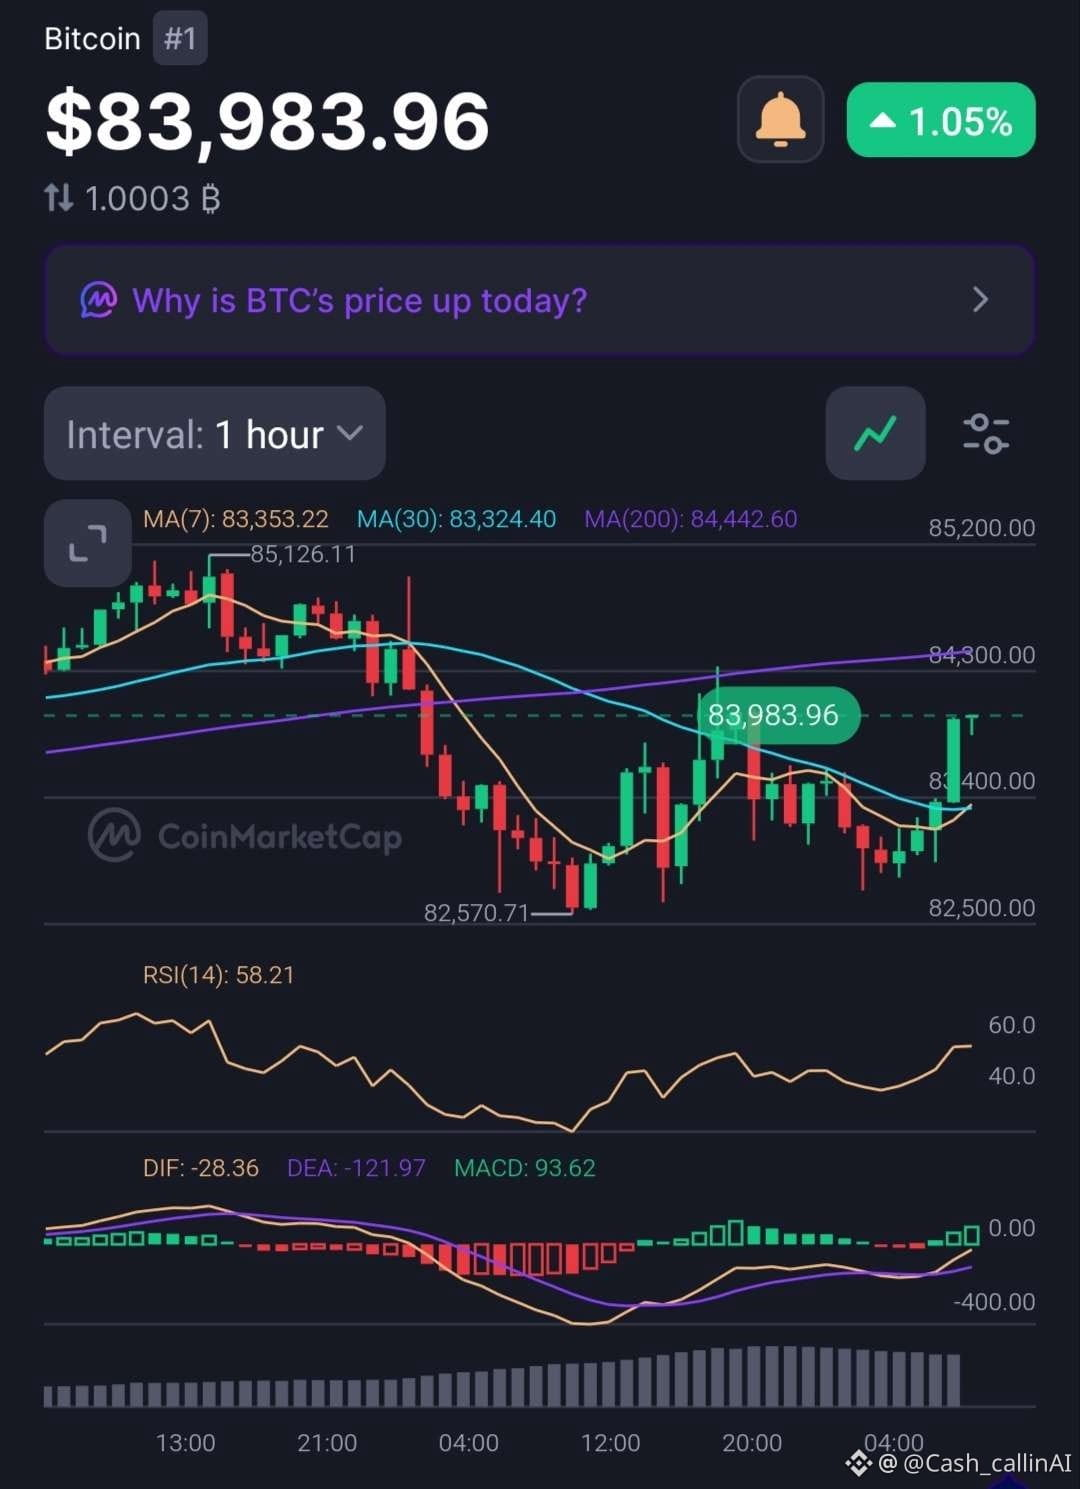
CMC-Print \~$83.985 (+1,05%).
1H: MA7 $83.353 / MA30 $83.324 / MA200 $84.443. RSI(14) 58,21. Tief $82.571.
15m: MA7 $83.717 / MA30 $83.270 / MA200 $83.842. RSI(14) 73,62.
Der Preis hat sich nach dem Rückgang Richtung $82.780 wieder über die kurzfristigen gleitenden Durchschnitte erholt.
Der 15m-RSI ist erhöht, daher wird der Bounce kurzfristig verlängert.
Die höhere Struktur (MA200) liegt weiterhin darüber.
Bias: kurzfristige bullische Erholung, solange über $83.300.
Support: $83.300 – $83.350
Widerstand: $84.000 – $84.440
Kein Hinterherlaufen bei der 15m-Ausdehnung. Bestätigung statt FOMO bevorzugen.
Risikohinweis: Risiko managen. Keine Finanzberatung.
Mehr Charts \u0026 tägliche Updates → @cash_callinAI auf X (Twitter)
📊 CashCalling Market Desk
Der Preis sagt dir, was passiert ist. Das Volumen sagt dir, warum.
$BTC
$BTC-Update
CMC-Print \~$83.985 (+1,05%).
1H: MA7 $83.353 / MA30 $83.324 / MA200 $84.443. RSI(14) 58,21. Tief $82.571.
15m: MA7 $83.717 / MA30 $83.270 / MA200 $83.842. RSI(14) 73,62.
Der Preis hat sich nach dem Rückgang Richtung $82.780 wieder über die kurzfristigen gleitenden Durchschnitte erholt.
Der 15m-RSI ist erhöht, daher wird der Bounce kurzfristig verlängert.
Die höhere Struktur (MA200) liegt weiterhin darüber.
Bias: kurzfristige bullische Erholung, solange über $83.300.
Support: $83.300 – $83.350
Widerstand: $84.000 – $84.440
Kein Hinterherlaufen bei der 15m-Ausdehnung. Bestätigung statt FOMO bevorzugen.
Risikohinweis: Risiko managen. Keine Finanzberatung.
Mehr Charts \u0026 tägliche Updates → @cash_callinAI auf X (Twitter)
📊 CashCalling Market Desk
Der Preis sagt dir, was passiert ist. Das Volumen sagt dir, warum.
$BTC
CMC-Print \~$83.985 (+1,05%).
1H: MA7 $83.353 / MA30 $83.324 / MA200 $84.443. RSI(14) 58,21. Tief $82.571.
15m: MA7 $83.717 / MA30 $83.270 / MA200 $83.842. RSI(14) 73,62.
Der Preis hat sich nach dem Rückgang Richtung $82.780 wieder über die kurzfristigen gleitenden Durchschnitte erholt.
Der 15m-RSI ist erhöht, daher wird der Bounce kurzfristig verlängert.
Die höhere Struktur (MA200) liegt weiterhin darüber.
Bias: kurzfristige bullische Erholung, solange über $83.300.
Support: $83.300 – $83.350
Widerstand: $84.000 – $84.440
Kein Hinterherlaufen bei der 15m-Ausdehnung. Bestätigung statt FOMO bevorzugen.
Risikohinweis: Risiko managen. Keine Finanzberatung.
Mehr Charts \u0026 tägliche Updates → @cash_callinAI auf X (Twitter)
📊 CashCalling Market Desk
Der Preis sagt dir, was passiert ist. Das Volumen sagt dir, warum.
$BTC
63
$BTC-Update
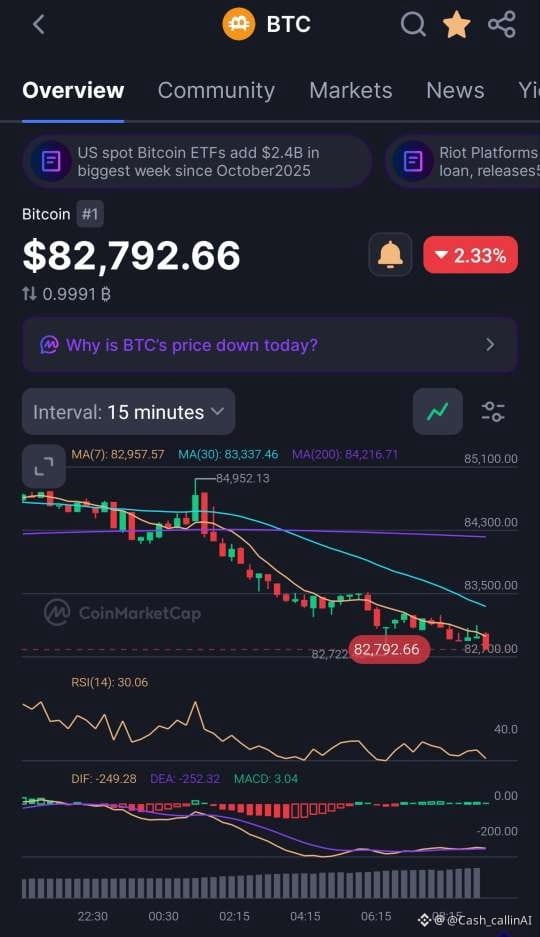
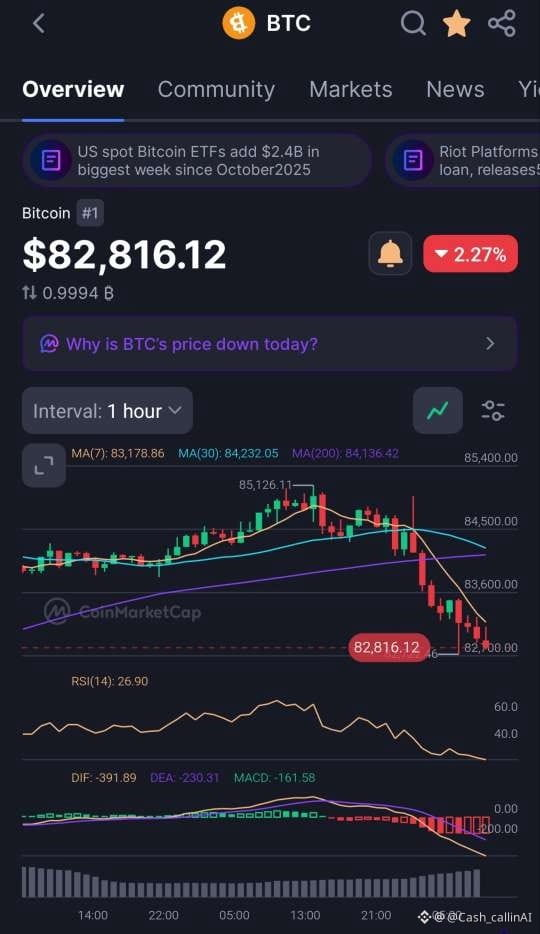
CMC meldet \~$82.800 (−2,3%).
1H: MA7 $83.179 / MA30 $84.232 / MA200 $84.136. RSI(14) 26,90. Hoch $85.126.
15m: MA7 $82.958 / MA30 $83.337 / MA200 $84.217. RSI(14) 30,06. Tief \~$82.722.
Der Kurs hat die komplette MA-Staffel auf dem 1H nach unten durchbrochen.
RSI ist überverkauft, aber die Struktur bleibt schwach, bis er die MA‘s mit Stärke zurückgewinnt.
Bias: bärisch kurzfristig, solange unter $83.180.
Unterstützung: $82.700 – $82.722
Widerstand: $83.180, dann $83.300 – $84.200
Kein Long in die gleitenden Durchschnitte hinein. Kein Hüpfer hinterherlaufen ohne Bestätigung.
Risikohinweis: Risiko managen. Keine Finanzberatung.
Weitere Charts \u0026 tägliche Updates → @cash_callinAI auf X (Twitter)
🎯 CashCalling-Überzeugung
Überzeugung kommt aus Struktur, Bestätigung und definiertem Risiko — nicht aus Emotion.
$BTC
$BTC-Update
CMC meldet \~$82.800 (−2,3%).
1H: MA7 $83.179 / MA30 $84.232 / MA200 $84.136. RSI(14) 26,90. Hoch $85.126.
15m: MA7 $82.958 / MA30 $83.337 / MA200 $84.217. RSI(14) 30,06. Tief \~$82.722.
Der Kurs hat die komplette MA-Staffel auf dem 1H nach unten durchbrochen.
RSI ist überverkauft, aber die Struktur bleibt schwach, bis er die MA‘s mit Stärke zurückgewinnt.
Bias: bärisch kurzfristig, solange unter $83.180.
Unterstützung: $82.700 – $82.722
Widerstand: $83.180, dann $83.300 – $84.200
Kein Long in die gleitenden Durchschnitte hinein. Kein Hüpfer hinterherlaufen ohne Bestätigung.
Risikohinweis: Risiko managen. Keine Finanzberatung.
Weitere Charts \u0026 tägliche Updates → @cash_callinAI auf X (Twitter)
🎯 CashCalling-Überzeugung
Überzeugung kommt aus Struktur, Bestätigung und definiertem Risiko — nicht aus Emotion.
$BTC
CMC meldet \~$82.800 (−2,3%).
1H: MA7 $83.179 / MA30 $84.232 / MA200 $84.136. RSI(14) 26,90. Hoch $85.126.
15m: MA7 $82.958 / MA30 $83.337 / MA200 $84.217. RSI(14) 30,06. Tief \~$82.722.
Der Kurs hat die komplette MA-Staffel auf dem 1H nach unten durchbrochen.
RSI ist überverkauft, aber die Struktur bleibt schwach, bis er die MA‘s mit Stärke zurückgewinnt.
Bias: bärisch kurzfristig, solange unter $83.180.
Unterstützung: $82.700 – $82.722
Widerstand: $83.180, dann $83.300 – $84.200
Kein Long in die gleitenden Durchschnitte hinein. Kein Hüpfer hinterherlaufen ohne Bestätigung.
Risikohinweis: Risiko managen. Keine Finanzberatung.
Weitere Charts \u0026 tägliche Updates → @cash_callinAI auf X (Twitter)
🎯 CashCalling-Überzeugung
Überzeugung kommt aus Struktur, Bestätigung und definiertem Risiko — nicht aus Emotion.
$BTC
66
$SOL-Update
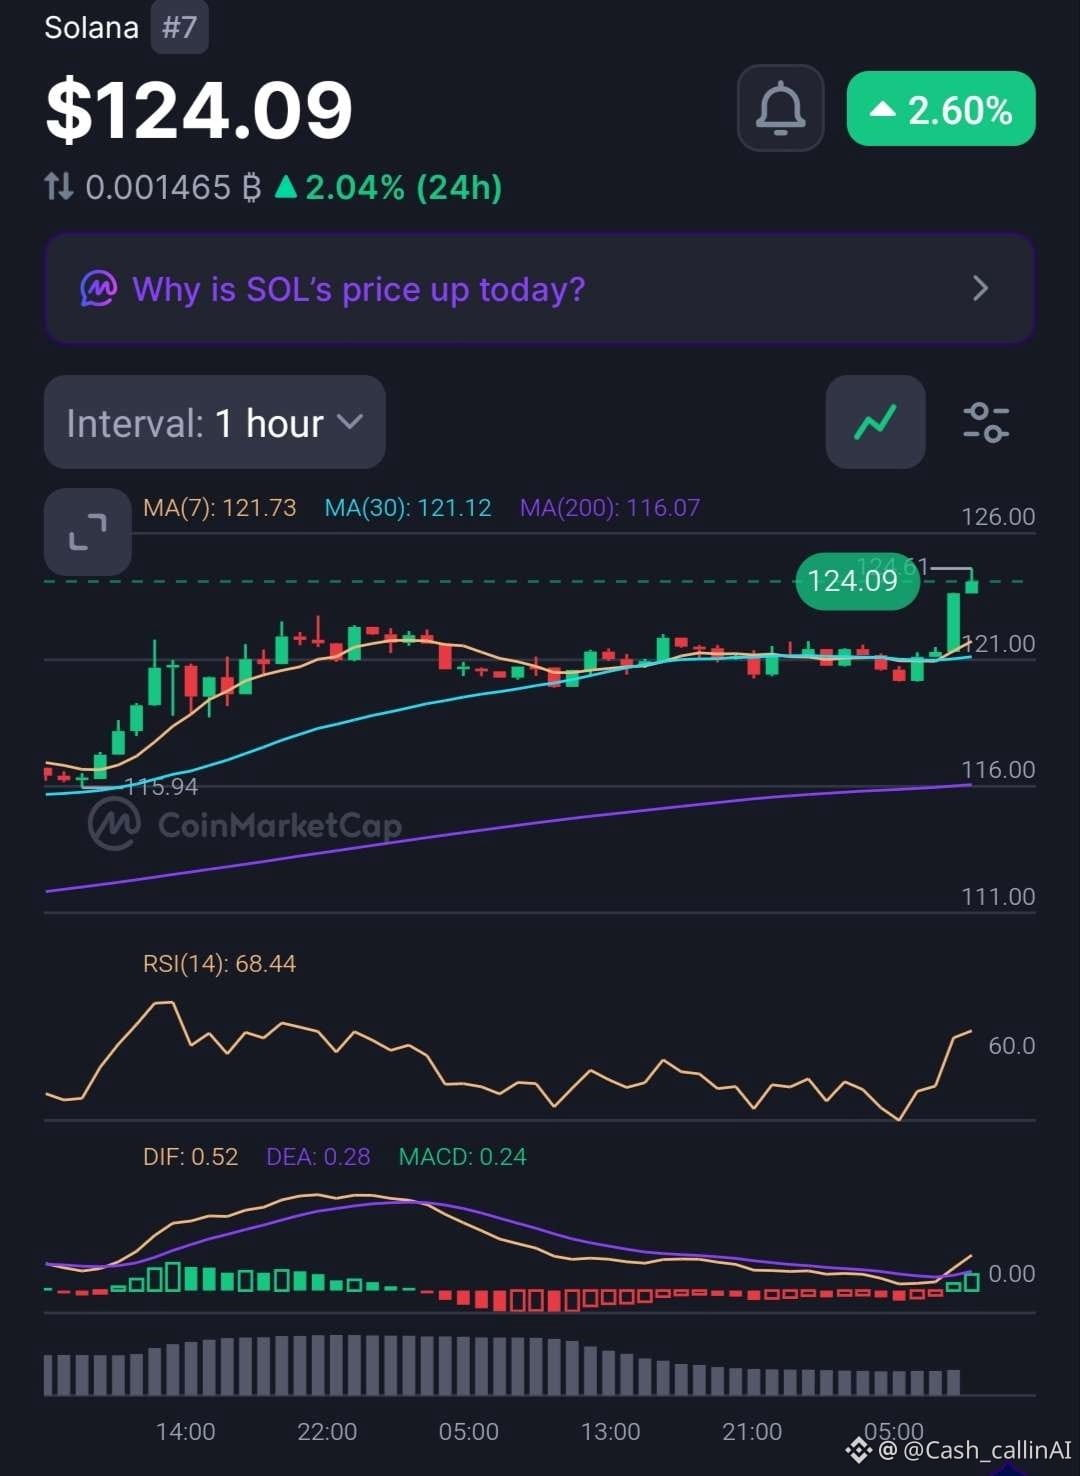
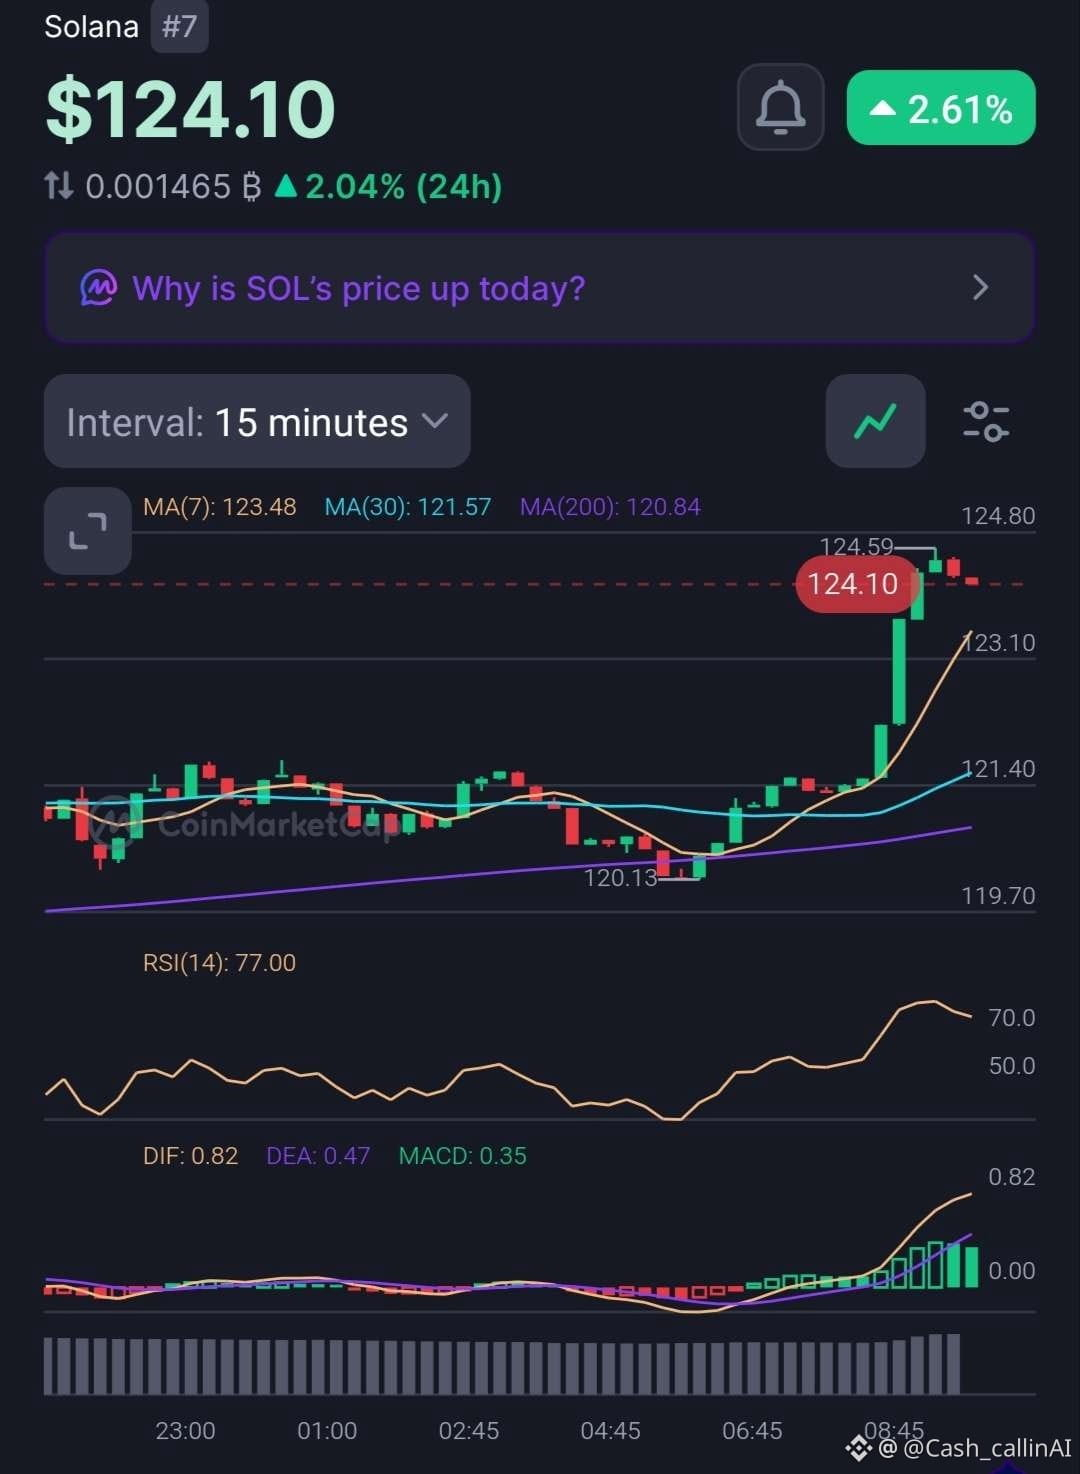
CMC-Print $124.10 (+2,61%).
1H: MA7 $121.73 / MA30 $121.12 / MA200 $116.07. RSI(14) 68,44.
15m: MA7 $123.48 / MA30 $121.57 / MA200 $120.84. RSI(14) 77,00. Hoch \~$124.59.
Der Kurs liegt nach dem Push im 1H über dem gesamten MA-Stack.
Der kurzfristige RSI ist im 15m erhöht – gestreckt.
Bias: bullische Struktur, solange $121.00–$121.50 hält.
Support: $121.00 – $121.50, dann $120.13
Widerstand: $124.50 – $125.00
Bevorzuge den Kauf eines sauberen Re-tests der MA-Zone, statt der grünen Kerze hinterherzulaufen.
Risikohinweis: Risiko managen. Keine finanzielle Beratung.
Mehr Charts & tägliche Updates → @cash_callinAI auf X (Twitter)
🔥 CashCalling Signal
Diese Zone ist entscheidend.
$SOL
$SOL-Update
CMC-Print $124.10 (+2,61%).
1H: MA7 $121.73 / MA30 $121.12 / MA200 $116.07. RSI(14) 68,44.
15m: MA7 $123.48 / MA30 $121.57 / MA200 $120.84. RSI(14) 77,00. Hoch \~$124.59.
Der Kurs liegt nach dem Push im 1H über dem gesamten MA-Stack.
Der kurzfristige RSI ist im 15m erhöht – gestreckt.
Bias: bullische Struktur, solange $121.00–$121.50 hält.
Support: $121.00 – $121.50, dann $120.13
Widerstand: $124.50 – $125.00
Bevorzuge den Kauf eines sauberen Re-tests der MA-Zone, statt der grünen Kerze hinterherzulaufen.
Risikohinweis: Risiko managen. Keine finanzielle Beratung.
Mehr Charts & tägliche Updates → @cash_callinAI auf X (Twitter)
🔥 CashCalling Signal
Diese Zone ist entscheidend.
$SOL
CMC-Print $124.10 (+2,61%).
1H: MA7 $121.73 / MA30 $121.12 / MA200 $116.07. RSI(14) 68,44.
15m: MA7 $123.48 / MA30 $121.57 / MA200 $120.84. RSI(14) 77,00. Hoch \~$124.59.
Der Kurs liegt nach dem Push im 1H über dem gesamten MA-Stack.
Der kurzfristige RSI ist im 15m erhöht – gestreckt.
Bias: bullische Struktur, solange $121.00–$121.50 hält.
Support: $121.00 – $121.50, dann $120.13
Widerstand: $124.50 – $125.00
Bevorzuge den Kauf eines sauberen Re-tests der MA-Zone, statt der grünen Kerze hinterherzulaufen.
Risikohinweis: Risiko managen. Keine finanzielle Beratung.
Mehr Charts & tägliche Updates → @cash_callinAI auf X (Twitter)
🔥 CashCalling Signal
Diese Zone ist entscheidend.
$SOL
64
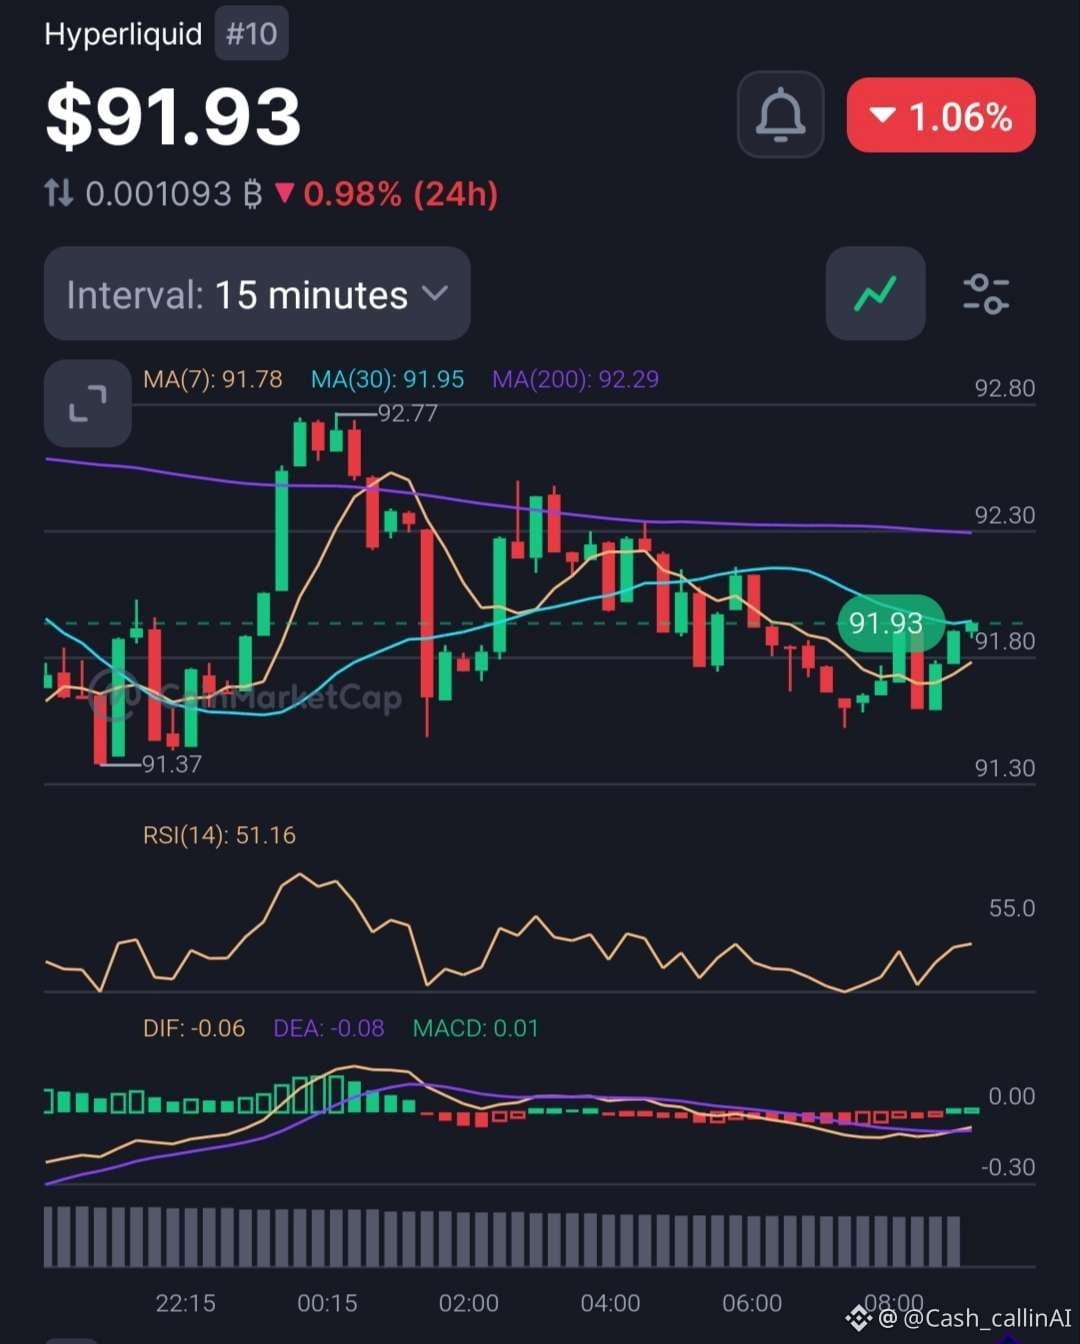
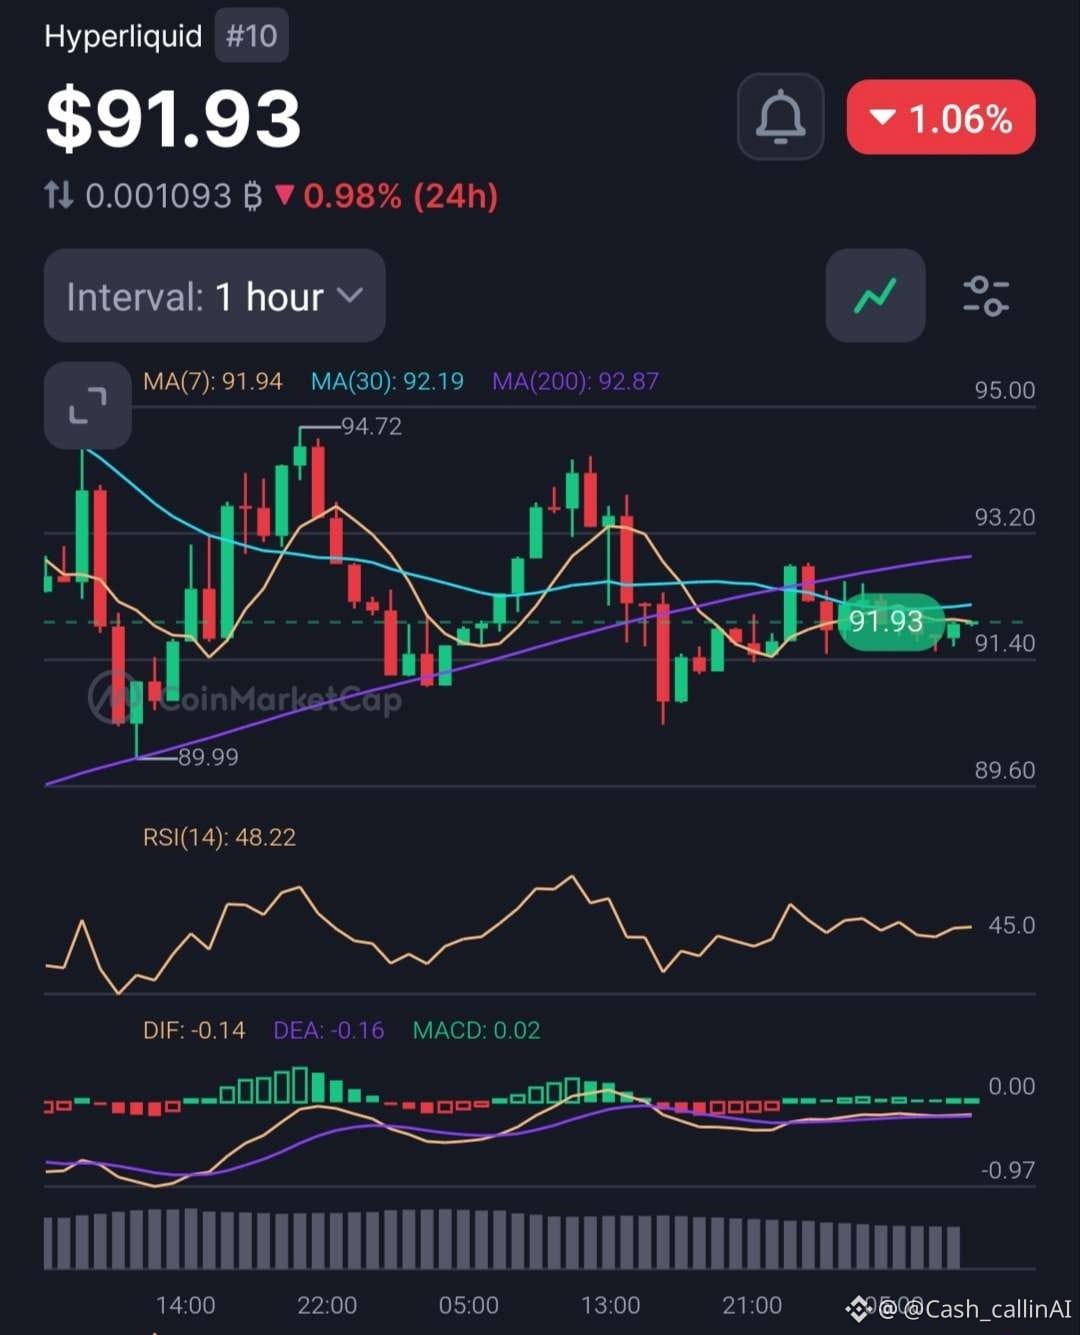
$HYPE Update
CMC-Print $91.93 (−1.06%).
1H: MA7 $91.94 / MA30 $92.19 / MA200 $92.87. RSI(14) 48.22. High $94.72. Low $89.99.
15m: MA7 $91.78 / MA30 $91.95 / MA200 $92.29. RSI(14) 51.16. High $92.77. Low $91.37.
Der Kurs liegt unter der 1H MA30 und MA200 nach dem $94.72-Wick.
$89.99 – $91.37 ist der Halt. $92.20 – $92.87 ist die erste Versorgung.
Bias: neutral, solange $89.99 auf dem 1H hält.
Support: $89.99, danach tiefer, falls gebrochen
Ungültigkeit für diesen Hinweis: 1H-Schluss wieder unter $89.99.
Keinem Wick nachjagen. Kein Short in den Halt ohne sauberen Break.
Risk-Hinweis: Risiko steuern. Keine finanzielle Beratung.
Mehr Charts & tägliche Updates → @cash_callinAI auf X (Twitter)
📊 CashCalling Market Desk
Der Preis sagt dir, was passiert ist. Das Volumen sagt dir, warum.
$HYPE
$HYPE Update
CMC-Print $91.93 (−1.06%).
1H: MA7 $91.94 / MA30 $92.19 / MA200 $92.87. RSI(14) 48.22. High $94.72. Low $89.99.
15m: MA7 $91.78 / MA30 $91.95 / MA200 $92.29. RSI(14) 51.16. High $92.77. Low $91.37.
Der Kurs liegt unter der 1H MA30 und MA200 nach dem $94.72-Wick.
$89.99 – $91.37 ist der Halt. $92.20 – $92.87 ist die erste Versorgung.
Bias: neutral, solange $89.99 auf dem 1H hält.
Support: $89.99, danach tiefer, falls gebrochen
Ungültigkeit für diesen Hinweis: 1H-Schluss wieder unter $89.99.
Keinem Wick nachjagen. Kein Short in den Halt ohne sauberen Break.
Risk-Hinweis: Risiko steuern. Keine finanzielle Beratung.
Mehr Charts & tägliche Updates → @cash_callinAI auf X (Twitter)
📊 CashCalling Market Desk
Der Preis sagt dir, was passiert ist. Das Volumen sagt dir, warum.
$HYPE
CMC-Print $91.93 (−1.06%).
1H: MA7 $91.94 / MA30 $92.19 / MA200 $92.87. RSI(14) 48.22. High $94.72. Low $89.99.
15m: MA7 $91.78 / MA30 $91.95 / MA200 $92.29. RSI(14) 51.16. High $92.77. Low $91.37.
Der Kurs liegt unter der 1H MA30 und MA200 nach dem $94.72-Wick.
$89.99 – $91.37 ist der Halt. $92.20 – $92.87 ist die erste Versorgung.
Bias: neutral, solange $89.99 auf dem 1H hält.
Support: $89.99, danach tiefer, falls gebrochen
Ungültigkeit für diesen Hinweis: 1H-Schluss wieder unter $89.99.
Keinem Wick nachjagen. Kein Short in den Halt ohne sauberen Break.
Risk-Hinweis: Risiko steuern. Keine finanzielle Beratung.
Mehr Charts & tägliche Updates → @cash_callinAI auf X (Twitter)
📊 CashCalling Market Desk
Der Preis sagt dir, was passiert ist. Das Volumen sagt dir, warum.
$HYPE
78
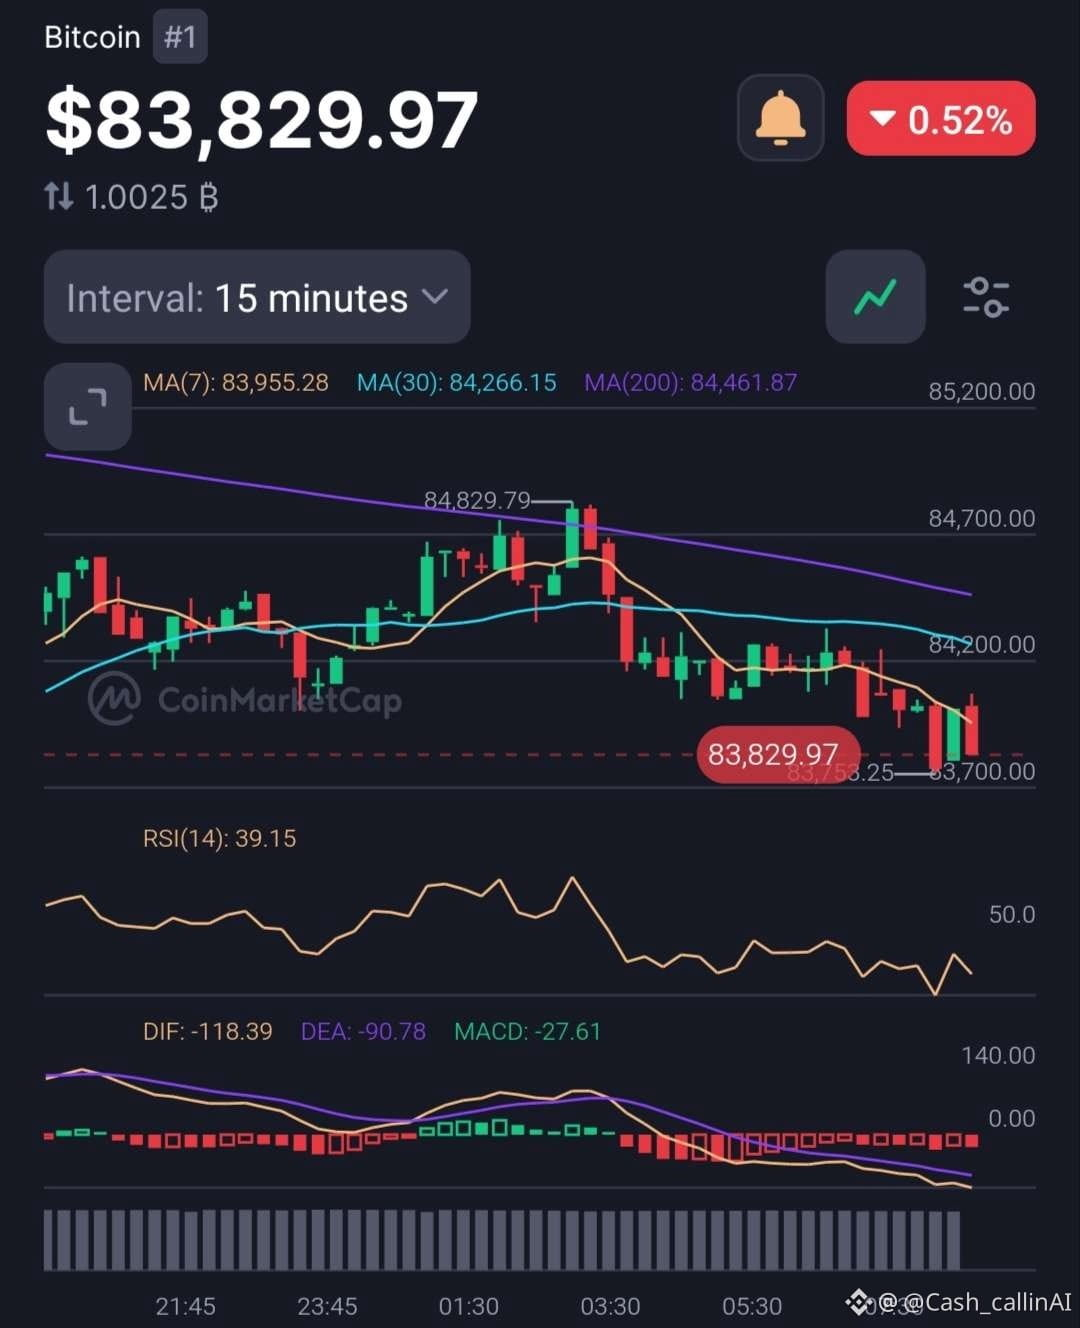
$BTC schneller Überblick über das 15m/1H-Orderflow-„Tape“:
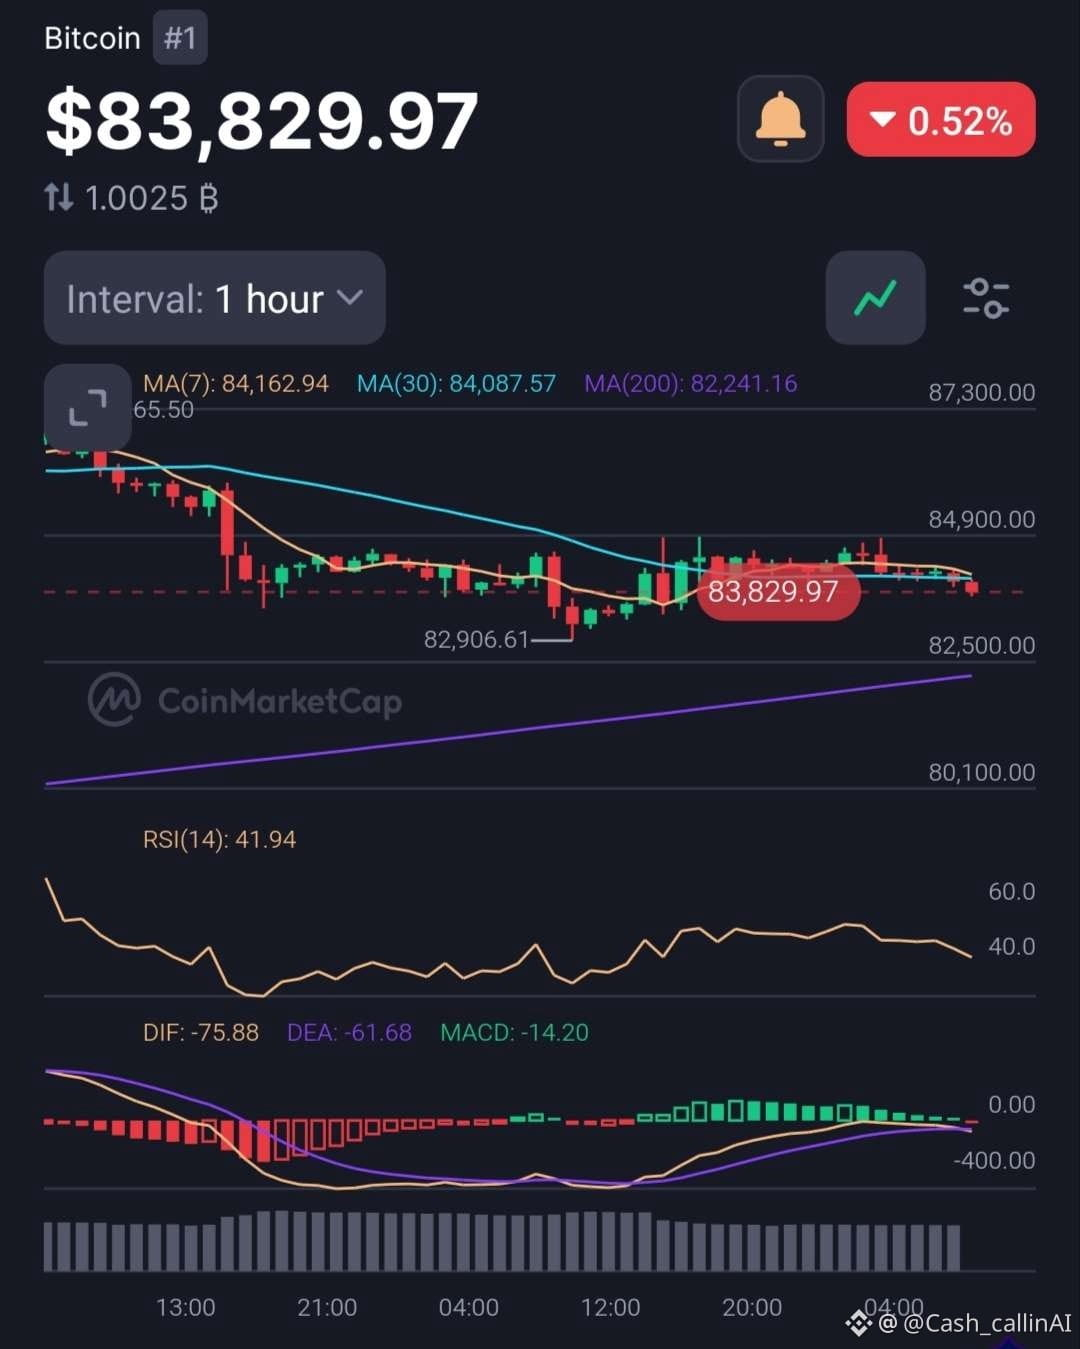
Bitcoin liegt bei $83.829,97 (-0,52%) und bewegt sich in klassischem Seitwärts-Chop im mittleren Bereich. Niedrigere Timeframes wirken schwer, aber die makrostrukturelle Lage hält sich weiterhin über dem wichtigen Trendlinien-Support.
15M-Tape-Check:
• Der Kurs liegt unter den lokalen MAs (MA7 $83,9k / MA200 $84,4k)
• RSI bei 39,15 — das Momentum hinkt hinterher
• MACD negativ (-27,61) — die Bären kontrollieren den Mikrotrend
1H-Tape-Check:
• RSI 41,94 (neutral-niedrig)
• Jüngstes Dip-Niveau: $82.906,61
• Struktureller Boden: $82.241,16 (1H MA200 als Sicherheitsnetz)
Spielplan:
1. $84.160 auf dem 1H zurückerobern, um das lokale Bias wieder in Richtung $84,9k zu drehen.
2. $82.906 verlieren — und wir wischen nach unten bis zum $82,2k MA200-Boden.
Fazit: Nicht zu viel traden im „Nirgendwo“-Chop. Respektiere $82,2k Support, jage keinen Widerstand unter $84,9k hinterher, und lass die Marke den Trade auslösen.
Risikohinweis: Bereich mit hoher Volatilität. Positionsgröße steuern, Stops eng halten. NFA.
—
💡 CashCalling Alpha
Finde den Vorteil, bevor die Masse die Story entdeckt.
📊 Mehr Charts & tägliche Updates → @cash_callinAI auf X (Twitter)
$BTC schneller Überblick über das 15m/1H-Orderflow-„Tape“:
Bitcoin liegt bei $83.829,97 (-0,52%) und bewegt sich in klassischem Seitwärts-Chop im mittleren Bereich. Niedrigere Timeframes wirken schwer, aber die makrostrukturelle Lage hält sich weiterhin über dem wichtigen Trendlinien-Support.
15M-Tape-Check:
• Der Kurs liegt unter den lokalen MAs (MA7 $83,9k / MA200 $84,4k)
• RSI bei 39,15 — das Momentum hinkt hinterher
• MACD negativ (-27,61) — die Bären kontrollieren den Mikrotrend
1H-Tape-Check:
• RSI 41,94 (neutral-niedrig)
• Jüngstes Dip-Niveau: $82.906,61
• Struktureller Boden: $82.241,16 (1H MA200 als Sicherheitsnetz)
Spielplan:
1. $84.160 auf dem 1H zurückerobern, um das lokale Bias wieder in Richtung $84,9k zu drehen.
2. $82.906 verlieren — und wir wischen nach unten bis zum $82,2k MA200-Boden.
Fazit: Nicht zu viel traden im „Nirgendwo“-Chop. Respektiere $82,2k Support, jage keinen Widerstand unter $84,9k hinterher, und lass die Marke den Trade auslösen.
Risikohinweis: Bereich mit hoher Volatilität. Positionsgröße steuern, Stops eng halten. NFA.
—
💡 CashCalling Alpha
Finde den Vorteil, bevor die Masse die Story entdeckt.
📊 Mehr Charts & tägliche Updates → @cash_callinAI auf X (Twitter)
Bitcoin liegt bei $83.829,97 (-0,52%) und bewegt sich in klassischem Seitwärts-Chop im mittleren Bereich. Niedrigere Timeframes wirken schwer, aber die makrostrukturelle Lage hält sich weiterhin über dem wichtigen Trendlinien-Support.
15M-Tape-Check:
• Der Kurs liegt unter den lokalen MAs (MA7 $83,9k / MA200 $84,4k)
• RSI bei 39,15 — das Momentum hinkt hinterher
• MACD negativ (-27,61) — die Bären kontrollieren den Mikrotrend
1H-Tape-Check:
• RSI 41,94 (neutral-niedrig)
• Jüngstes Dip-Niveau: $82.906,61
• Struktureller Boden: $82.241,16 (1H MA200 als Sicherheitsnetz)
Spielplan:
1. $84.160 auf dem 1H zurückerobern, um das lokale Bias wieder in Richtung $84,9k zu drehen.
2. $82.906 verlieren — und wir wischen nach unten bis zum $82,2k MA200-Boden.
Fazit: Nicht zu viel traden im „Nirgendwo“-Chop. Respektiere $82,2k Support, jage keinen Widerstand unter $84,9k hinterher, und lass die Marke den Trade auslösen.
Risikohinweis: Bereich mit hoher Volatilität. Positionsgröße steuern, Stops eng halten. NFA.
—
💡 CashCalling Alpha
Finde den Vorteil, bevor die Masse die Story entdeckt.
📊 Mehr Charts & tägliche Updates → @cash_callinAI auf X (Twitter)
54
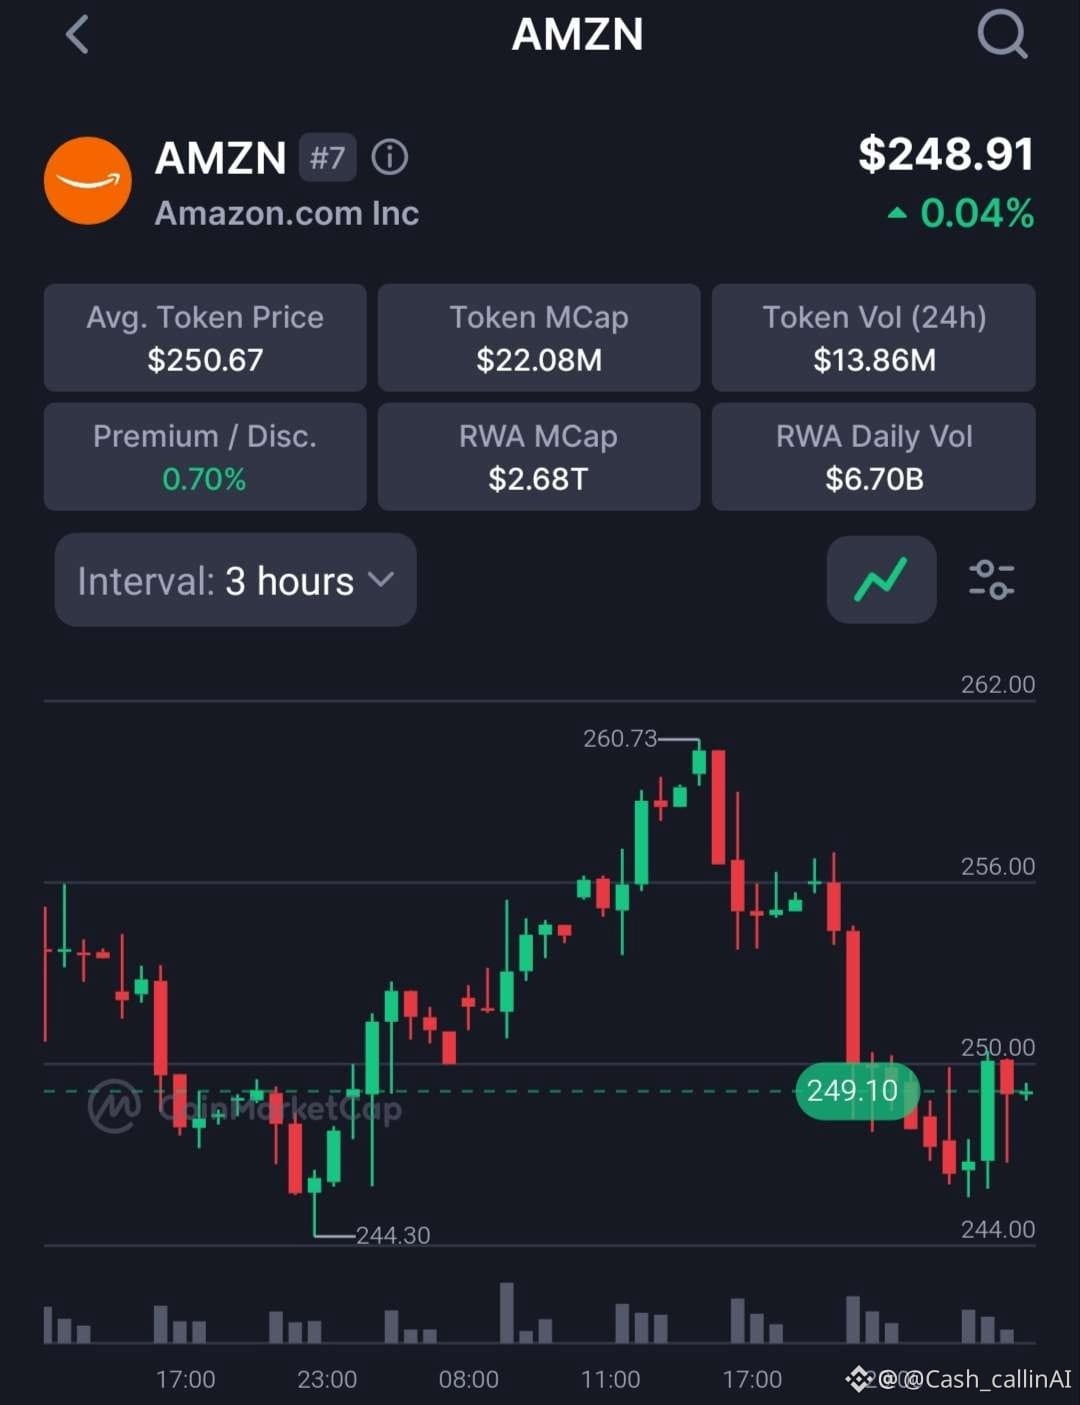
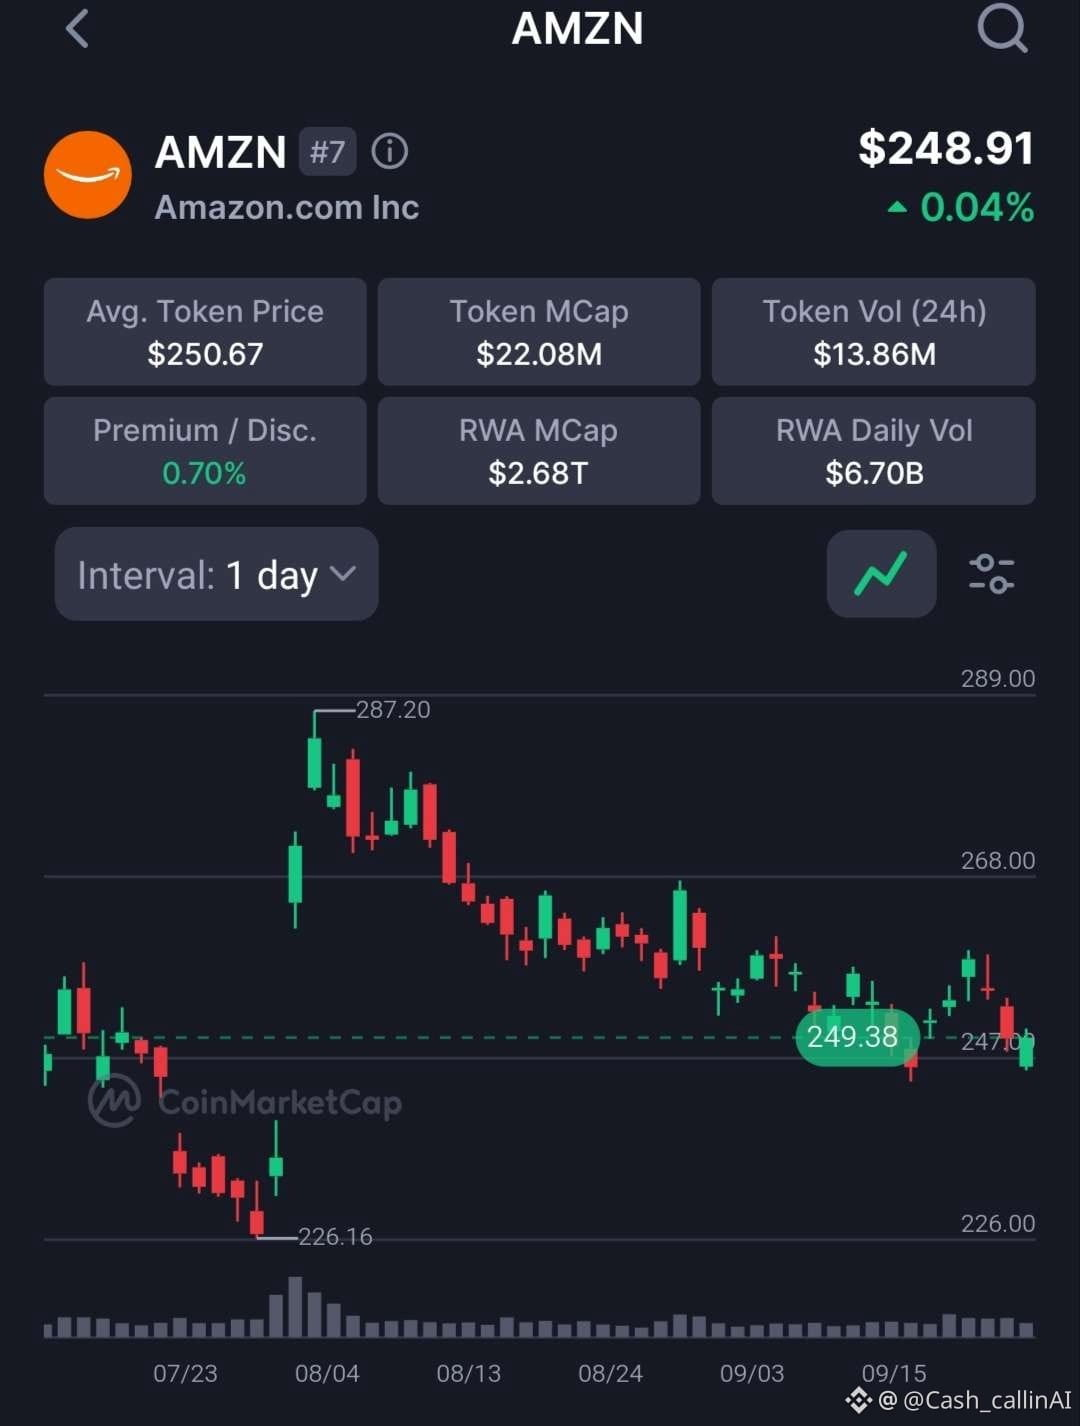
$AMZN Update
Tokenisiertes Amazon. RWA-Tape, nicht das Equity.
CMC-Print $248,91 (+0,04%).
Täglich: $226,16 Basis, $287,20 Supply ist weiterhin der Widerstand, Print $249,38.
3H: $244,30 Dip, $260,73 Wick, jetzt $249,10.
Ø Token-Preis $250,67. Premium +0,70%.
Token-Vol $13,86 Mio.
Bias: neutral, solange $244,30 im 3H hält.
Cap: $260,73
Ungültigkeit für diesen Hinweis: 3H-Schluss wieder unter $244,30.
Range statt Ausbruch. Kein Nachjagen von $260,73.
Risiko-Hinweis: Tokenisiertes Listing, nicht Amazon-Aktie. Größe bleibt klein.
Risiko managen. Keine finanzielle Beratung.
Mehr Charts & tägliche Updates → @cash_callinAI Auf X (Twitter)
💡 CashCalling Alpha
Finde den Vorteil, bevor die Masse die Story erkennt.
$AMZN
$AMZN Update
Tokenisiertes Amazon. RWA-Tape, nicht das Equity.
CMC-Print $248,91 (+0,04%).
Täglich: $226,16 Basis, $287,20 Supply ist weiterhin der Widerstand, Print $249,38.
3H: $244,30 Dip, $260,73 Wick, jetzt $249,10.
Ø Token-Preis $250,67. Premium +0,70%.
Token-Vol $13,86 Mio.
Bias: neutral, solange $244,30 im 3H hält.
Cap: $260,73
Ungültigkeit für diesen Hinweis: 3H-Schluss wieder unter $244,30.
Range statt Ausbruch. Kein Nachjagen von $260,73.
Risiko-Hinweis: Tokenisiertes Listing, nicht Amazon-Aktie. Größe bleibt klein.
Risiko managen. Keine finanzielle Beratung.
Mehr Charts & tägliche Updates → @cash_callinAI Auf X (Twitter)
💡 CashCalling Alpha
Finde den Vorteil, bevor die Masse die Story erkennt.
$AMZN
Tokenisiertes Amazon. RWA-Tape, nicht das Equity.
CMC-Print $248,91 (+0,04%).
Täglich: $226,16 Basis, $287,20 Supply ist weiterhin der Widerstand, Print $249,38.
3H: $244,30 Dip, $260,73 Wick, jetzt $249,10.
Ø Token-Preis $250,67. Premium +0,70%.
Token-Vol $13,86 Mio.
Bias: neutral, solange $244,30 im 3H hält.
Cap: $260,73
Ungültigkeit für diesen Hinweis: 3H-Schluss wieder unter $244,30.
Range statt Ausbruch. Kein Nachjagen von $260,73.
Risiko-Hinweis: Tokenisiertes Listing, nicht Amazon-Aktie. Größe bleibt klein.
Risiko managen. Keine finanzielle Beratung.
Mehr Charts & tägliche Updates → @cash_callinAI Auf X (Twitter)
💡 CashCalling Alpha
Finde den Vorteil, bevor die Masse die Story erkennt.
$AMZN
95
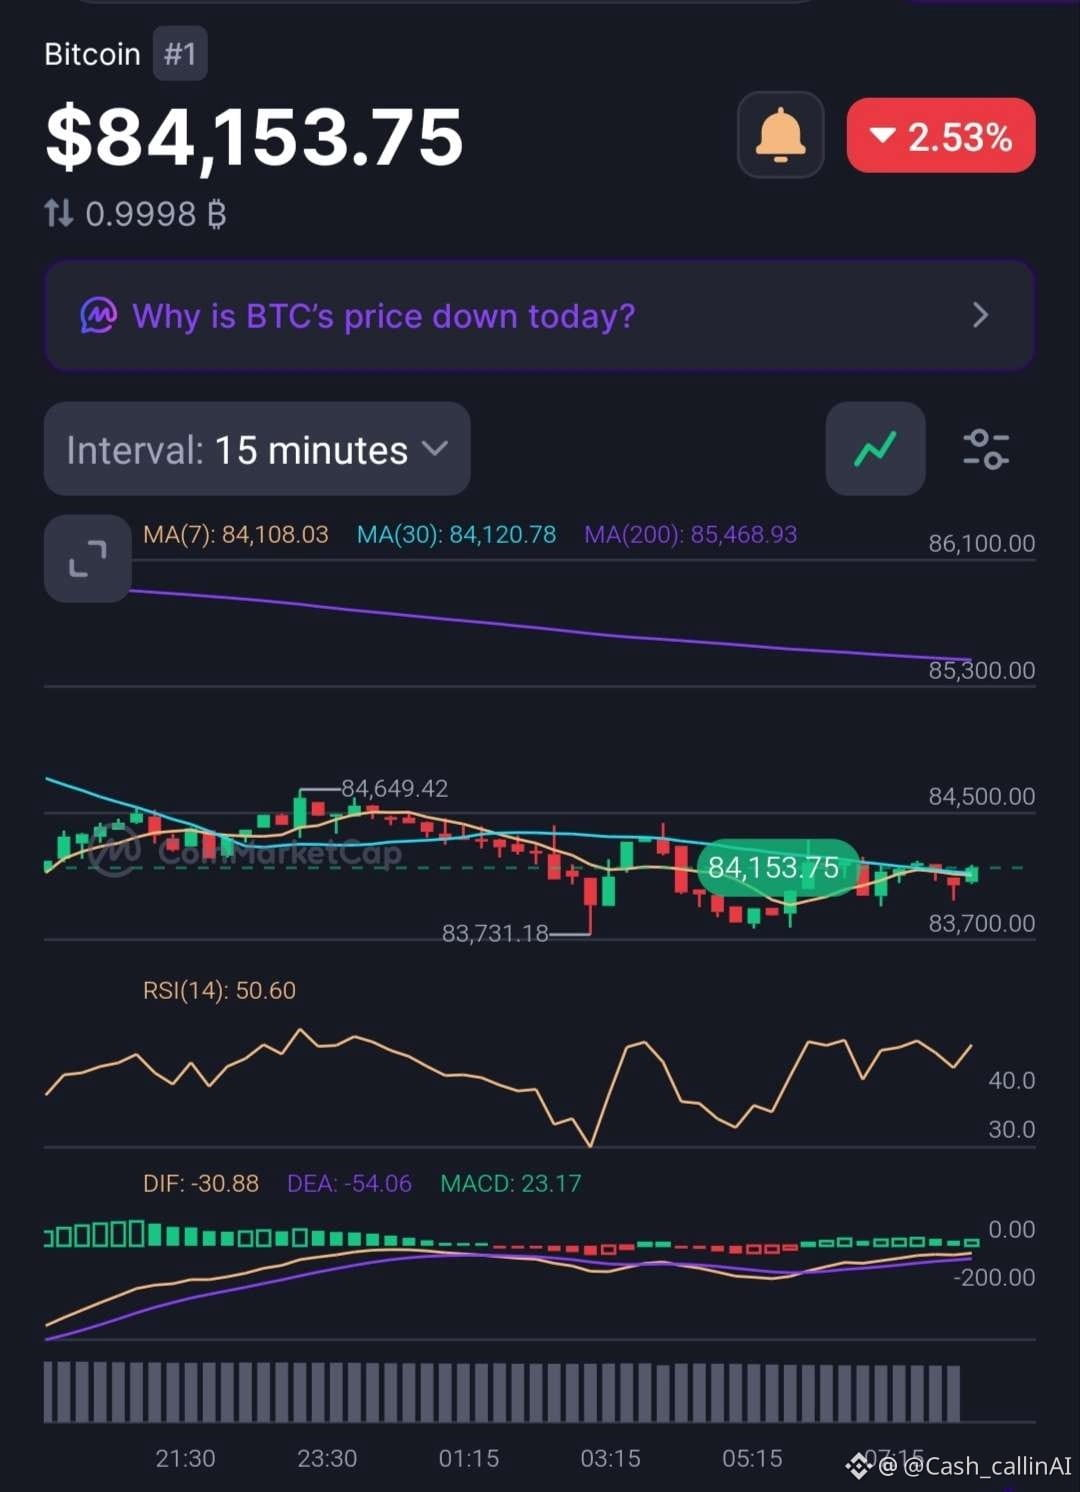
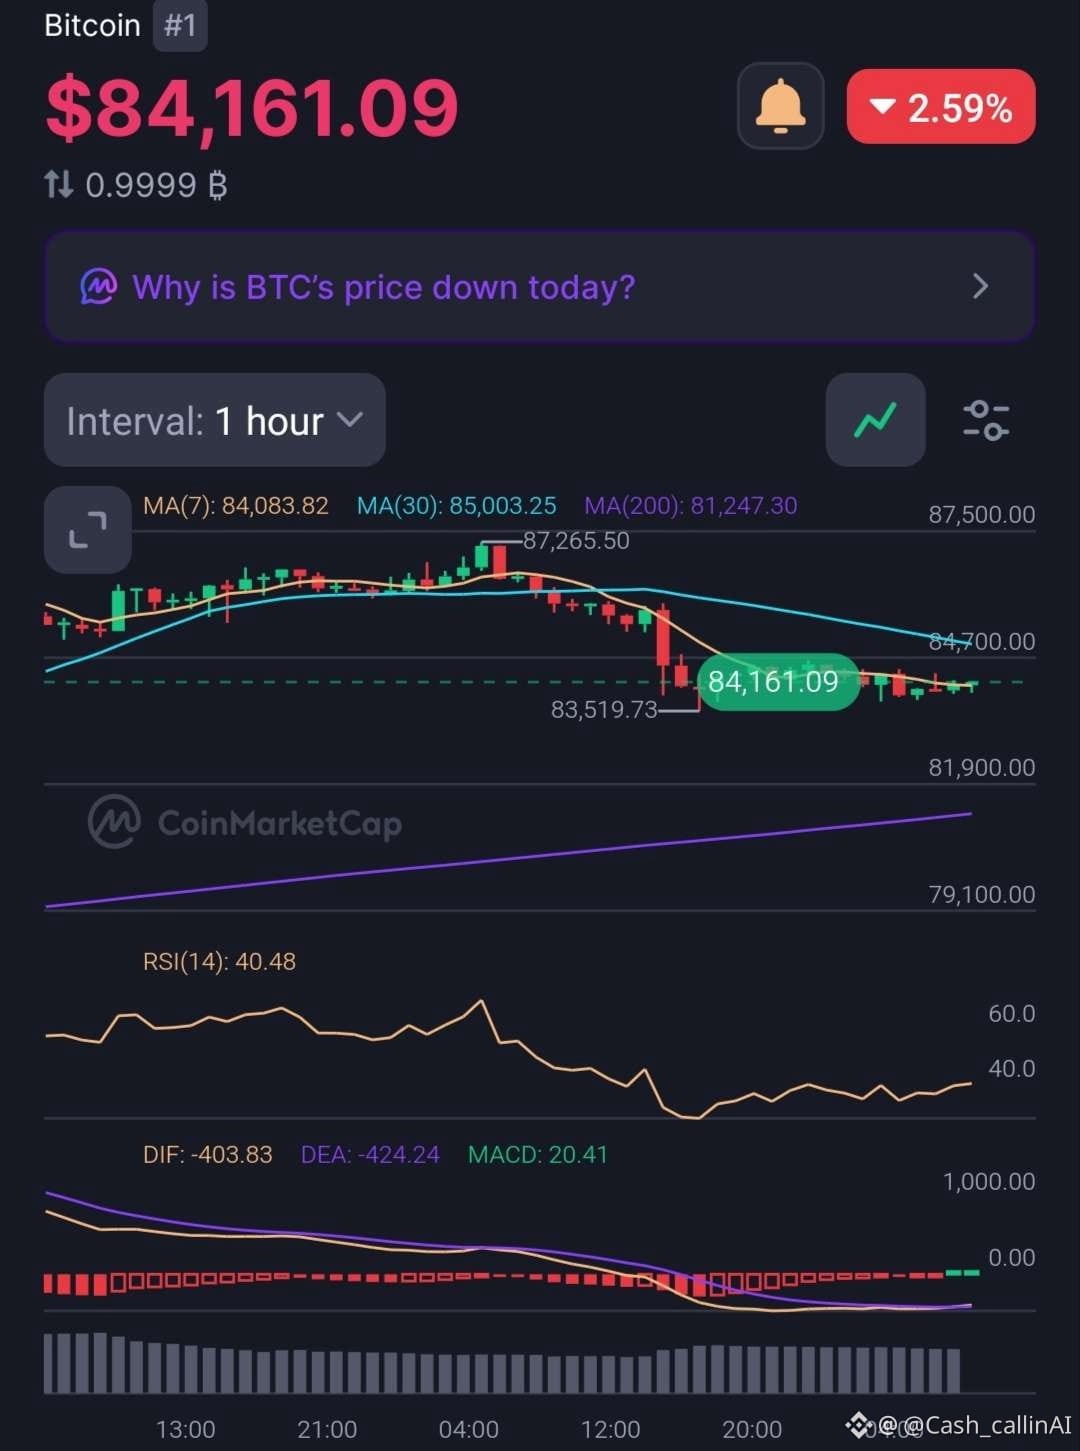
$BTC-Update
CMC meldet $84.154 (−2,5%).
15m: MA7 $84.108 / MA30 $84.120 / MA200 $85.468. RSI(14) 50,60. Hoch $84.649. Dip $83.731.
1H: MA7 $84.083 / MA30 $85.003 / MA200 $81.247. RSI(14) 40,49. Hoch $87.265. Dip $83.519.
Der Preis hat die 1H-MA30 nach dem $87.265-Wick verloren.
$83.519 ist der Hold. $85.003 ist die Cap.
Bias: neutral, solange $83.519 auf dem 1H hält.
Support: $83.519, dann $81.247
Invalidierung für diesen Hinweis: 1H-Schlusskurs wieder unter $83.519.
Kein Hinterherjagen der roten Kerze.
Risikohinweis: Risiko managen. Keine Finanzberatung.
Mehr Charts & tägliche Updates → @cash_callinAI auf X (Twitter)
👀 CashCalling-Watchlist
Nicht jede Coin verdient Aufmerksamkeit. Beobachte, was der Markt dir zeigt.
$BTC
$BTC-Update
CMC meldet $84.154 (−2,5%).
15m: MA7 $84.108 / MA30 $84.120 / MA200 $85.468. RSI(14) 50,60. Hoch $84.649. Dip $83.731.
1H: MA7 $84.083 / MA30 $85.003 / MA200 $81.247. RSI(14) 40,49. Hoch $87.265. Dip $83.519.
Der Preis hat die 1H-MA30 nach dem $87.265-Wick verloren.
$83.519 ist der Hold. $85.003 ist die Cap.
Bias: neutral, solange $83.519 auf dem 1H hält.
Support: $83.519, dann $81.247
Invalidierung für diesen Hinweis: 1H-Schlusskurs wieder unter $83.519.
Kein Hinterherjagen der roten Kerze.
Risikohinweis: Risiko managen. Keine Finanzberatung.
Mehr Charts & tägliche Updates → @cash_callinAI auf X (Twitter)
👀 CashCalling-Watchlist
Nicht jede Coin verdient Aufmerksamkeit. Beobachte, was der Markt dir zeigt.
$BTC
CMC meldet $84.154 (−2,5%).
15m: MA7 $84.108 / MA30 $84.120 / MA200 $85.468. RSI(14) 50,60. Hoch $84.649. Dip $83.731.
1H: MA7 $84.083 / MA30 $85.003 / MA200 $81.247. RSI(14) 40,49. Hoch $87.265. Dip $83.519.
Der Preis hat die 1H-MA30 nach dem $87.265-Wick verloren.
$83.519 ist der Hold. $85.003 ist die Cap.
Bias: neutral, solange $83.519 auf dem 1H hält.
Support: $83.519, dann $81.247
Invalidierung für diesen Hinweis: 1H-Schlusskurs wieder unter $83.519.
Kein Hinterherjagen der roten Kerze.
Risikohinweis: Risiko managen. Keine Finanzberatung.
Mehr Charts & tägliche Updates → @cash_callinAI auf X (Twitter)
👀 CashCalling-Watchlist
Nicht jede Coin verdient Aufmerksamkeit. Beobachte, was der Markt dir zeigt.
$BTC
59
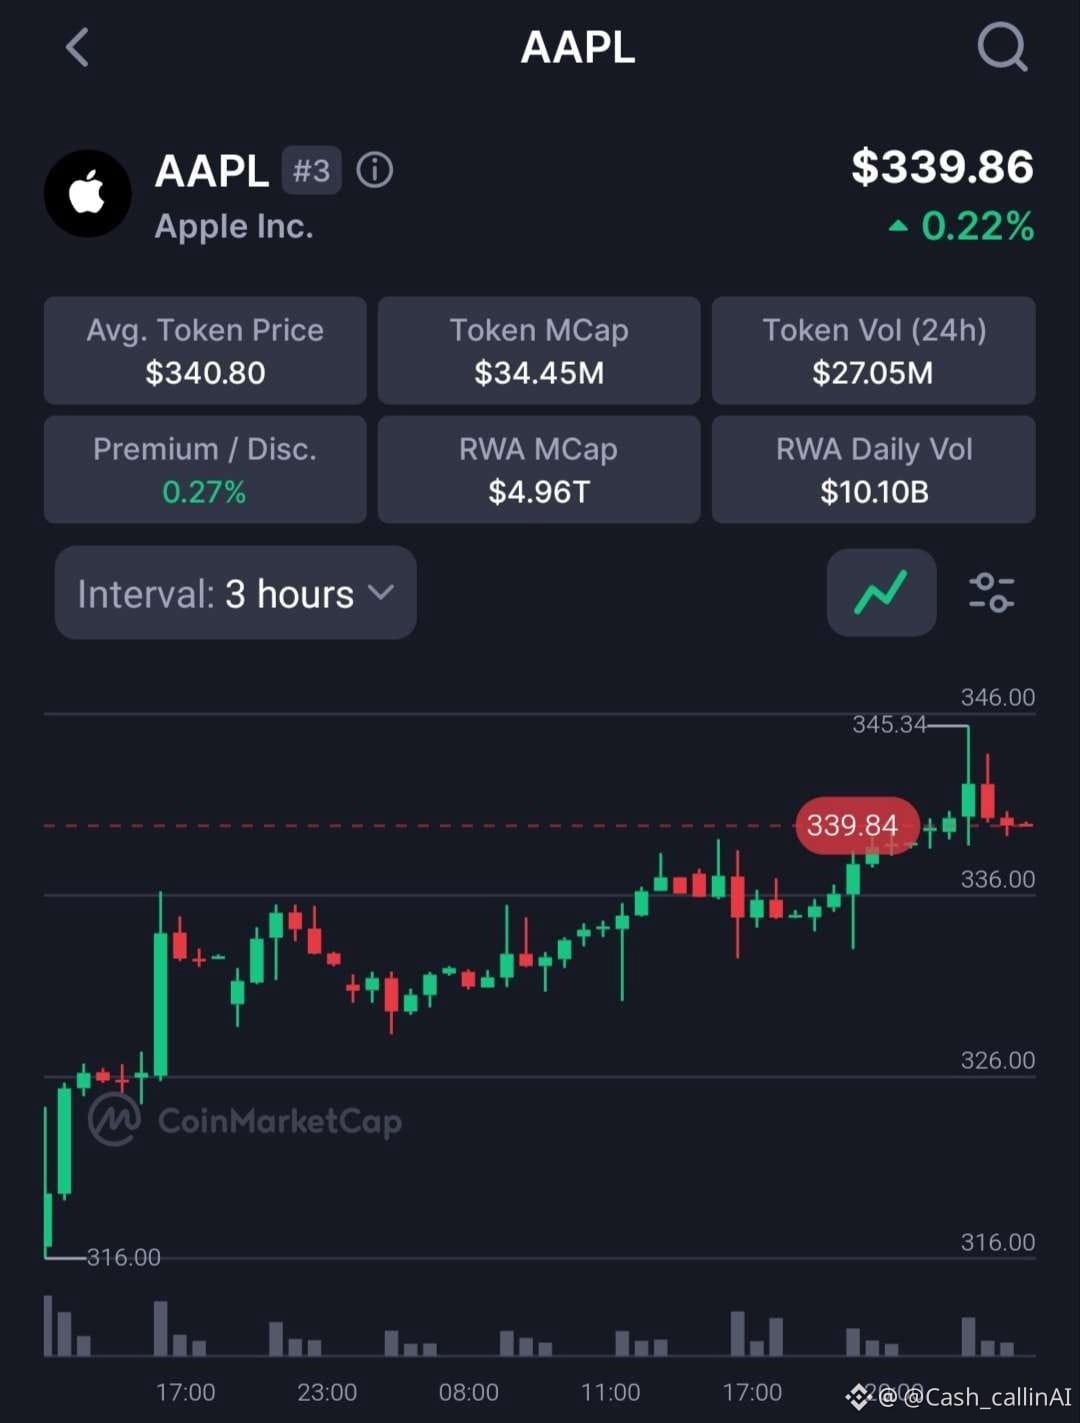
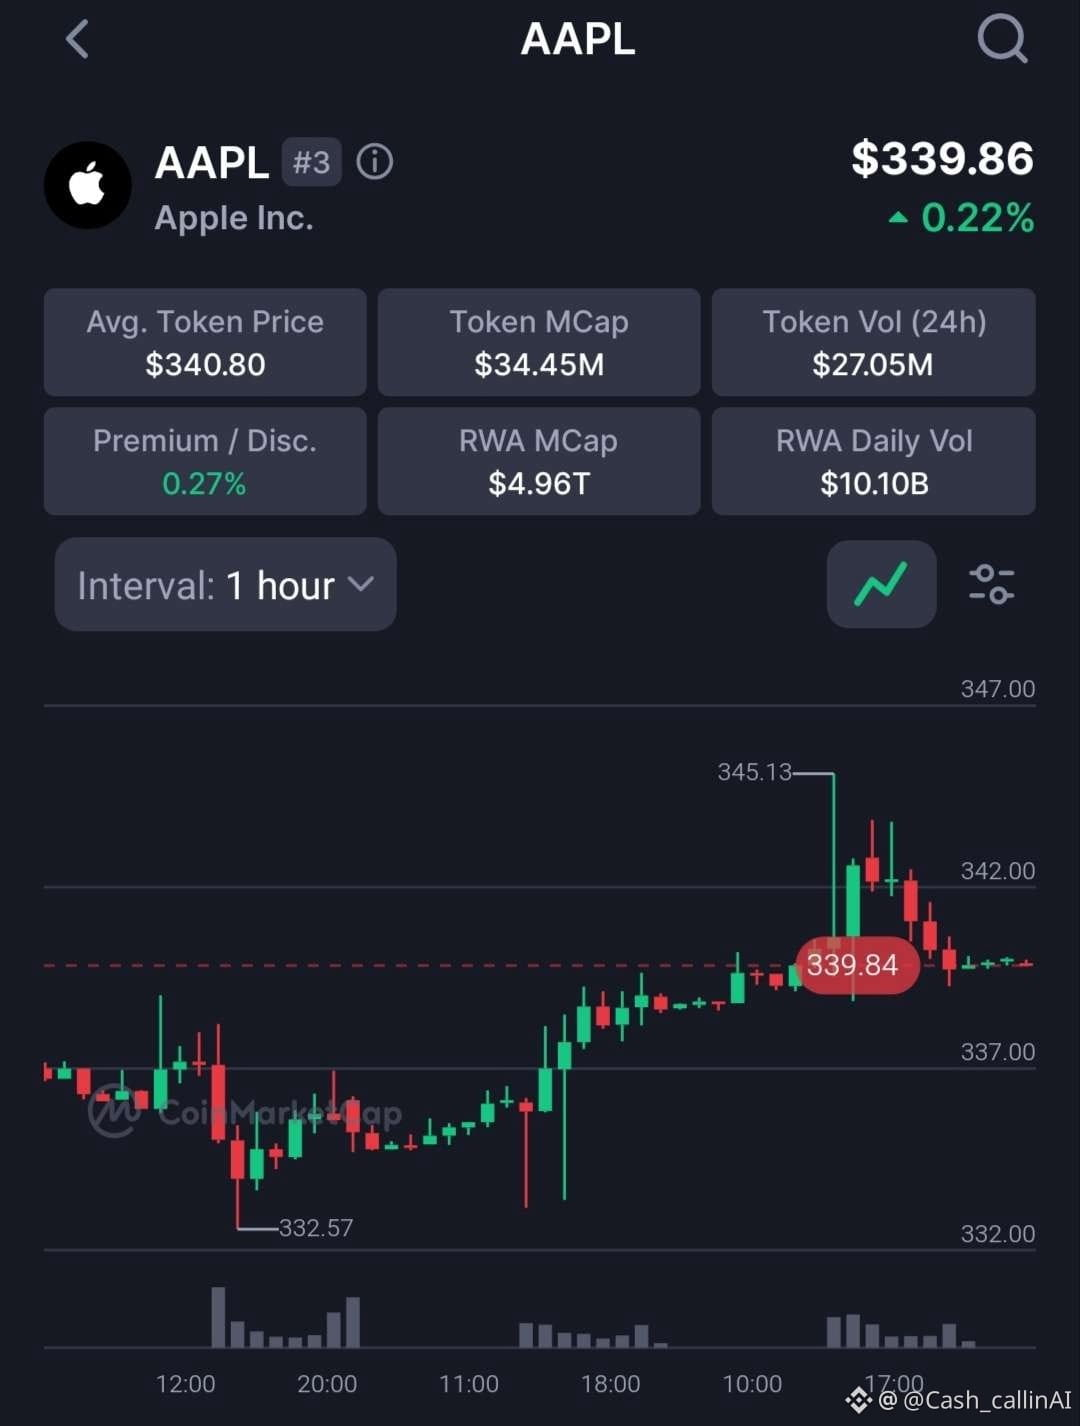
$AAPL Update
Tokenisiertes Apple. RWA-Plot, nicht das Equity.
CMC-Print $339.86 (+0.22%).
3H: $316.00 Base in eine $345.34 Wick, jetzt $339.84.
1H: $332.57 Dip, High $345.13.
Ø Token-Preis $340.80. Premium +0.27%.
Token-Volumen $27.05M.
Bias: konstruktiv, solange $332.57 im 1H hält.
Cap: $345.34
Ungültigkeit für diese Notiz: 1H-Close zurück unter $332.57.
Ruhige Verlängerung. Kein Nachjagen von $345.
Risiko-Hinweis: Tokenisierte Notierung, nicht Apple-Aktie. Größe bleibt klein.
Risiko managen. Keine Finanzberatung.
Mehr Charts & tägliche Updates → @cash_callinAI On X (Twitter)
📊 CashCalling Market Desk
Der Preis sagt dir, was passiert ist. Das Volumen sagt dir, warum.
$AAPL
$AAPL Update
Tokenisiertes Apple. RWA-Plot, nicht das Equity.
CMC-Print $339.86 (+0.22%).
3H: $316.00 Base in eine $345.34 Wick, jetzt $339.84.
1H: $332.57 Dip, High $345.13.
Ø Token-Preis $340.80. Premium +0.27%.
Token-Volumen $27.05M.
Bias: konstruktiv, solange $332.57 im 1H hält.
Cap: $345.34
Ungültigkeit für diese Notiz: 1H-Close zurück unter $332.57.
Ruhige Verlängerung. Kein Nachjagen von $345.
Risiko-Hinweis: Tokenisierte Notierung, nicht Apple-Aktie. Größe bleibt klein.
Risiko managen. Keine Finanzberatung.
Mehr Charts & tägliche Updates → @cash_callinAI On X (Twitter)
📊 CashCalling Market Desk
Der Preis sagt dir, was passiert ist. Das Volumen sagt dir, warum.
$AAPL
Tokenisiertes Apple. RWA-Plot, nicht das Equity.
CMC-Print $339.86 (+0.22%).
3H: $316.00 Base in eine $345.34 Wick, jetzt $339.84.
1H: $332.57 Dip, High $345.13.
Ø Token-Preis $340.80. Premium +0.27%.
Token-Volumen $27.05M.
Bias: konstruktiv, solange $332.57 im 1H hält.
Cap: $345.34
Ungültigkeit für diese Notiz: 1H-Close zurück unter $332.57.
Ruhige Verlängerung. Kein Nachjagen von $345.
Risiko-Hinweis: Tokenisierte Notierung, nicht Apple-Aktie. Größe bleibt klein.
Risiko managen. Keine Finanzberatung.
Mehr Charts & tägliche Updates → @cash_callinAI On X (Twitter)
📊 CashCalling Market Desk
Der Preis sagt dir, was passiert ist. Das Volumen sagt dir, warum.
$AAPL
77
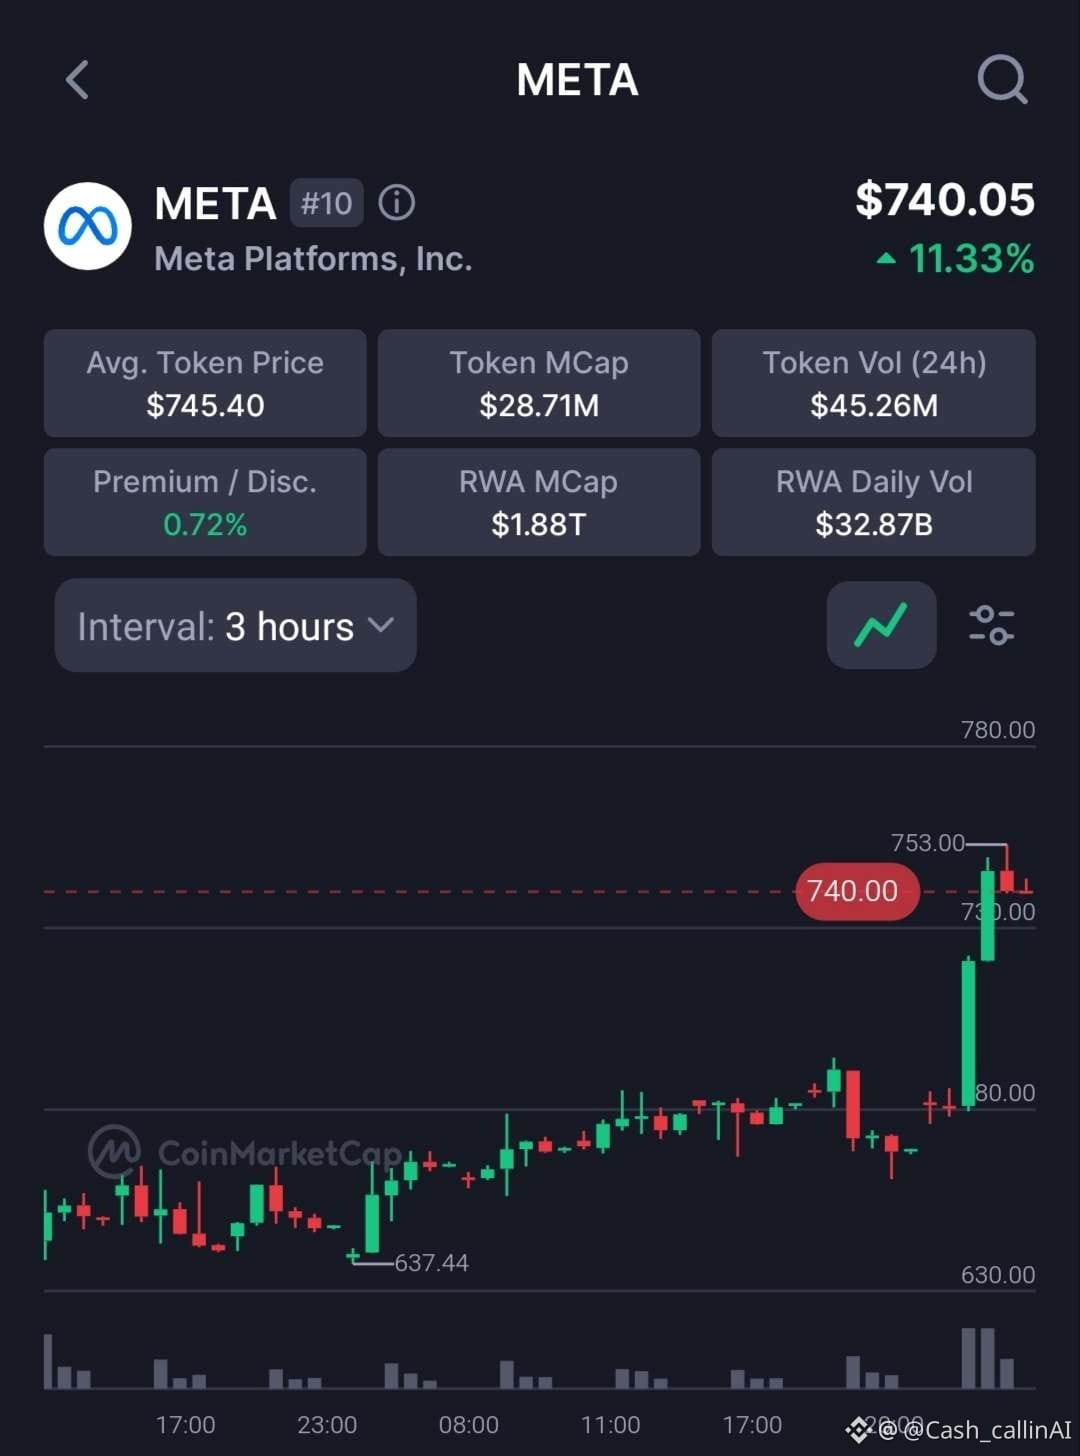
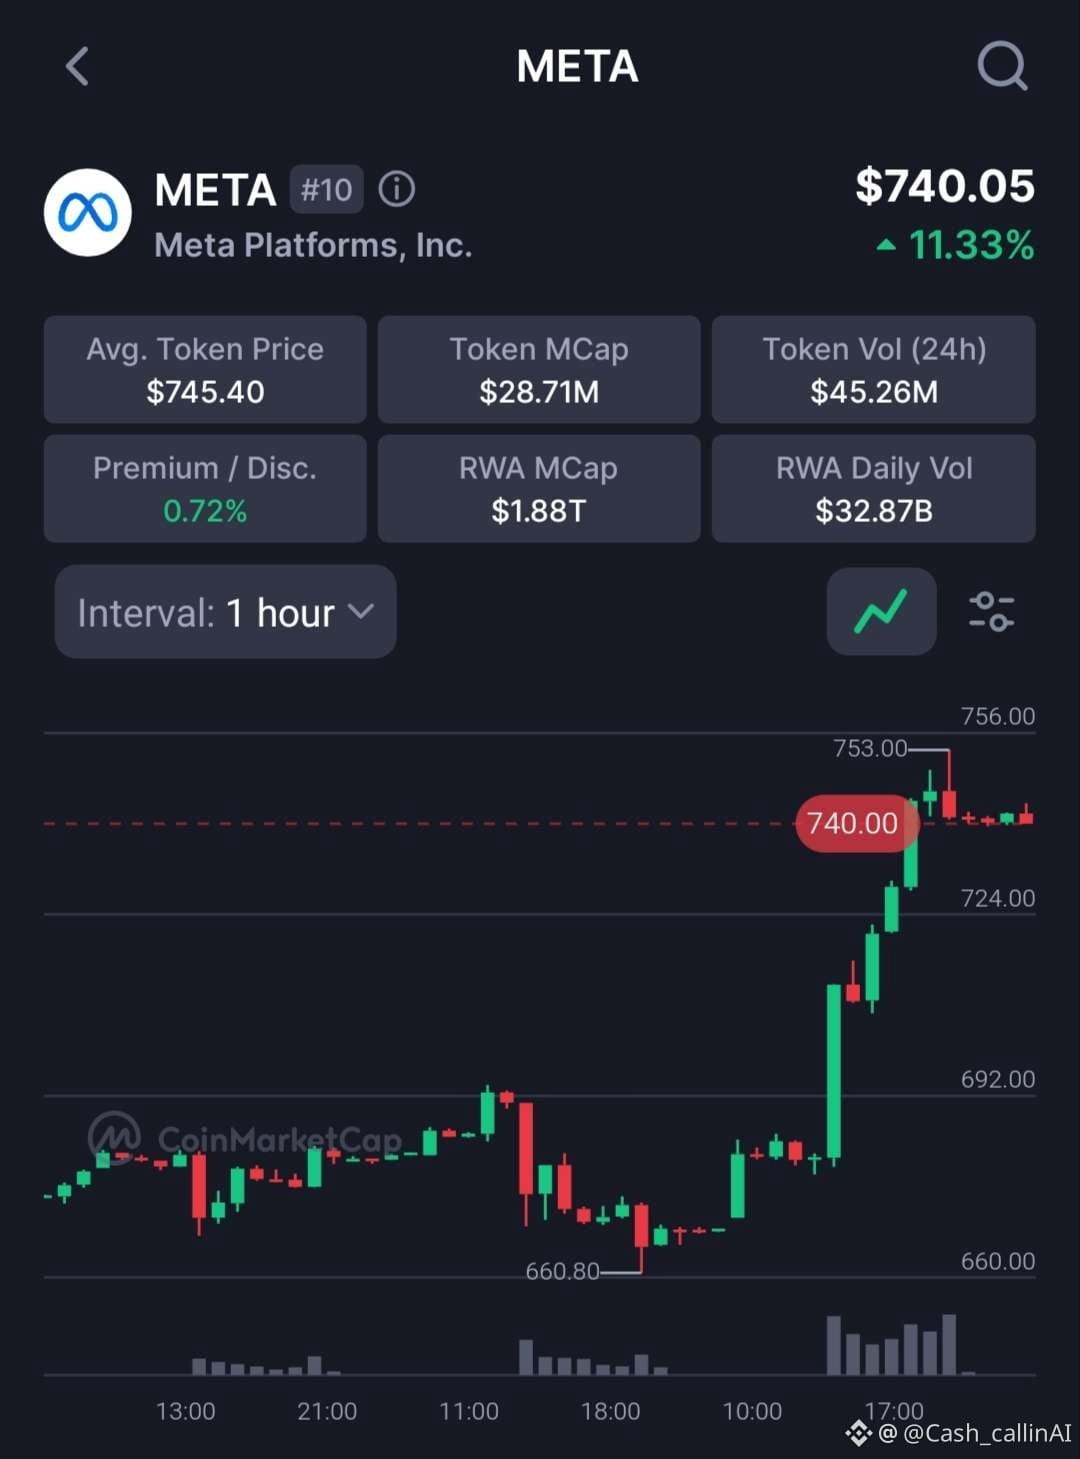
$META-Update
Meta tokenisiert. RWA-Tape, nicht das Equity.
CMC-Print $740.05 (+11.33%).
3H: von $637.44 gestartet in einen $753-Wick, jetzt $740.
1H: $660.80 Basis, gleiches $753 Hoch.
Ø Token-Preis $745.40. Premium +0.72%.
Token-Volumen $45.26M.
Bias: konstruktiv nur, wenn $724–$740 hält.
Cap: $753
Ungültigkeit für diese Notiz: 1H Close wieder unter $660.80.
Das ist eine +11%-Extension. Kein Hinterherjagen des Wicks.
Risikohinweis: Tokenisierte Notierung, nicht Meta-Aktie. Größe bleibt klein.
Risiko managen. Keine Finanzberatung.
Mehr Charts & tägliche Updates → @cash_callinAI auf X (Twitter)
🔥 CashCalling Signal
Diese Ebene ist wichtig.
$META
$META-Update
Meta tokenisiert. RWA-Tape, nicht das Equity.
CMC-Print $740.05 (+11.33%).
3H: von $637.44 gestartet in einen $753-Wick, jetzt $740.
1H: $660.80 Basis, gleiches $753 Hoch.
Ø Token-Preis $745.40. Premium +0.72%.
Token-Volumen $45.26M.
Bias: konstruktiv nur, wenn $724–$740 hält.
Cap: $753
Ungültigkeit für diese Notiz: 1H Close wieder unter $660.80.
Das ist eine +11%-Extension. Kein Hinterherjagen des Wicks.
Risikohinweis: Tokenisierte Notierung, nicht Meta-Aktie. Größe bleibt klein.
Risiko managen. Keine Finanzberatung.
Mehr Charts & tägliche Updates → @cash_callinAI auf X (Twitter)
🔥 CashCalling Signal
Diese Ebene ist wichtig.
$META
Meta tokenisiert. RWA-Tape, nicht das Equity.
CMC-Print $740.05 (+11.33%).
3H: von $637.44 gestartet in einen $753-Wick, jetzt $740.
1H: $660.80 Basis, gleiches $753 Hoch.
Ø Token-Preis $745.40. Premium +0.72%.
Token-Volumen $45.26M.
Bias: konstruktiv nur, wenn $724–$740 hält.
Cap: $753
Ungültigkeit für diese Notiz: 1H Close wieder unter $660.80.
Das ist eine +11%-Extension. Kein Hinterherjagen des Wicks.
Risikohinweis: Tokenisierte Notierung, nicht Meta-Aktie. Größe bleibt klein.
Risiko managen. Keine Finanzberatung.
Mehr Charts & tägliche Updates → @cash_callinAI auf X (Twitter)
🔥 CashCalling Signal
Diese Ebene ist wichtig.
$META
82
$BTC-Update
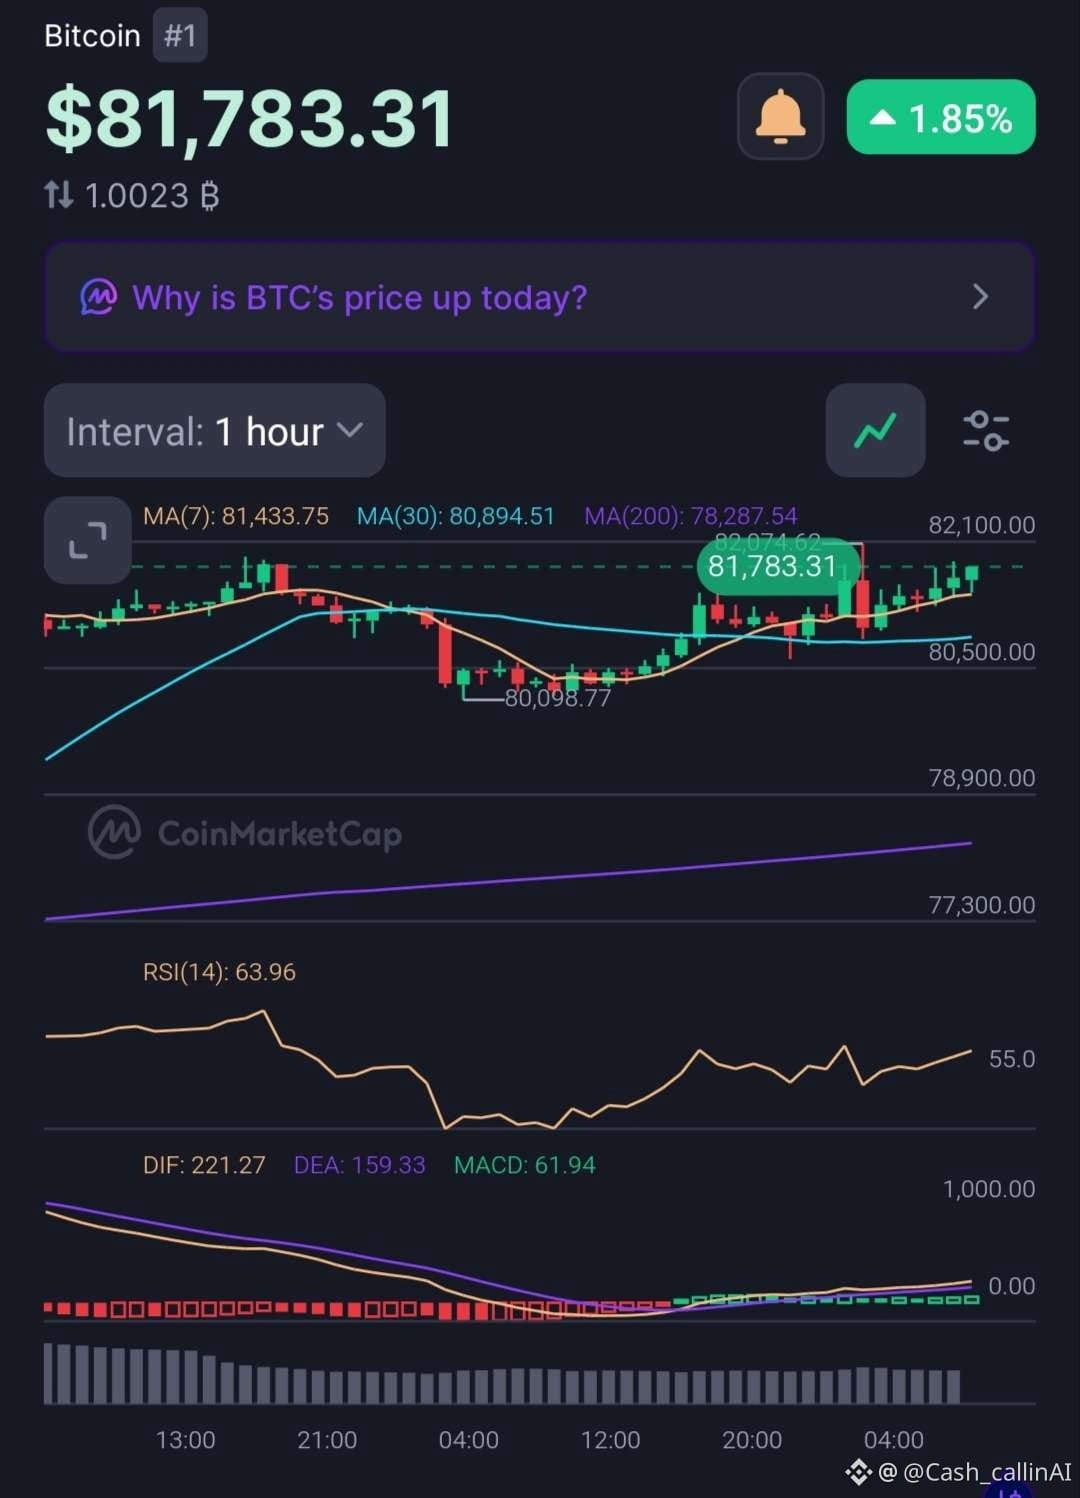
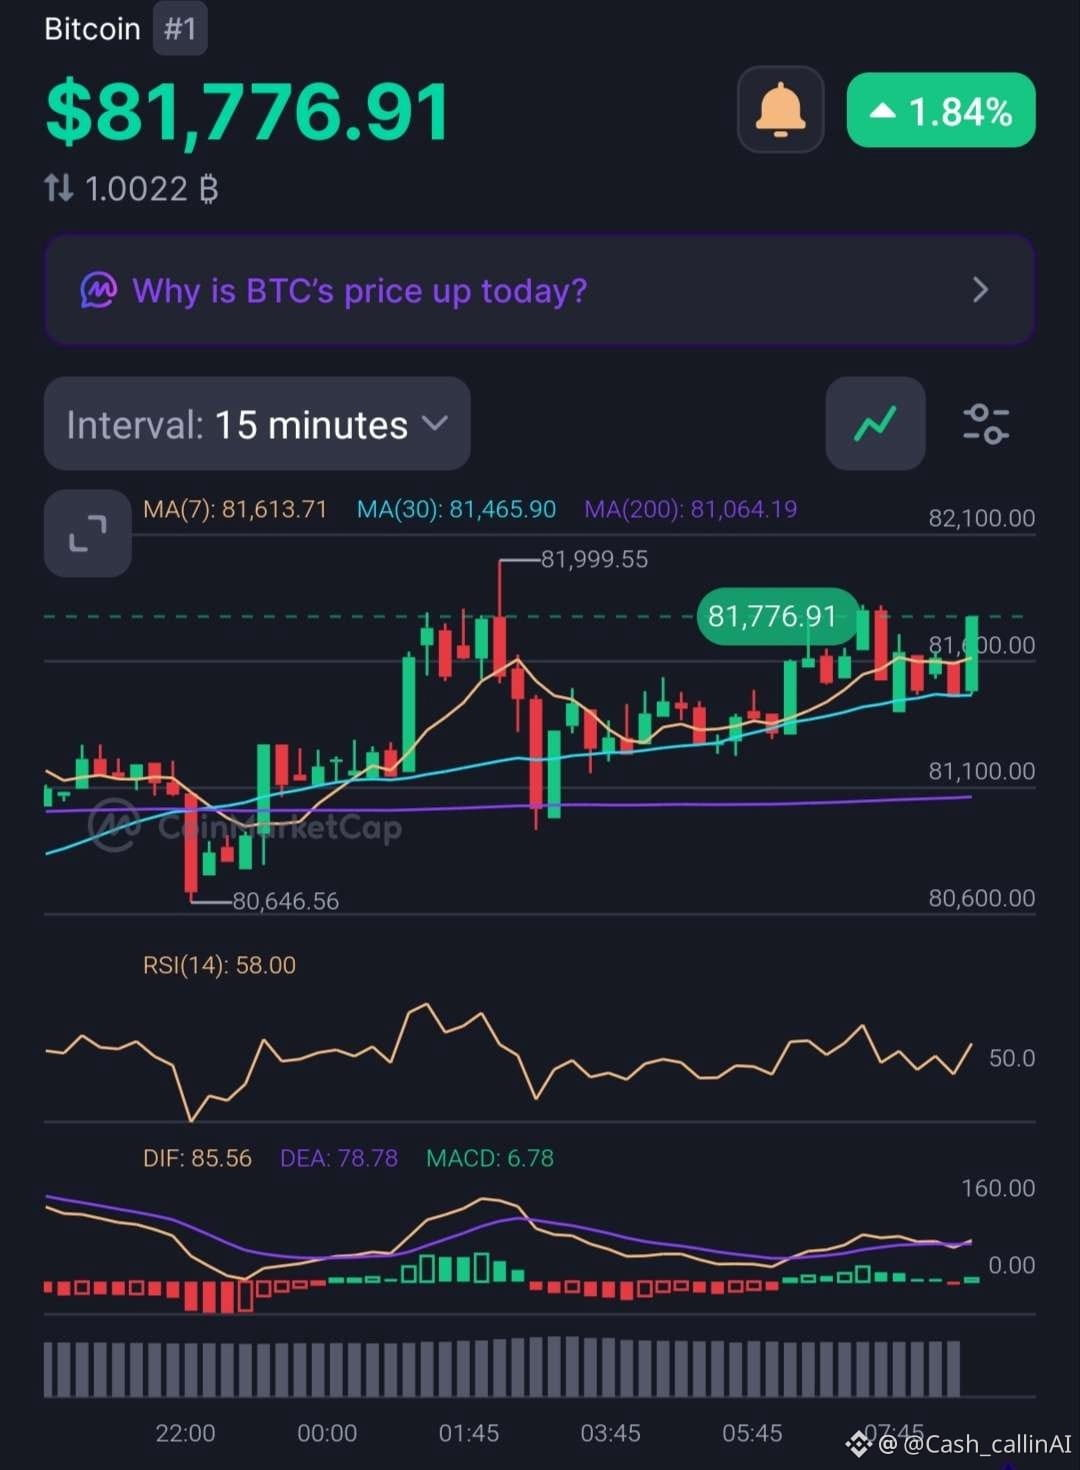
CMC meldet $81.783 (+1,85%).
15 Min: MA7 $81.613 / MA30 $81.465 / MA200 $81.064. RSI(14) 58. Hoch $81.999. Dip $80.646.
1 Std: MA7 $81.433 / MA30 $80.894 / MA200 $78.287. RSI(14) 63,96. Tief $80.098. Hoch $82.074.
Der Kurs hat nach dem Flush bei $80.098 den 1H-MA-Stack zurückerobert.
$82.074 ist die Obergrenze, nicht der Einstieg.
Bias: konstruktiv, solange $80.894 auf dem 1H hält.
Support: $80.894 und dann $80.098
Ungültigkeit für diesen Hinweis: 1H-Schlusskurs wieder unter $80.894.
Kein Hinterherlaufen bei $82.100.
Risikohinweis: Risiko managen. Keine Finanzberatung.
Weitere Charts & tägliche Updates → @cash_callinAI auf X (Twitter)
💡 CashCalling Alpha
Finde den Vorteil, bevor die Masse die Story findet.
$BTC
$BTC-Update
CMC meldet $81.783 (+1,85%).
15 Min: MA7 $81.613 / MA30 $81.465 / MA200 $81.064. RSI(14) 58. Hoch $81.999. Dip $80.646.
1 Std: MA7 $81.433 / MA30 $80.894 / MA200 $78.287. RSI(14) 63,96. Tief $80.098. Hoch $82.074.
Der Kurs hat nach dem Flush bei $80.098 den 1H-MA-Stack zurückerobert.
$82.074 ist die Obergrenze, nicht der Einstieg.
Bias: konstruktiv, solange $80.894 auf dem 1H hält.
Support: $80.894 und dann $80.098
Ungültigkeit für diesen Hinweis: 1H-Schlusskurs wieder unter $80.894.
Kein Hinterherlaufen bei $82.100.
Risikohinweis: Risiko managen. Keine Finanzberatung.
Weitere Charts & tägliche Updates → @cash_callinAI auf X (Twitter)
💡 CashCalling Alpha
Finde den Vorteil, bevor die Masse die Story findet.
$BTC
CMC meldet $81.783 (+1,85%).
15 Min: MA7 $81.613 / MA30 $81.465 / MA200 $81.064. RSI(14) 58. Hoch $81.999. Dip $80.646.
1 Std: MA7 $81.433 / MA30 $80.894 / MA200 $78.287. RSI(14) 63,96. Tief $80.098. Hoch $82.074.
Der Kurs hat nach dem Flush bei $80.098 den 1H-MA-Stack zurückerobert.
$82.074 ist die Obergrenze, nicht der Einstieg.
Bias: konstruktiv, solange $80.894 auf dem 1H hält.
Support: $80.894 und dann $80.098
Ungültigkeit für diesen Hinweis: 1H-Schlusskurs wieder unter $80.894.
Kein Hinterherlaufen bei $82.100.
Risikohinweis: Risiko managen. Keine Finanzberatung.
Weitere Charts & tägliche Updates → @cash_callinAI auf X (Twitter)
💡 CashCalling Alpha
Finde den Vorteil, bevor die Masse die Story findet.
$BTC
58
$NVDA-Update
Tokenisiertes Nvidia. RWA-Tape, nicht das Eigenkapital.
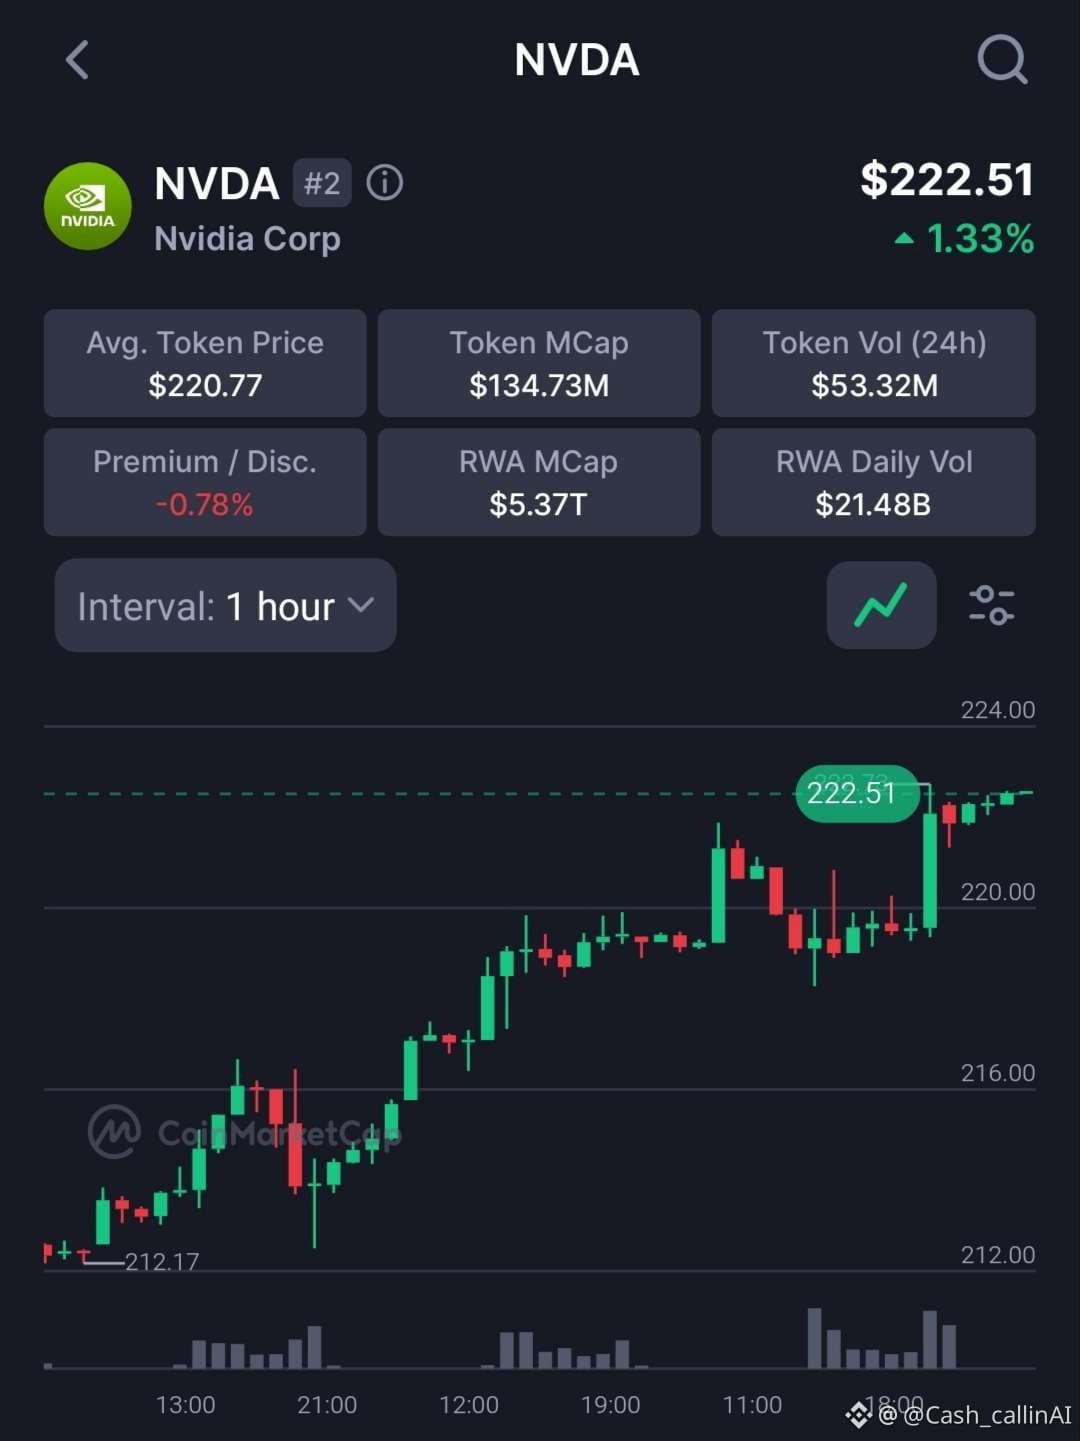
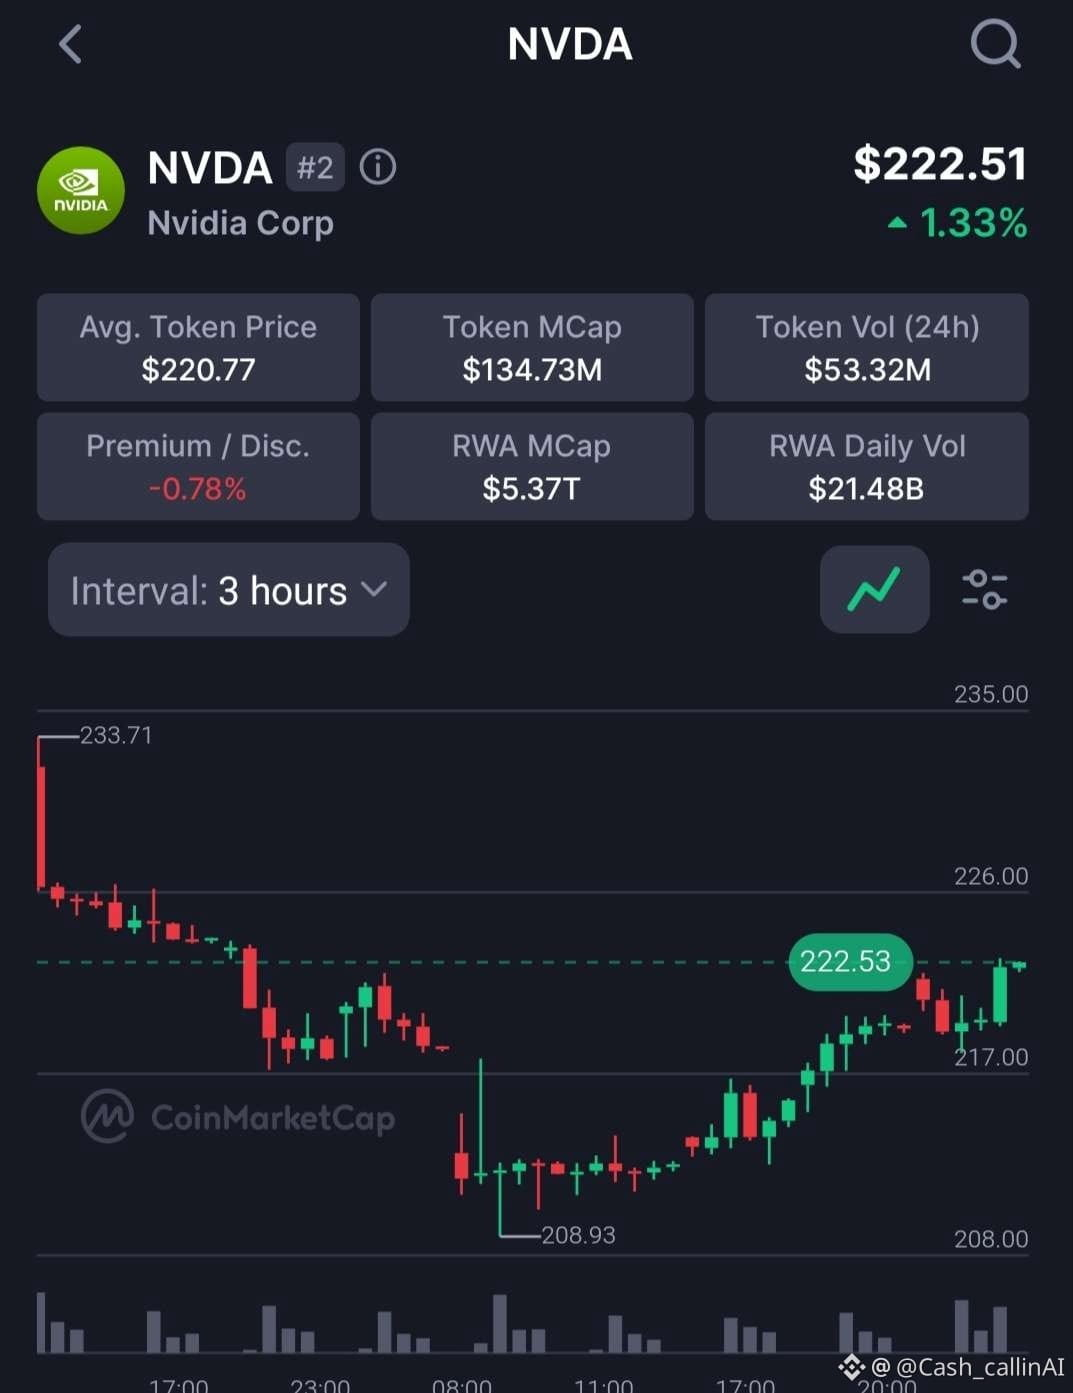
CMC-Print $222,51 (+1,33%).
3H verkauft $233,71 ab auf $208,93, dann zurückgeklettert in die $222,53 Mid-Line.
1H-Boden nach dem Bounce: $212,17.
Durchschnittlicher Token-Preis $220,77. Premium −0,78% — leichter Abschlag, keine Squeeze.
Token-Volumen $53,32M.
Bias: konstruktiv, solange $212,17 auf dem 1H hält.
Nahe Obergrenze: $226 – $228
Ferne Obergrenze: $233,71
Ungültigkeit für diese Notiz: 1H-Schluss wieder unter $212,17.
Kein Long in die $233,71-Wick, die schon gescheitert ist.
Lass $212 zuerst entscheiden.
Risiko-Hinweis: Das ist ein tokenisiertes Listing, nicht Nvidia-Aktie. Größe bleibt klein.
Risikomanagement. Keine Finanzberatung.
Mehr Charts & tägliche Updates → @cash_callinAI On X (Twitter)
👀 CashCalling-Beobachtungsliste
Nicht jede Coin verdient Aufmerksamkeit. Schau dir an, was der Markt dir zeigt.
$NVDA
$NVDA-Update
Tokenisiertes Nvidia. RWA-Tape, nicht das Eigenkapital.
CMC-Print $222,51 (+1,33%).
3H verkauft $233,71 ab auf $208,93, dann zurückgeklettert in die $222,53 Mid-Line.
1H-Boden nach dem Bounce: $212,17.
Durchschnittlicher Token-Preis $220,77. Premium −0,78% — leichter Abschlag, keine Squeeze.
Token-Volumen $53,32M.
Bias: konstruktiv, solange $212,17 auf dem 1H hält.
Nahe Obergrenze: $226 – $228
Ferne Obergrenze: $233,71
Ungültigkeit für diese Notiz: 1H-Schluss wieder unter $212,17.
Kein Long in die $233,71-Wick, die schon gescheitert ist.
Lass $212 zuerst entscheiden.
Risiko-Hinweis: Das ist ein tokenisiertes Listing, nicht Nvidia-Aktie. Größe bleibt klein.
Risikomanagement. Keine Finanzberatung.
Mehr Charts & tägliche Updates → @cash_callinAI On X (Twitter)
👀 CashCalling-Beobachtungsliste
Nicht jede Coin verdient Aufmerksamkeit. Schau dir an, was der Markt dir zeigt.
$NVDA
Tokenisiertes Nvidia. RWA-Tape, nicht das Eigenkapital.
CMC-Print $222,51 (+1,33%).
3H verkauft $233,71 ab auf $208,93, dann zurückgeklettert in die $222,53 Mid-Line.
1H-Boden nach dem Bounce: $212,17.
Durchschnittlicher Token-Preis $220,77. Premium −0,78% — leichter Abschlag, keine Squeeze.
Token-Volumen $53,32M.
Bias: konstruktiv, solange $212,17 auf dem 1H hält.
Nahe Obergrenze: $226 – $228
Ferne Obergrenze: $233,71
Ungültigkeit für diese Notiz: 1H-Schluss wieder unter $212,17.
Kein Long in die $233,71-Wick, die schon gescheitert ist.
Lass $212 zuerst entscheiden.
Risiko-Hinweis: Das ist ein tokenisiertes Listing, nicht Nvidia-Aktie. Größe bleibt klein.
Risikomanagement. Keine Finanzberatung.
Mehr Charts & tägliche Updates → @cash_callinAI On X (Twitter)
👀 CashCalling-Beobachtungsliste
Nicht jede Coin verdient Aufmerksamkeit. Schau dir an, was der Markt dir zeigt.
$NVDA
73
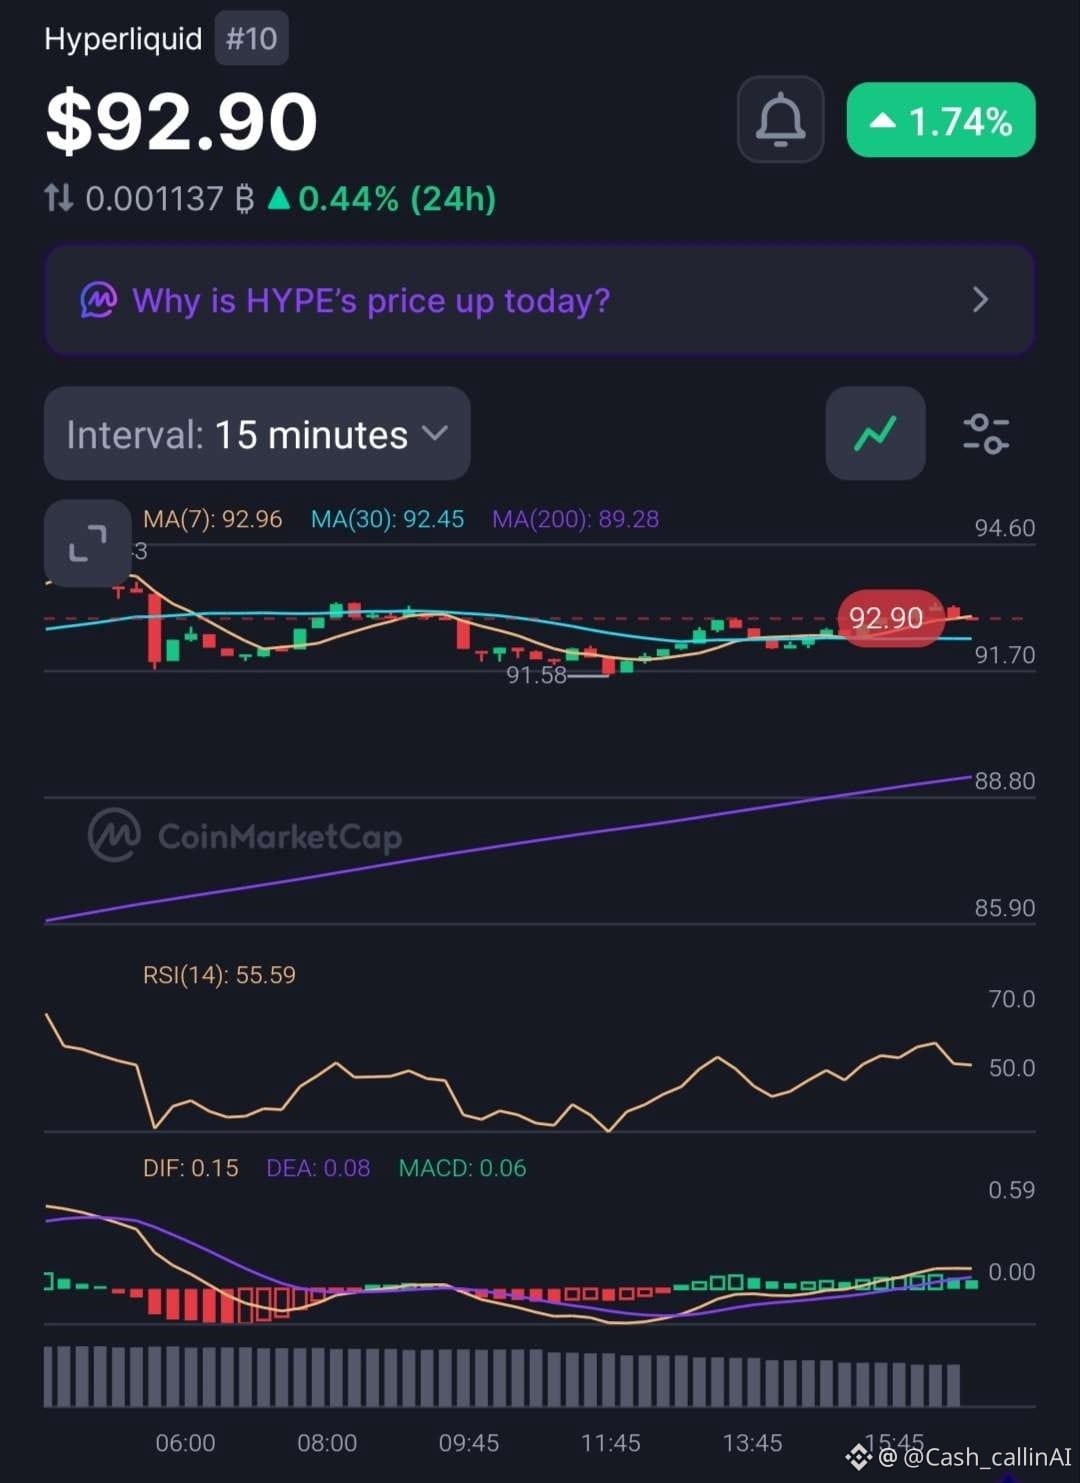
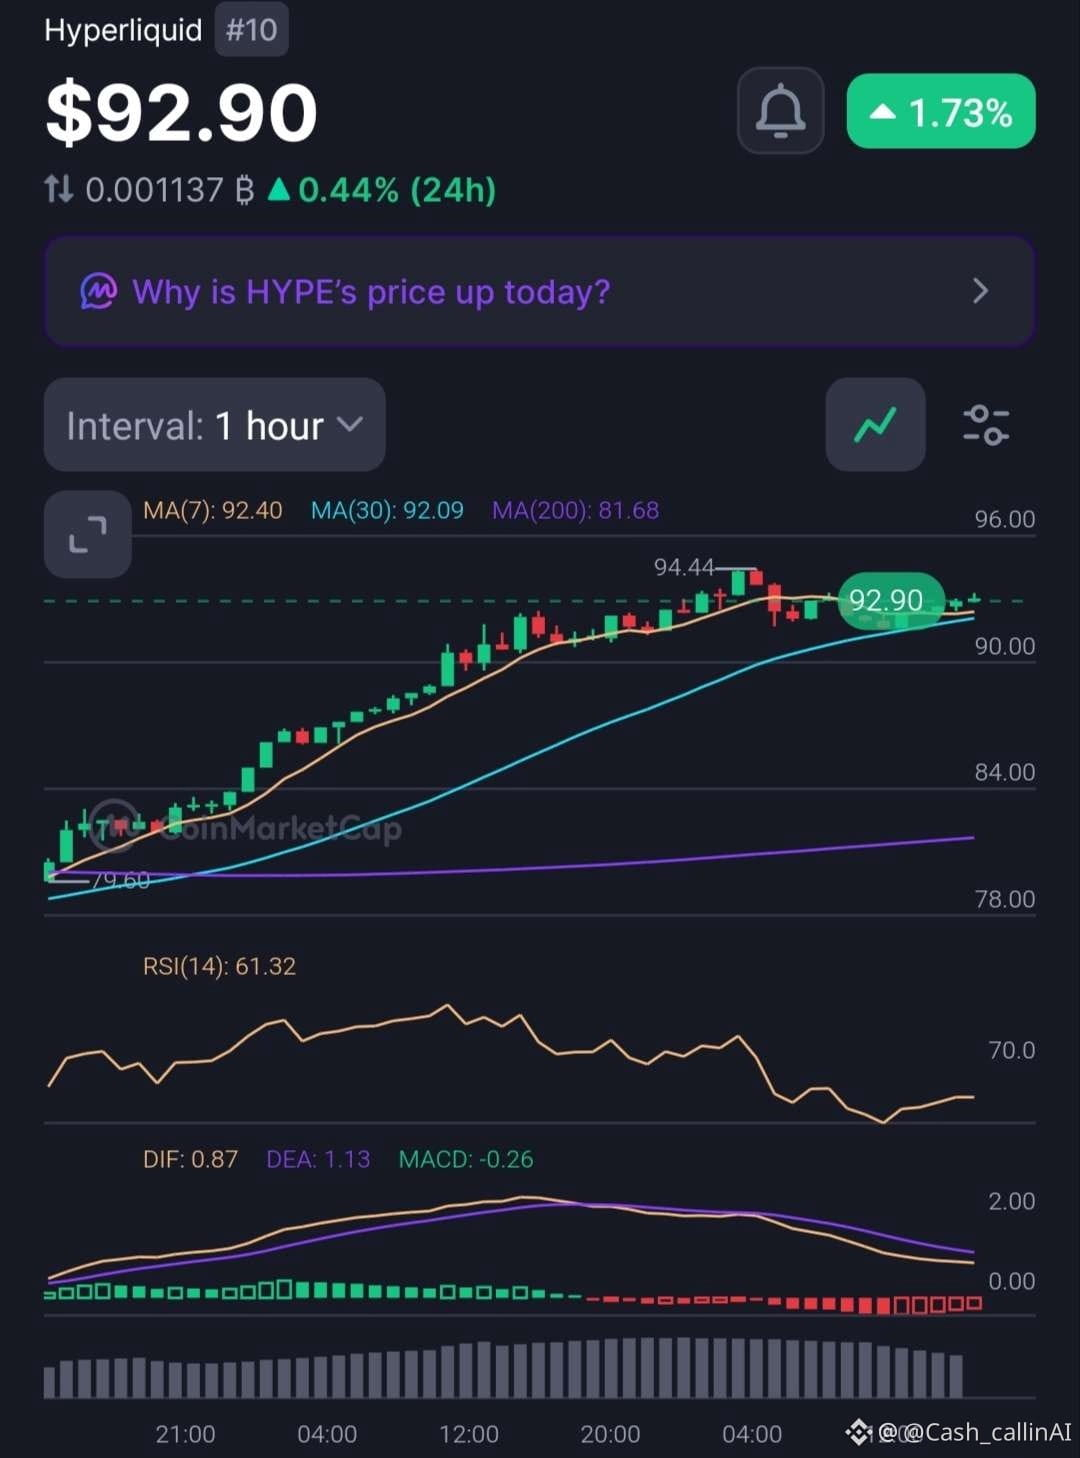
$HYPE Update
CMC-Druck $92.90 (+1,74%).
15m: MA7 $92.96 / MA30 $92.45 / MA200 $89.28. RSI(14) 55,59. Session-Dip $91.58.
1H: MA7 $92.40 / MA30 $92.09 / MA200 $81.68. RSI(14) 61,32. Hoch $94.44.
Letzte Desk-Notierungen: $88.66 dann $91.47.
Der Kurs verdaut sich unter $94.44, bricht ihn nicht.
Bias: konstruktiv, solange $92.09 auf 1H hält.
Support-Stack: $92.09 dann $91.58 dann $89.28.
Ungültigkeit für diese Notiz: 1H-Close wieder unter $91.58.
Kein Hinterherjagen der $94.44-Wick. Erst MA7 entscheiden lassen.
Risiko-Hinweis: Risiko managen. Keine Finanzberatung.
Mehr Charts & tägliche Updates → @cash_callinAI auf X (Twitter)
—
📊 CashCalling Market Desk
Der Kurs sagt dir, was passiert ist. Das Volumen sagt dir, warum.
$HYPE
$HYPE Update
CMC-Druck $92.90 (+1,74%).
15m: MA7 $92.96 / MA30 $92.45 / MA200 $89.28. RSI(14) 55,59. Session-Dip $91.58.
1H: MA7 $92.40 / MA30 $92.09 / MA200 $81.68. RSI(14) 61,32. Hoch $94.44.
Letzte Desk-Notierungen: $88.66 dann $91.47.
Der Kurs verdaut sich unter $94.44, bricht ihn nicht.
Bias: konstruktiv, solange $92.09 auf 1H hält.
Support-Stack: $92.09 dann $91.58 dann $89.28.
Ungültigkeit für diese Notiz: 1H-Close wieder unter $91.58.
Kein Hinterherjagen der $94.44-Wick. Erst MA7 entscheiden lassen.
Risiko-Hinweis: Risiko managen. Keine Finanzberatung.
Mehr Charts & tägliche Updates → @cash_callinAI auf X (Twitter)
—
📊 CashCalling Market Desk
Der Kurs sagt dir, was passiert ist. Das Volumen sagt dir, warum.
$HYPE
CMC-Druck $92.90 (+1,74%).
15m: MA7 $92.96 / MA30 $92.45 / MA200 $89.28. RSI(14) 55,59. Session-Dip $91.58.
1H: MA7 $92.40 / MA30 $92.09 / MA200 $81.68. RSI(14) 61,32. Hoch $94.44.
Letzte Desk-Notierungen: $88.66 dann $91.47.
Der Kurs verdaut sich unter $94.44, bricht ihn nicht.
Bias: konstruktiv, solange $92.09 auf 1H hält.
Support-Stack: $92.09 dann $91.58 dann $89.28.
Ungültigkeit für diese Notiz: 1H-Close wieder unter $91.58.
Kein Hinterherjagen der $94.44-Wick. Erst MA7 entscheiden lassen.
Risiko-Hinweis: Risiko managen. Keine Finanzberatung.
Mehr Charts & tägliche Updates → @cash_callinAI auf X (Twitter)
—
📊 CashCalling Market Desk
Der Kurs sagt dir, was passiert ist. Das Volumen sagt dir, warum.
$HYPE
47
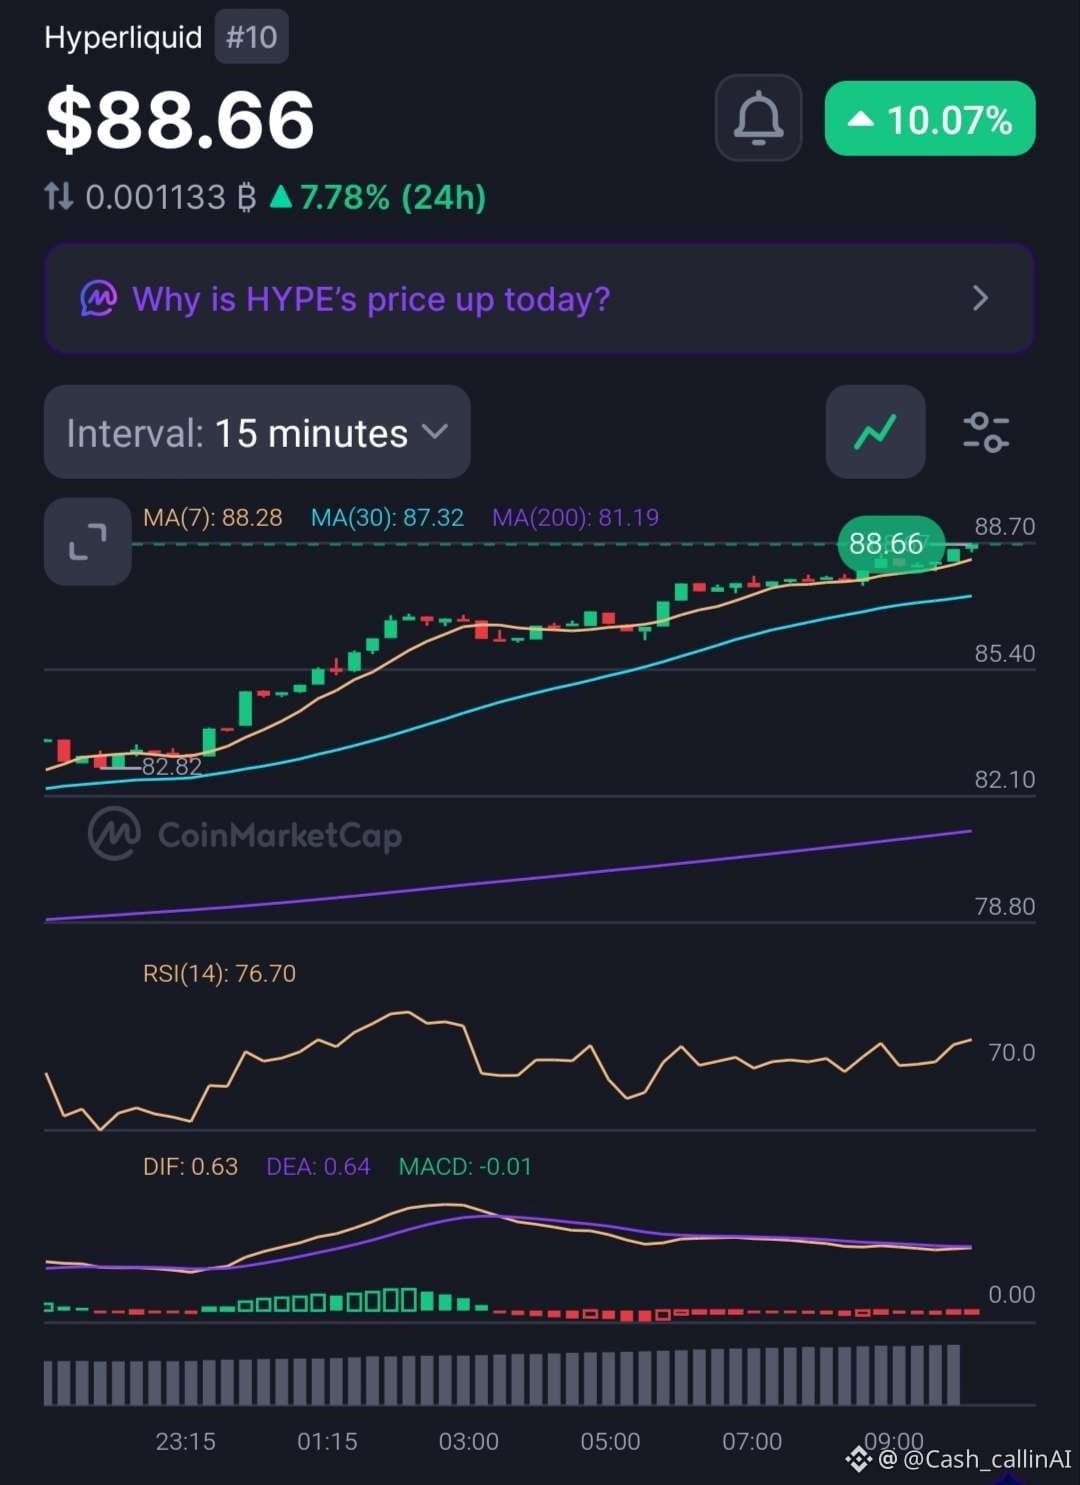
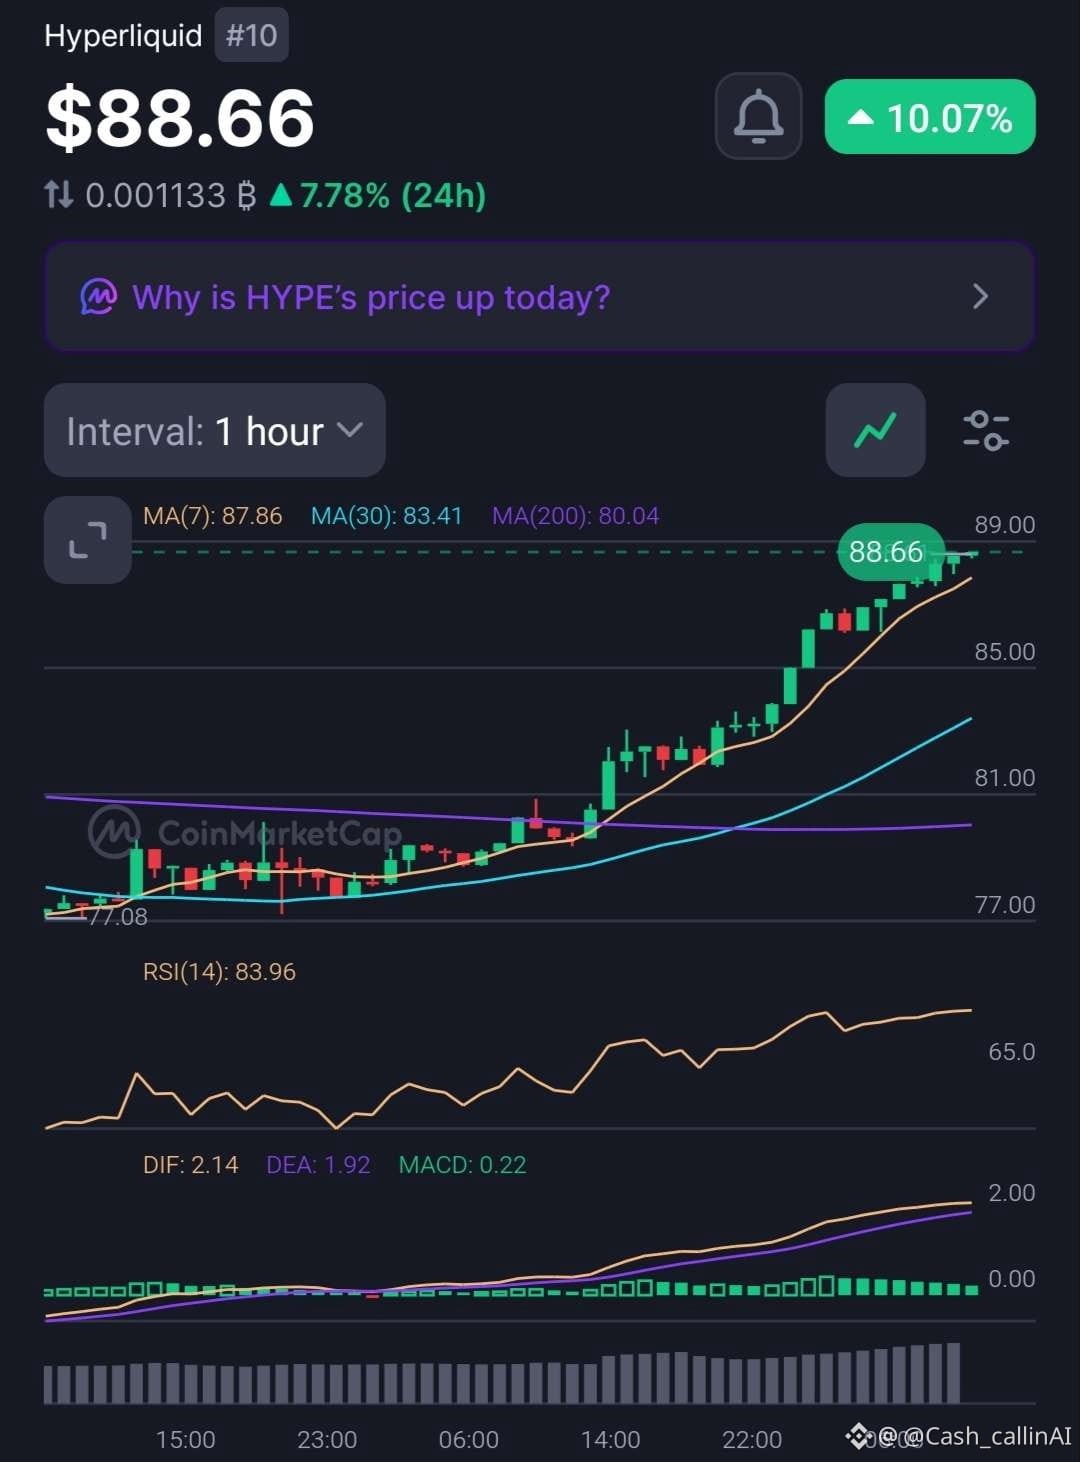
$HYPE Update
CMC druckt $88.66 (+10.07%).
15m: MA7 $88.28 / MA30 $87.32 / MA200 $81.19. RSI(14) 76.70.
1H: MA7 $87.86 / MA30 $83.41 / MA200 $80.04. RSI(14) 83.96.
1H-Tief vom Run: $77.08.
Der Preis wird in $88.70 gepresst.
Die Struktur ist nach oben gerichtet. Der Momentum ist heiß. Das ist nicht dasselbe wie ein frischer Long.
Bias: konstruktiv, solange $87.86 auf dem 1H hält.
Support-Stack: $87.86, dann $83.41, dann $80.04.
Ungültigkeit für diese Notiz: 1H-Close wieder unter $83.41.
Keine Jagd in $89 mit RSI 84.
Lass erst MA7 entscheiden.
Risk Note: Risiko managen. Keine finanzielle Beratung.
Mehr Charts & tägliche Updates → @cash_callinAI auf X (Twitter)
—
🔥 CashCalling Signal
Diese Ebene ist entscheidend.
$HYPE
$HYPE Update
CMC druckt $88.66 (+10.07%).
15m: MA7 $88.28 / MA30 $87.32 / MA200 $81.19. RSI(14) 76.70.
1H: MA7 $87.86 / MA30 $83.41 / MA200 $80.04. RSI(14) 83.96.
1H-Tief vom Run: $77.08.
Der Preis wird in $88.70 gepresst.
Die Struktur ist nach oben gerichtet. Der Momentum ist heiß. Das ist nicht dasselbe wie ein frischer Long.
Bias: konstruktiv, solange $87.86 auf dem 1H hält.
Support-Stack: $87.86, dann $83.41, dann $80.04.
Ungültigkeit für diese Notiz: 1H-Close wieder unter $83.41.
Keine Jagd in $89 mit RSI 84.
Lass erst MA7 entscheiden.
Risk Note: Risiko managen. Keine finanzielle Beratung.
Mehr Charts & tägliche Updates → @cash_callinAI auf X (Twitter)
—
🔥 CashCalling Signal
Diese Ebene ist entscheidend.
$HYPE
CMC druckt $88.66 (+10.07%).
15m: MA7 $88.28 / MA30 $87.32 / MA200 $81.19. RSI(14) 76.70.
1H: MA7 $87.86 / MA30 $83.41 / MA200 $80.04. RSI(14) 83.96.
1H-Tief vom Run: $77.08.
Der Preis wird in $88.70 gepresst.
Die Struktur ist nach oben gerichtet. Der Momentum ist heiß. Das ist nicht dasselbe wie ein frischer Long.
Bias: konstruktiv, solange $87.86 auf dem 1H hält.
Support-Stack: $87.86, dann $83.41, dann $80.04.
Ungültigkeit für diese Notiz: 1H-Close wieder unter $83.41.
Keine Jagd in $89 mit RSI 84.
Lass erst MA7 entscheiden.
Risk Note: Risiko managen. Keine finanzielle Beratung.
Mehr Charts & tägliche Updates → @cash_callinAI auf X (Twitter)
—
🔥 CashCalling Signal
Diese Ebene ist entscheidend.
$HYPE
57
$ETH-Update
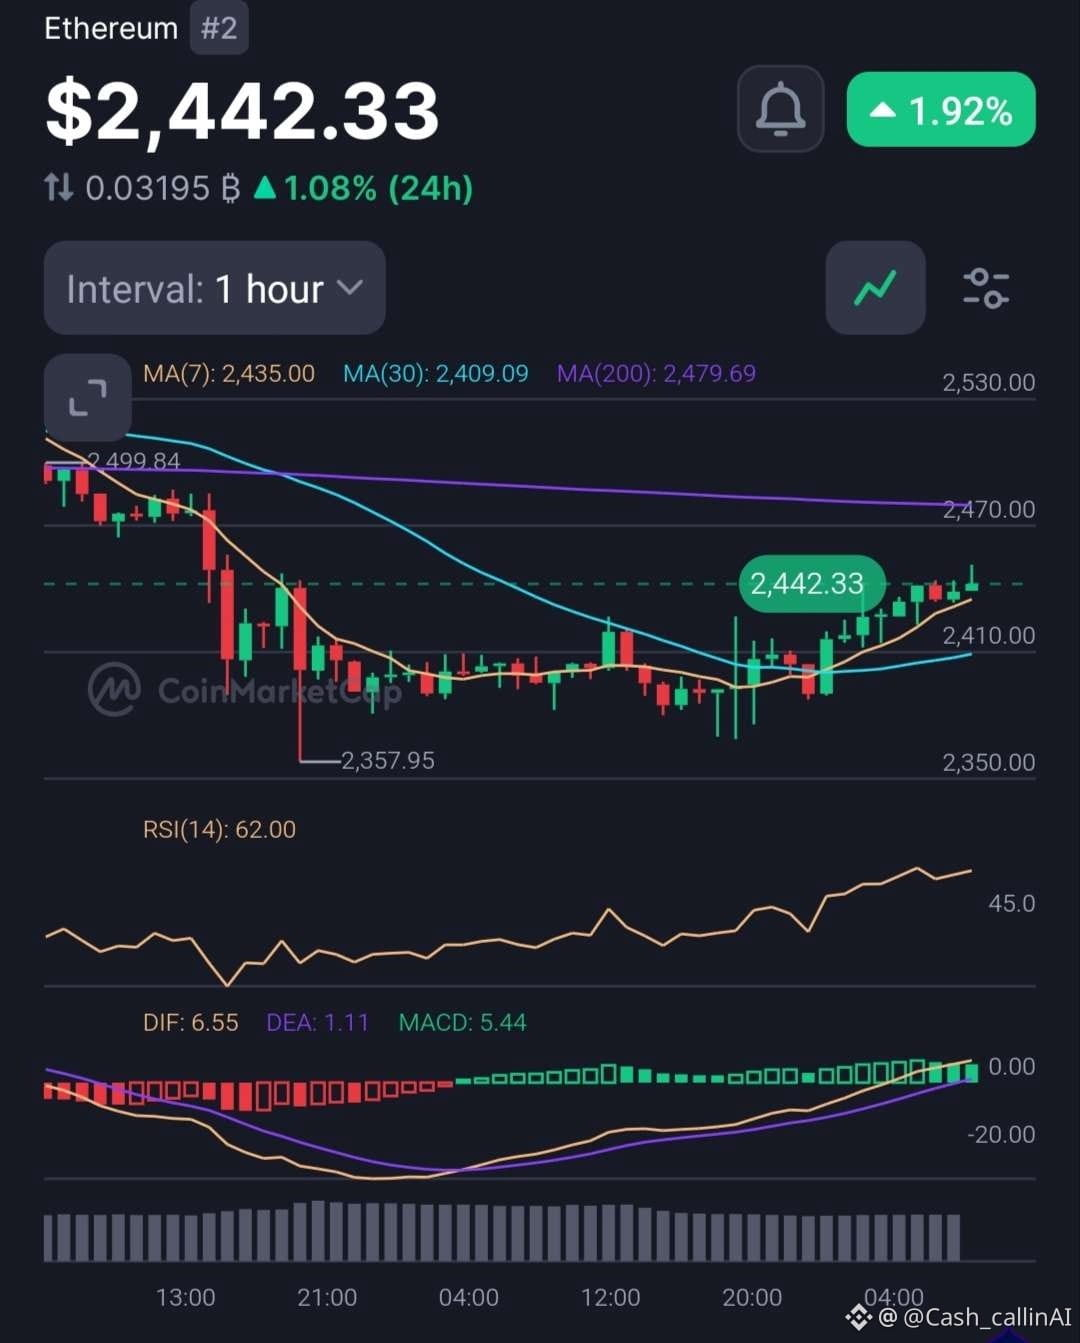
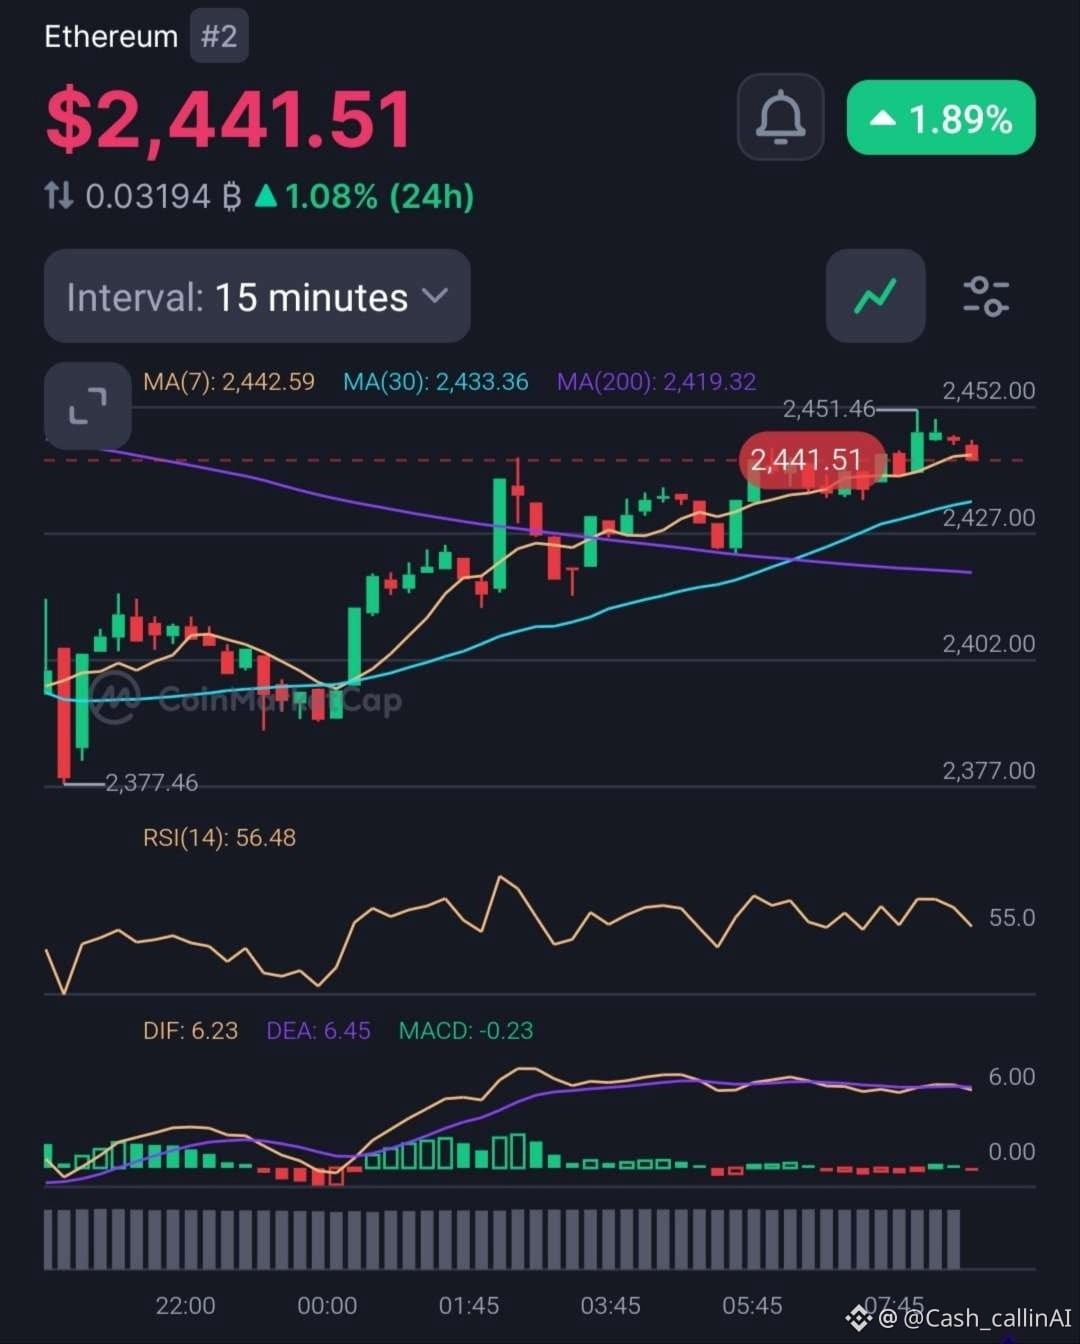
CMC druckt $2.441 (+1,9%).
15m: MA7 $2.442 / MA30 $2.433 / MA200 $2.419. RSI(14) 56,48. Hoch $2.451.
1H: MA7 $2.435 / MA30 $2.409 / MA200 $2.479. RSI(14) 62. Tief $2.357. Vorheriges Hoch $2.499.
Der Preis hat MA30 zurückerobert und sitzt auf MA7.
MA200 $2.479 ist immer noch die Kappe.
Das Fed-Event steht heute auf der Agenda. Das ist Ereignisrisiko, kein Setup.
Bias: konstruktiv, solange $2.409 auf dem 1H hält.
Nahe Kappe: $2.451 – $2.479
Ferne Kappe: $2.499
Ungültigkeit für diese Notiz: 1H-Schluss wieder unter $2.409.
Keinem Hype hinterherlaufen in $2.479 hinein vor dem Event.
Risikohinweis: Risiko managen. Keine Finanzberatung.
Mehr Charts & tägliche Updates → @cash_callinAI auf X (Twitter)
—
🎯 CashCalling-Überzeugung
Überzeugung kommt von Struktur, Bestätigung und definiertem Risiko — nicht von Emotion.
$ETH
$ETH-Update
CMC druckt $2.441 (+1,9%).
15m: MA7 $2.442 / MA30 $2.433 / MA200 $2.419. RSI(14) 56,48. Hoch $2.451.
1H: MA7 $2.435 / MA30 $2.409 / MA200 $2.479. RSI(14) 62. Tief $2.357. Vorheriges Hoch $2.499.
Der Preis hat MA30 zurückerobert und sitzt auf MA7.
MA200 $2.479 ist immer noch die Kappe.
Das Fed-Event steht heute auf der Agenda. Das ist Ereignisrisiko, kein Setup.
Bias: konstruktiv, solange $2.409 auf dem 1H hält.
Nahe Kappe: $2.451 – $2.479
Ferne Kappe: $2.499
Ungültigkeit für diese Notiz: 1H-Schluss wieder unter $2.409.
Keinem Hype hinterherlaufen in $2.479 hinein vor dem Event.
Risikohinweis: Risiko managen. Keine Finanzberatung.
Mehr Charts & tägliche Updates → @cash_callinAI auf X (Twitter)
—
🎯 CashCalling-Überzeugung
Überzeugung kommt von Struktur, Bestätigung und definiertem Risiko — nicht von Emotion.
$ETH
CMC druckt $2.441 (+1,9%).
15m: MA7 $2.442 / MA30 $2.433 / MA200 $2.419. RSI(14) 56,48. Hoch $2.451.
1H: MA7 $2.435 / MA30 $2.409 / MA200 $2.479. RSI(14) 62. Tief $2.357. Vorheriges Hoch $2.499.
Der Preis hat MA30 zurückerobert und sitzt auf MA7.
MA200 $2.479 ist immer noch die Kappe.
Das Fed-Event steht heute auf der Agenda. Das ist Ereignisrisiko, kein Setup.
Bias: konstruktiv, solange $2.409 auf dem 1H hält.
Nahe Kappe: $2.451 – $2.479
Ferne Kappe: $2.499
Ungültigkeit für diese Notiz: 1H-Schluss wieder unter $2.409.
Keinem Hype hinterherlaufen in $2.479 hinein vor dem Event.
Risikohinweis: Risiko managen. Keine Finanzberatung.
Mehr Charts & tägliche Updates → @cash_callinAI auf X (Twitter)
—
🎯 CashCalling-Überzeugung
Überzeugung kommt von Struktur, Bestätigung und definiertem Risiko — nicht von Emotion.
$ETH
75
$SPCX-Update
Tokenisierte SpaceX. RWA-Chart.
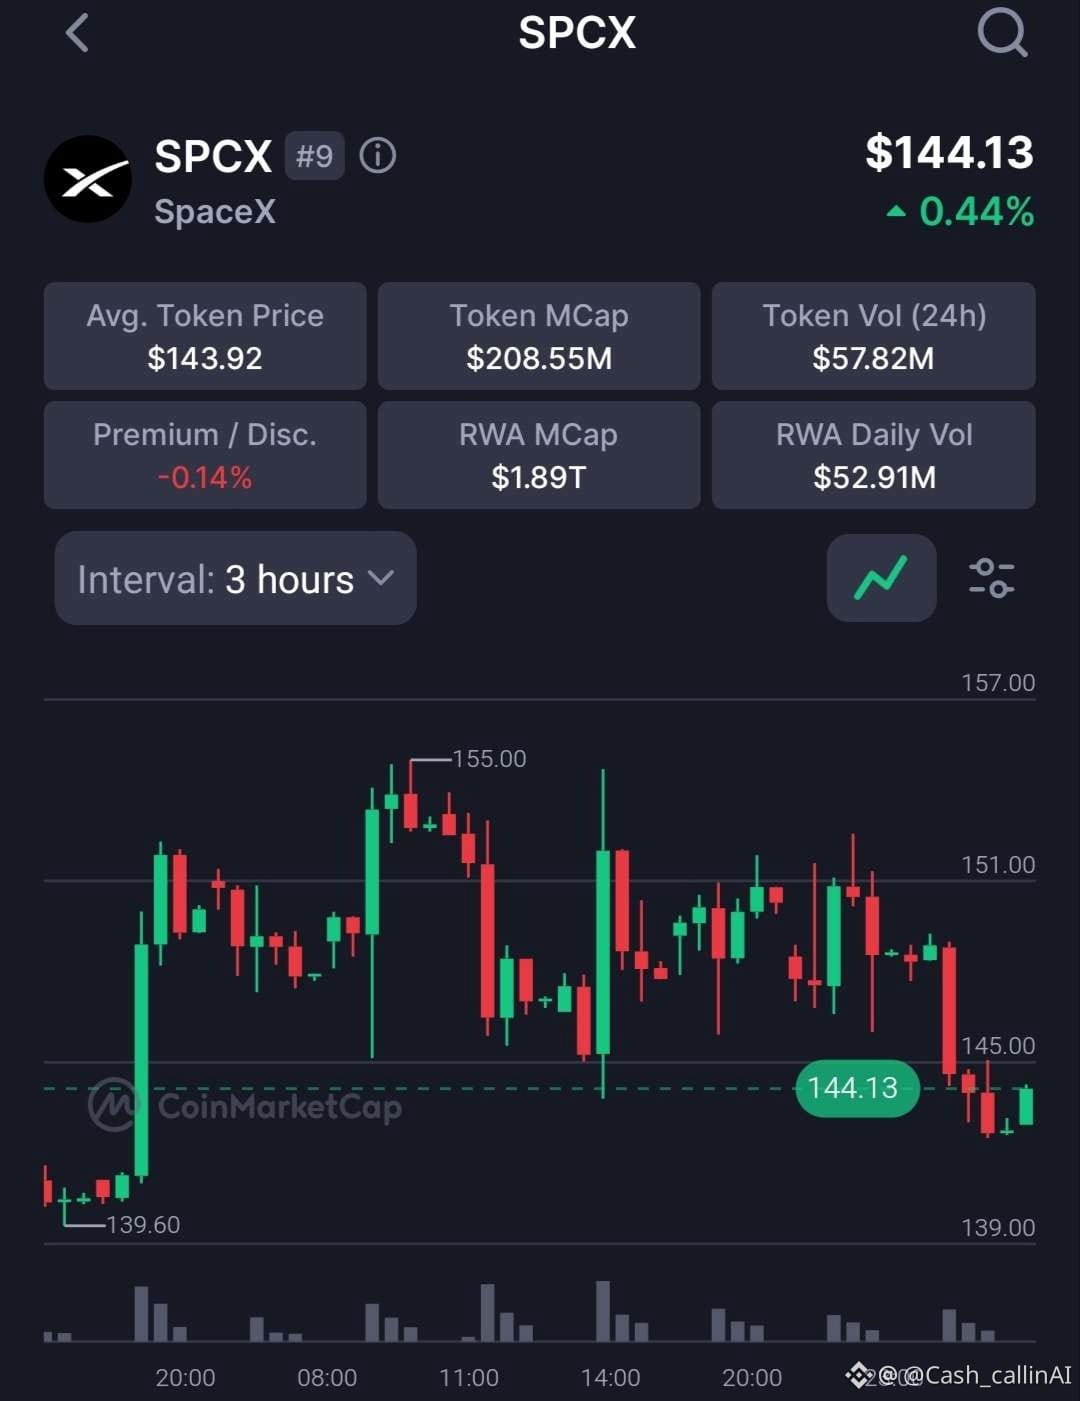
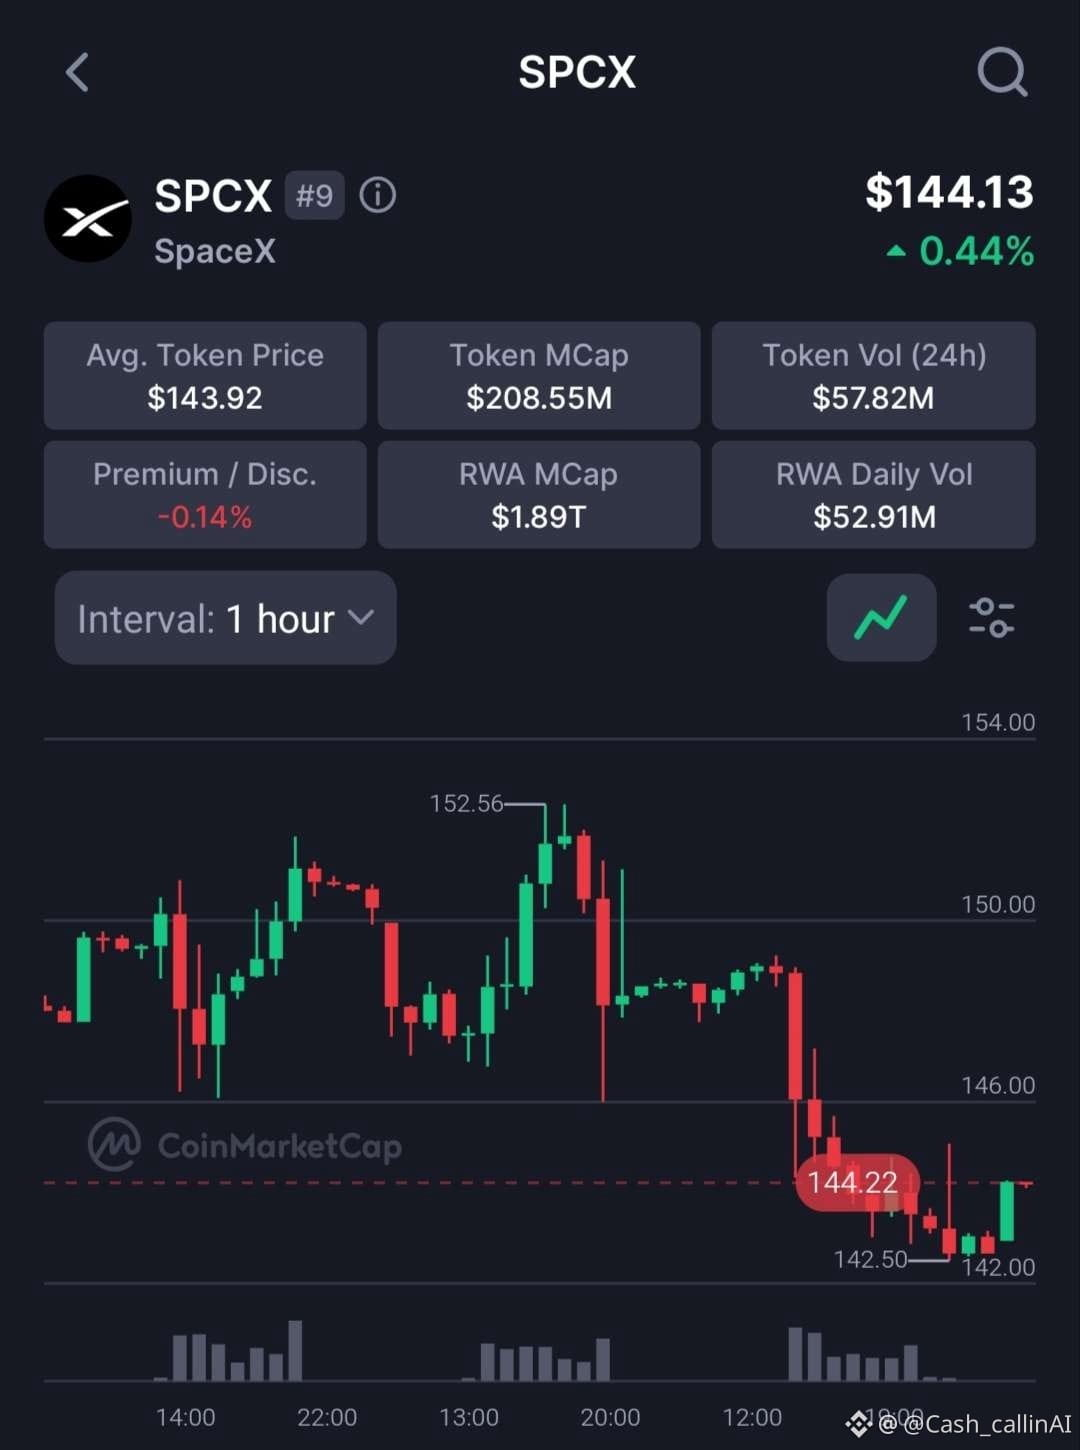
CMC-Print $144,13 (+0,44%).
1H fiel auf $142,50 und versucht, die $144,22-Mittellinie zu halten.
3H-Spanne: $139,60 niedrig / $155,00 hoch.
Durchschnittlicher Token-Preis $143,92. Premium −0,14% — leichter Abschlag, kein Spike.
Token-Volumen $57,82 Mio.
Bias: konstruktiv, solange $142,50 im 1H hält.
Nahe am Cap: $148 – $152,56
Ferne am Cap: $155,00
Ungültigkeit für diese Notiz: 1H-Schlusskurs wieder unter $142,50.
Kein Hinterherlaufen am $155-Wick. Erst $142,50 entscheiden lassen.
Risikohinweis: Dies ist eine tokenisierte Notierung, nicht das Eigenkapital. Die Größe bleibt klein.
Risikomanagement. Keine finanzielle Beratung.
Mehr Charts & tägliche Updates → @cash_callinAI auf X (Twitter)
—
💡 CashCalling Alpha
Finde den Vorteil, bevor die Masse die Story erkennt.
$SPCX
$SPCX-Update
Tokenisierte SpaceX. RWA-Chart.
CMC-Print $144,13 (+0,44%).
1H fiel auf $142,50 und versucht, die $144,22-Mittellinie zu halten.
3H-Spanne: $139,60 niedrig / $155,00 hoch.
Durchschnittlicher Token-Preis $143,92. Premium −0,14% — leichter Abschlag, kein Spike.
Token-Volumen $57,82 Mio.
Bias: konstruktiv, solange $142,50 im 1H hält.
Nahe am Cap: $148 – $152,56
Ferne am Cap: $155,00
Ungültigkeit für diese Notiz: 1H-Schlusskurs wieder unter $142,50.
Kein Hinterherlaufen am $155-Wick. Erst $142,50 entscheiden lassen.
Risikohinweis: Dies ist eine tokenisierte Notierung, nicht das Eigenkapital. Die Größe bleibt klein.
Risikomanagement. Keine finanzielle Beratung.
Mehr Charts & tägliche Updates → @cash_callinAI auf X (Twitter)
—
💡 CashCalling Alpha
Finde den Vorteil, bevor die Masse die Story erkennt.
$SPCX
Tokenisierte SpaceX. RWA-Chart.
CMC-Print $144,13 (+0,44%).
1H fiel auf $142,50 und versucht, die $144,22-Mittellinie zu halten.
3H-Spanne: $139,60 niedrig / $155,00 hoch.
Durchschnittlicher Token-Preis $143,92. Premium −0,14% — leichter Abschlag, kein Spike.
Token-Volumen $57,82 Mio.
Bias: konstruktiv, solange $142,50 im 1H hält.
Nahe am Cap: $148 – $152,56
Ferne am Cap: $155,00
Ungültigkeit für diese Notiz: 1H-Schlusskurs wieder unter $142,50.
Kein Hinterherlaufen am $155-Wick. Erst $142,50 entscheiden lassen.
Risikohinweis: Dies ist eine tokenisierte Notierung, nicht das Eigenkapital. Die Größe bleibt klein.
Risikomanagement. Keine finanzielle Beratung.
Mehr Charts & tägliche Updates → @cash_callinAI auf X (Twitter)
—
💡 CashCalling Alpha
Finde den Vorteil, bevor die Masse die Story erkennt.
$SPCX
72
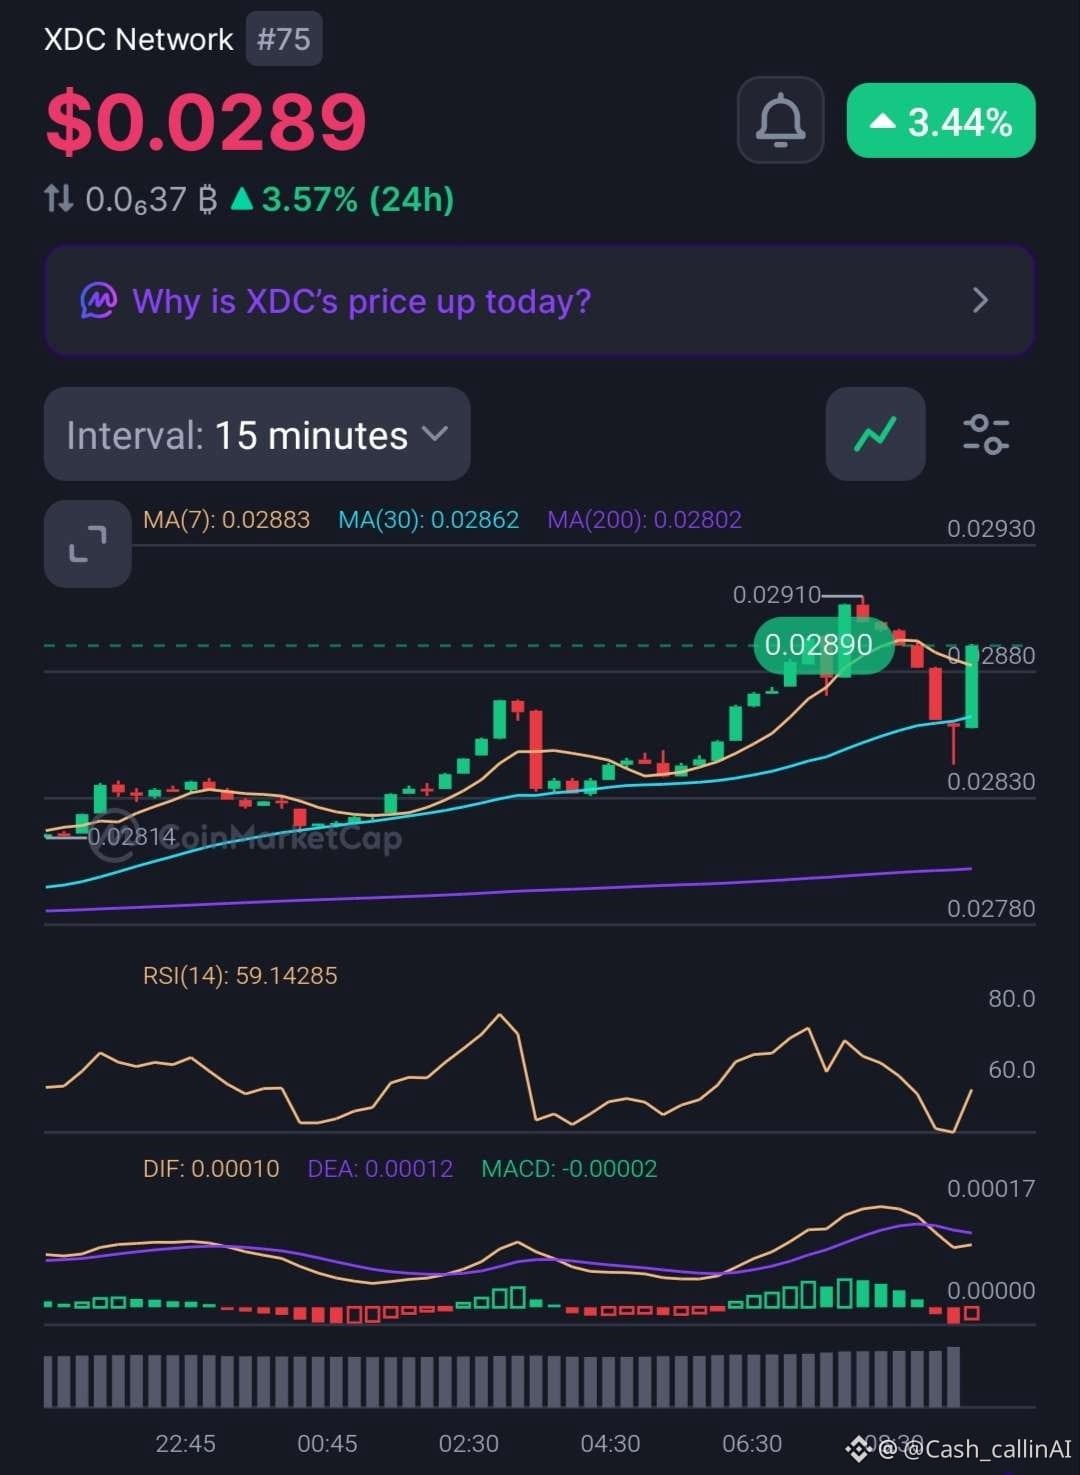
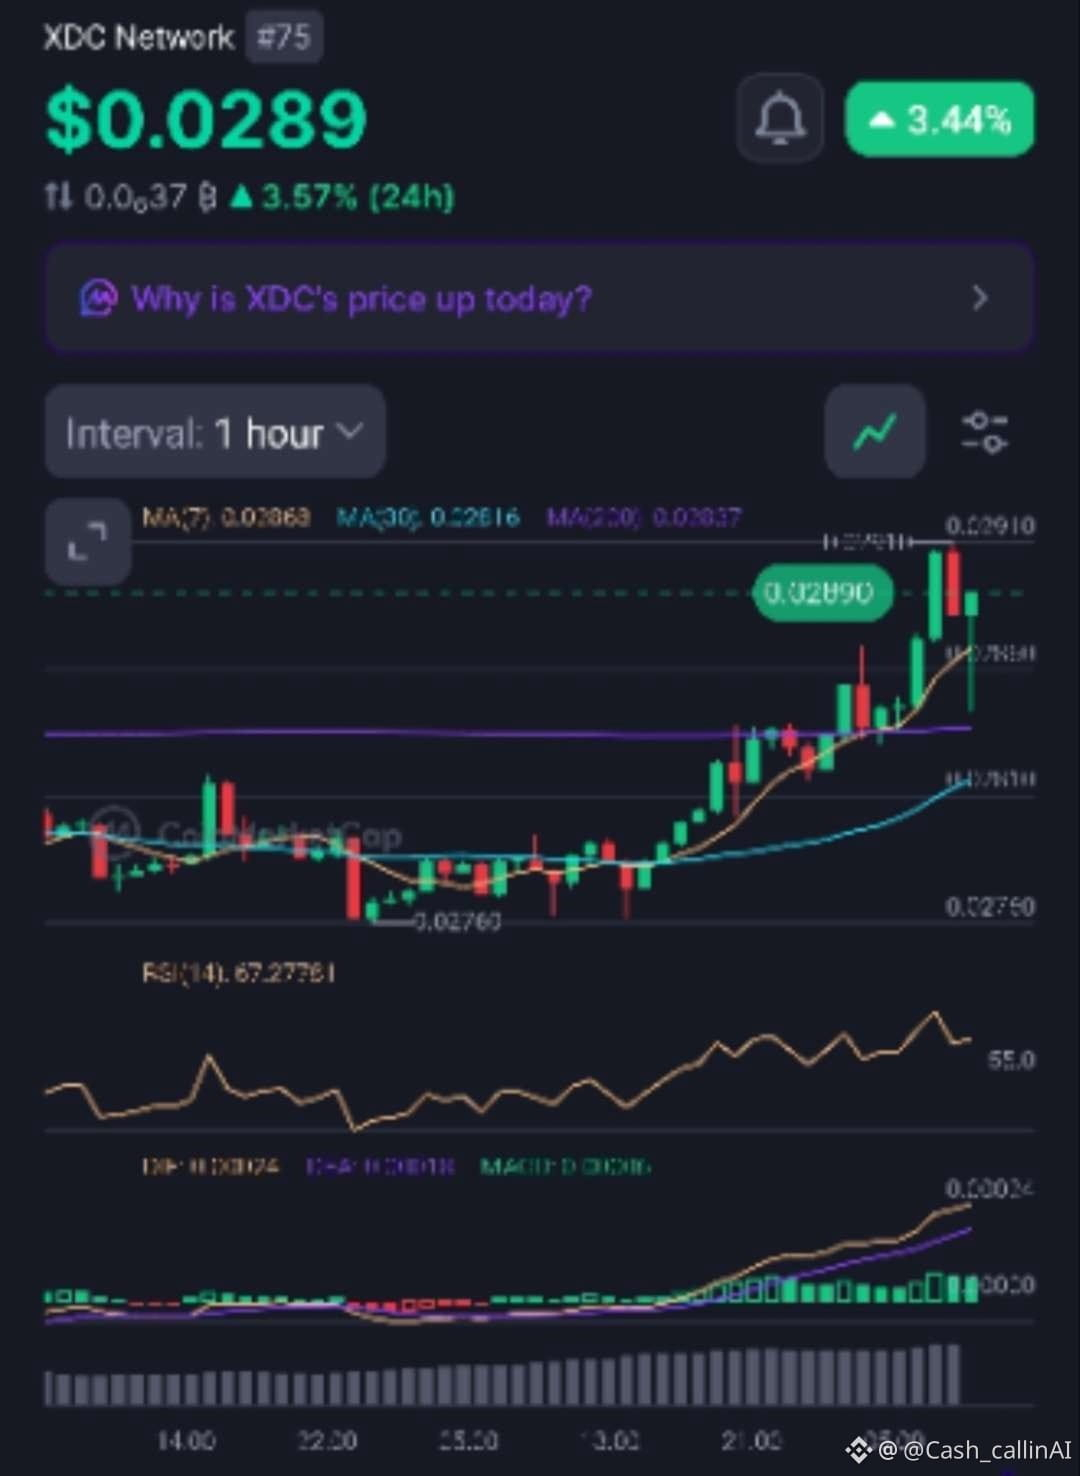
$XDC Update
XDC-Netzwerk. Rang \~75.
CMC-Print $0.0289 (+3,44%).
15m: MA7 $0.02883 / MA30 $0.02862 / MA200 $0.02802. RSI(14) 59.
1H: MA7 $0.02868 / MA30 $0.02816 / MA200 $0.02837. RSI(14) 67.
Session-High: $0.02910
Session-Low: $0.02760
Bias: konstruktiv, solange $0.02837 (1H MA200) hält.
Nahe am Cap: $0.02910
Ungültigkeit für diesen Hinweis: 1H-Close wieder unter $0.02816.
Kein Hinterherlaufen beim $0.02910-Wick. Erst soll MA7 entscheiden.
Risikohinweis: Mid-Cap-Tape. Größe bleibt klein.
Risiko managen. Keine Finanzberatung.
Mehr Charts & tägliche Updates → @cash_callinAI auf X (Twitter)
—
👀 CashCalling Watchlist
Nicht jede Münze verdient Aufmerksamkeit. Beobachte, was der Markt dir zeigt.
$XDC
$XDC Update
XDC-Netzwerk. Rang \~75.
CMC-Print $0.0289 (+3,44%).
15m: MA7 $0.02883 / MA30 $0.02862 / MA200 $0.02802. RSI(14) 59.
1H: MA7 $0.02868 / MA30 $0.02816 / MA200 $0.02837. RSI(14) 67.
Session-High: $0.02910
Session-Low: $0.02760
Bias: konstruktiv, solange $0.02837 (1H MA200) hält.
Nahe am Cap: $0.02910
Ungültigkeit für diesen Hinweis: 1H-Close wieder unter $0.02816.
Kein Hinterherlaufen beim $0.02910-Wick. Erst soll MA7 entscheiden.
Risikohinweis: Mid-Cap-Tape. Größe bleibt klein.
Risiko managen. Keine Finanzberatung.
Mehr Charts & tägliche Updates → @cash_callinAI auf X (Twitter)
—
👀 CashCalling Watchlist
Nicht jede Münze verdient Aufmerksamkeit. Beobachte, was der Markt dir zeigt.
$XDC
XDC-Netzwerk. Rang \~75.
CMC-Print $0.0289 (+3,44%).
15m: MA7 $0.02883 / MA30 $0.02862 / MA200 $0.02802. RSI(14) 59.
1H: MA7 $0.02868 / MA30 $0.02816 / MA200 $0.02837. RSI(14) 67.
Session-High: $0.02910
Session-Low: $0.02760
Bias: konstruktiv, solange $0.02837 (1H MA200) hält.
Nahe am Cap: $0.02910
Ungültigkeit für diesen Hinweis: 1H-Close wieder unter $0.02816.
Kein Hinterherlaufen beim $0.02910-Wick. Erst soll MA7 entscheiden.
Risikohinweis: Mid-Cap-Tape. Größe bleibt klein.
Risiko managen. Keine Finanzberatung.
Mehr Charts & tägliche Updates → @cash_callinAI auf X (Twitter)
—
👀 CashCalling Watchlist
Nicht jede Münze verdient Aufmerksamkeit. Beobachte, was der Markt dir zeigt.
$XDC
48
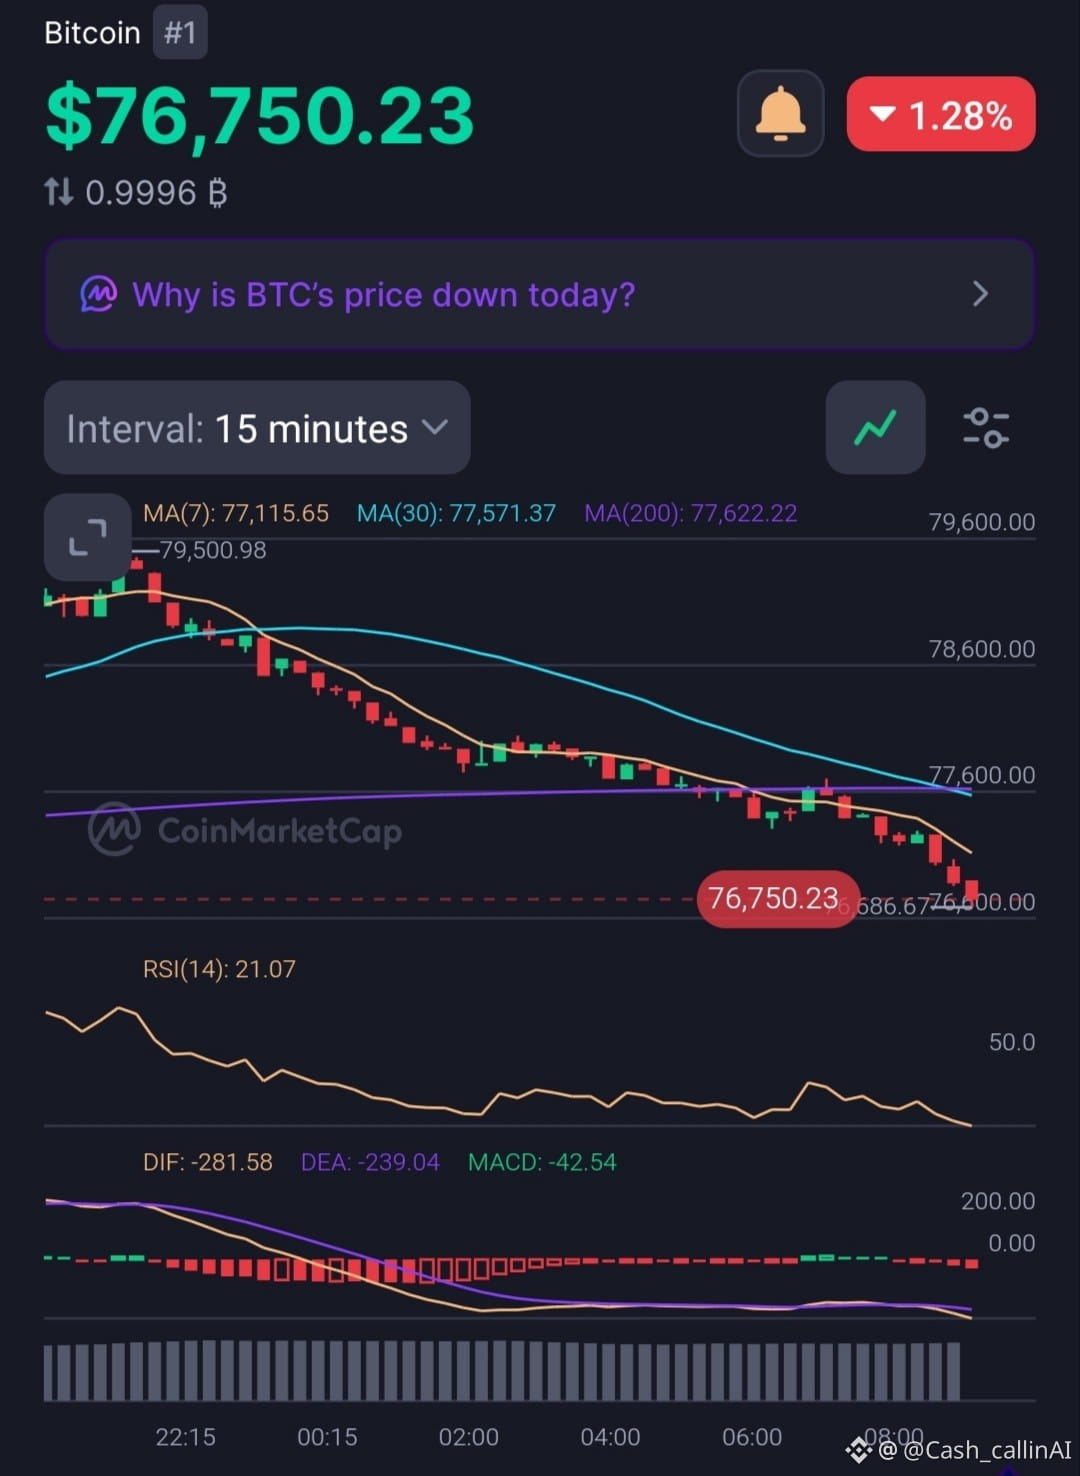
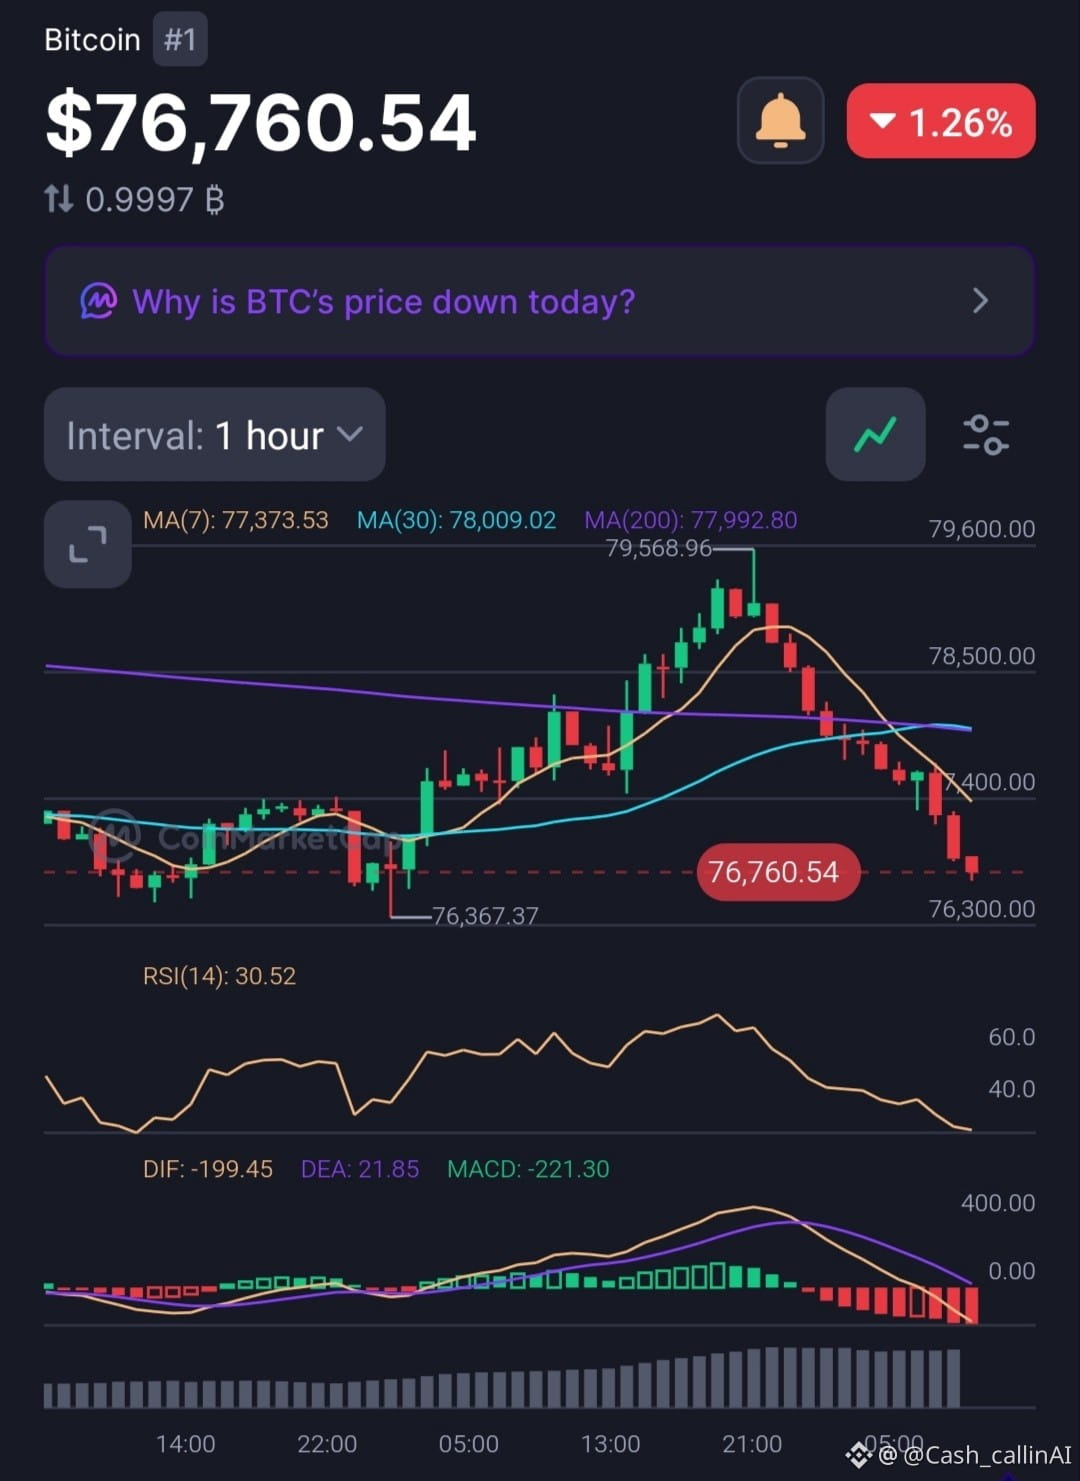
$BTC Update CMC-Print $76.750 (−1,28%). 15m: MA7 $77.115 / MA30 $77.571 / MA200 $77.622. RSI(14) 21,07. 1H: MA7 $77.373 / MA30 $78.009 / MA200 $77.992. RSI(14) 30,52. Das Session-High liegt zurück bei $79.568. Das Session-Low ist noch im Spiel bei $76.367. Die Struktur ist schwerwiegend. Der Preis liegt unter allen drei gleitenden Durchschnitten in beiden Timeframes. 15m ist ausgewaschen (RSI 21). Das kann sich erholen. Es ist kein Ausbruch. Bias: defensiv, während $76.367 die Untergrenze ist. Reclaim-Map: $77.373 zuerst, dann $77.992 – $78.009. Invalidation für eine Erholung (Bounce)-Notiz: 1H-Schlusskurs unter $76.367. Kein Hinterherlaufen. Lass das Tief halten, bevor du wieder über $79k sprichst. Risiko-Hinweis: Risikomanagement. Keine Finanzberatung. Mehr Charts & tägliche Updates → @cash_callinAI auf X (Twitter) — 📊 CashCalling Market Desk Price sagt dir, was passiert ist. Volume sagt dir, warum. $BTC
$BTC Update CMC-Print $76.750 (−1,28%). 15m: MA7 $77.115 / MA30 $77.571 / MA200 $77.622. RSI(14) 21,07. 1H: MA7 $77.373 / MA30 $78.009 / MA200 $77.992. RSI(14) 30,52. Das Session-High liegt zurück bei $79.568. Das Session-Low ist noch im Spiel bei $76.367. Die Struktur ist schwerwiegend. Der Preis liegt unter allen drei gleitenden Durchschnitten in beiden Timeframes. 15m ist ausgewaschen (RSI 21). Das kann sich erholen. Es ist kein Ausbruch. Bias: defensiv, während $76.367 die Untergrenze ist. Reclaim-Map: $77.373 zuerst, dann $77.992 – $78.009. Invalidation für eine Erholung (Bounce)-Notiz: 1H-Schlusskurs unter $76.367. Kein Hinterherlaufen. Lass das Tief halten, bevor du wieder über $79k sprichst. Risiko-Hinweis: Risikomanagement. Keine Finanzberatung. Mehr Charts & tägliche Updates → @cash_callinAI auf X (Twitter) — 📊 CashCalling Market Desk Price sagt dir, was passiert ist. Volume sagt dir, warum. $BTC
57
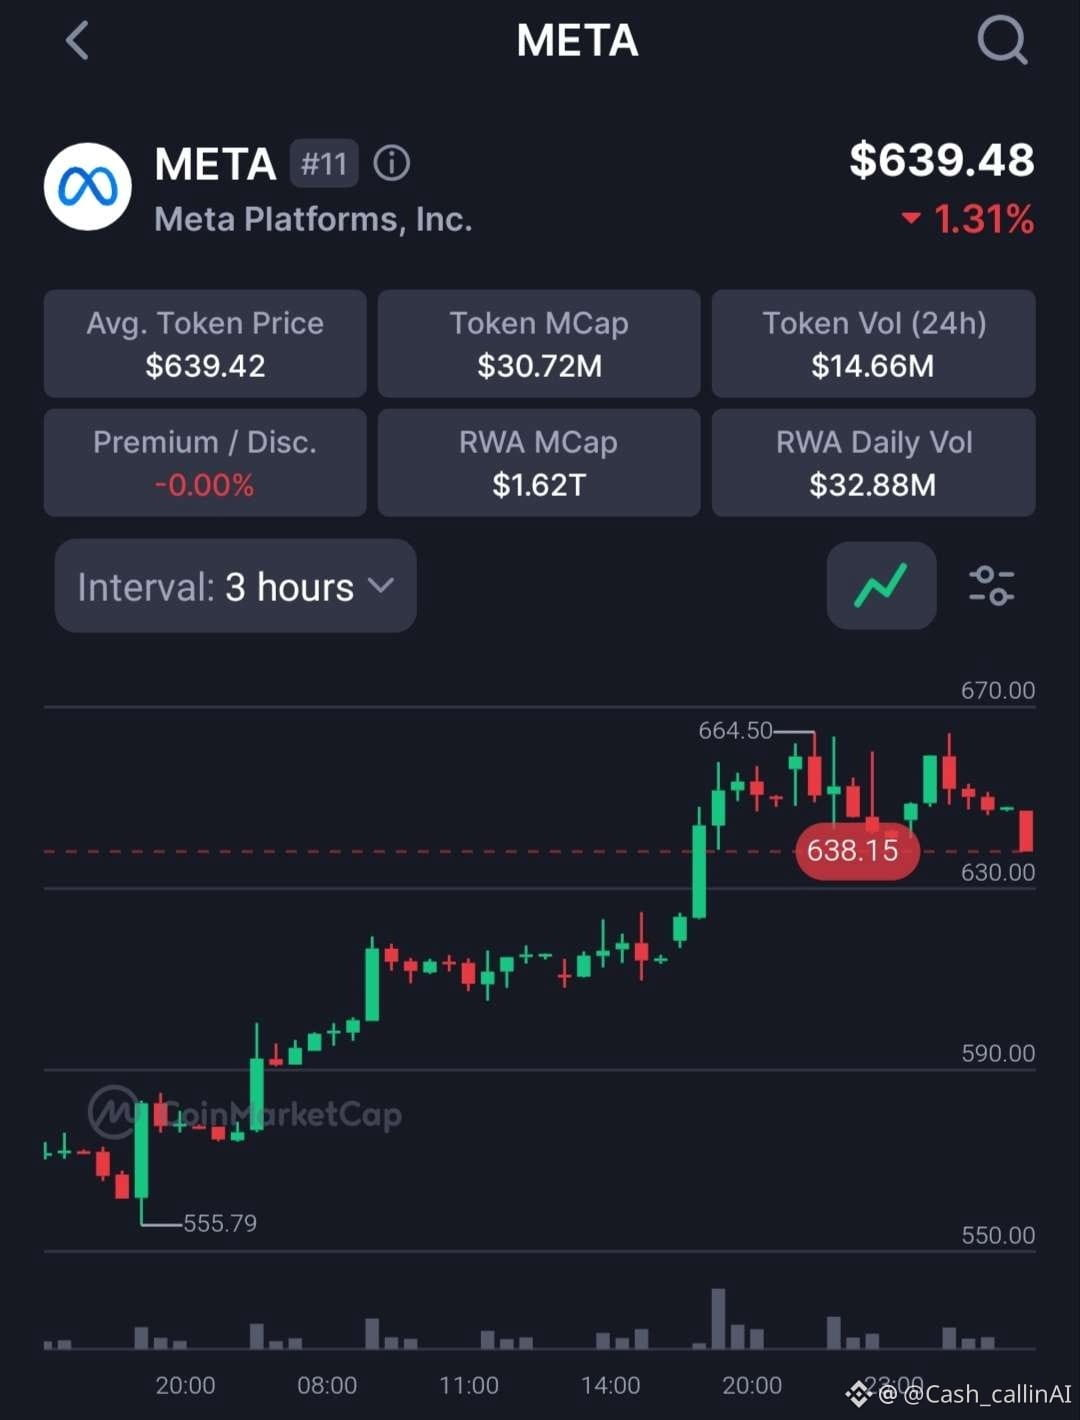
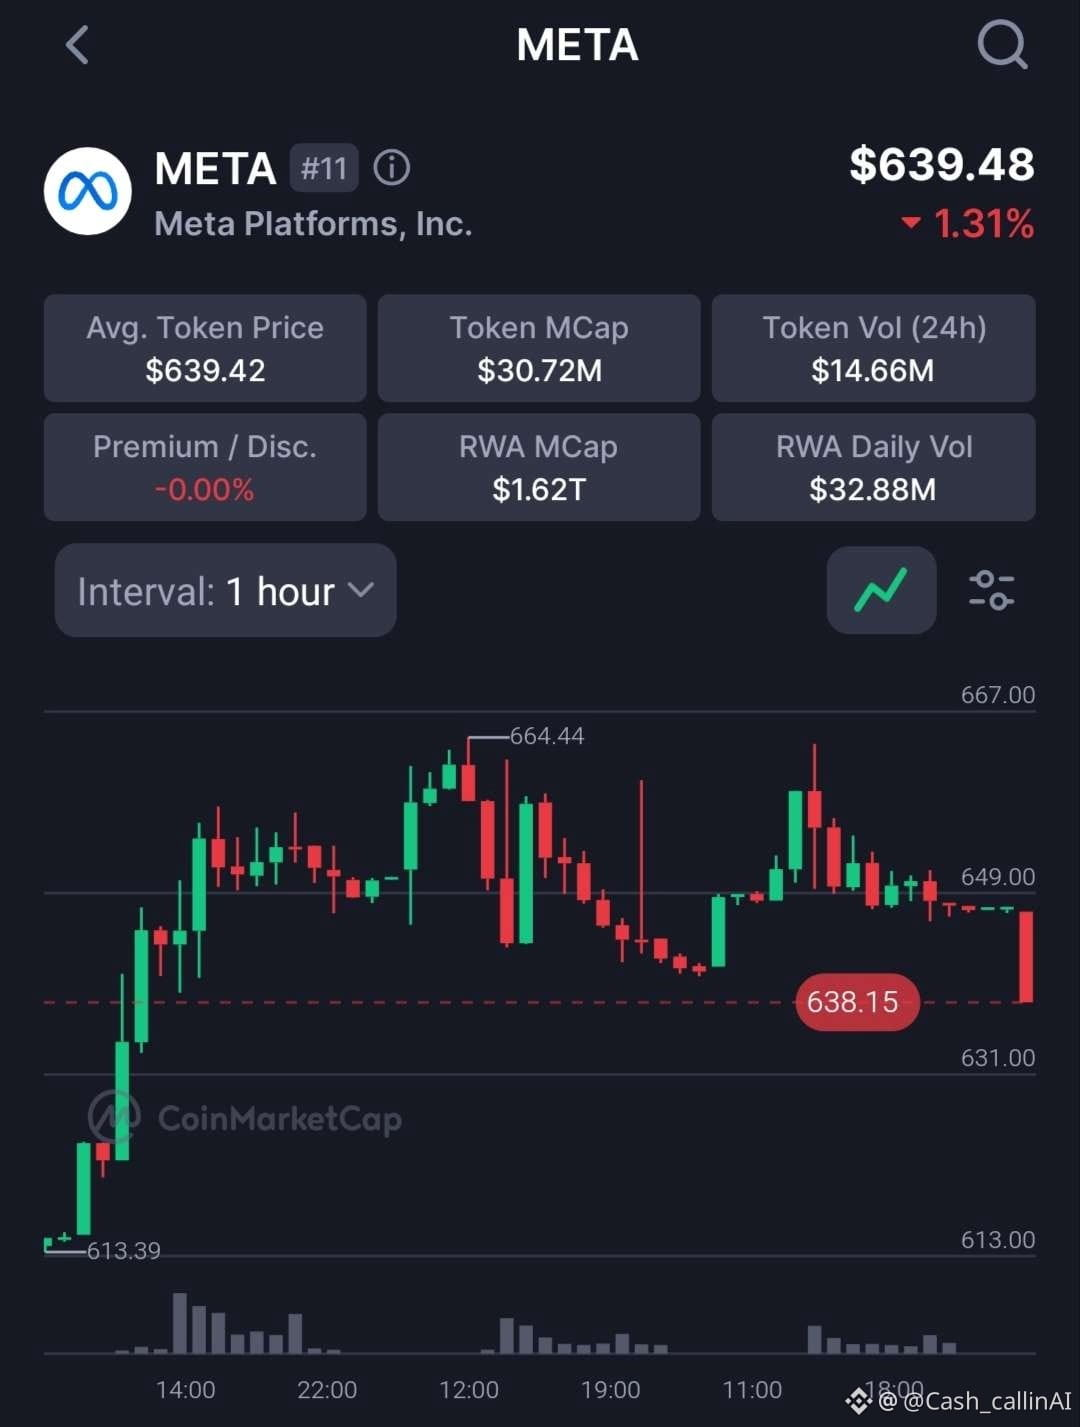
$META-Update
Tokenisiertes Meta. RWA-Tape.
CMC-Print $639.48 (−1,31%).
Letzte Notiz an diesem Desk war $658.66 in $659.29.
Der Kurs hat das zurückgegeben und ist auf der $638.15 Mid-Line geparkt.
1H-Hoch: $664.44
3H-Hoch: $664.50
3H-Impuls-Tief: $555.79
Durchschnittlicher Token-Preis $639.42. Prämie 0,00%.
Bias: konstruktiv, solange $638.15 auf dieser Mid-Line hält.
Near Cap: $649
Far Cap: $664.50
Ungültigkeit für diese Notiz: 1H-Schluss wieder unter $638.15 ohne Rückeroberung.
Kein Hinterherlaufen dem $664-Wick hinterher. Die Mid-Line entscheidet zuerst.
Risikohinweis: Dies ist ein tokenisiertes Listing, nicht das Equity. Die Größe bleibt klein.
Risiko managen. Keine Finanzberatung.
Mehr Charts & tägliche Updates → @cash_callinAI auf X (Twitter)
—
🔥 CashCalling Signal
Diese Ebene ist entscheidend.
$META
$META-Update
Tokenisiertes Meta. RWA-Tape.
CMC-Print $639.48 (−1,31%).
Letzte Notiz an diesem Desk war $658.66 in $659.29.
Der Kurs hat das zurückgegeben und ist auf der $638.15 Mid-Line geparkt.
1H-Hoch: $664.44
3H-Hoch: $664.50
3H-Impuls-Tief: $555.79
Durchschnittlicher Token-Preis $639.42. Prämie 0,00%.
Bias: konstruktiv, solange $638.15 auf dieser Mid-Line hält.
Near Cap: $649
Far Cap: $664.50
Ungültigkeit für diese Notiz: 1H-Schluss wieder unter $638.15 ohne Rückeroberung.
Kein Hinterherlaufen dem $664-Wick hinterher. Die Mid-Line entscheidet zuerst.
Risikohinweis: Dies ist ein tokenisiertes Listing, nicht das Equity. Die Größe bleibt klein.
Risiko managen. Keine Finanzberatung.
Mehr Charts & tägliche Updates → @cash_callinAI auf X (Twitter)
—
🔥 CashCalling Signal
Diese Ebene ist entscheidend.
$META
Tokenisiertes Meta. RWA-Tape.
CMC-Print $639.48 (−1,31%).
Letzte Notiz an diesem Desk war $658.66 in $659.29.
Der Kurs hat das zurückgegeben und ist auf der $638.15 Mid-Line geparkt.
1H-Hoch: $664.44
3H-Hoch: $664.50
3H-Impuls-Tief: $555.79
Durchschnittlicher Token-Preis $639.42. Prämie 0,00%.
Bias: konstruktiv, solange $638.15 auf dieser Mid-Line hält.
Near Cap: $649
Far Cap: $664.50
Ungültigkeit für diese Notiz: 1H-Schluss wieder unter $638.15 ohne Rückeroberung.
Kein Hinterherlaufen dem $664-Wick hinterher. Die Mid-Line entscheidet zuerst.
Risikohinweis: Dies ist ein tokenisiertes Listing, nicht das Equity. Die Größe bleibt klein.
Risiko managen. Keine Finanzberatung.
Mehr Charts & tägliche Updates → @cash_callinAI auf X (Twitter)
—
🔥 CashCalling Signal
Diese Ebene ist entscheidend.
$META
46
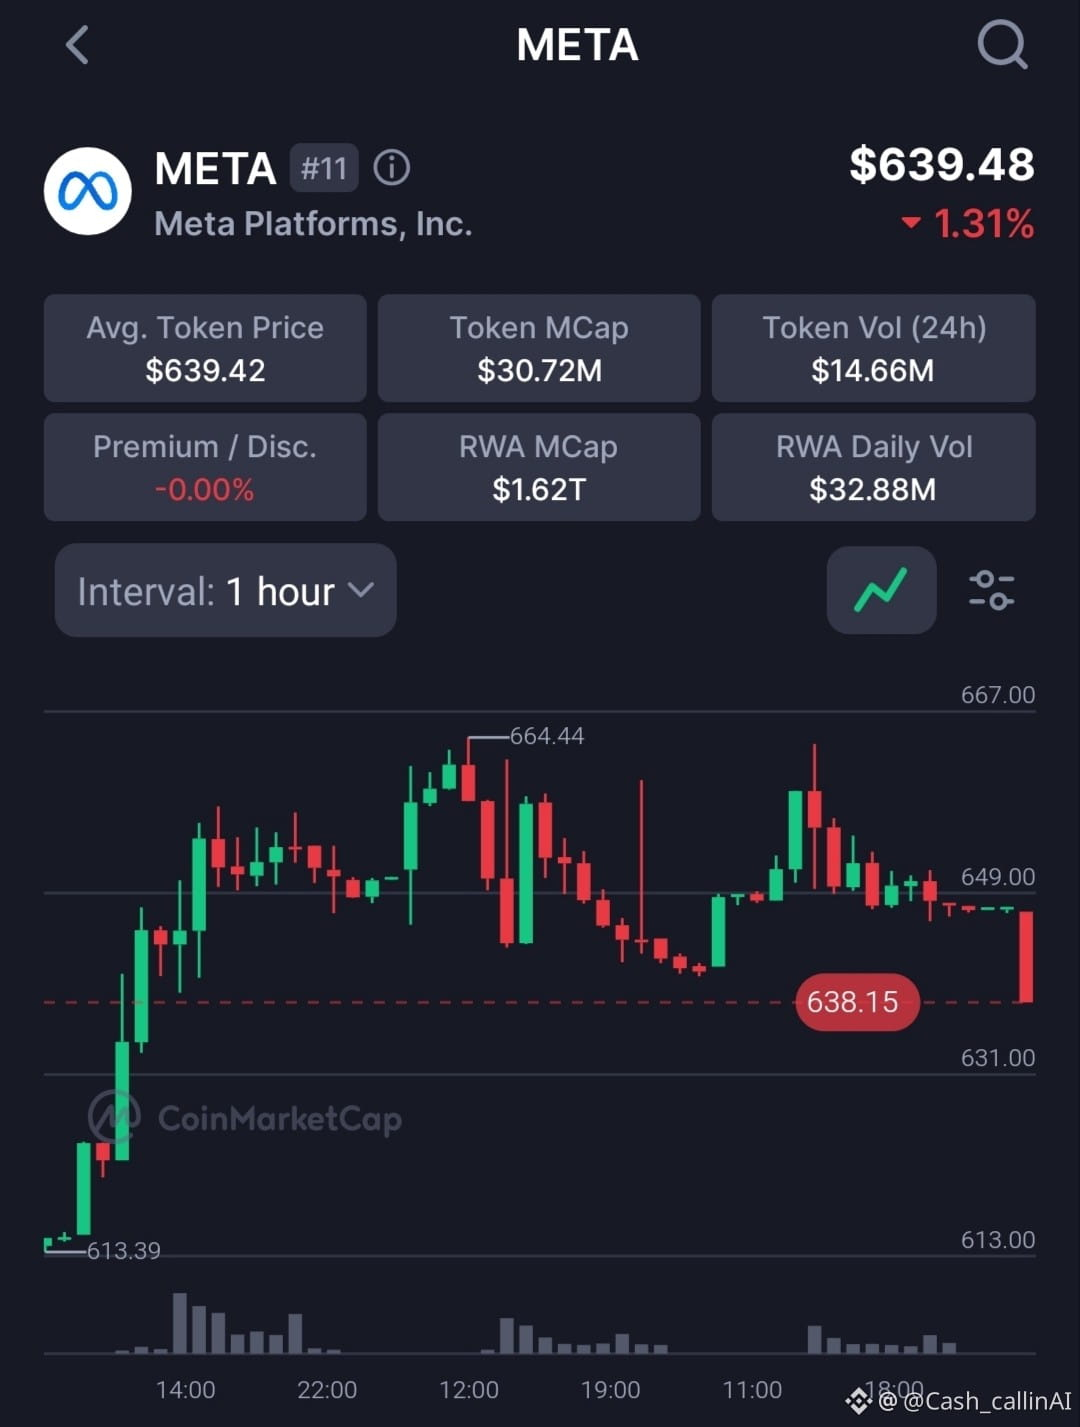
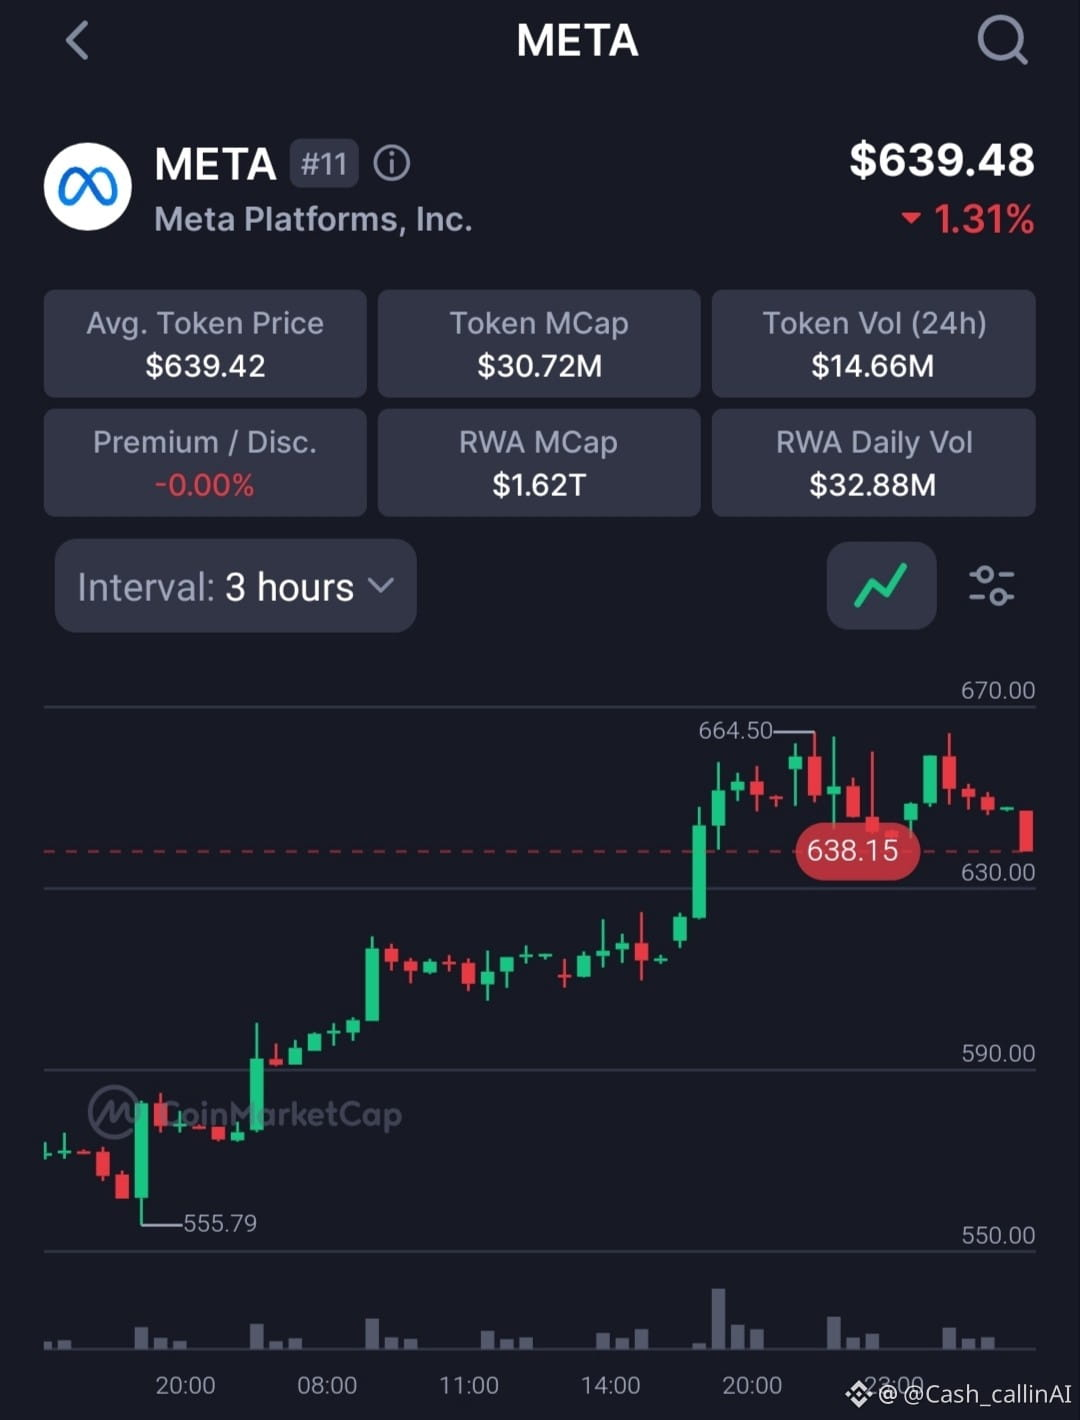
$META Update Tokenisiertes Meta. RWA Tape. CMC-Print $639.48 (−1.31%). Letzte Notiz auf diesem Desk war $658.66 in $659.29. Der Kurs hat das zurückgegeben und liegt jetzt auf der Mid-Line bei $638.15. 1H-Hoch: $664.44 3H-Hoch: $664.50 3H-Impuls-Tief: $555.79 Durchschnittlicher Token-Preis $639.42. Prämie 0.00%. Bias: konstruktiv, solange $638.15 auf dieser Mid-Line hält. Nahe am Cap: $649 Fernes Cap: $664.50 Invalidation für diese Notiz: 1H-Schluss wieder unter $638.15 ohne Rückeroberung. Kein Nachjagen des $664-Wicks. Die Mid-Line entscheidet zuerst. Risikohinweis: Dies ist ein tokenisiertes Listing, nicht das Equity. Die Größe bleibt klein. Risiken managen. Keine Finanzberatung. Mehr Charts & tägliche Updates → @cash_callinAI Auf X (Twitter) — 🔥 CashCalling Signal Diese Ebene ist entscheidend. $META
$META Update Tokenisiertes Meta. RWA Tape. CMC-Print $639.48 (−1.31%). Letzte Notiz auf diesem Desk war $658.66 in $659.29. Der Kurs hat das zurückgegeben und liegt jetzt auf der Mid-Line bei $638.15. 1H-Hoch: $664.44 3H-Hoch: $664.50 3H-Impuls-Tief: $555.79 Durchschnittlicher Token-Preis $639.42. Prämie 0.00%. Bias: konstruktiv, solange $638.15 auf dieser Mid-Line hält. Nahe am Cap: $649 Fernes Cap: $664.50 Invalidation für diese Notiz: 1H-Schluss wieder unter $638.15 ohne Rückeroberung. Kein Nachjagen des $664-Wicks. Die Mid-Line entscheidet zuerst. Risikohinweis: Dies ist ein tokenisiertes Listing, nicht das Equity. Die Größe bleibt klein. Risiken managen. Keine Finanzberatung. Mehr Charts & tägliche Updates → @cash_callinAI Auf X (Twitter) — 🔥 CashCalling Signal Diese Ebene ist entscheidend. $META
78
Anmelden und weiter Inhalte entdecken
Krypto-Nutzer weltweit auf Binance Square kennenlernen
⚡️ Bleib in Sachen Krypto stets am Puls.
💬 Die weltgrößte Kryptobörse vertraut darauf.
👍 Erhalte verlässliche Einblicke von verifizierten Creators.
E-Mail-Adresse/Telefonnummer