

Chumba Money
6.7k Beiträge

Chumba Money
 Square Verified
Melden
Nutzer blockieren
Research & Analysis | Crypto Education | Chumba Labs Dev

Top Voices

Level 2 Creator
1 Following
49.8K+ Follower
18.1K+ Like gegeben
2 Abzeichen
Beiträge
Alle
Zitierungen
·
--
Übersetzung ansehen
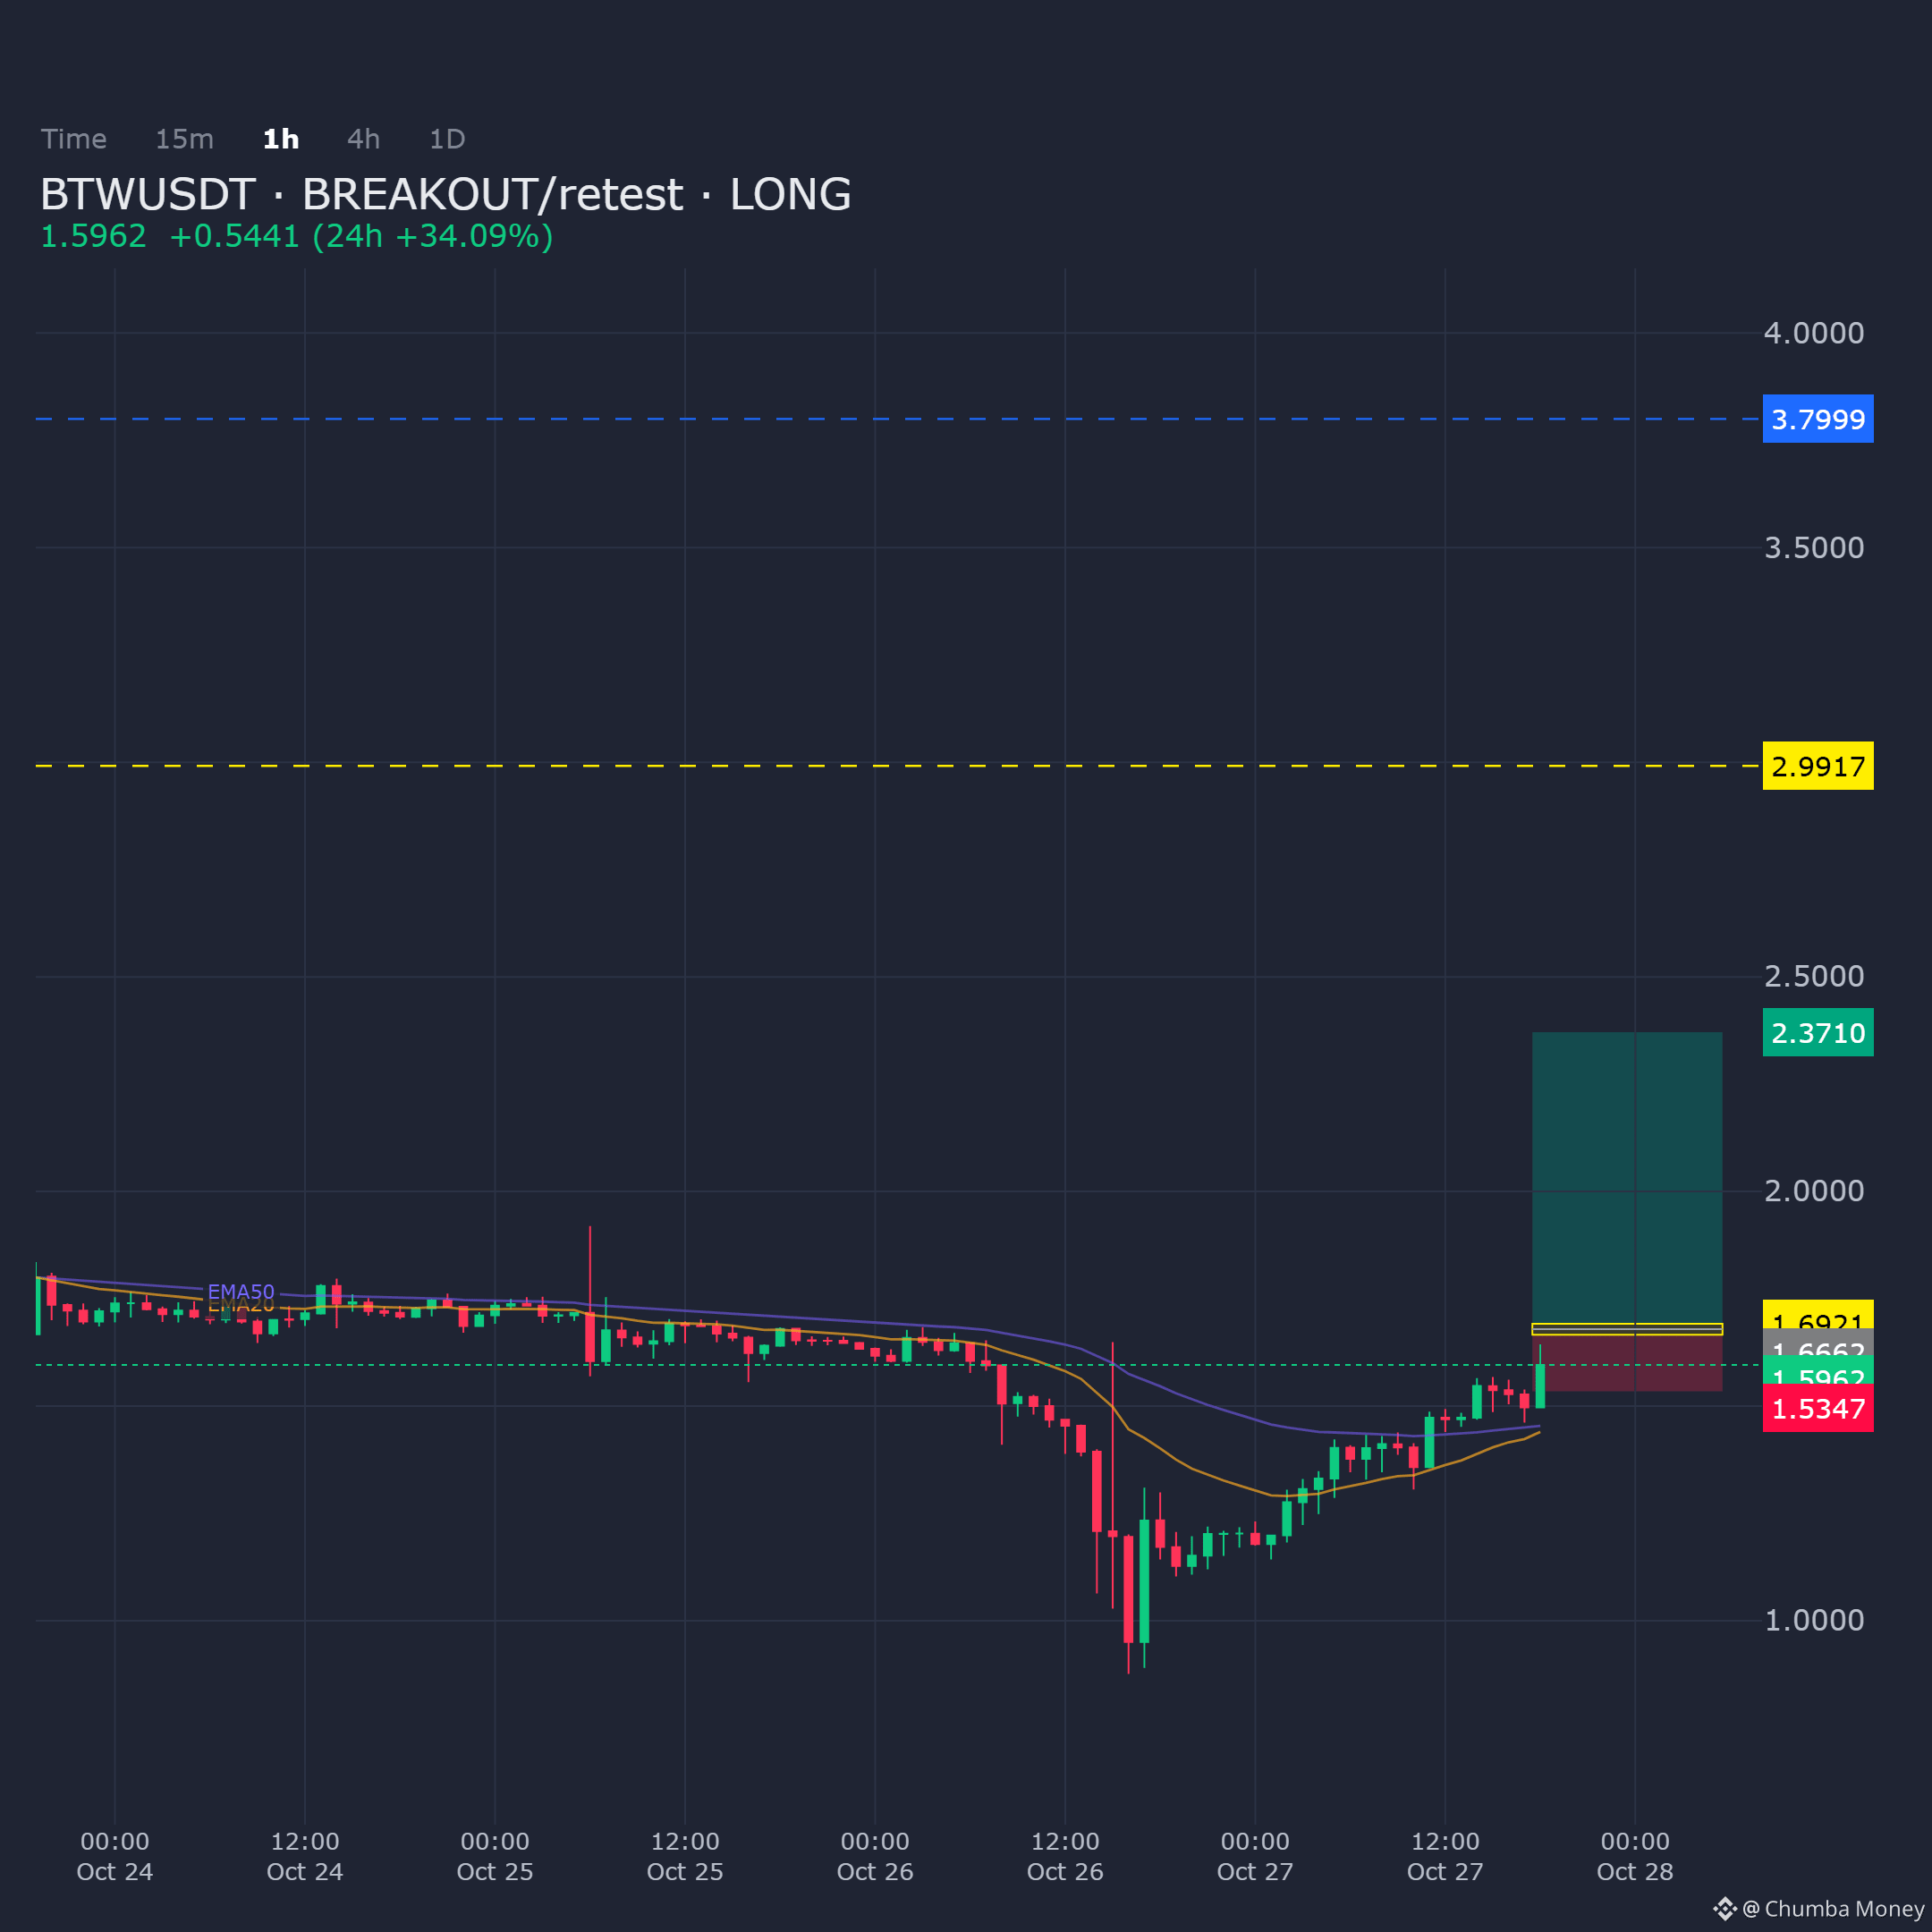
BTWUSDT on the 1H frame is testing a breakout structure with bias skewed to the upside. Price action suggests a retest setup within the defined demand zone.
Entry: 1.6662 - 1.6921
Targets: TP1: 2.371, TP2: 2.9917, TP3: 3.7999
Stop Loss: 1.5347
$BTW
BTWUSDT on the 1H frame is testing a breakout structure with bias skewed to the upside. Price action suggests a retest setup within the defined demand zone.
Entry: 1.6662 - 1.6921
Targets: TP1: 2.371, TP2: 2.9917, TP3: 3.7999
Stop Loss: 1.5347
$BTW
Entry: 1.6662 - 1.6921
Targets: TP1: 2.371, TP2: 2.9917, TP3: 3.7999
Stop Loss: 1.5347
$BTW
7
·
--
Übersetzung ansehen
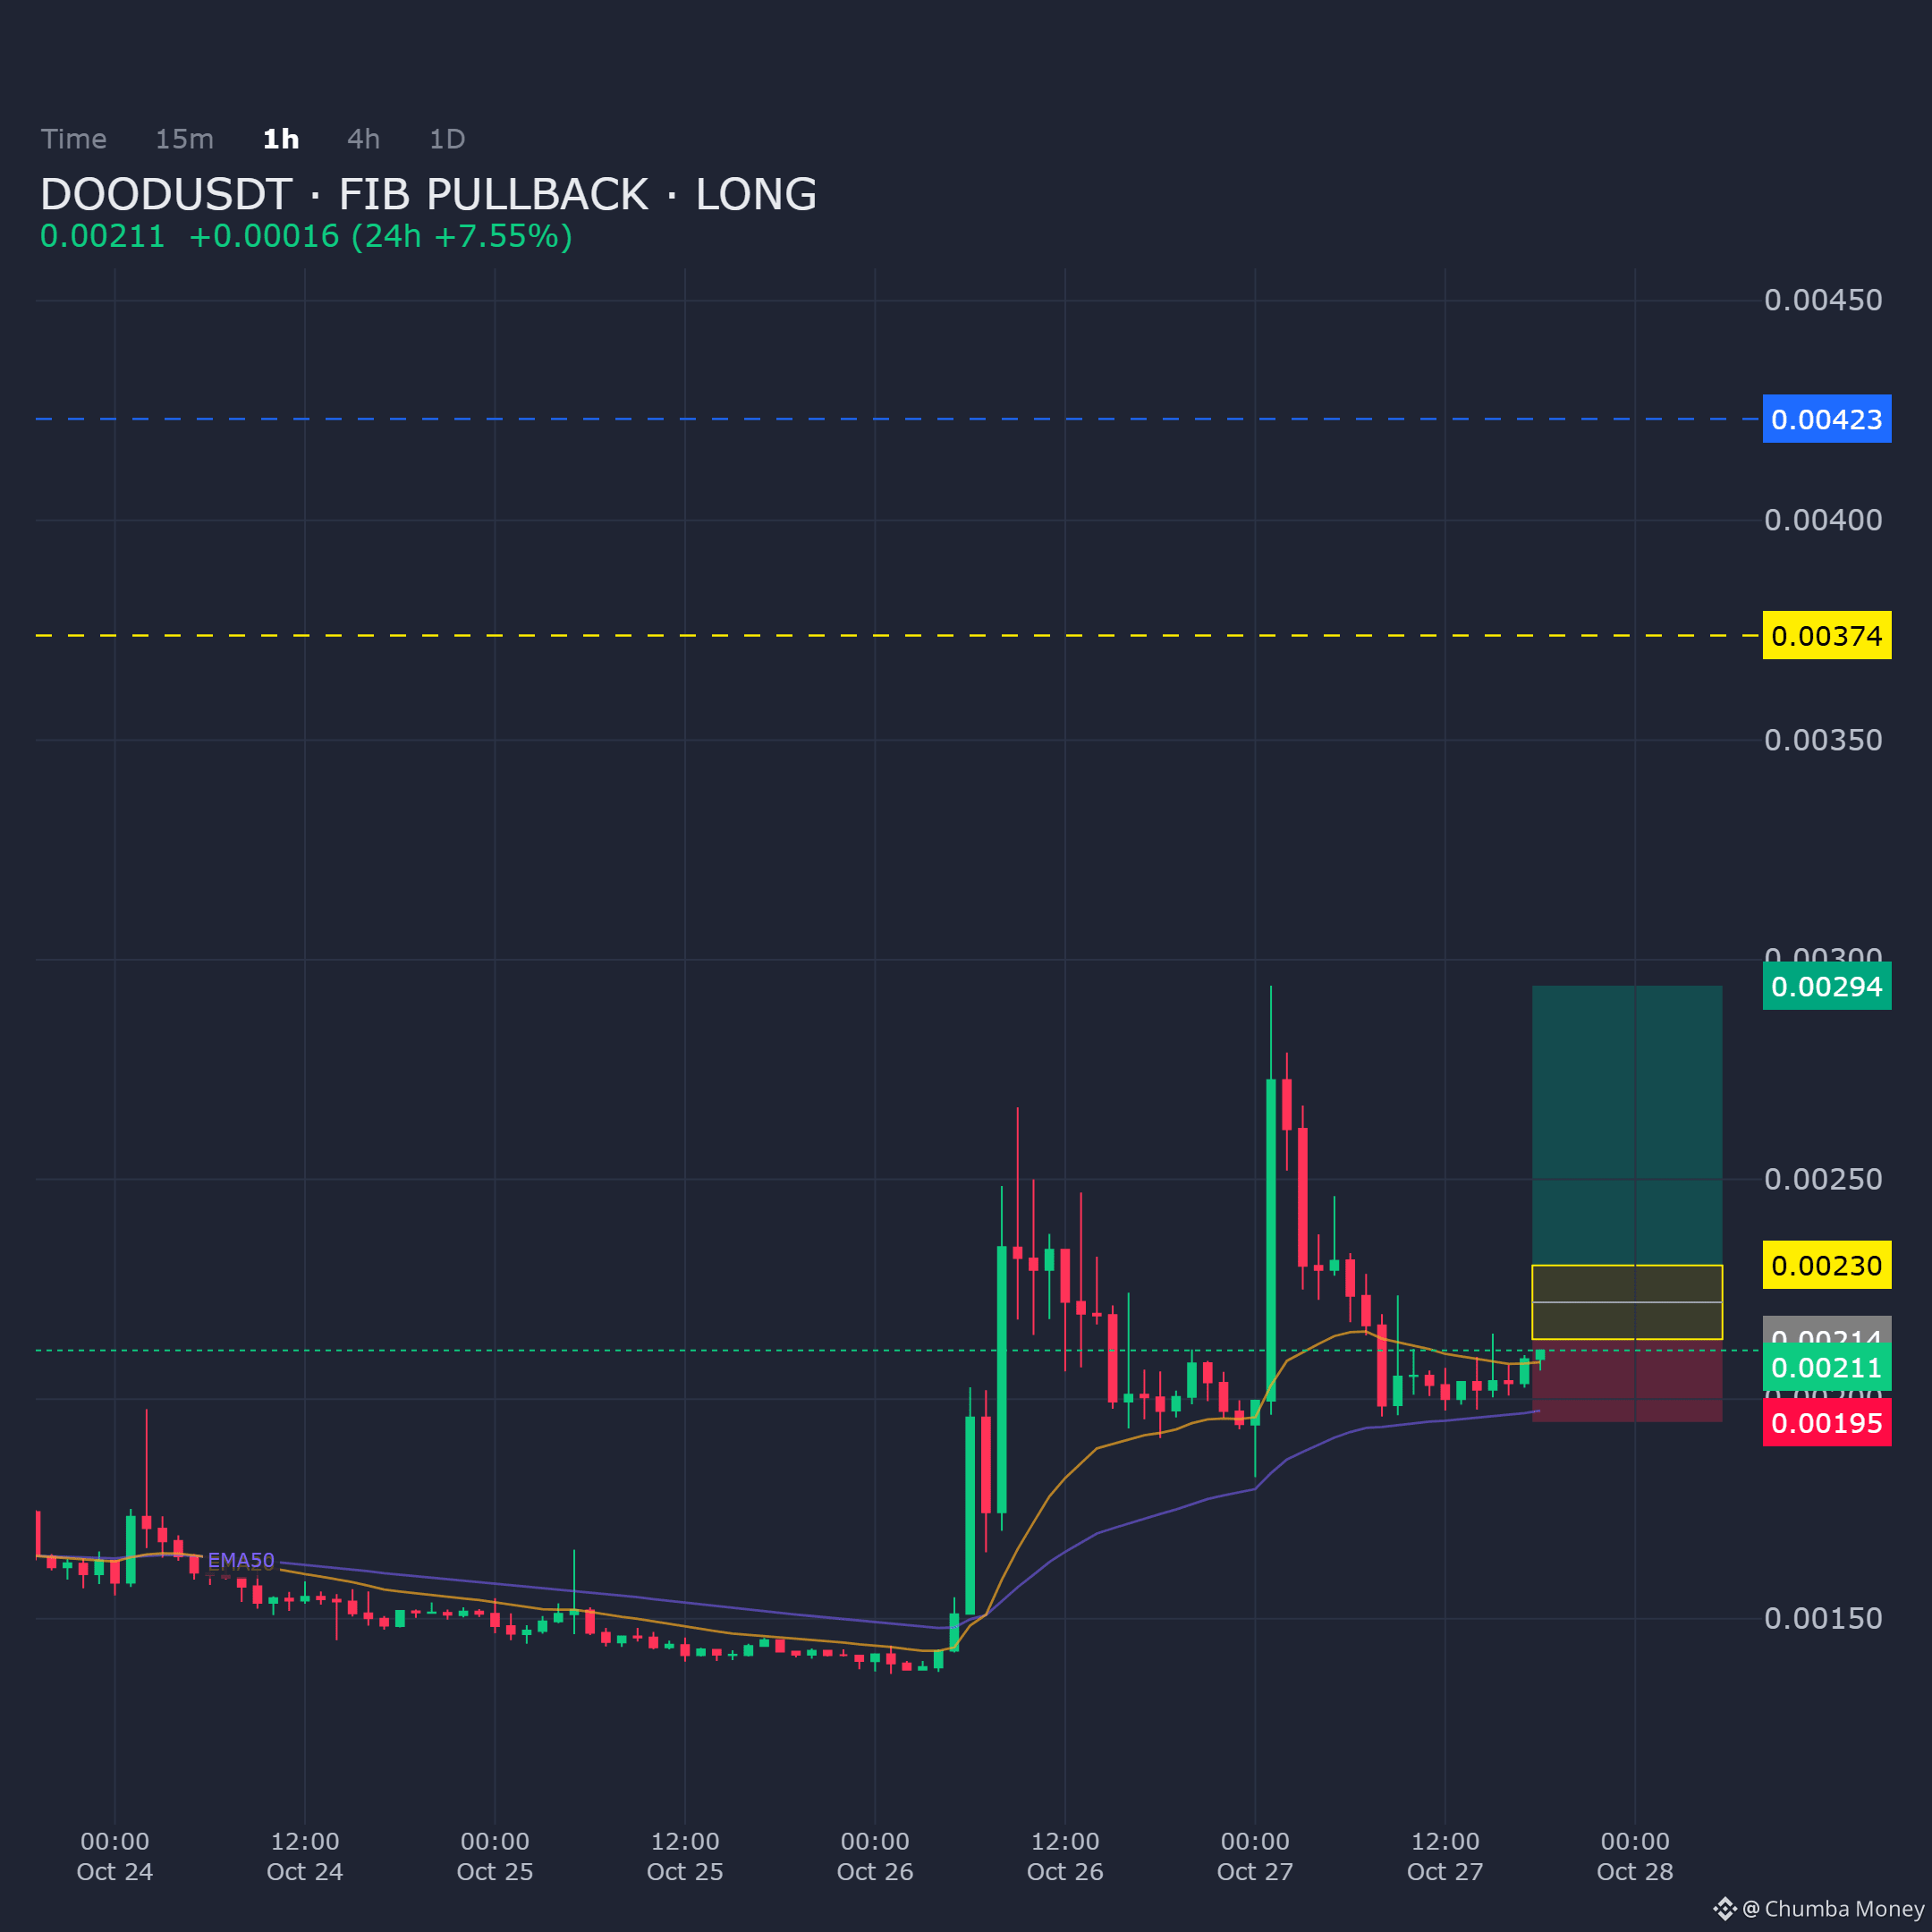
DOODUSDT on the 1H shows a pullback into a Fibonacci demand zone; bias remains long provided this support holds.
Entry: 0.002136 - 0.002304
Targets: TP1: 0.002941, TP2: 0.003738, TP3: 0.004231
Stop Loss: 0.001948
$DOOD
DOODUSDT on the 1H shows a pullback into a Fibonacci demand zone; bias remains long provided this support holds.
Entry: 0.002136 - 0.002304
Targets: TP1: 0.002941, TP2: 0.003738, TP3: 0.004231
Stop Loss: 0.001948
$DOOD
Entry: 0.002136 - 0.002304
Targets: TP1: 0.002941, TP2: 0.003738, TP3: 0.004231
Stop Loss: 0.001948
$DOOD
32
·
--
Übersetzung ansehen
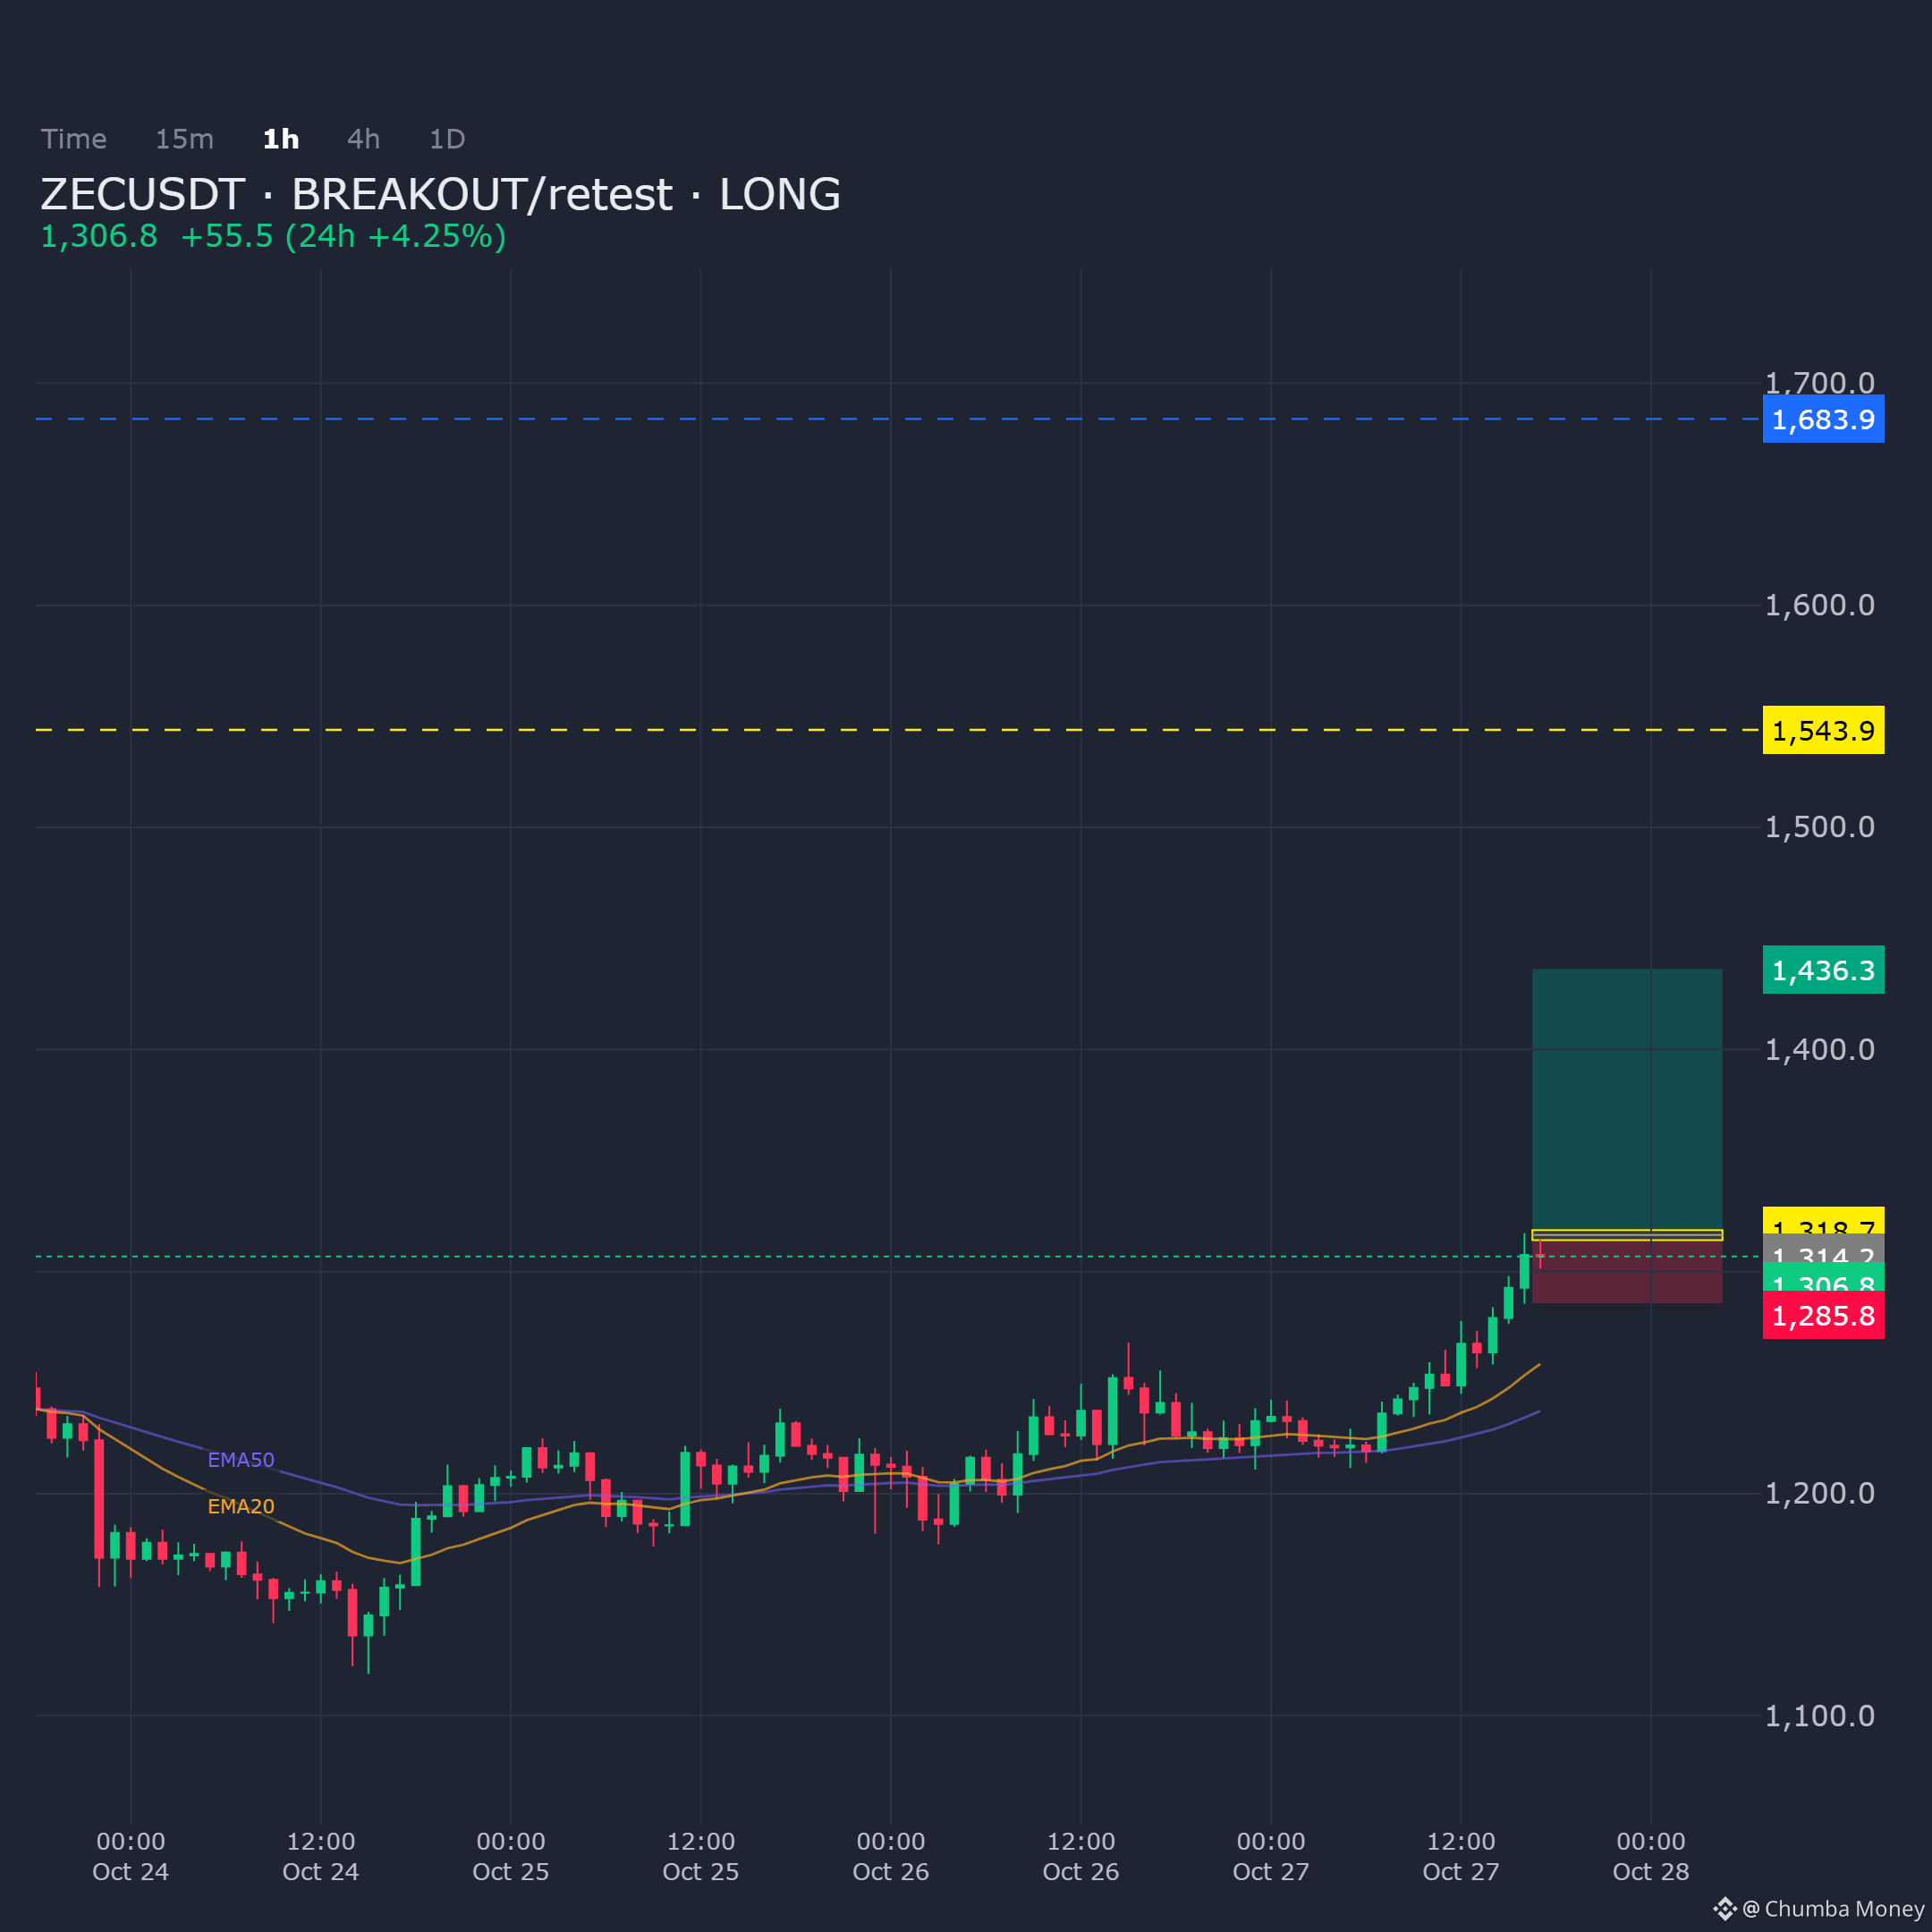
ZECUSDT on the 1H shows confluence forming for a breakout-retest long setup. Price is approaching the key demand zone where structure aligns.
Entry: 1314.2 - 1318.7
Targets: TP1: 1436.3, TP2: 1543.9, TP3: 1683.9
Stop Loss: 1285.8
$ZEC
ZECUSDT on the 1H shows confluence forming for a breakout-retest long setup. Price is approaching the key demand zone where structure aligns.
Entry: 1314.2 - 1318.7
Targets: TP1: 1436.3, TP2: 1543.9, TP3: 1683.9
Stop Loss: 1285.8
$ZEC
Entry: 1314.2 - 1318.7
Targets: TP1: 1436.3, TP2: 1543.9, TP3: 1683.9
Stop Loss: 1285.8
$ZEC
58
·
--
Übersetzung ansehen
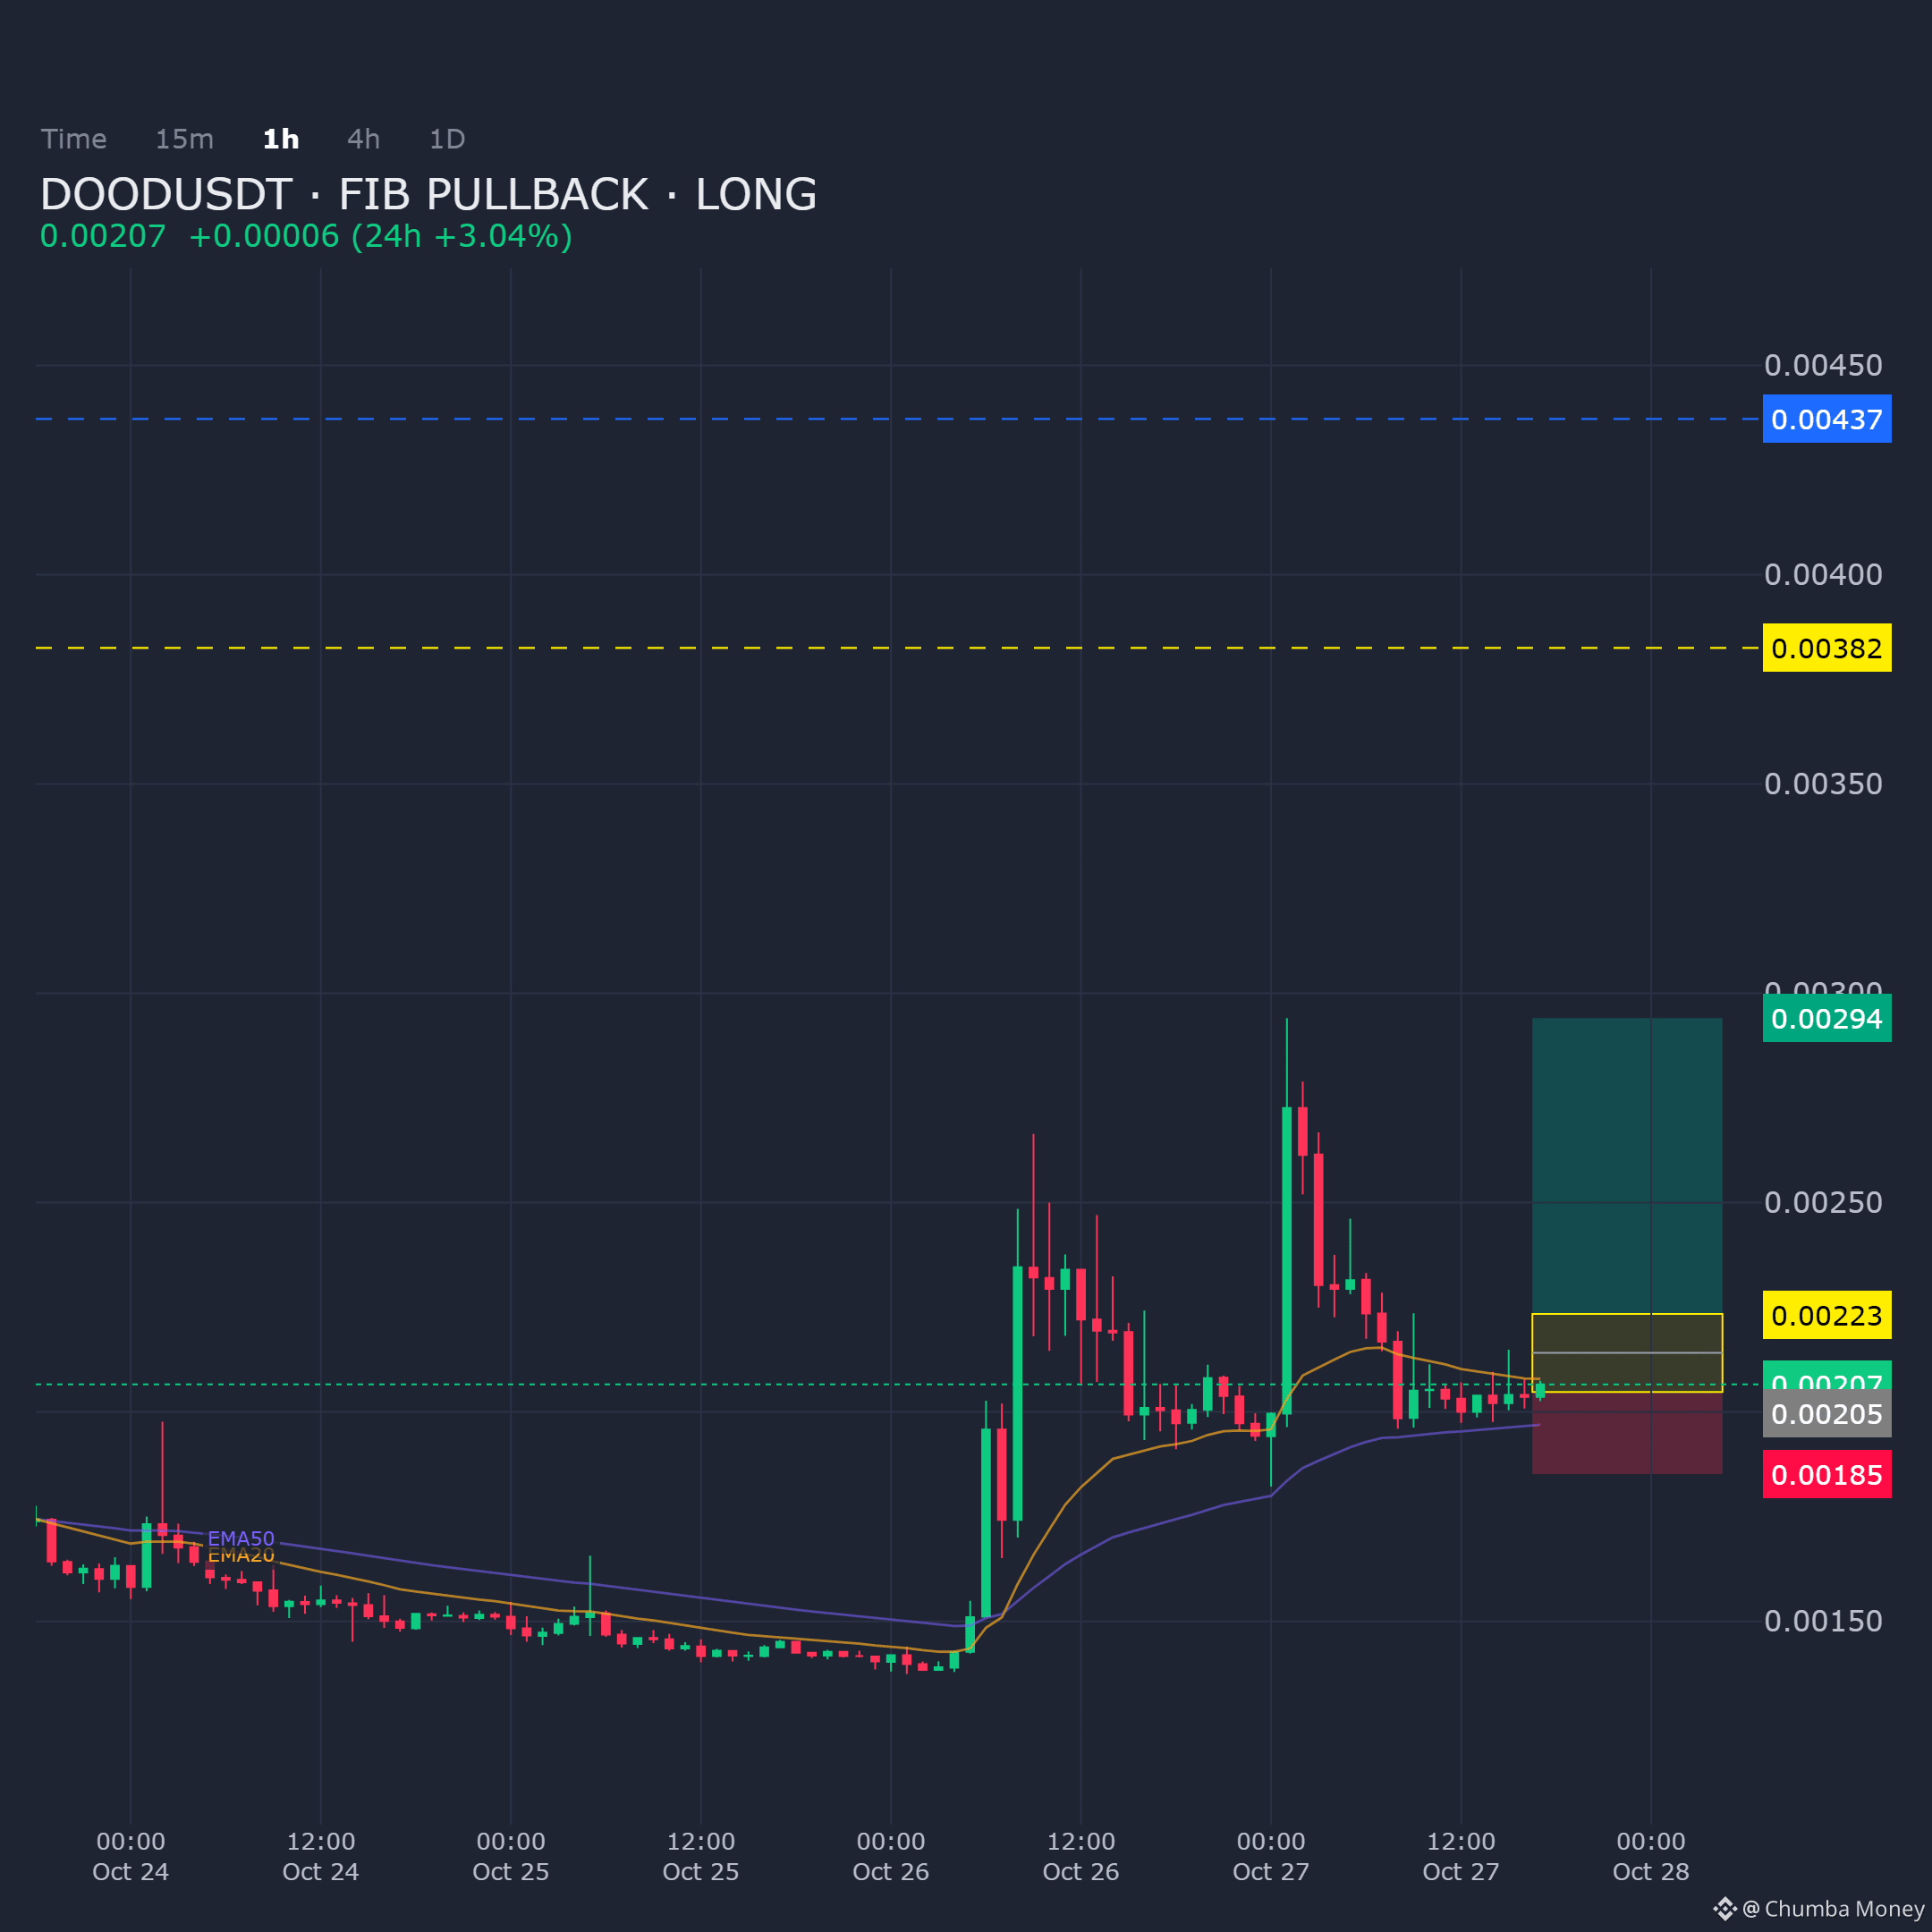
DOODUSDT on the 1H is pulling back into a defined demand zone following a fib retracement. The bias remains long as long as this support area continues to hold.
Entry: 0.002048 - 0.002234
Targets: TP1: 0.002941, TP2: 0.003825, TP3: 0.004372
Stop Loss: 0.001852
$DOOD
DOODUSDT on the 1H is pulling back into a defined demand zone following a fib retracement. The bias remains long as long as this support area continues to hold.
Entry: 0.002048 - 0.002234
Targets: TP1: 0.002941, TP2: 0.003825, TP3: 0.004372
Stop Loss: 0.001852
$DOOD
Entry: 0.002048 - 0.002234
Targets: TP1: 0.002941, TP2: 0.003825, TP3: 0.004372
Stop Loss: 0.001852
$DOOD
13
·
--
Übersetzung ansehen
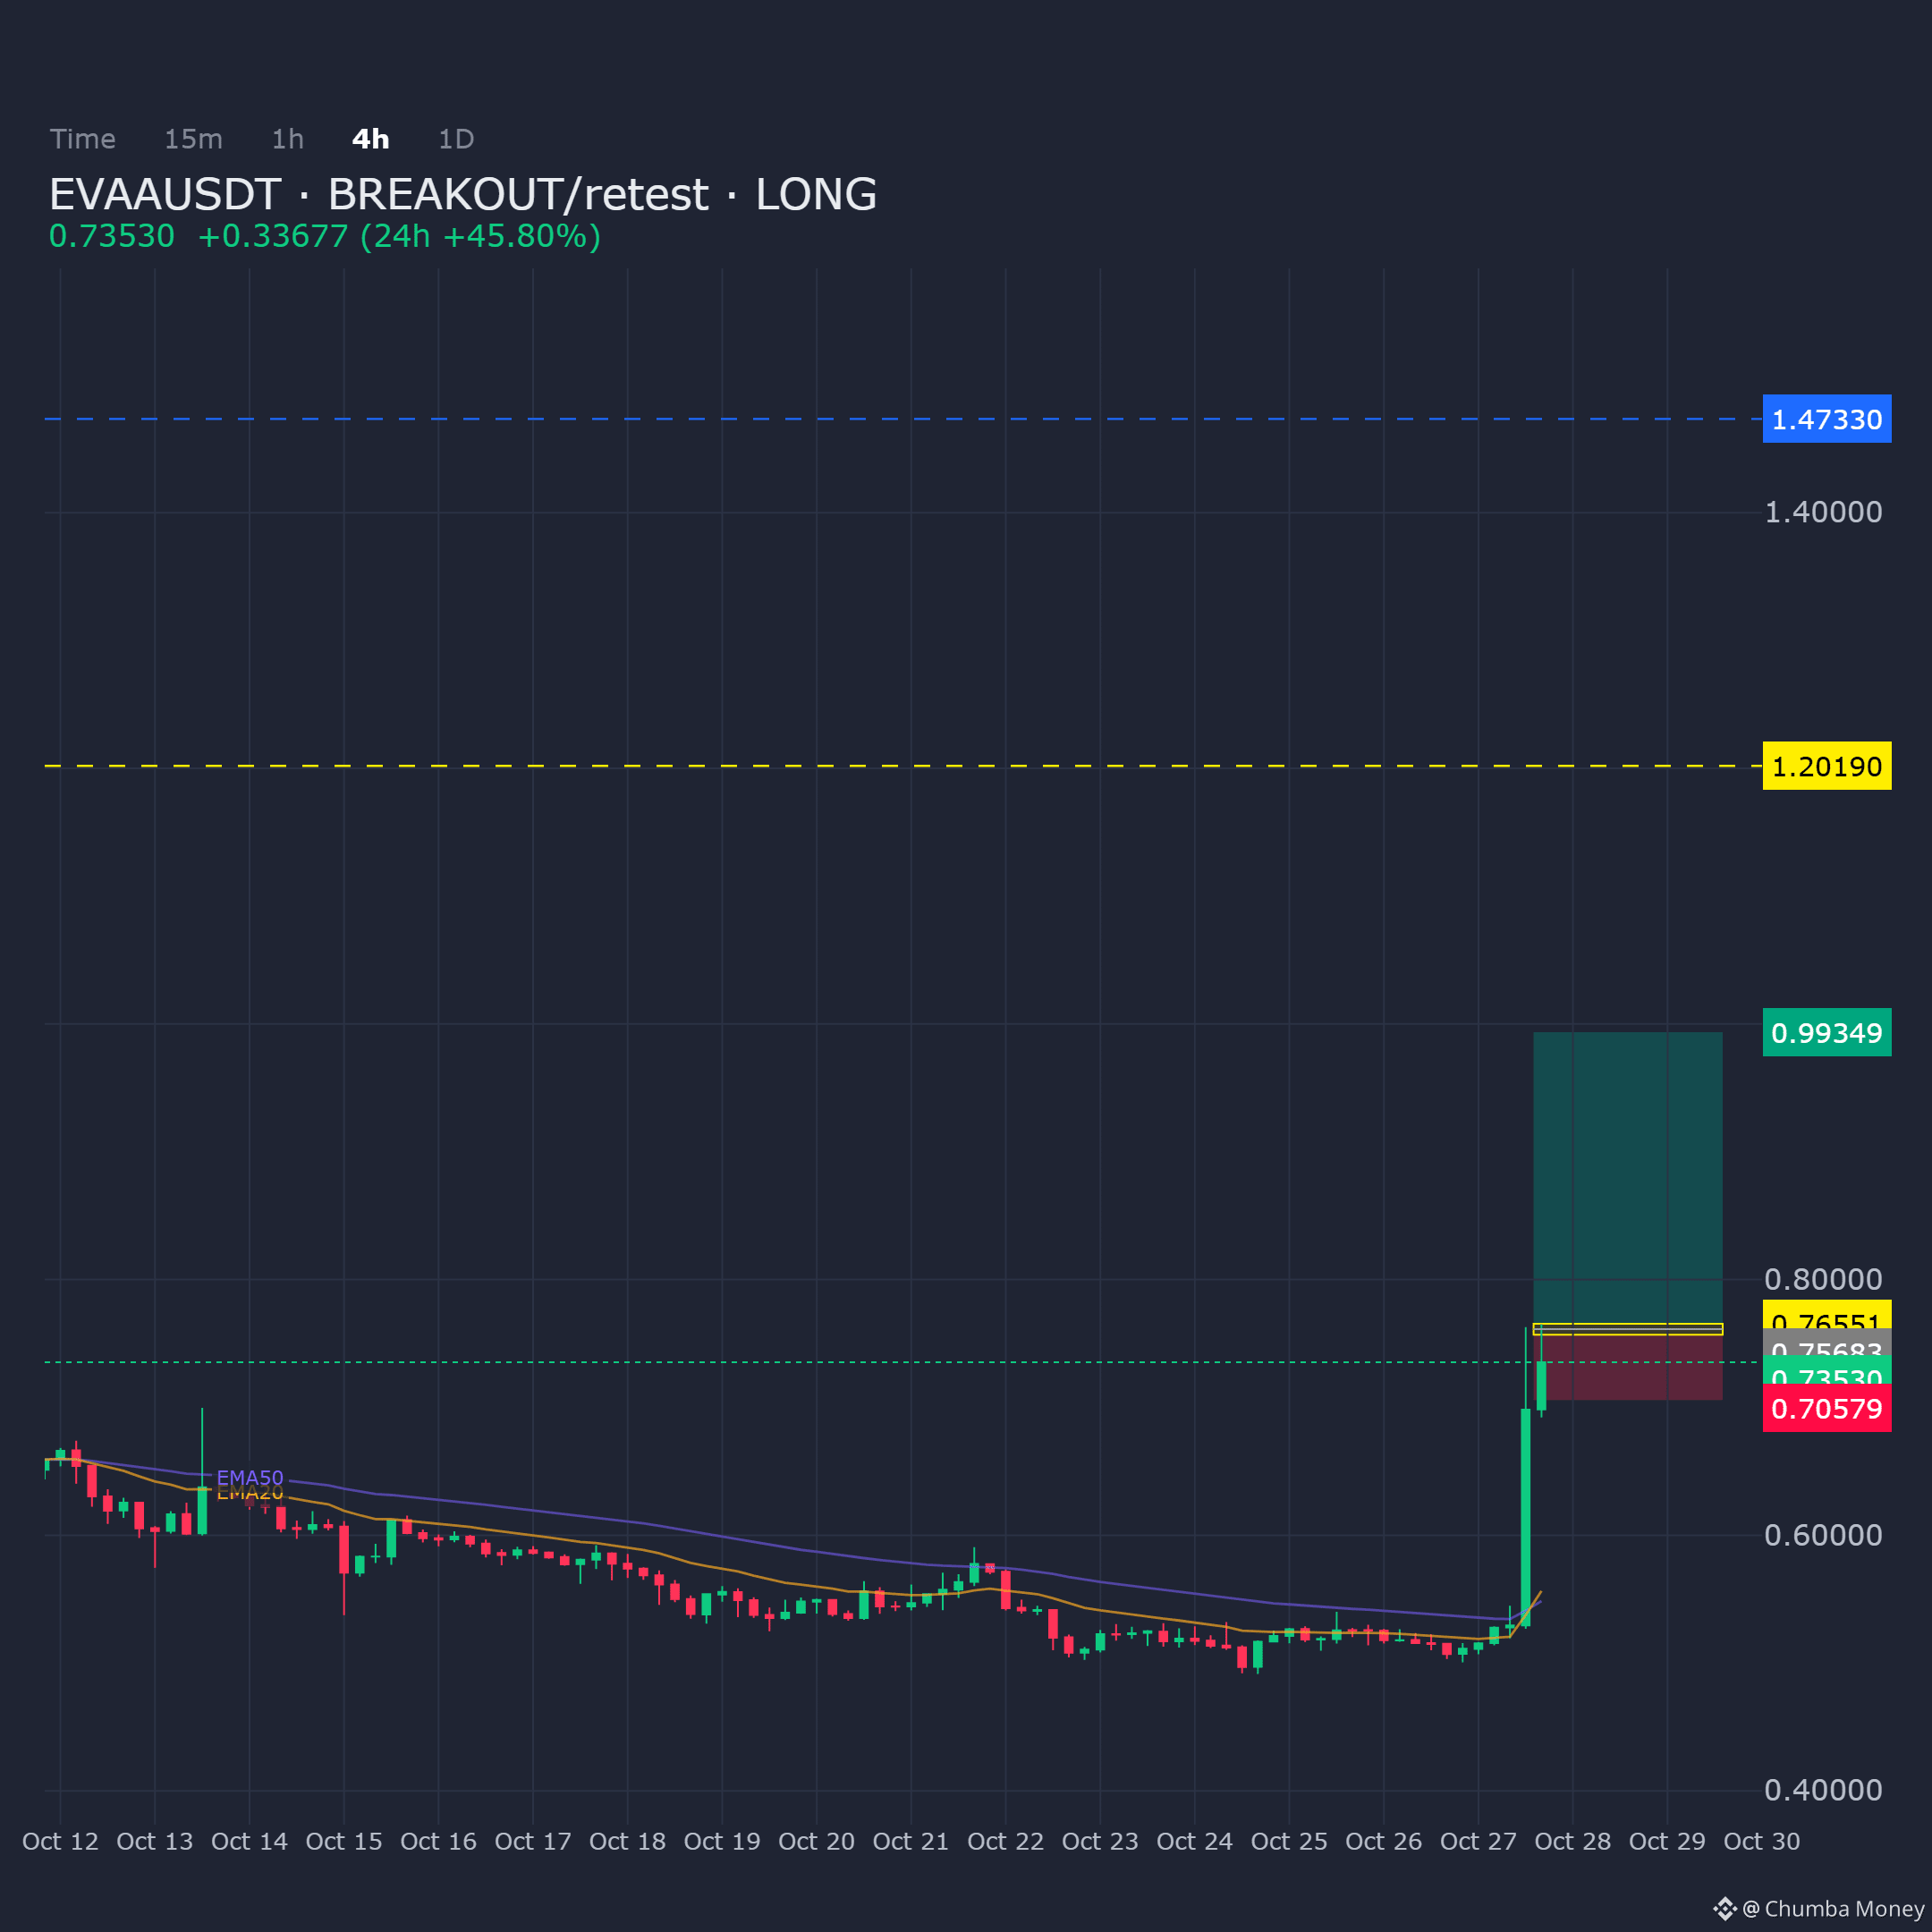
EVAAUSDT on the 4H chart is retesting a key demand zone following a breakout. Bias remains long provided this area holds support.
Entry: 0.756829 - 0.765514
Targets: TP1: 0.99349, TP2: 1.2019, TP3: 1.4733
Stop Loss: 0.705786
$EVAA
EVAAUSDT on the 4H chart is retesting a key demand zone following a breakout. Bias remains long provided this area holds support.
Entry: 0.756829 - 0.765514
Targets: TP1: 0.99349, TP2: 1.2019, TP3: 1.4733
Stop Loss: 0.705786
$EVAA
Entry: 0.756829 - 0.765514
Targets: TP1: 0.99349, TP2: 1.2019, TP3: 1.4733
Stop Loss: 0.705786
$EVAA
22
·
--
Übersetzung ansehen
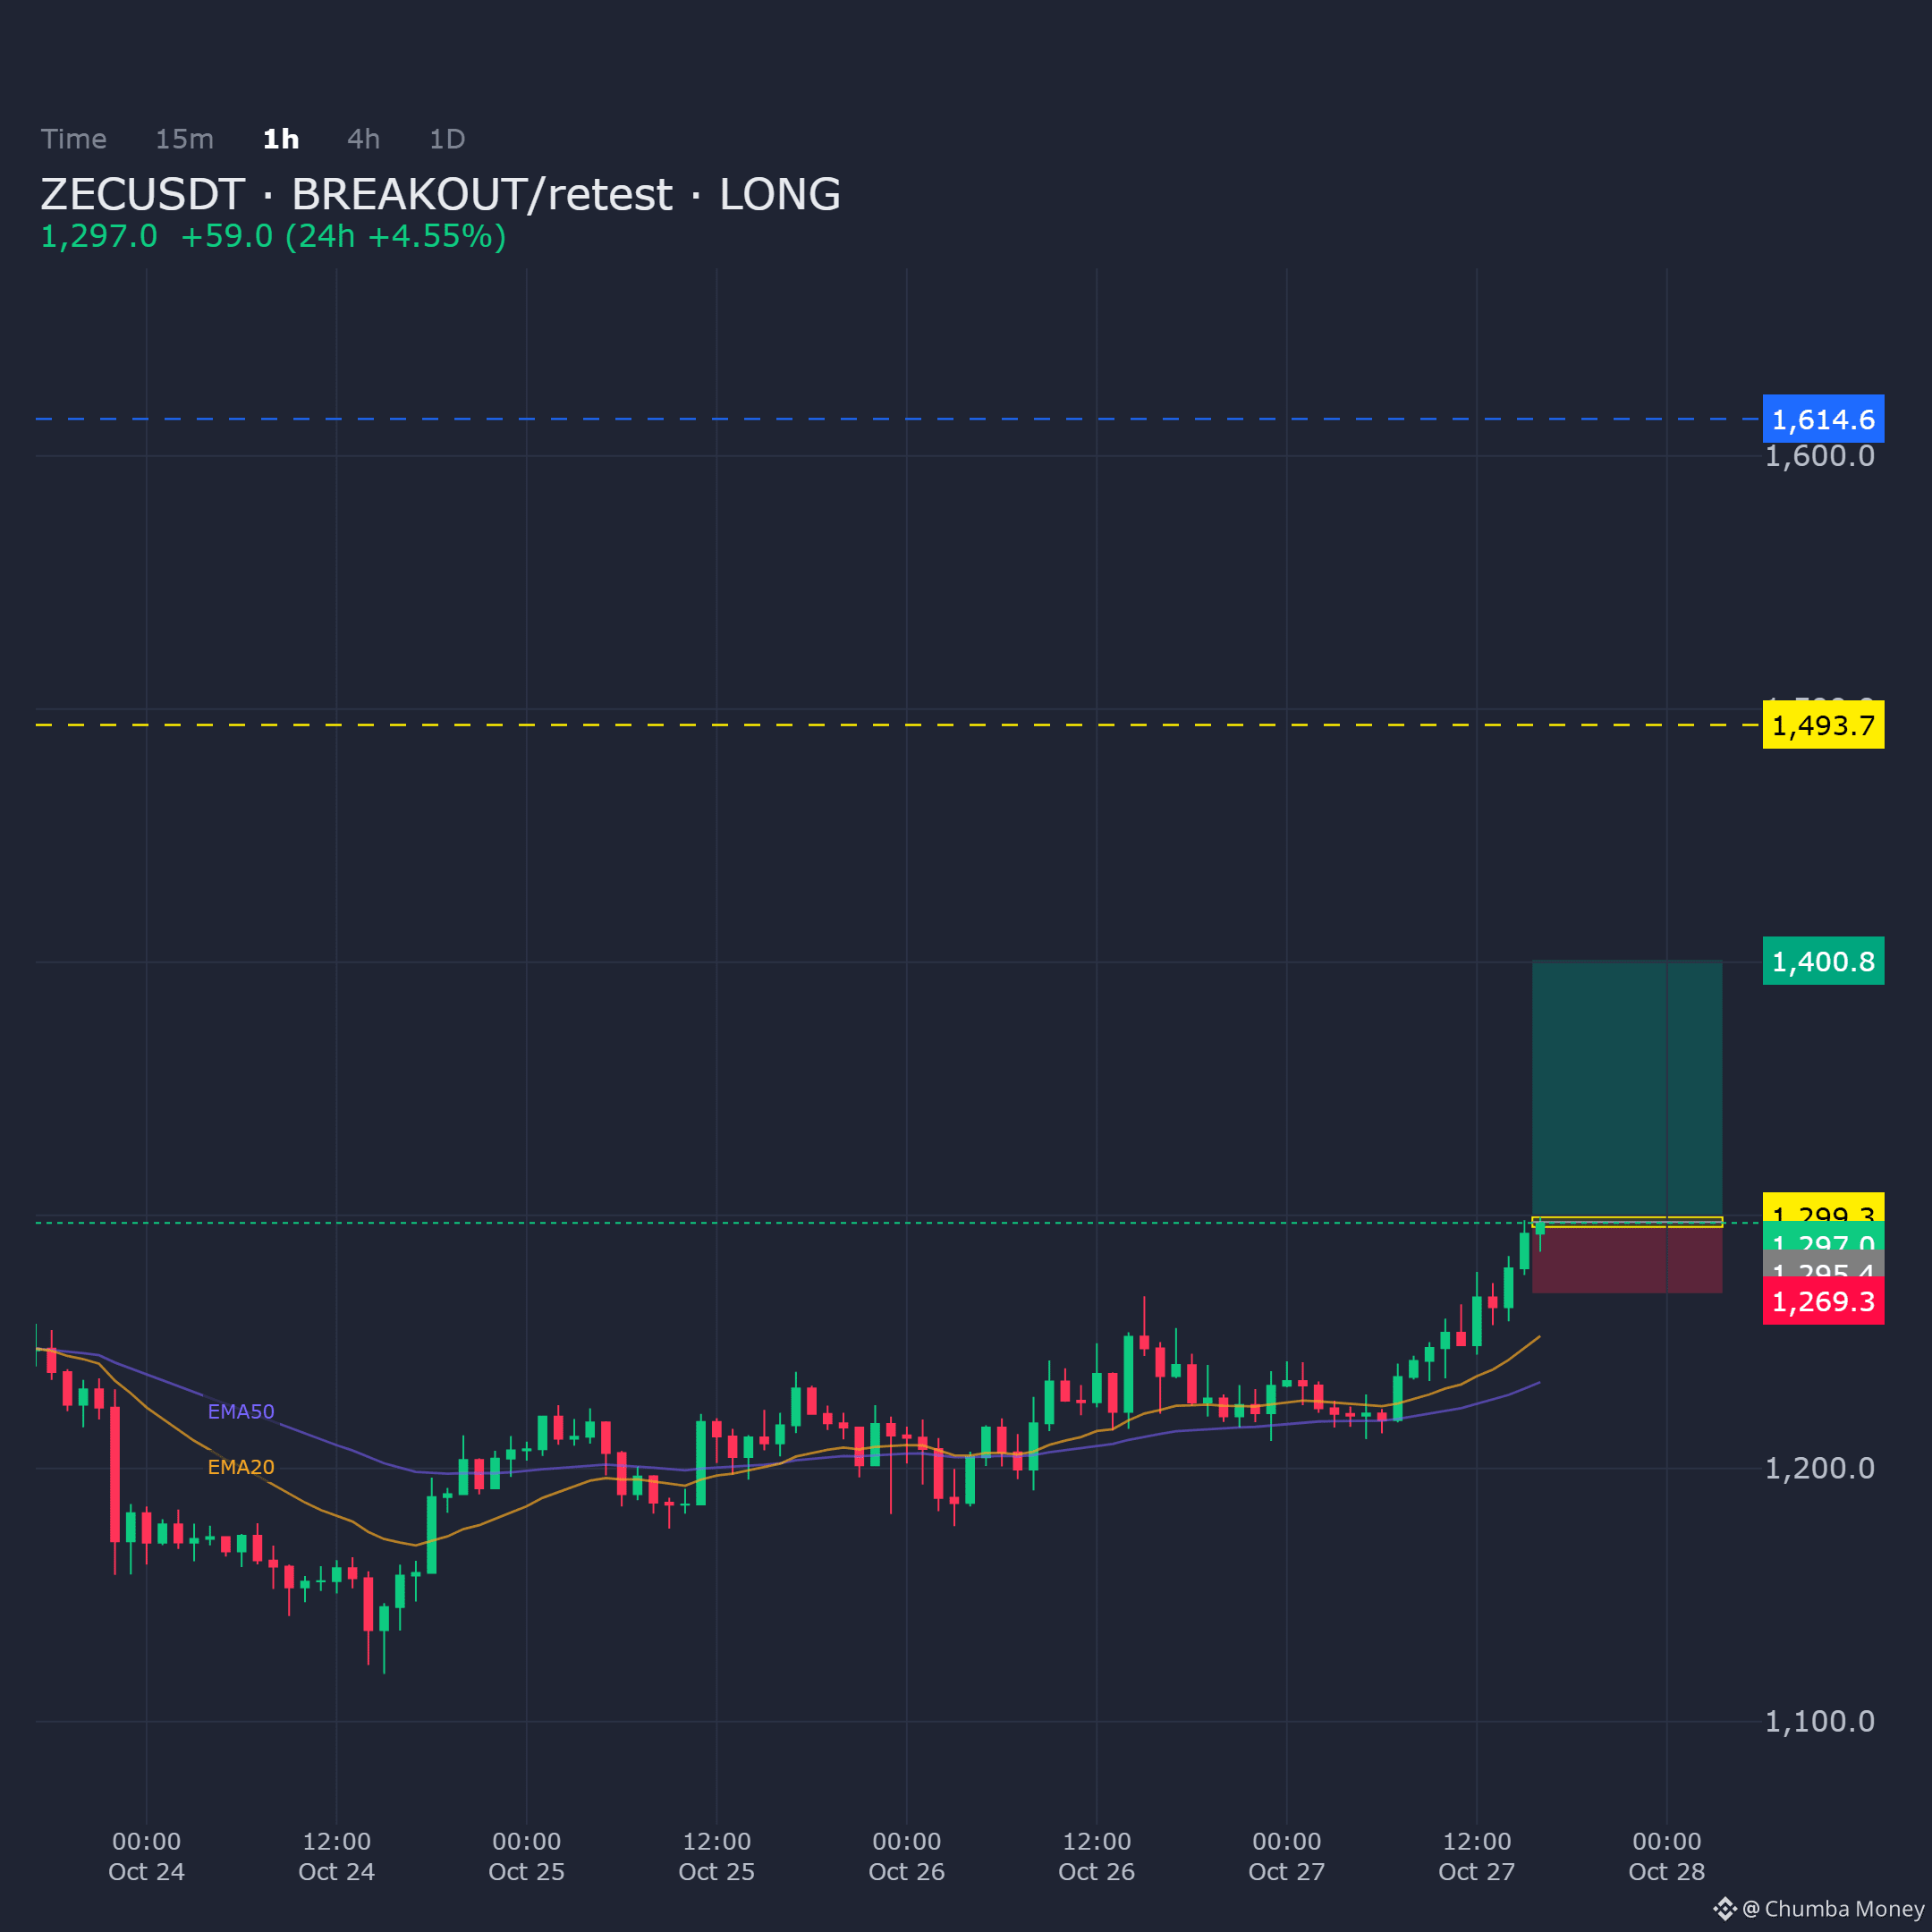
ZECUSDT on the 1H shows breakout/retest confluence at current structure. Bias remains directional long pending confirmation of the retest hold.
Entry: 1295.4 - 1299.3
Targets: TP1: 1400.8, TP2: 1493.7, TP3: 1614.6
Stop Loss: 1269.3
$ZEC
ZECUSDT on the 1H shows breakout/retest confluence at current structure. Bias remains directional long pending confirmation of the retest hold.
Entry: 1295.4 - 1299.3
Targets: TP1: 1400.8, TP2: 1493.7, TP3: 1614.6
Stop Loss: 1269.3
$ZEC
Entry: 1295.4 - 1299.3
Targets: TP1: 1400.8, TP2: 1493.7, TP3: 1614.6
Stop Loss: 1269.3
$ZEC
16
·
--
Übersetzung ansehen
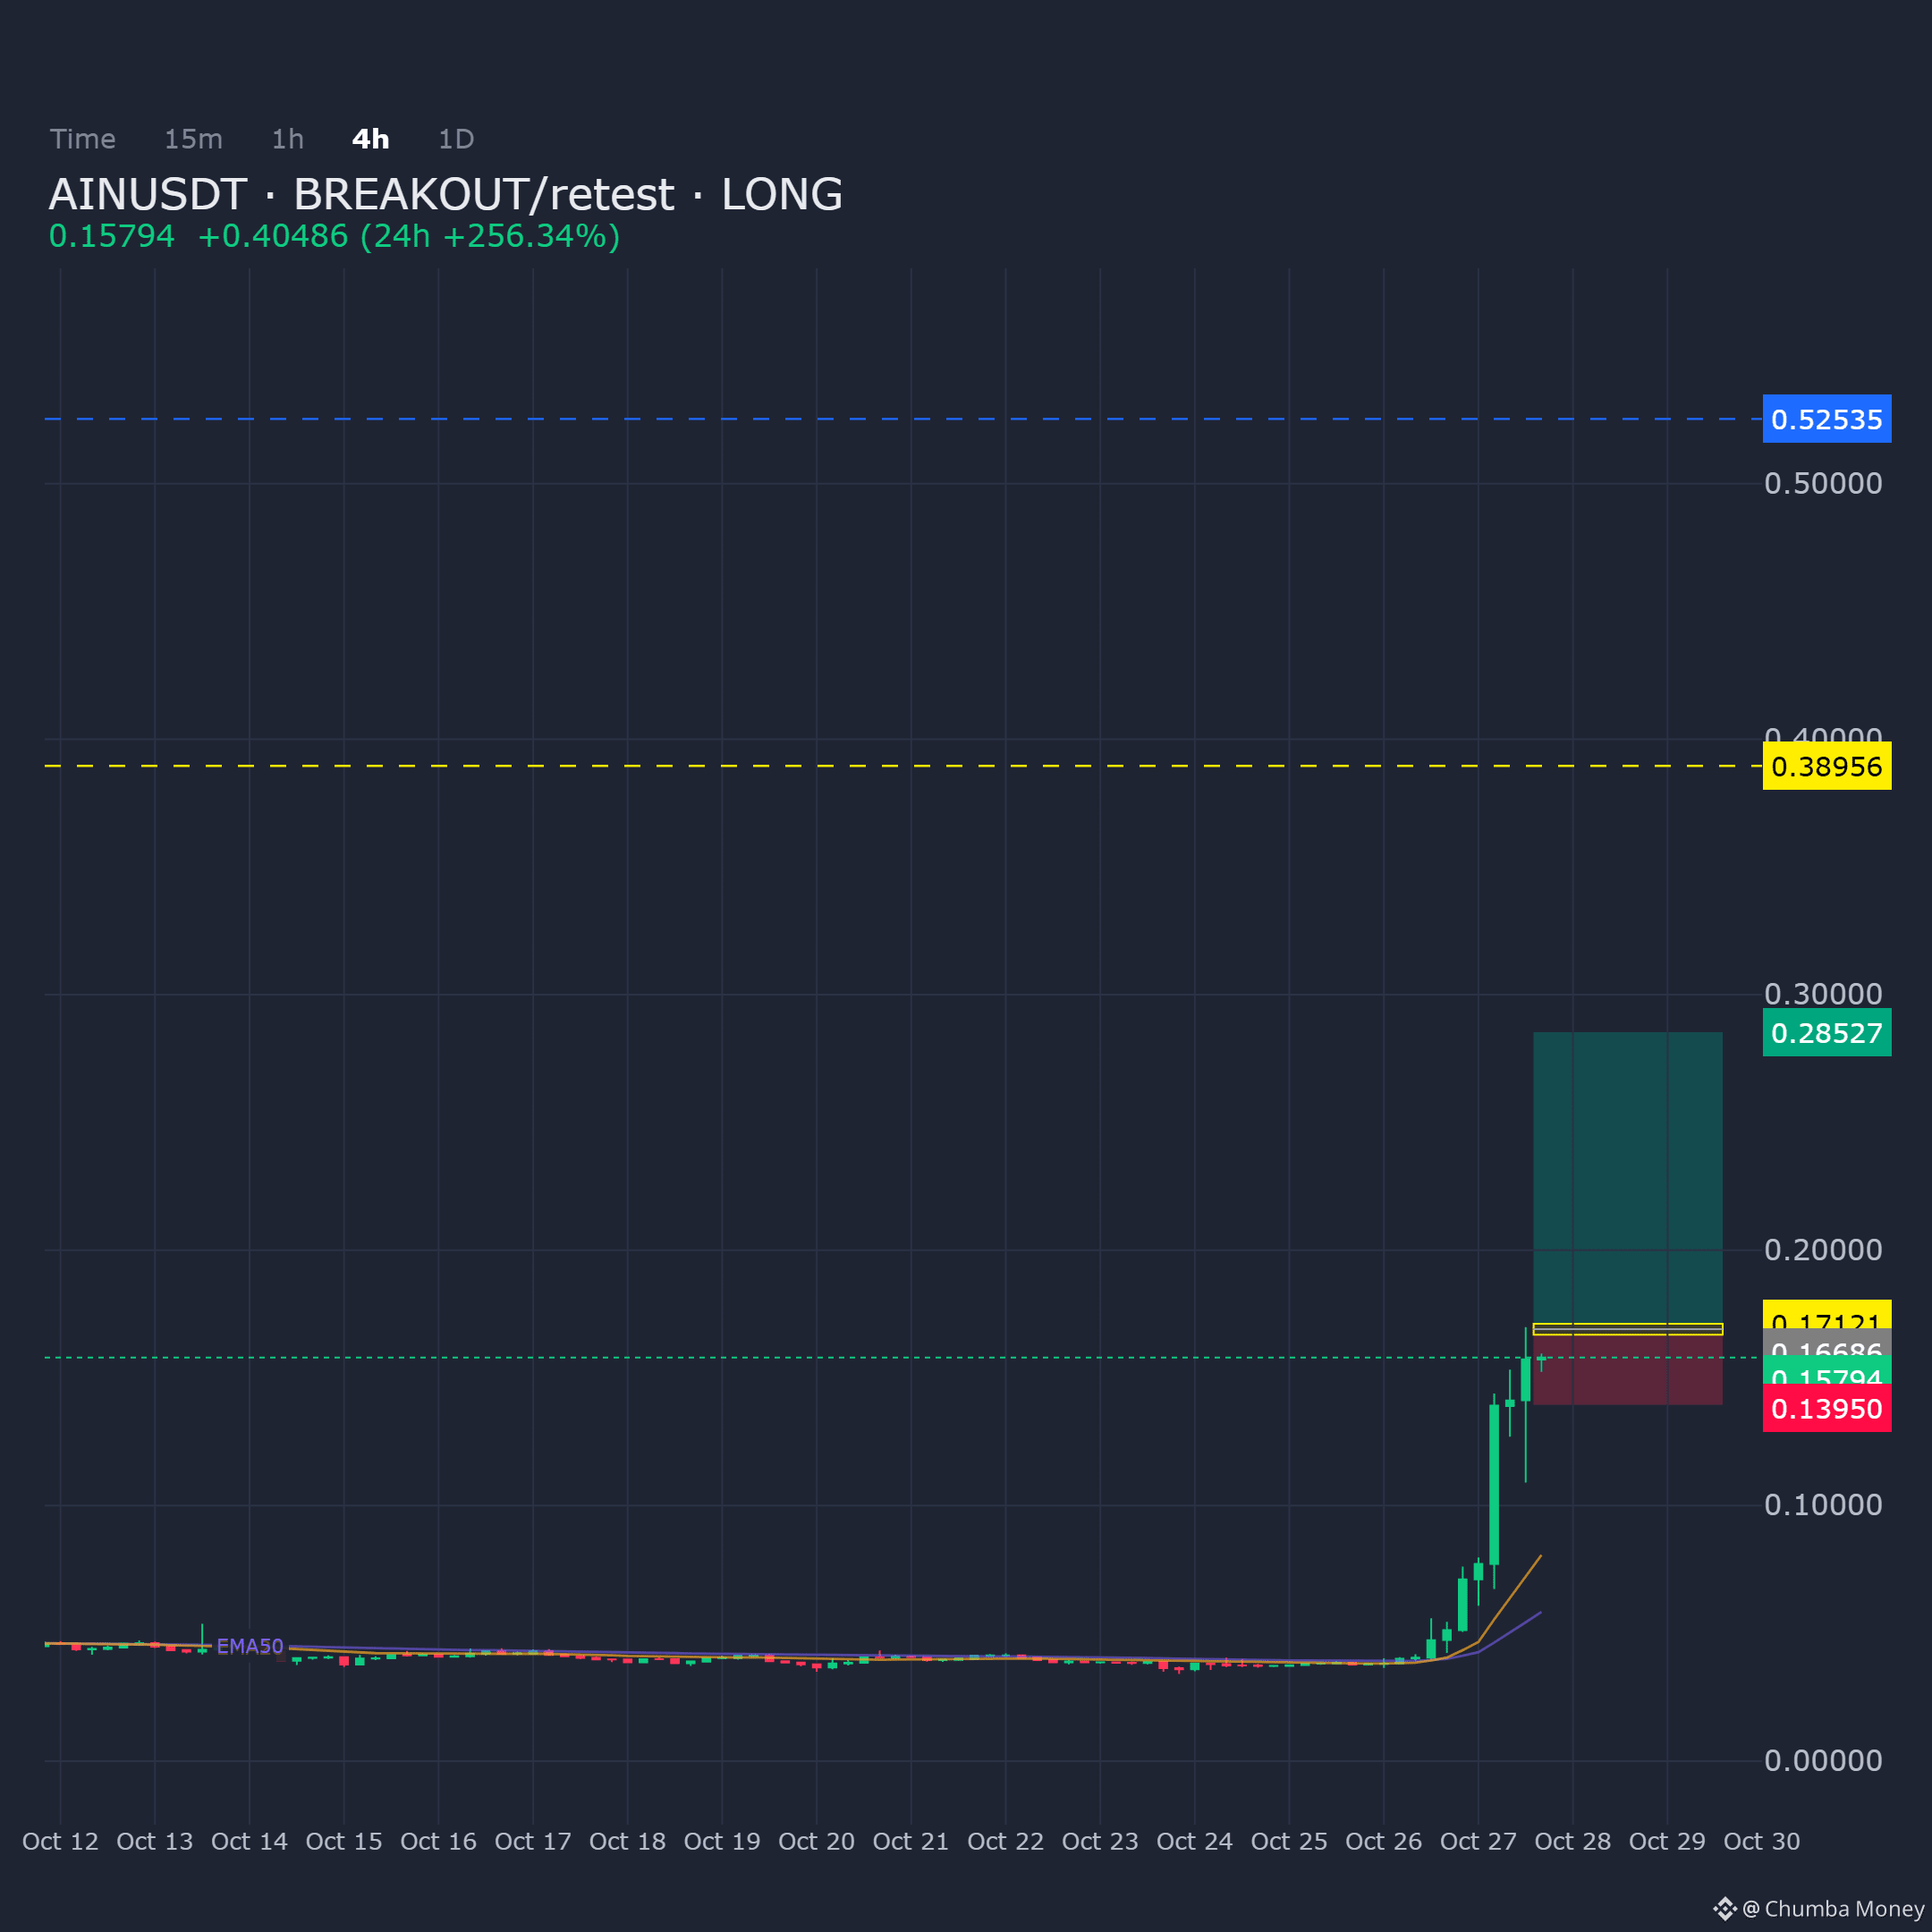
AINUSDT 4H structure shows price retracing into the demand zone with the bullish bias intact as long as the area remains undisturbed.
Entry: 0.166863 - 0.171208
Targets: TP1: 0.285272, TP2: 0.389558, TP3: 0.525348
Stop Loss: 0.139496
$AIN
AINUSDT 4H structure shows price retracing into the demand zone with the bullish bias intact as long as the area remains undisturbed.
Entry: 0.166863 - 0.171208
Targets: TP1: 0.285272, TP2: 0.389558, TP3: 0.525348
Stop Loss: 0.139496
$AIN
Entry: 0.166863 - 0.171208
Targets: TP1: 0.285272, TP2: 0.389558, TP3: 0.525348
Stop Loss: 0.139496
$AIN
75
·
--
Übersetzung ansehen
Position sizing under uncertainty: risk a fixed percentage of capital per trade, not a fixed dollar amount. If BTC is at $80,372 and you risk 1% of a $10,000 account, your stop-loss distance determines position size, not the asset price. A wider stop means a smaller position; a tighter stop means a larger one. This keeps drawdowns comparable across BTC, ETH, or SOL regardless of volatility. The trade-off is that tight stops can get shaken out by normal crypto noise, while wide stops require tiny sizes that may feel meaningless. Size for the worst case, not the best case. Observation: BTC is down 3.3% over 7 days per current market data. Interpretation: sizing rules matter most when prices move against you.
Position sizing under uncertainty: risk a fixed percentage of capital per trade, not a fixed dollar amount. If BTC is at $80,372 and you risk 1% of a $10,000 account, your stop-loss distance determines position size, not the asset price. A wider stop means a smaller position; a tighter stop means a larger one. This keeps drawdowns comparable across BTC, ETH, or SOL regardless of volatility. The trade-off is that tight stops can get shaken out by normal crypto noise, while wide stops require tiny sizes that may feel meaningless. Size for the worst case, not the best case. Observation: BTC is down 3.3% over 7 days per current market data. Interpretation: sizing rules matter most when prices move against you.
13
·
--
Übersetzung ansehen
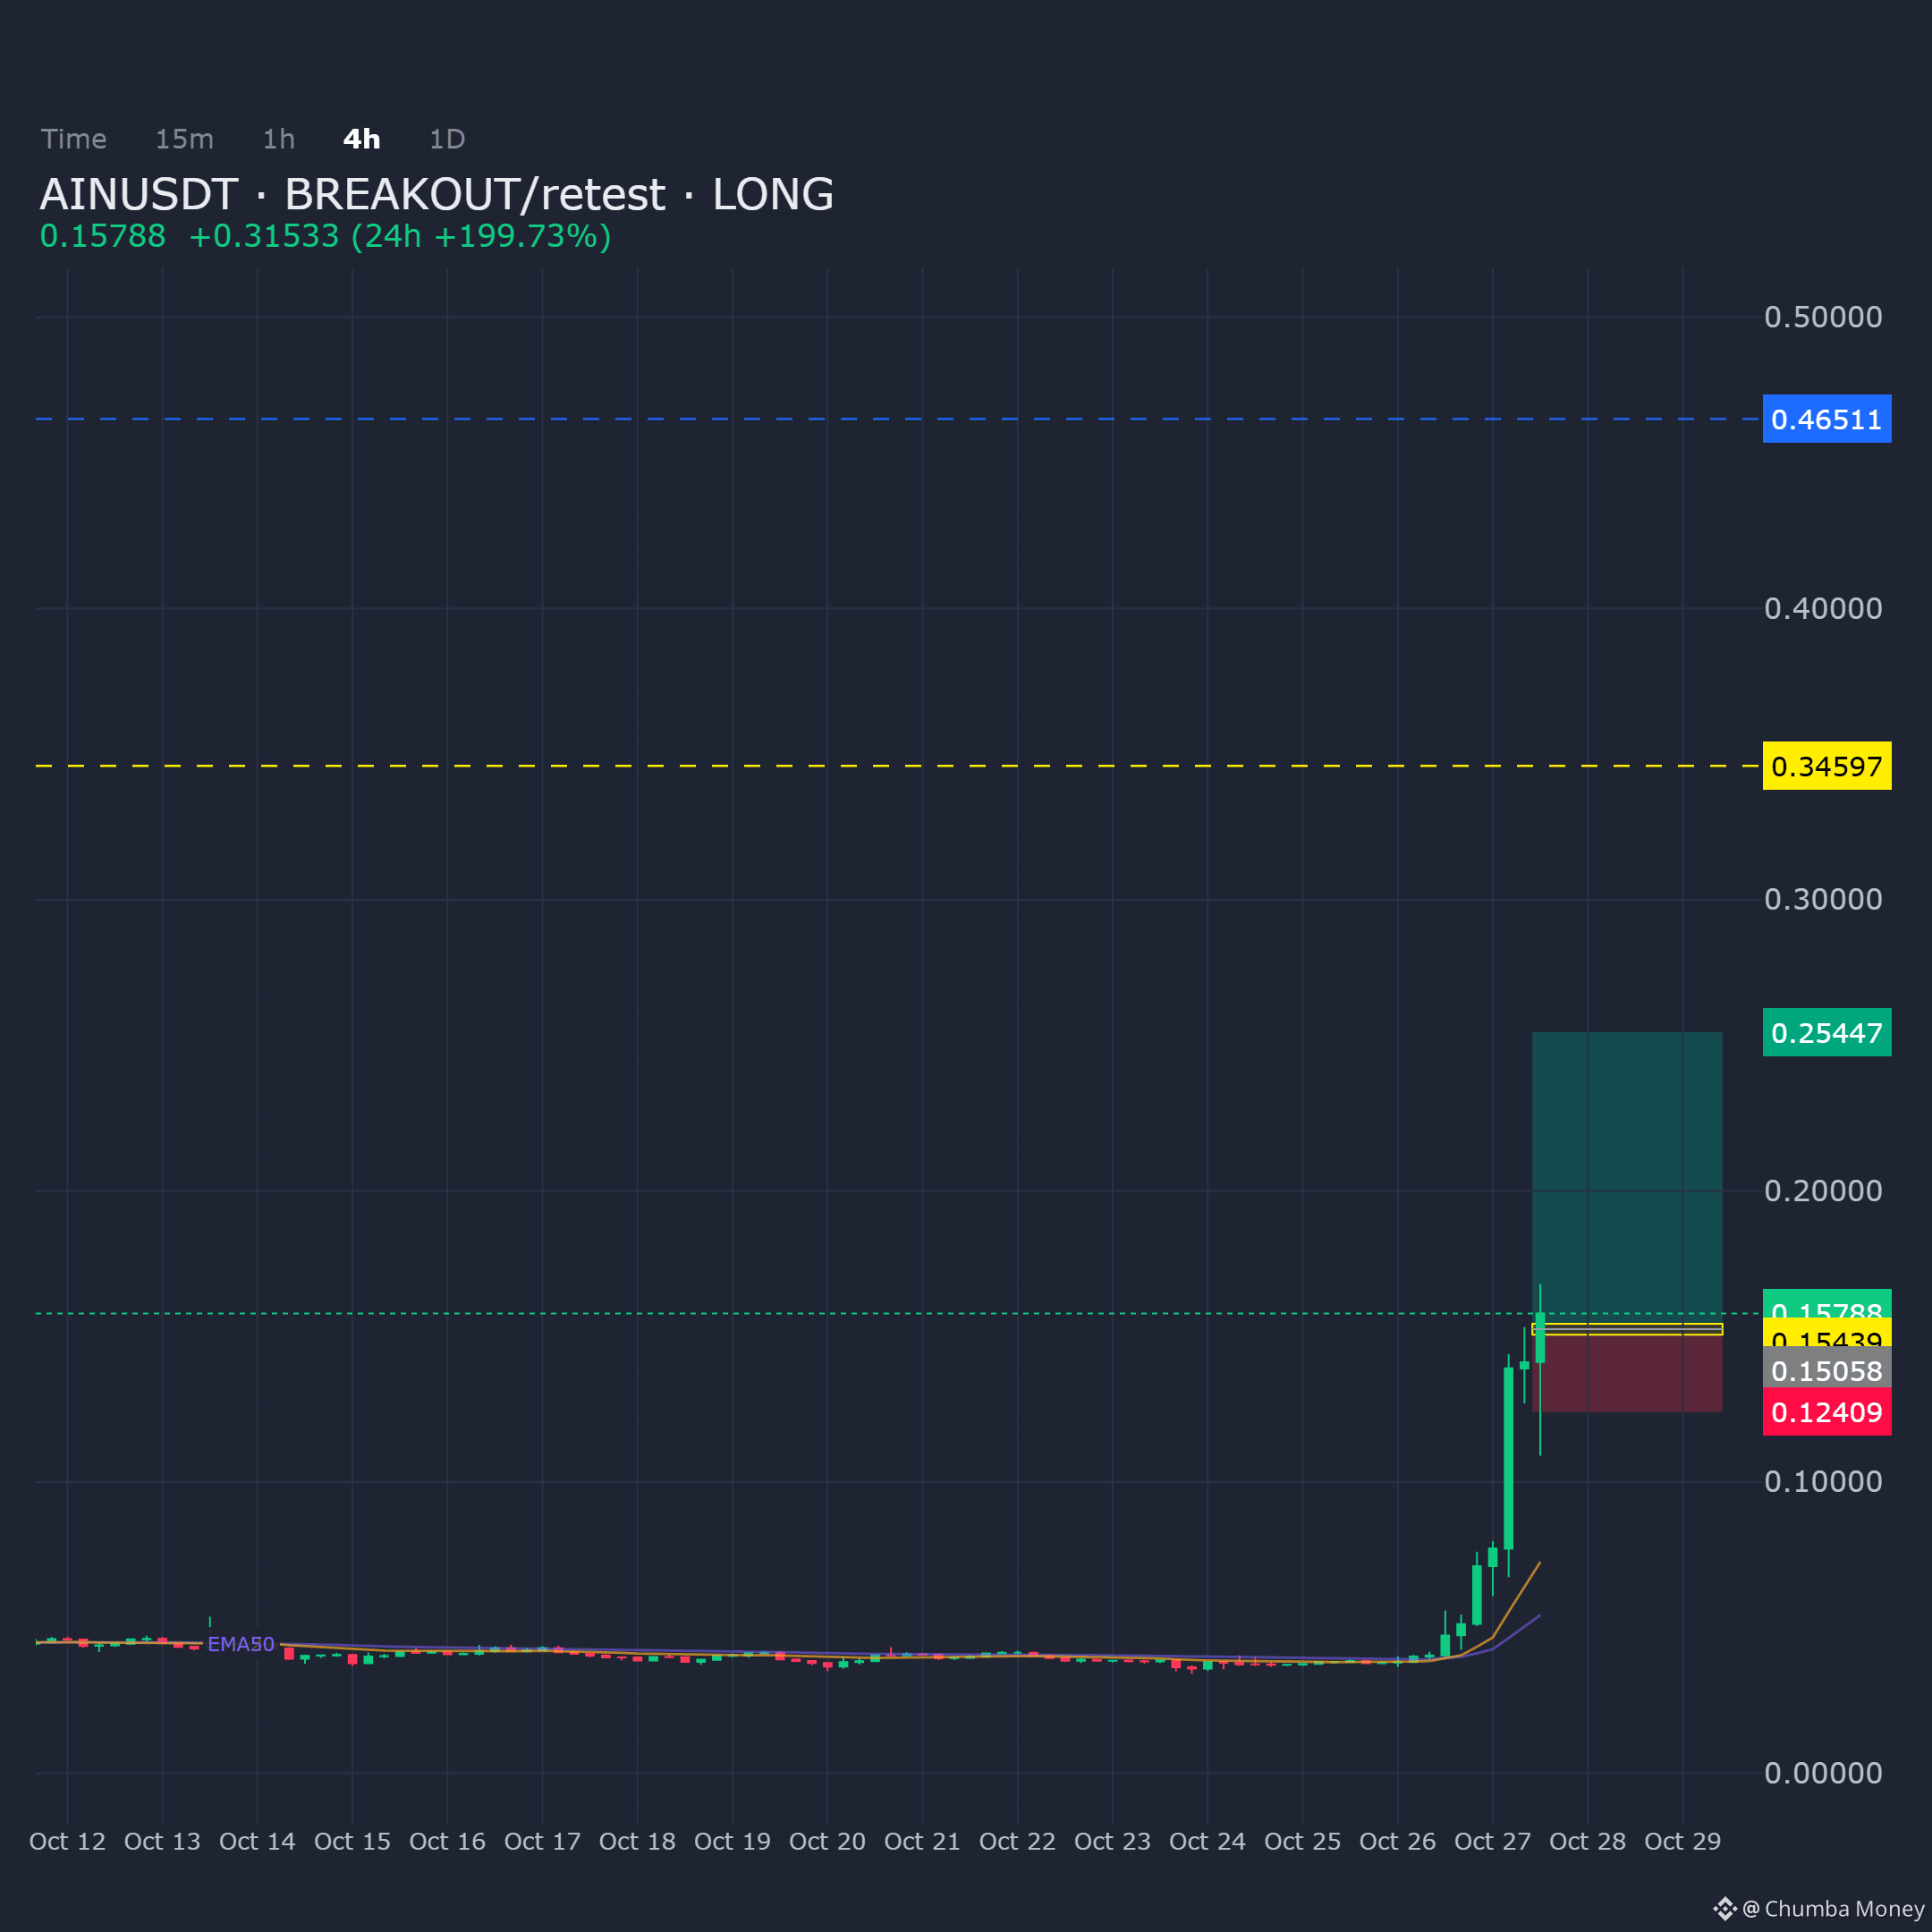
AINUSDT on the 4H is testing the demand zone after the breakout; long bias remains valid as long as this area holds.
Entry: 0.150579 - 0.154391
Targets: TP1: 0.254469, TP2: 0.345969, TP3: 0.465109
Stop Loss: 0.124089
$AIN
AINUSDT on the 4H is testing the demand zone after the breakout; long bias remains valid as long as this area holds.
Entry: 0.150579 - 0.154391
Targets: TP1: 0.254469, TP2: 0.345969, TP3: 0.465109
Stop Loss: 0.124089
$AIN
Entry: 0.150579 - 0.154391
Targets: TP1: 0.254469, TP2: 0.345969, TP3: 0.465109
Stop Loss: 0.124089
$AIN
38
·
--
Übersetzung ansehen
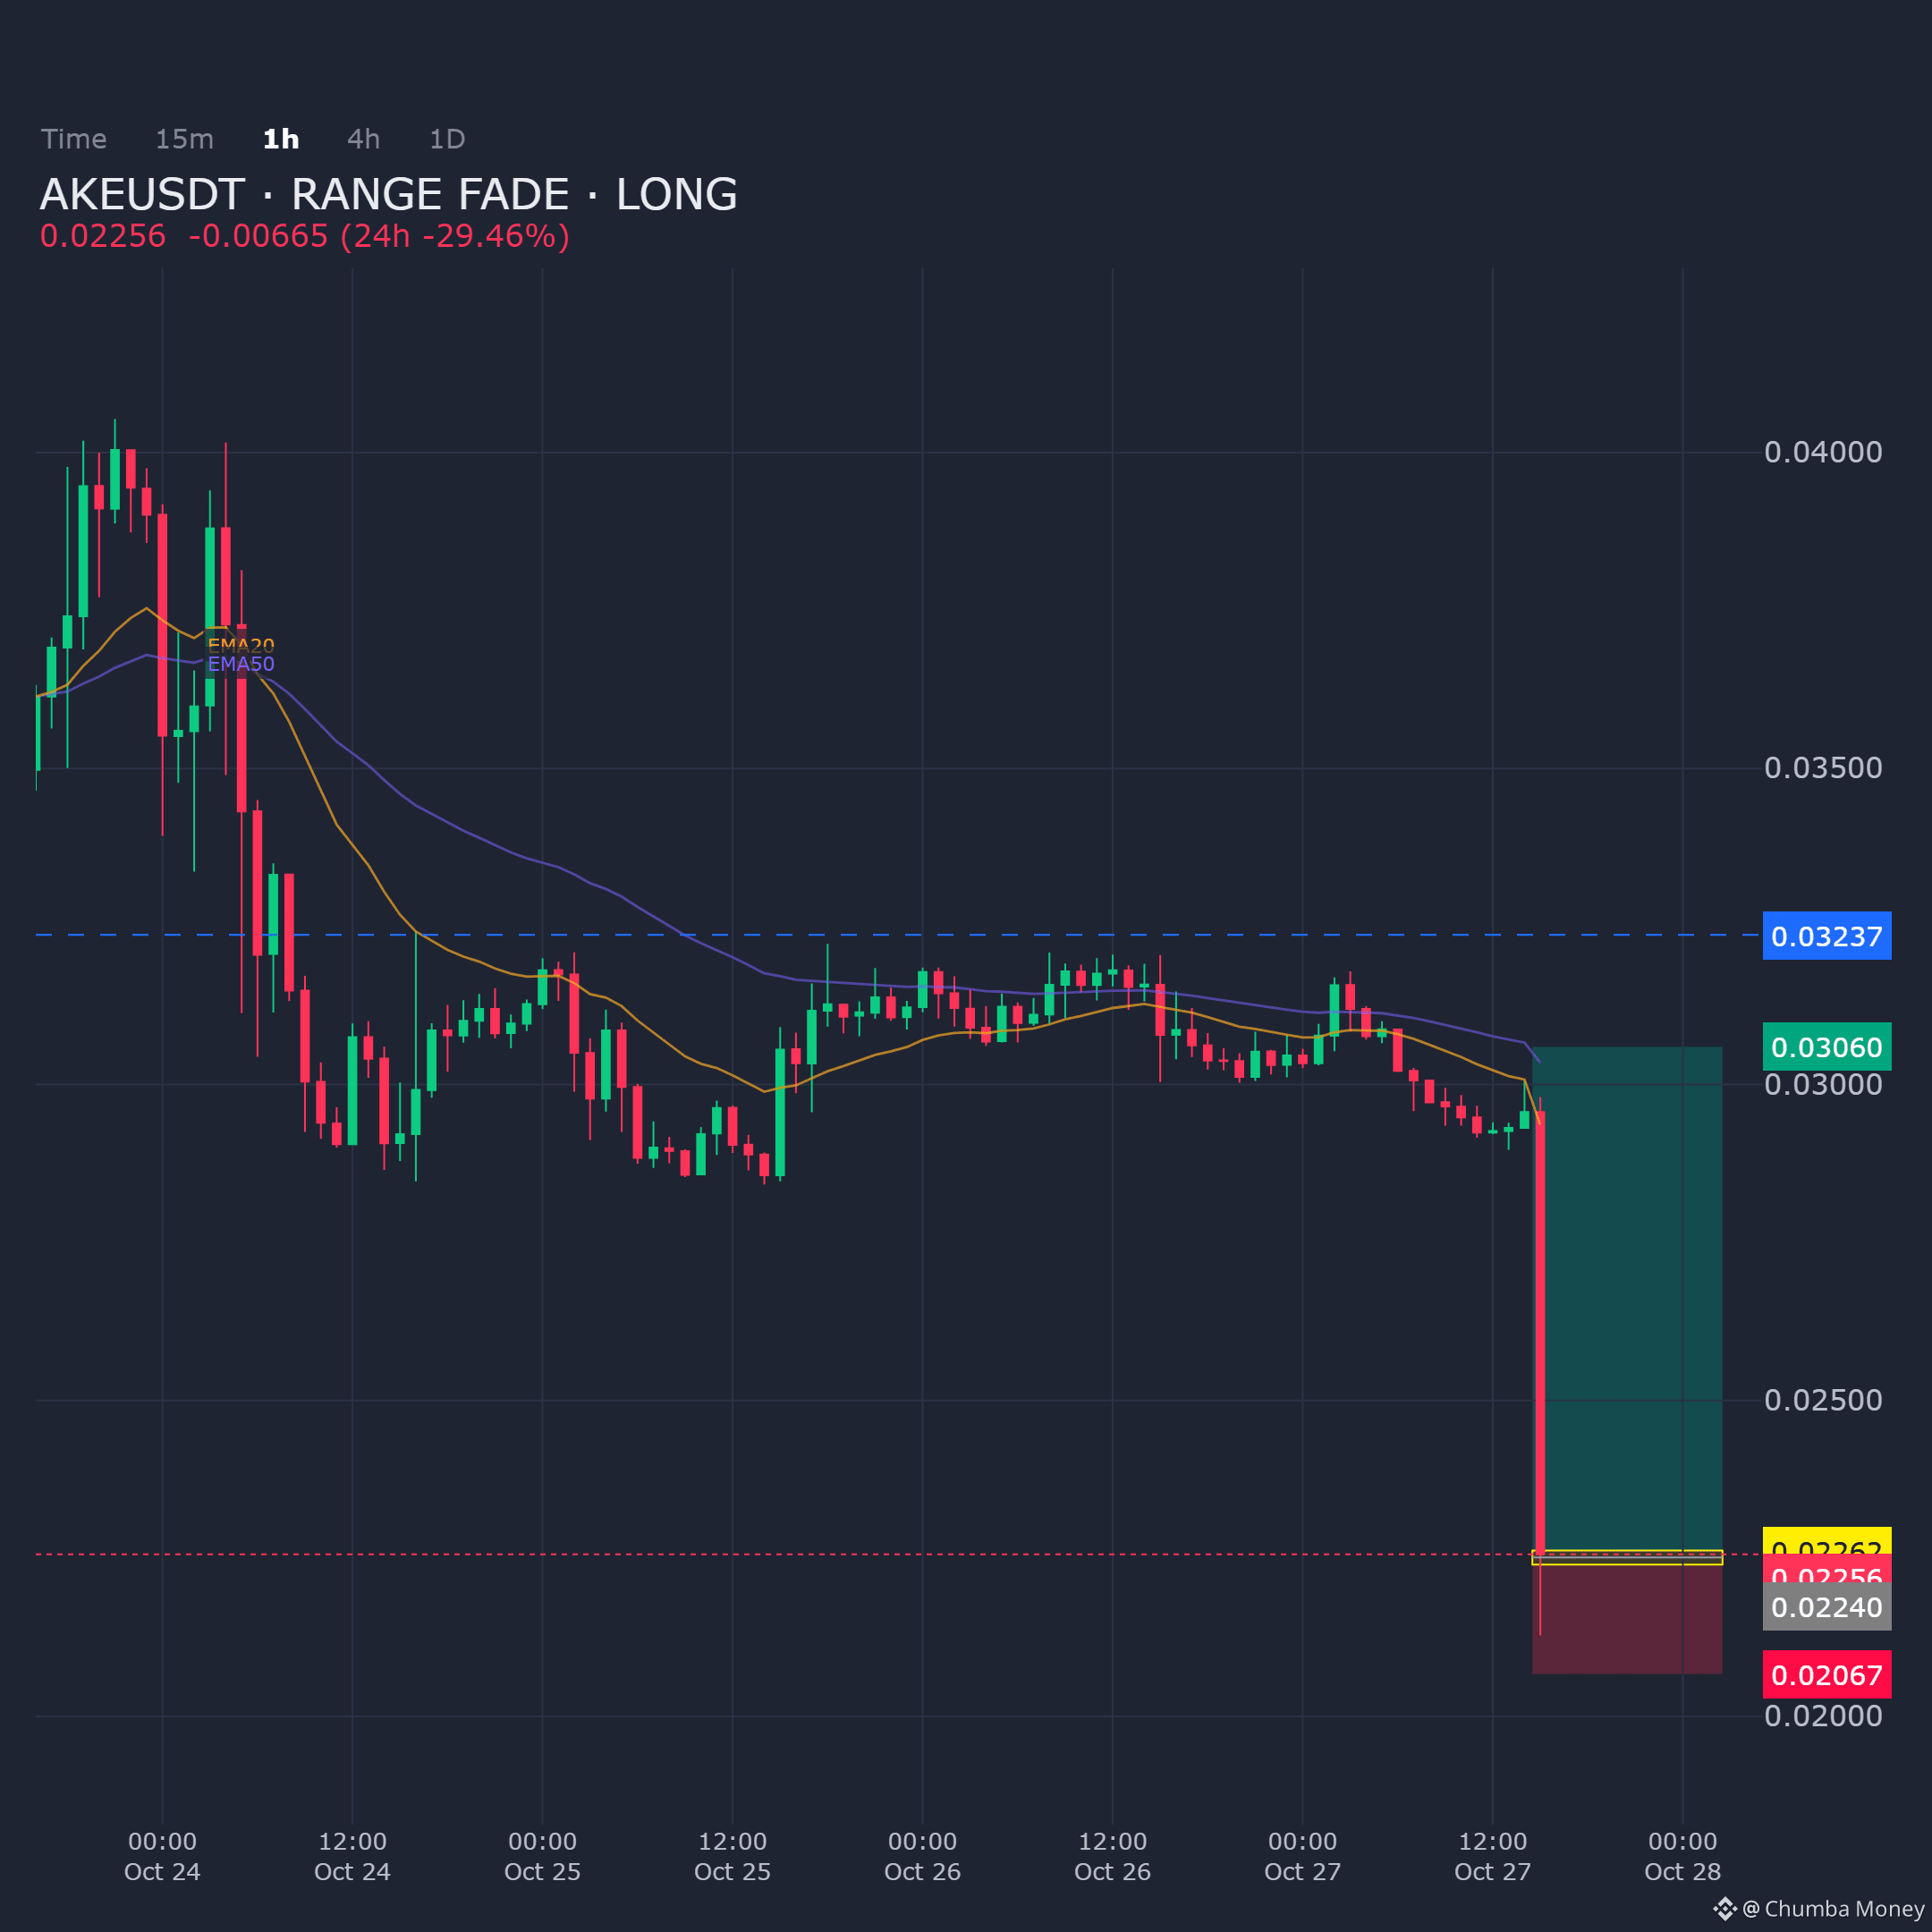
AKEUSDT on the 1H chart: price testing the demand zone, range fade setup with a long bias into the reaction.
Entry: 0.022402 - 0.022625
Targets: TP1: 0.030597, TP2: 0.031738, TP3: 0.032369
Stop Loss: 0.020669
$AKE
AKEUSDT on the 1H chart: price testing the demand zone, range fade setup with a long bias into the reaction.
Entry: 0.022402 - 0.022625
Targets: TP1: 0.030597, TP2: 0.031738, TP3: 0.032369
Stop Loss: 0.020669
$AKE
Entry: 0.022402 - 0.022625
Targets: TP1: 0.030597, TP2: 0.031738, TP3: 0.032369
Stop Loss: 0.020669
$AKE
36
·
--
Übersetzung ansehen
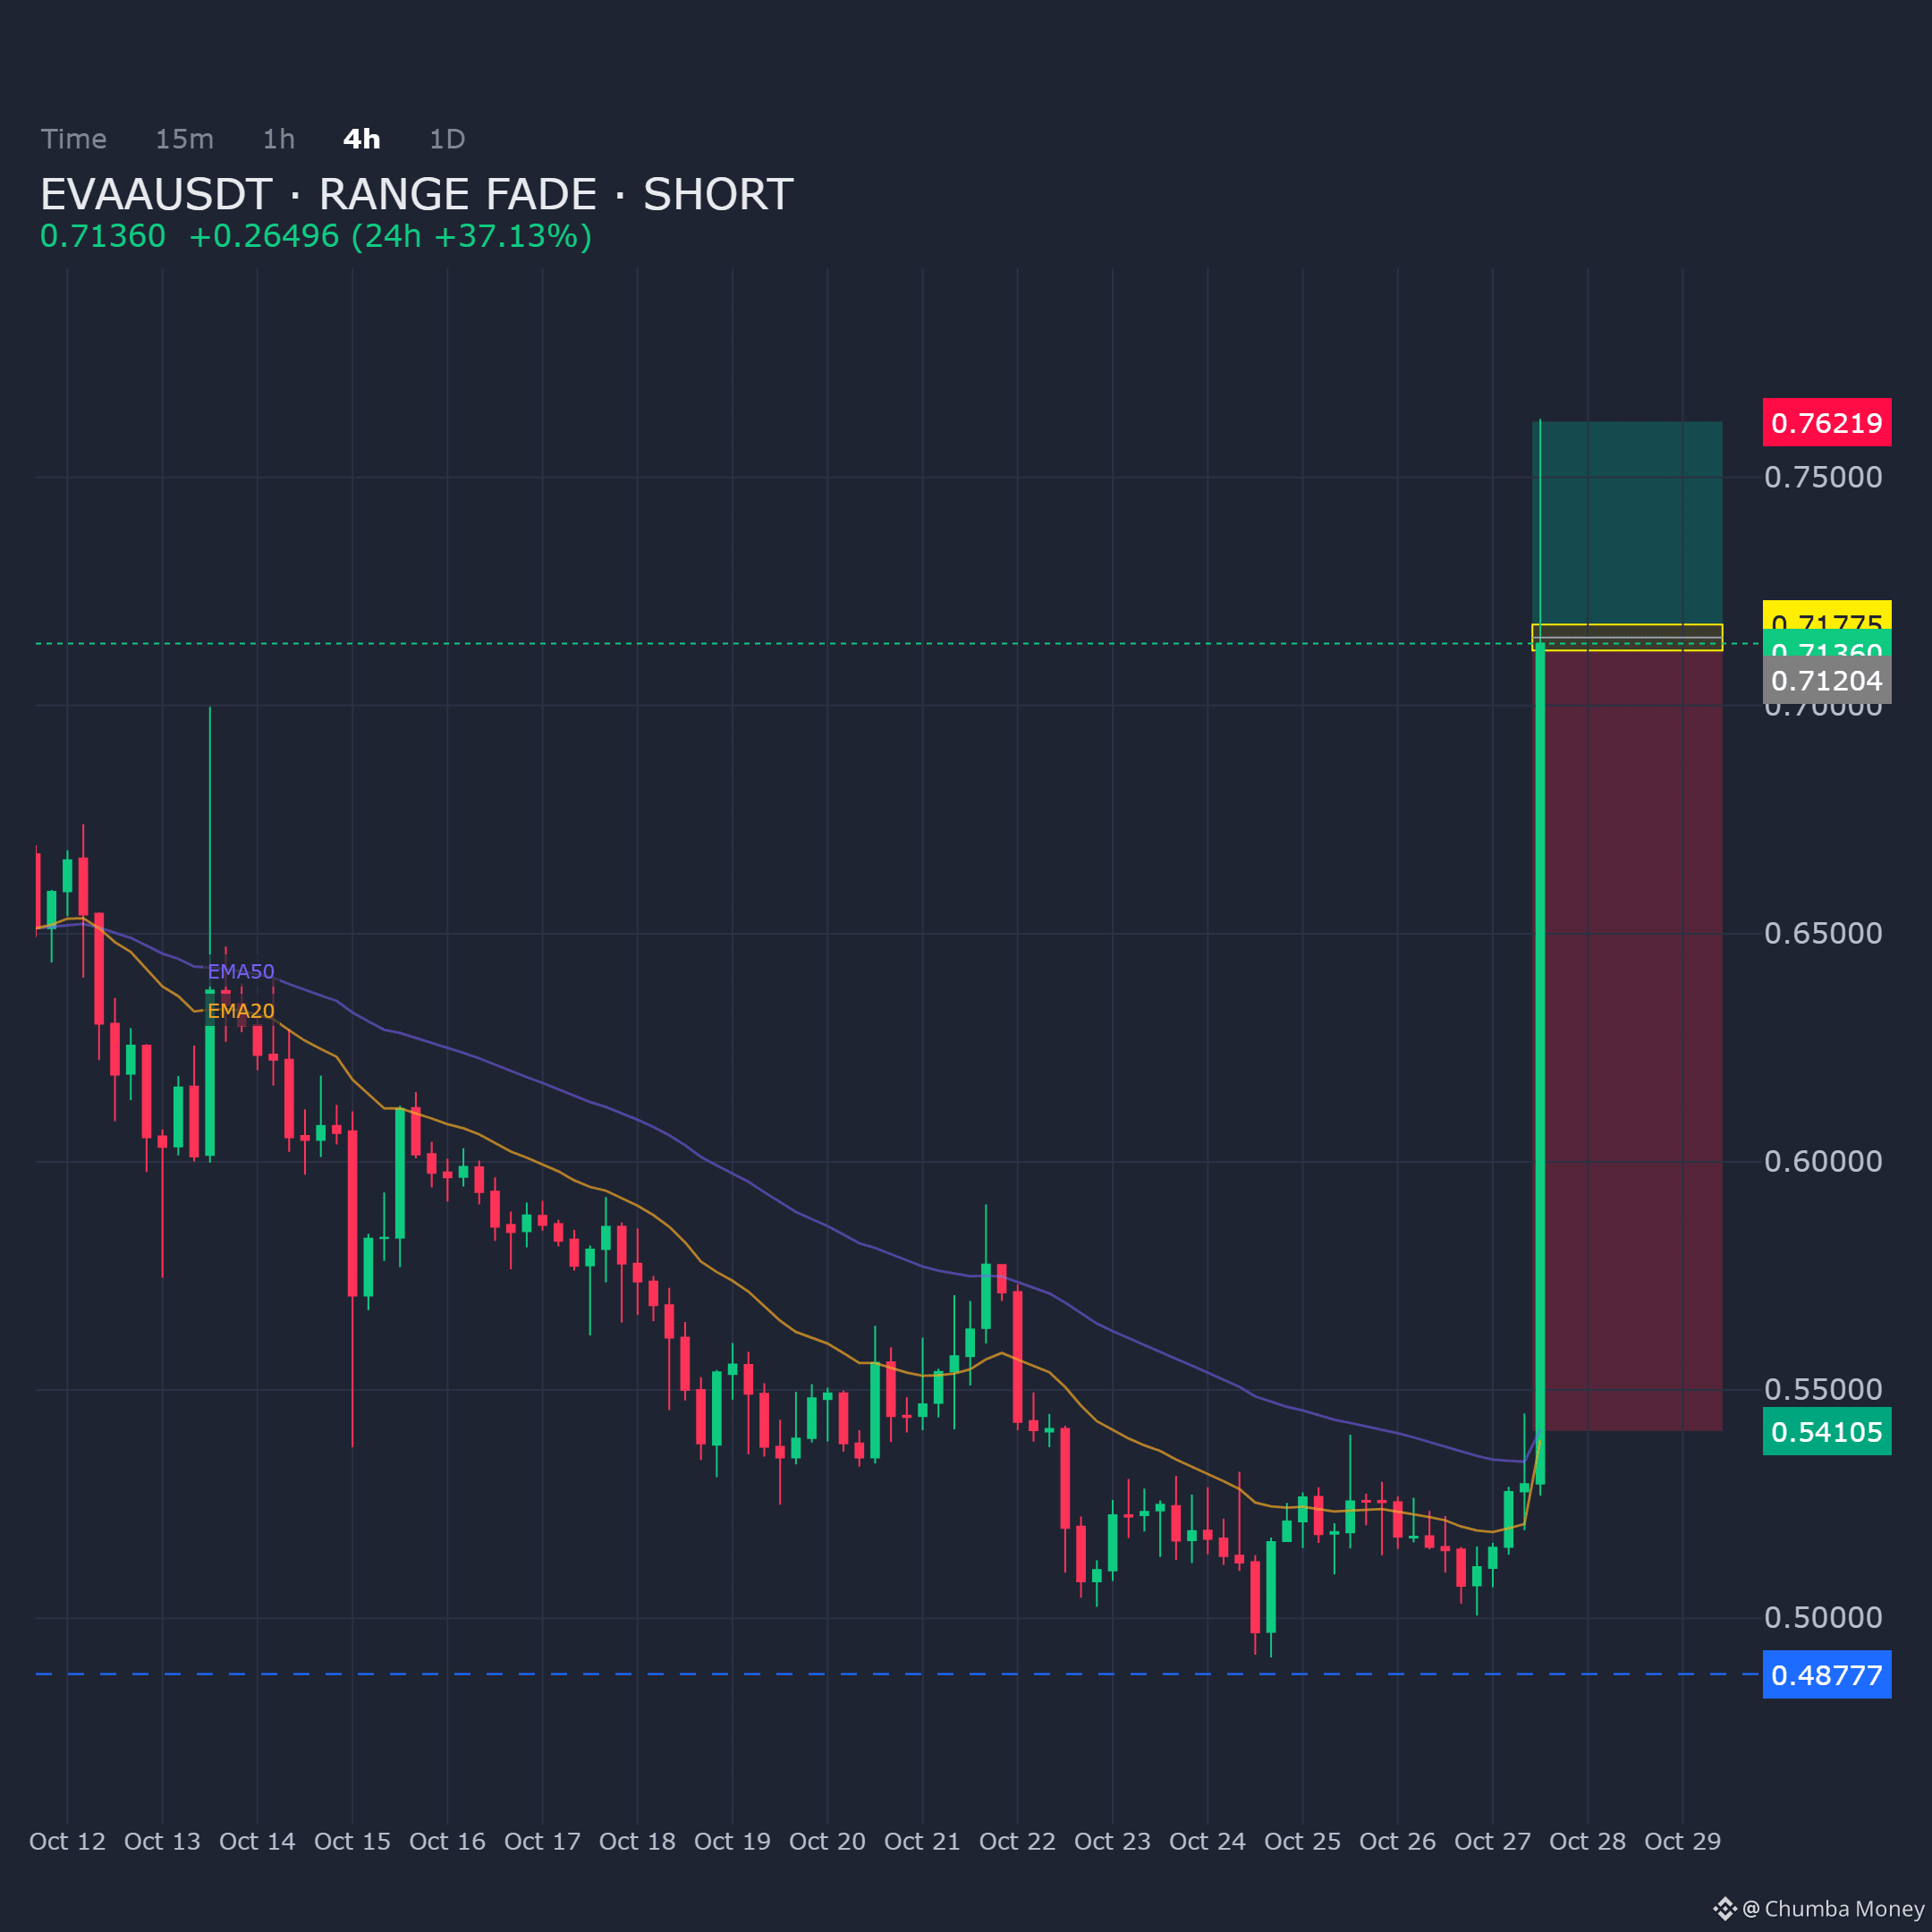
EVAAUSDT is stretched into the 4H supply zone, supporting a range fade bias. Price action favors a short from this level.
Entry: 0.712044 - 0.717748
Targets: TP1: 0.54105, TP2: 0.506295, TP3: 0.48777
Stop Loss: 0.762191
$EVAA
EVAAUSDT is stretched into the 4H supply zone, supporting a range fade bias. Price action favors a short from this level.
Entry: 0.712044 - 0.717748
Targets: TP1: 0.54105, TP2: 0.506295, TP3: 0.48777
Stop Loss: 0.762191
$EVAA
Entry: 0.712044 - 0.717748
Targets: TP1: 0.54105, TP2: 0.506295, TP3: 0.48777
Stop Loss: 0.762191
$EVAA
51
·
--
Übersetzung ansehen
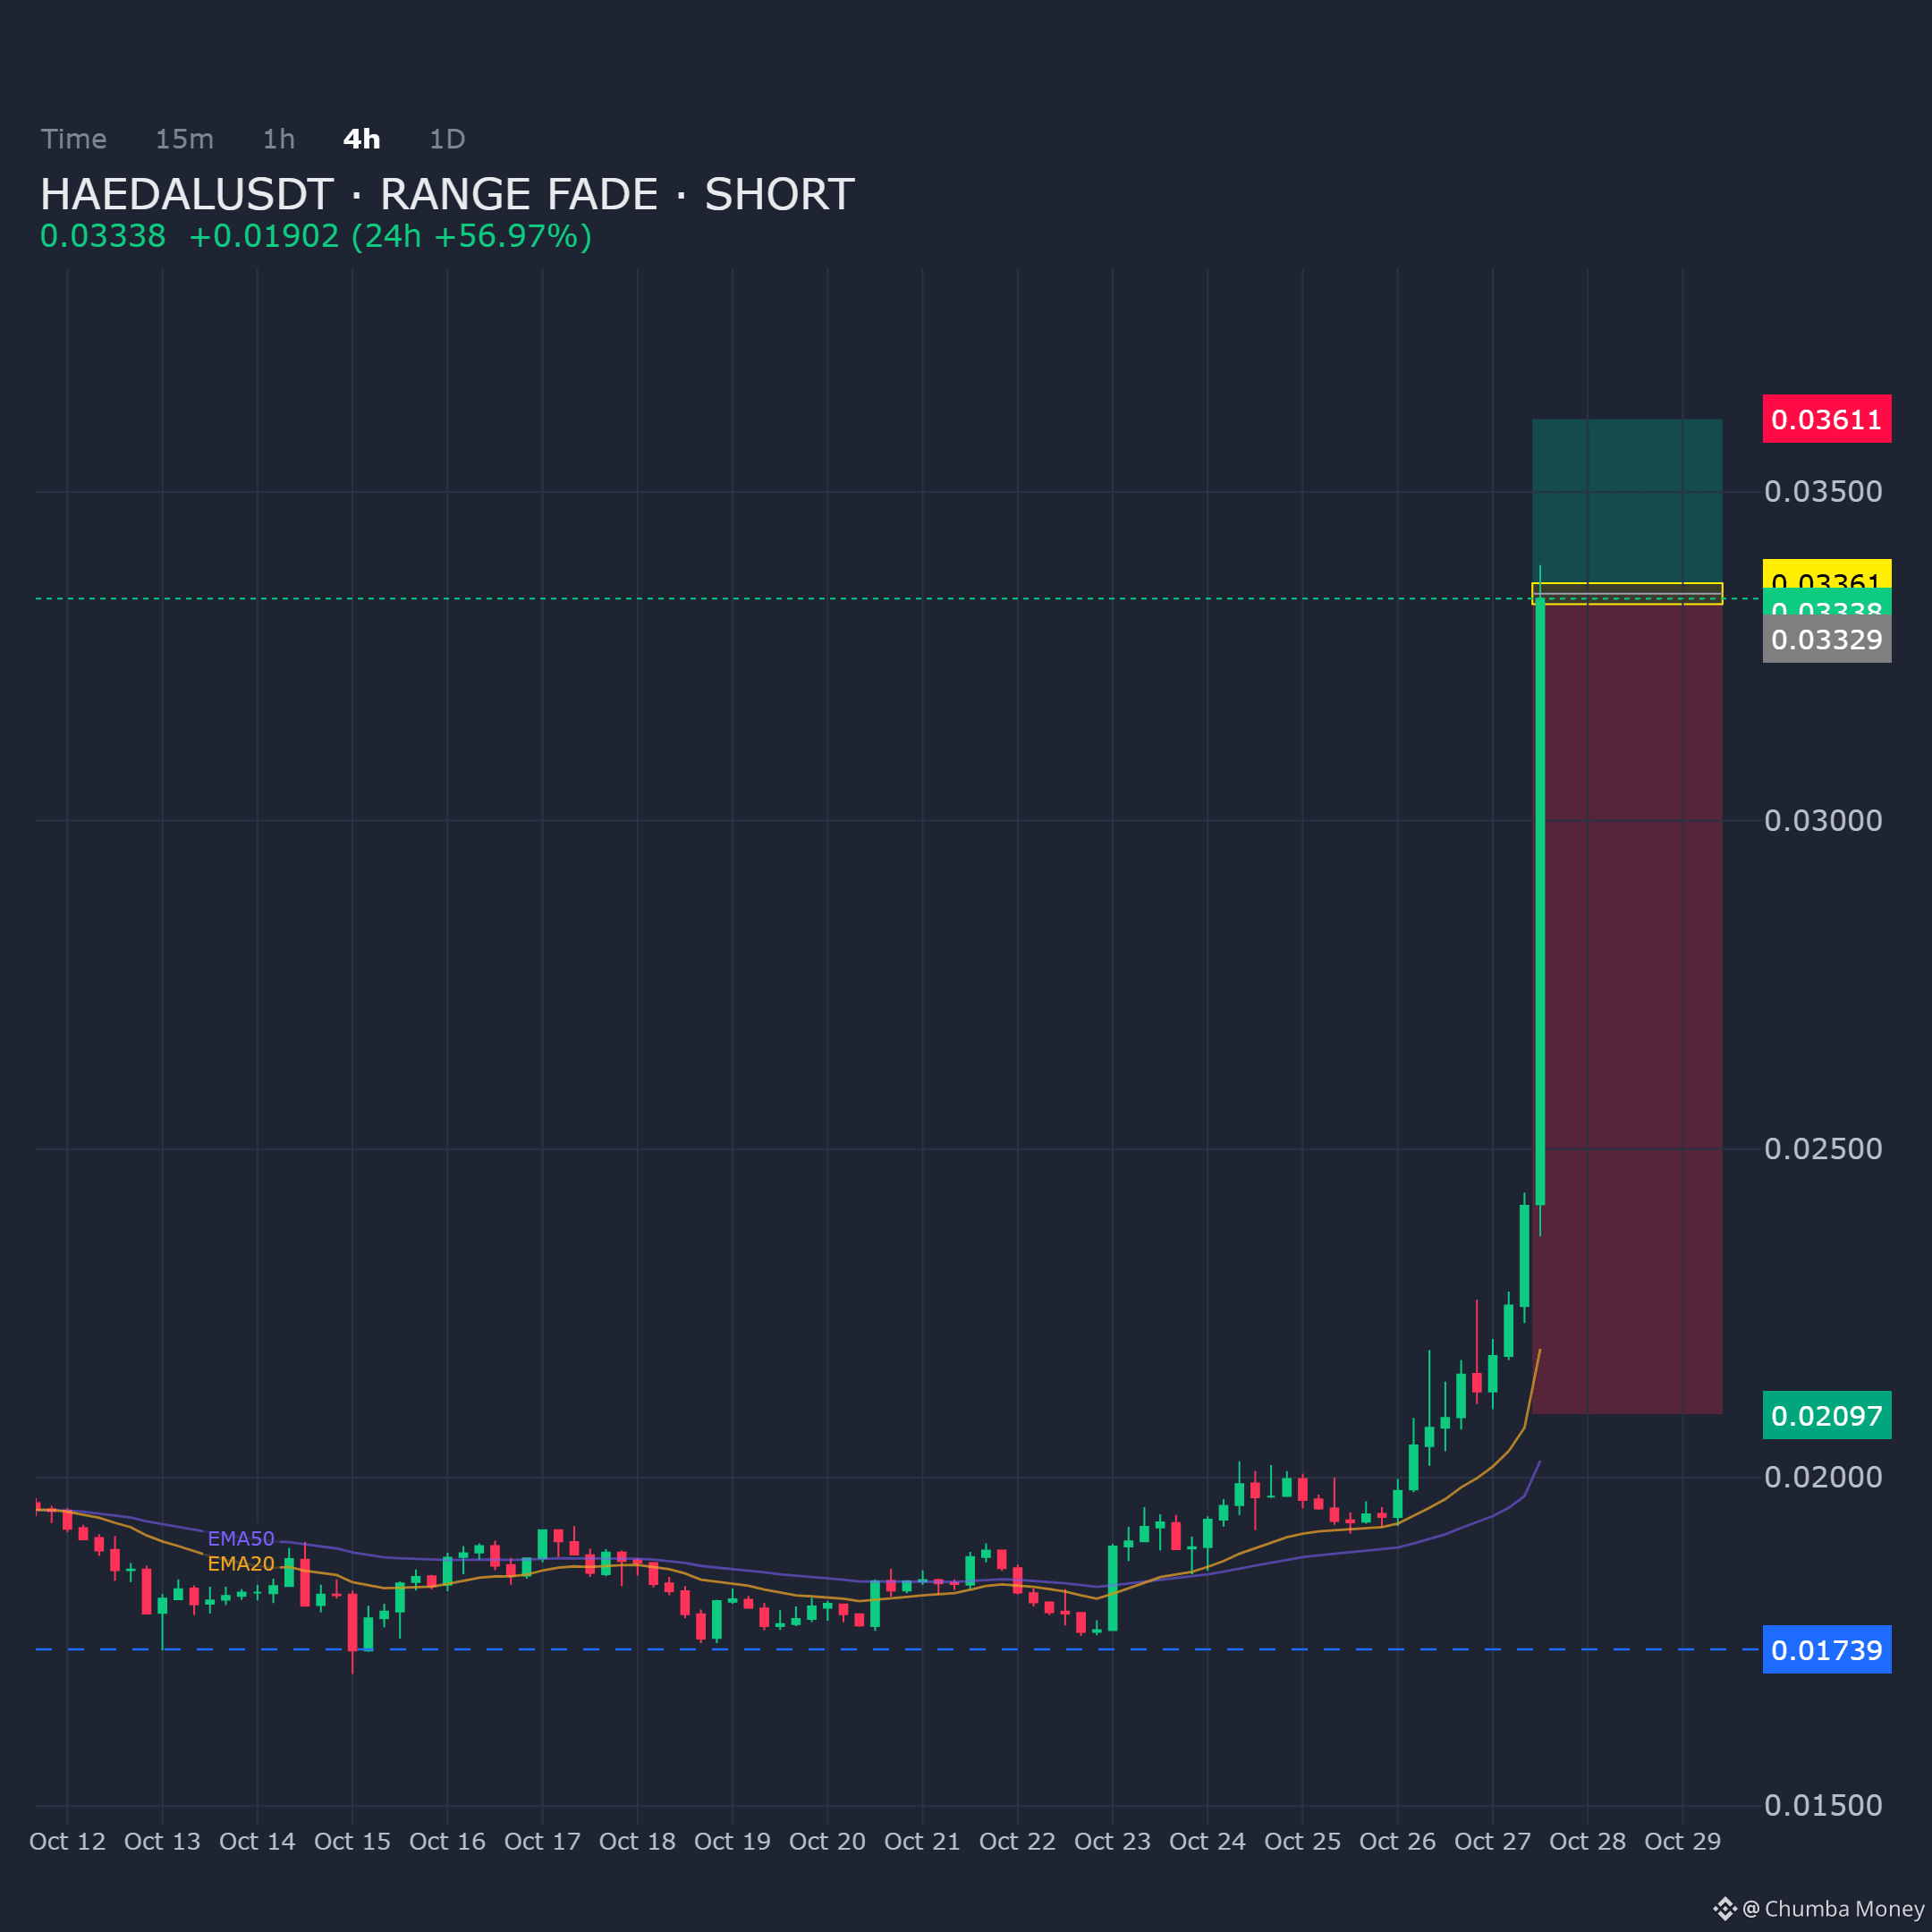
HAEDALUSDT on the 4H chart shows price extended into supply, favoring a range fade bias. The setup targets the downside with risk capped above the zone.
Entry: 0.033293 - 0.033613
Targets: TP1: 0.020965, TP2: 0.018603, TP3: 0.017386
Stop Loss: 0.036113
$HAEDAL
HAEDALUSDT on the 4H chart shows price extended into supply, favoring a range fade bias. The setup targets the downside with risk capped above the zone.
Entry: 0.033293 - 0.033613
Targets: TP1: 0.020965, TP2: 0.018603, TP3: 0.017386
Stop Loss: 0.036113
$HAEDAL
Entry: 0.033293 - 0.033613
Targets: TP1: 0.020965, TP2: 0.018603, TP3: 0.017386
Stop Loss: 0.036113
$HAEDAL
22
·
--
Übersetzung ansehen
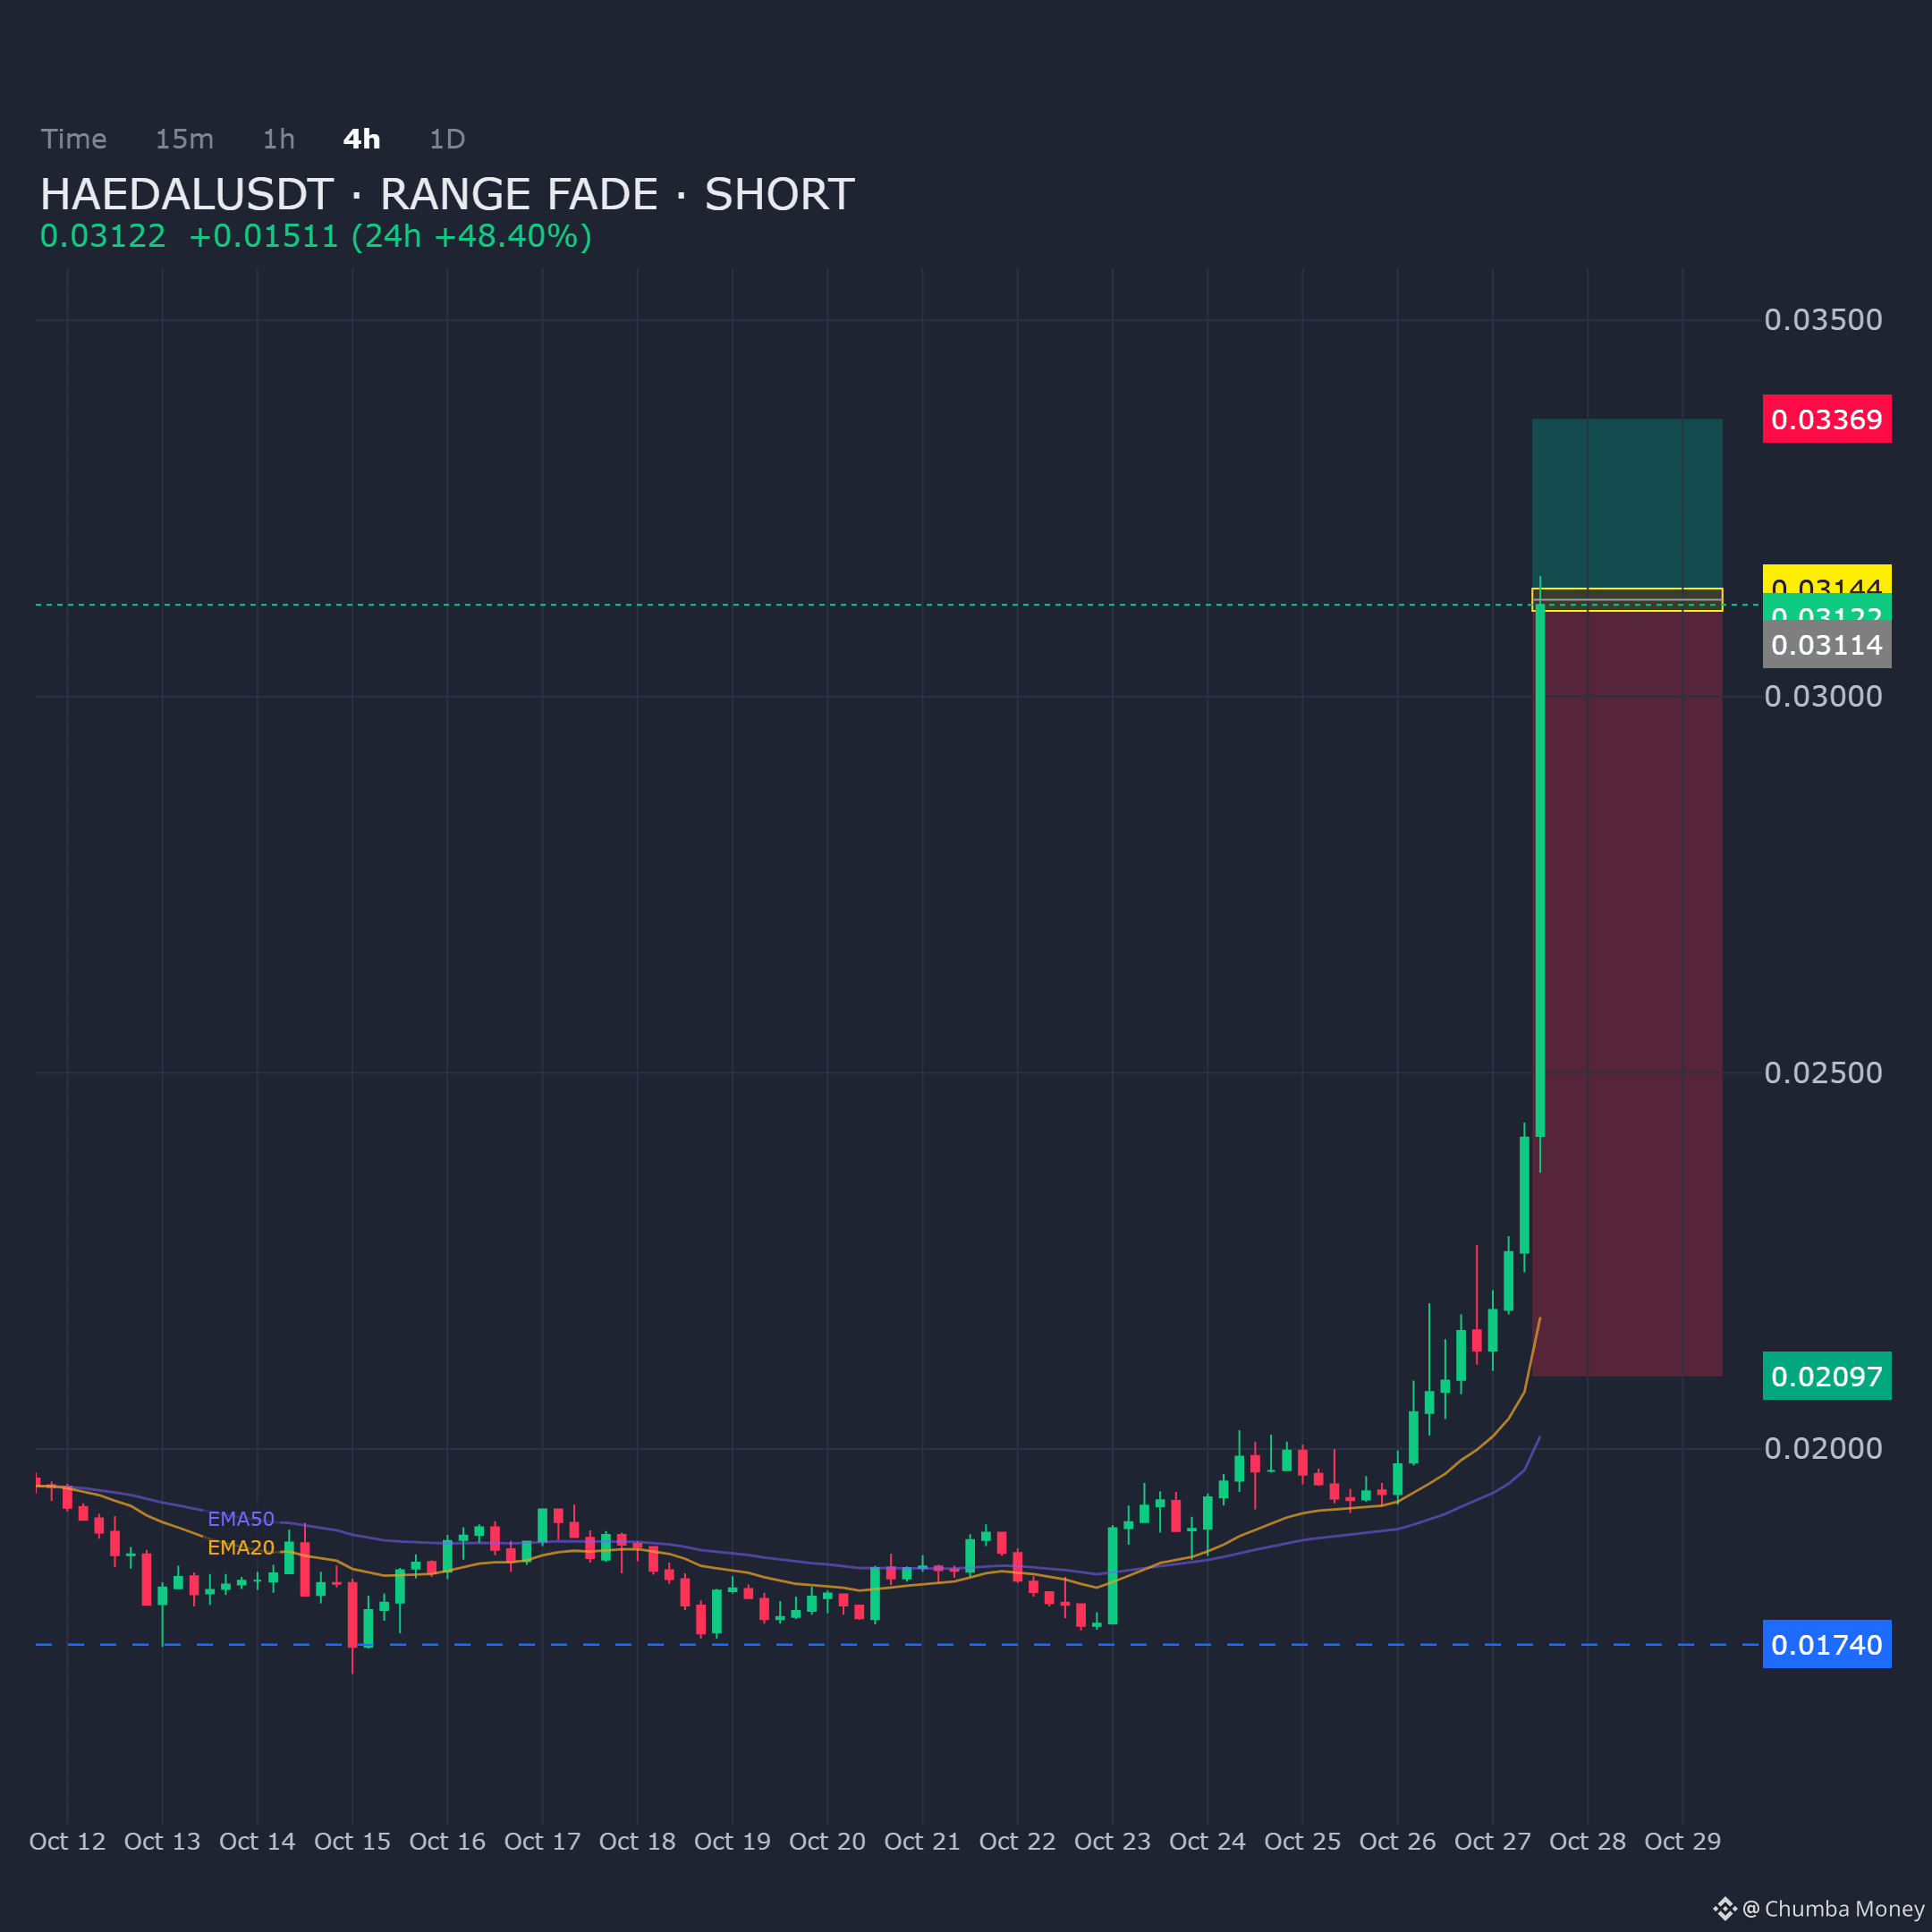
HAEDALUSDT on the 4H chart is extended into supply, favoring a range-fade short from the current zone.
Entry: 0.031139 - 0.031436
Targets: TP1: 0.020965, TP2: 0.018603, TP3: 0.017401
Stop Loss: 0.03369
$HAEDAL
HAEDALUSDT on the 4H chart is extended into supply, favoring a range-fade short from the current zone.
Entry: 0.031139 - 0.031436
Targets: TP1: 0.020965, TP2: 0.018603, TP3: 0.017401
Stop Loss: 0.03369
$HAEDAL
Entry: 0.031139 - 0.031436
Targets: TP1: 0.020965, TP2: 0.018603, TP3: 0.017401
Stop Loss: 0.03369
$HAEDAL
39
·
--
Übersetzung ansehen
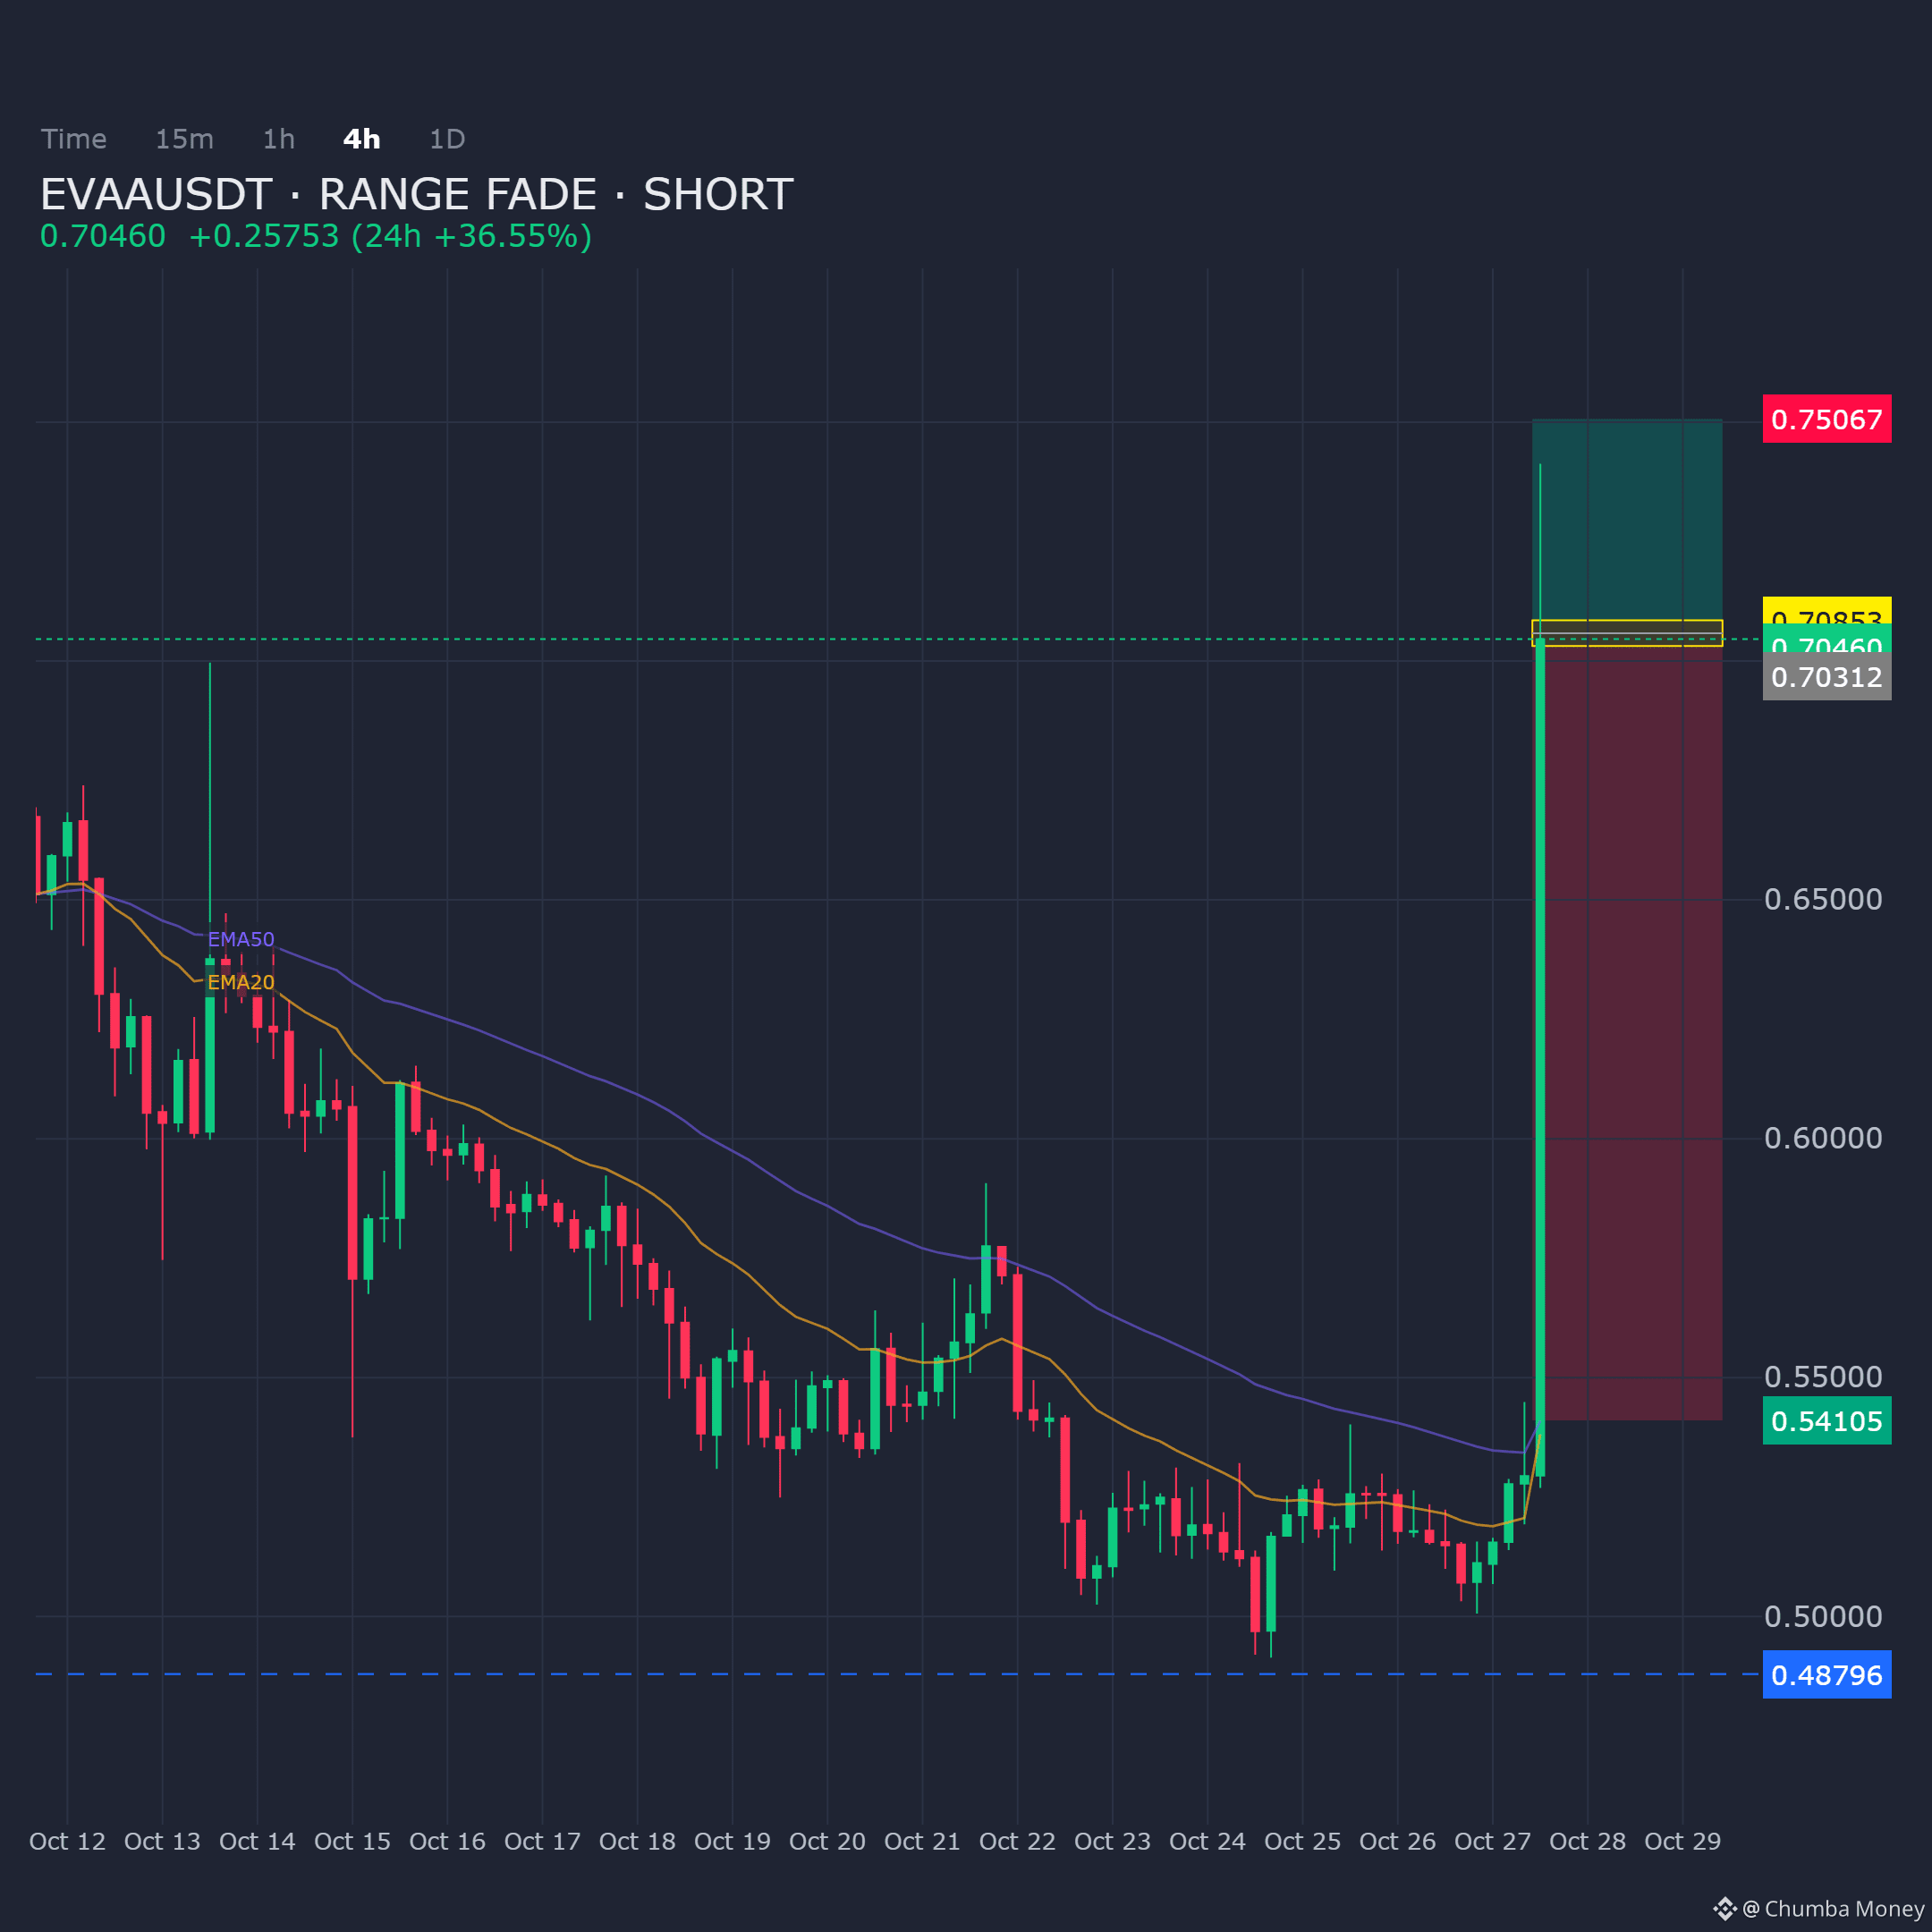
EVAAUSDT is extended on the 4H chart and pressuring a prior supply zone; the setup frames a range fade with a short bias.
- Entry: 0.703125 - 0.708533
- Targets: TP1: 0.54105, TP2: 0.506295, TP3: 0.487959
- Stop Loss: 0.750672
Plan the entry, respect the stop, and manage the targets.
$EVAA
EVAAUSDT is extended on the 4H chart and pressuring a prior supply zone; the setup frames a range fade with a short bias.
- Entry: 0.703125 - 0.708533
- Targets: TP1: 0.54105, TP2: 0.506295, TP3: 0.487959
- Stop Loss: 0.750672
Plan the entry, respect the stop, and manage the targets.
$EVAA
- Entry: 0.703125 - 0.708533
- Targets: TP1: 0.54105, TP2: 0.506295, TP3: 0.487959
- Stop Loss: 0.750672
Plan the entry, respect the stop, and manage the targets.
$EVAA
13
·
--
Übersetzung ansehen
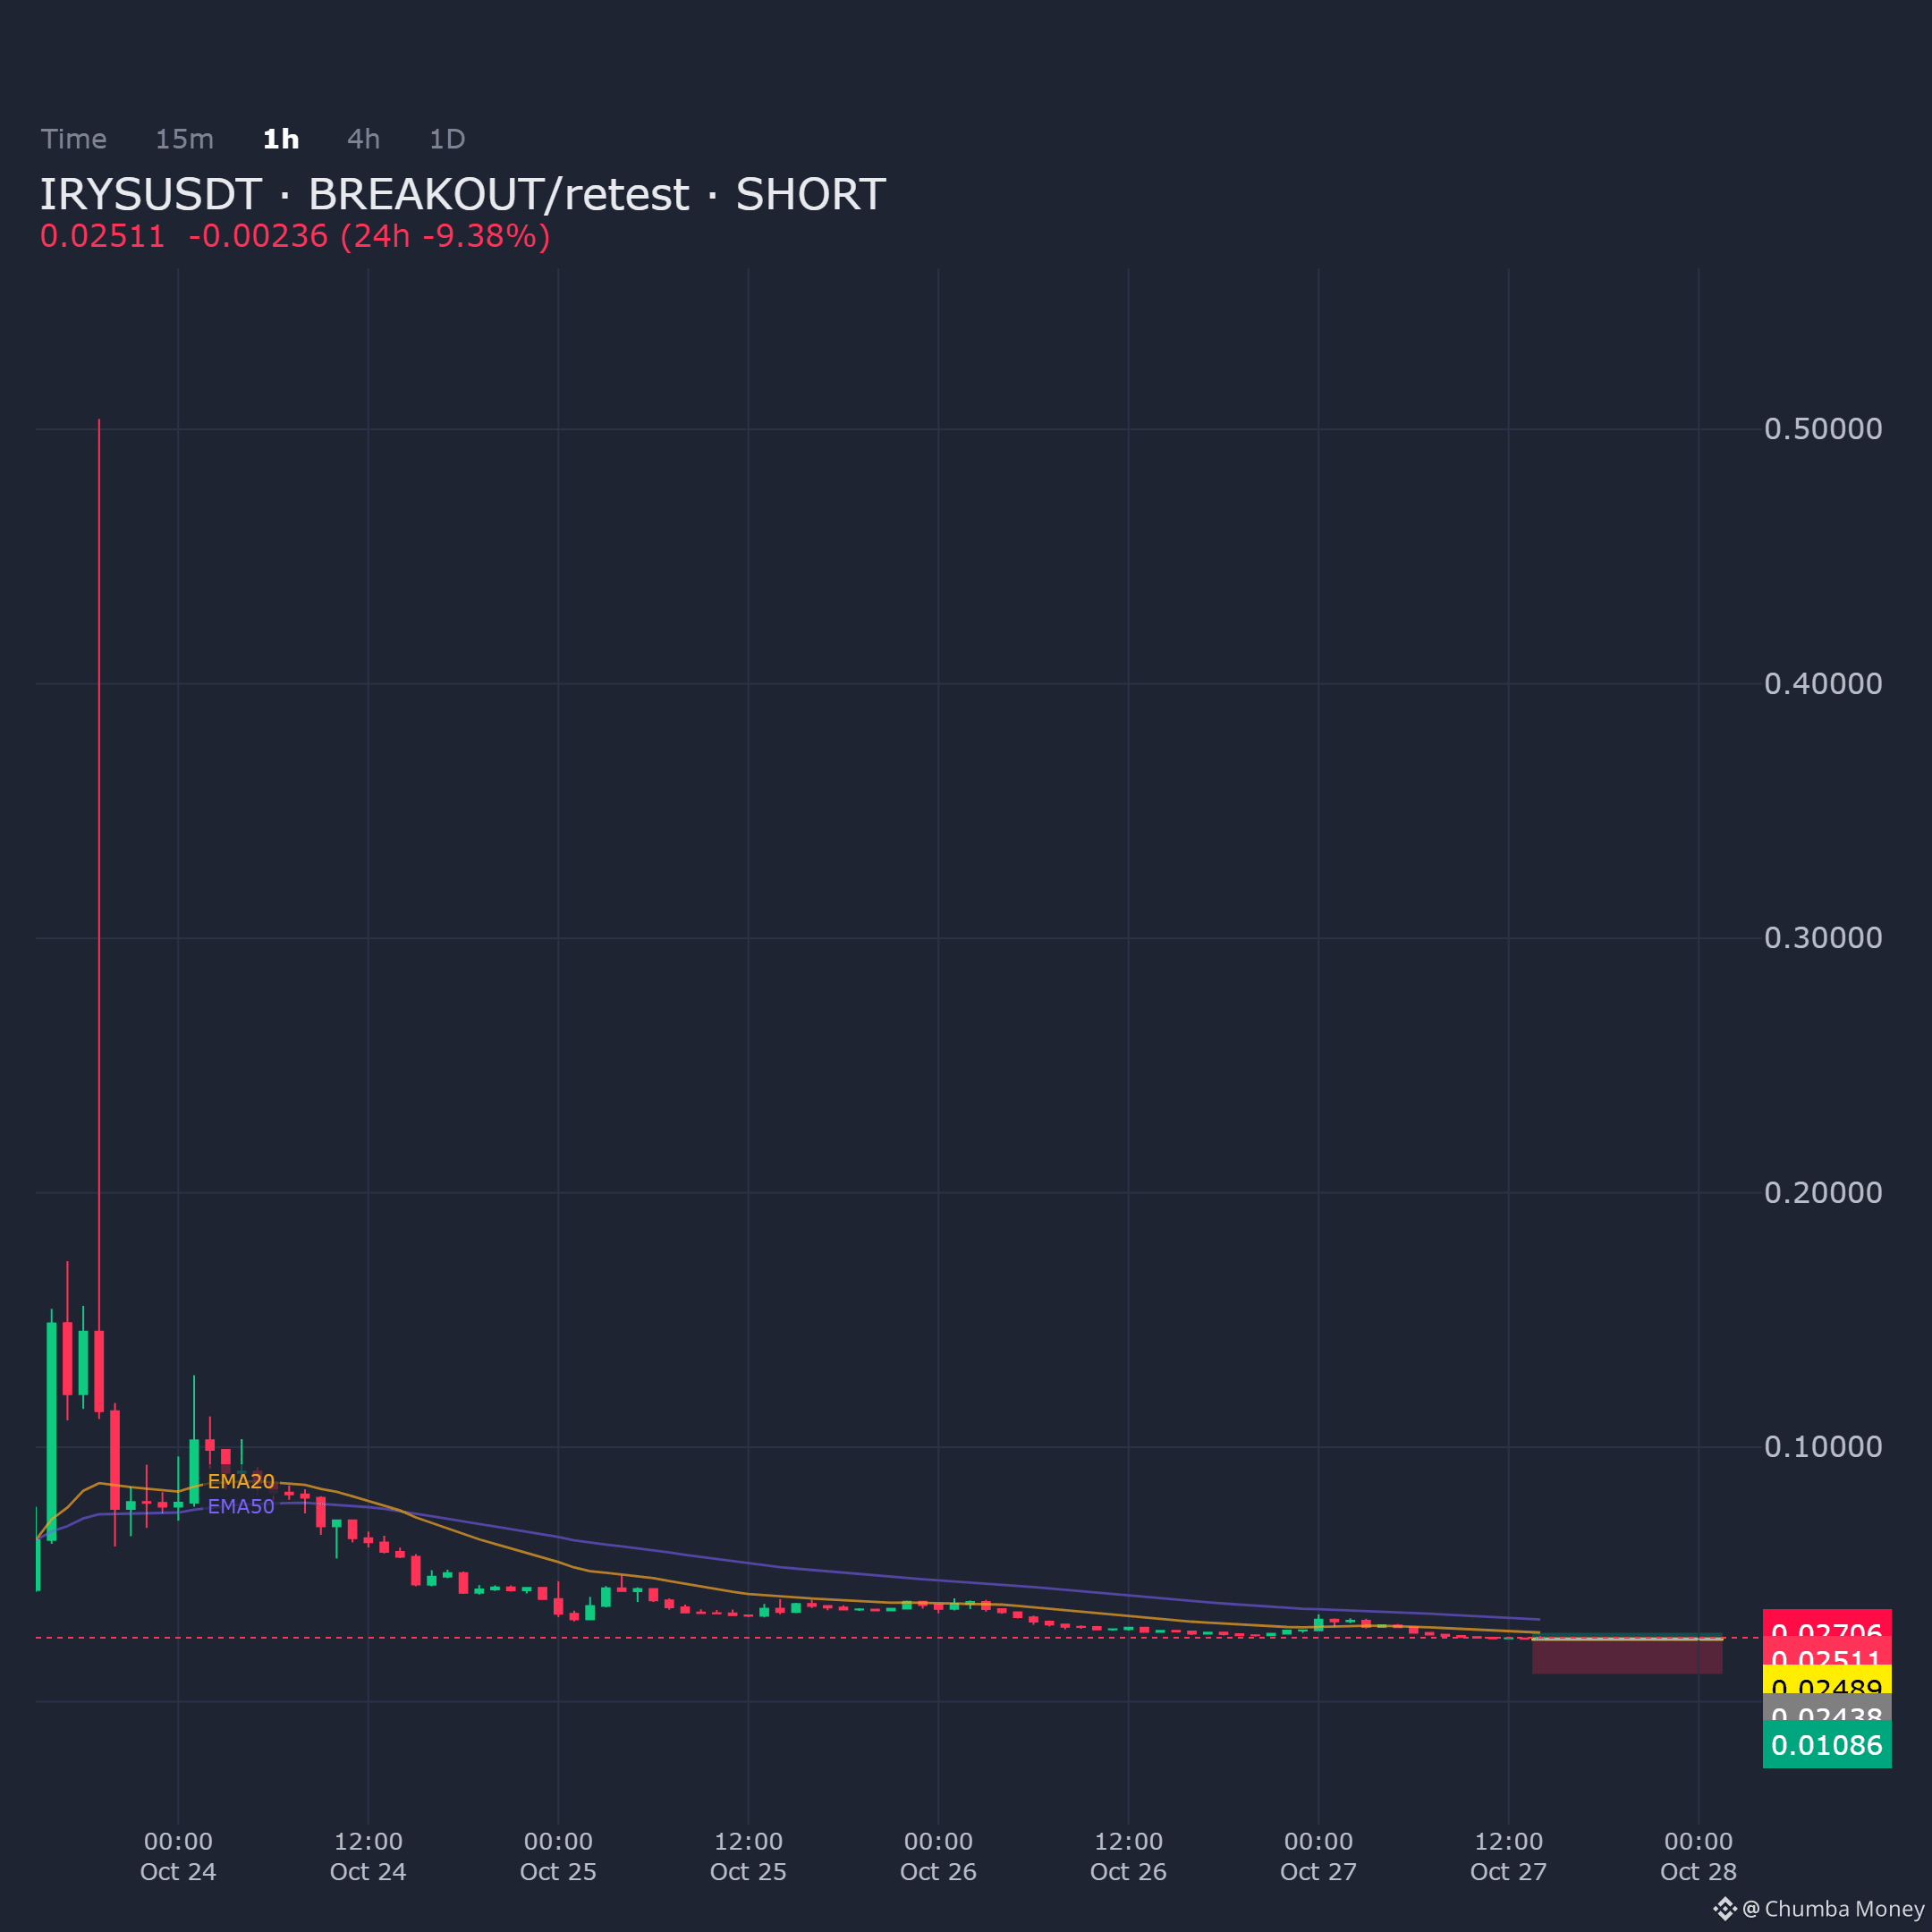
IRYSUSDT is pushing into the 1H supply zone with a short bias following breakout/retest structure.
Entry: 0.024379 - 0.024894
Targets: TP1: 0.010863, TP2: 0.010863, TP3: 0.010863
Stop Loss: 0.027064
$IRYS
IRYSUSDT is pushing into the 1H supply zone with a short bias following breakout/retest structure.
Entry: 0.024379 - 0.024894
Targets: TP1: 0.010863, TP2: 0.010863, TP3: 0.010863
Stop Loss: 0.027064
$IRYS
Entry: 0.024379 - 0.024894
Targets: TP1: 0.010863, TP2: 0.010863, TP3: 0.010863
Stop Loss: 0.027064
$IRYS
37
·
--
Übersetzung ansehen
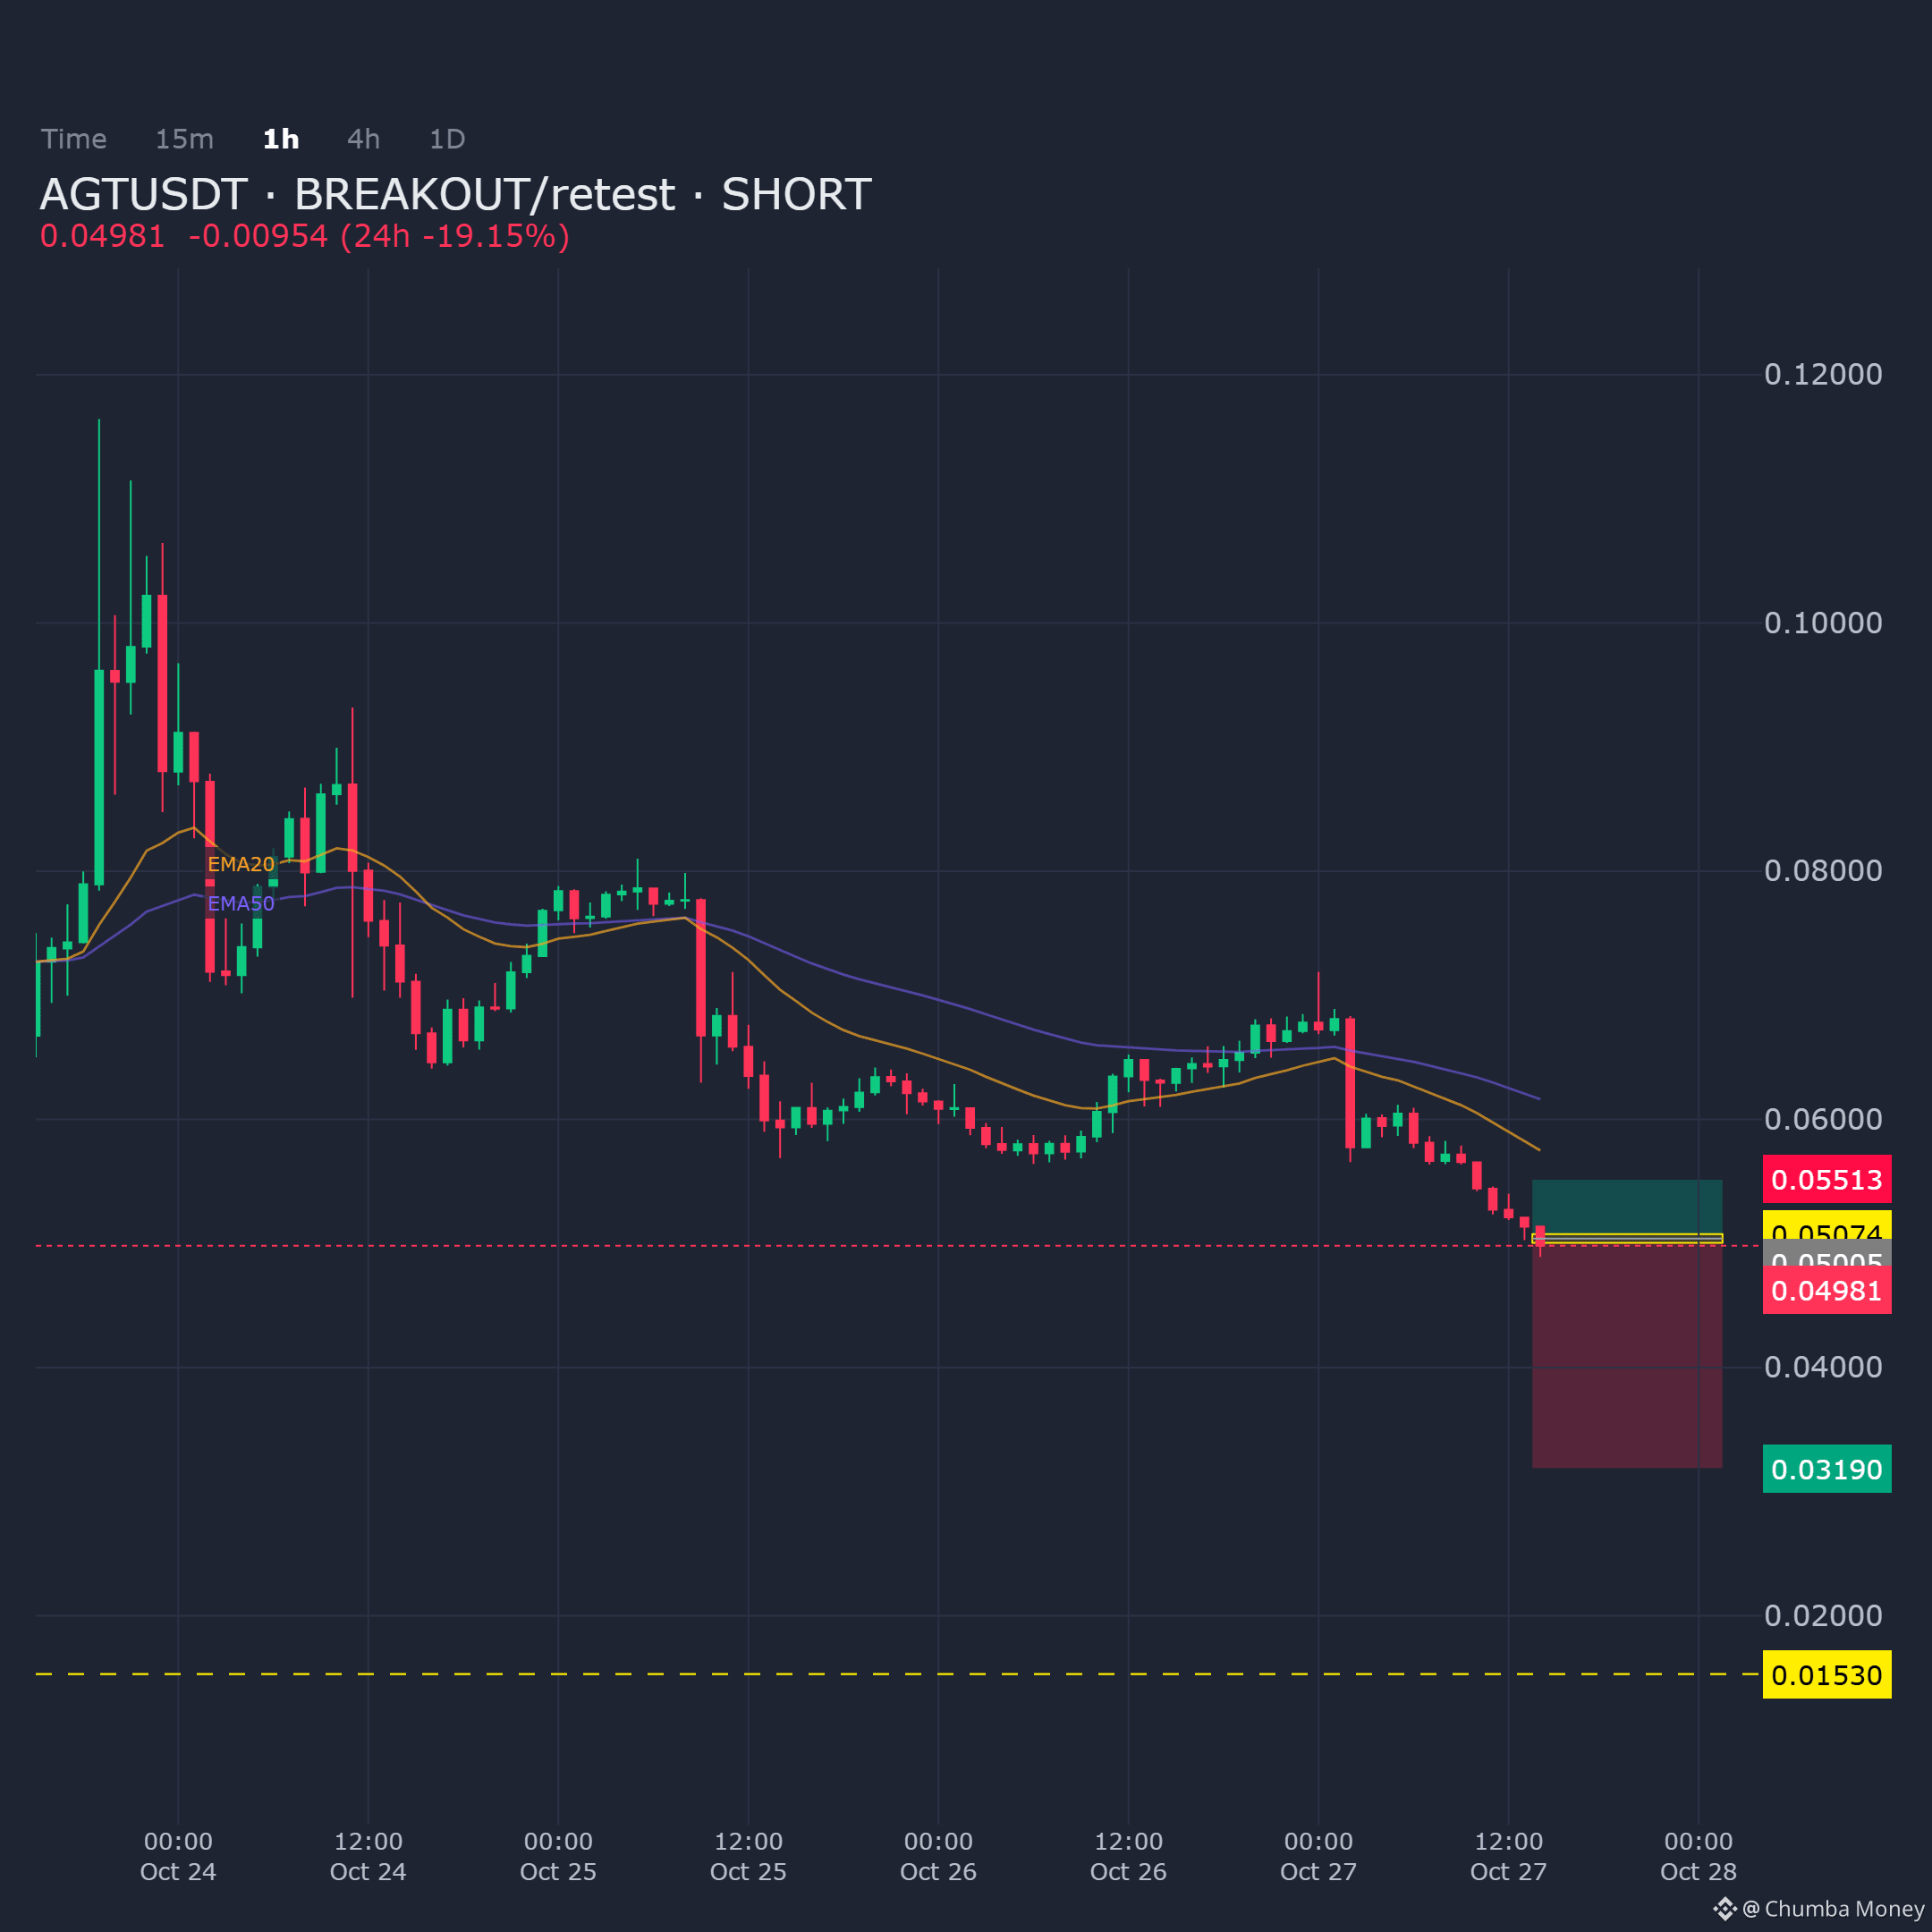
AGTUSDT on the 1H shows momentum fading at resistance. Expecting a breakdown after retest for a short.
Entry: 0.050054 - 0.050745
Targets: TP1: 0.031902, TP2: 0.015305, TP3: 0.015305
Stop Loss: 0.055133
$AGT
AGTUSDT on the 1H shows momentum fading at resistance. Expecting a breakdown after retest for a short.
Entry: 0.050054 - 0.050745
Targets: TP1: 0.031902, TP2: 0.015305, TP3: 0.015305
Stop Loss: 0.055133
$AGT
Entry: 0.050054 - 0.050745
Targets: TP1: 0.031902, TP2: 0.015305, TP3: 0.015305
Stop Loss: 0.055133
$AGT
12
·
--
Übersetzung ansehen
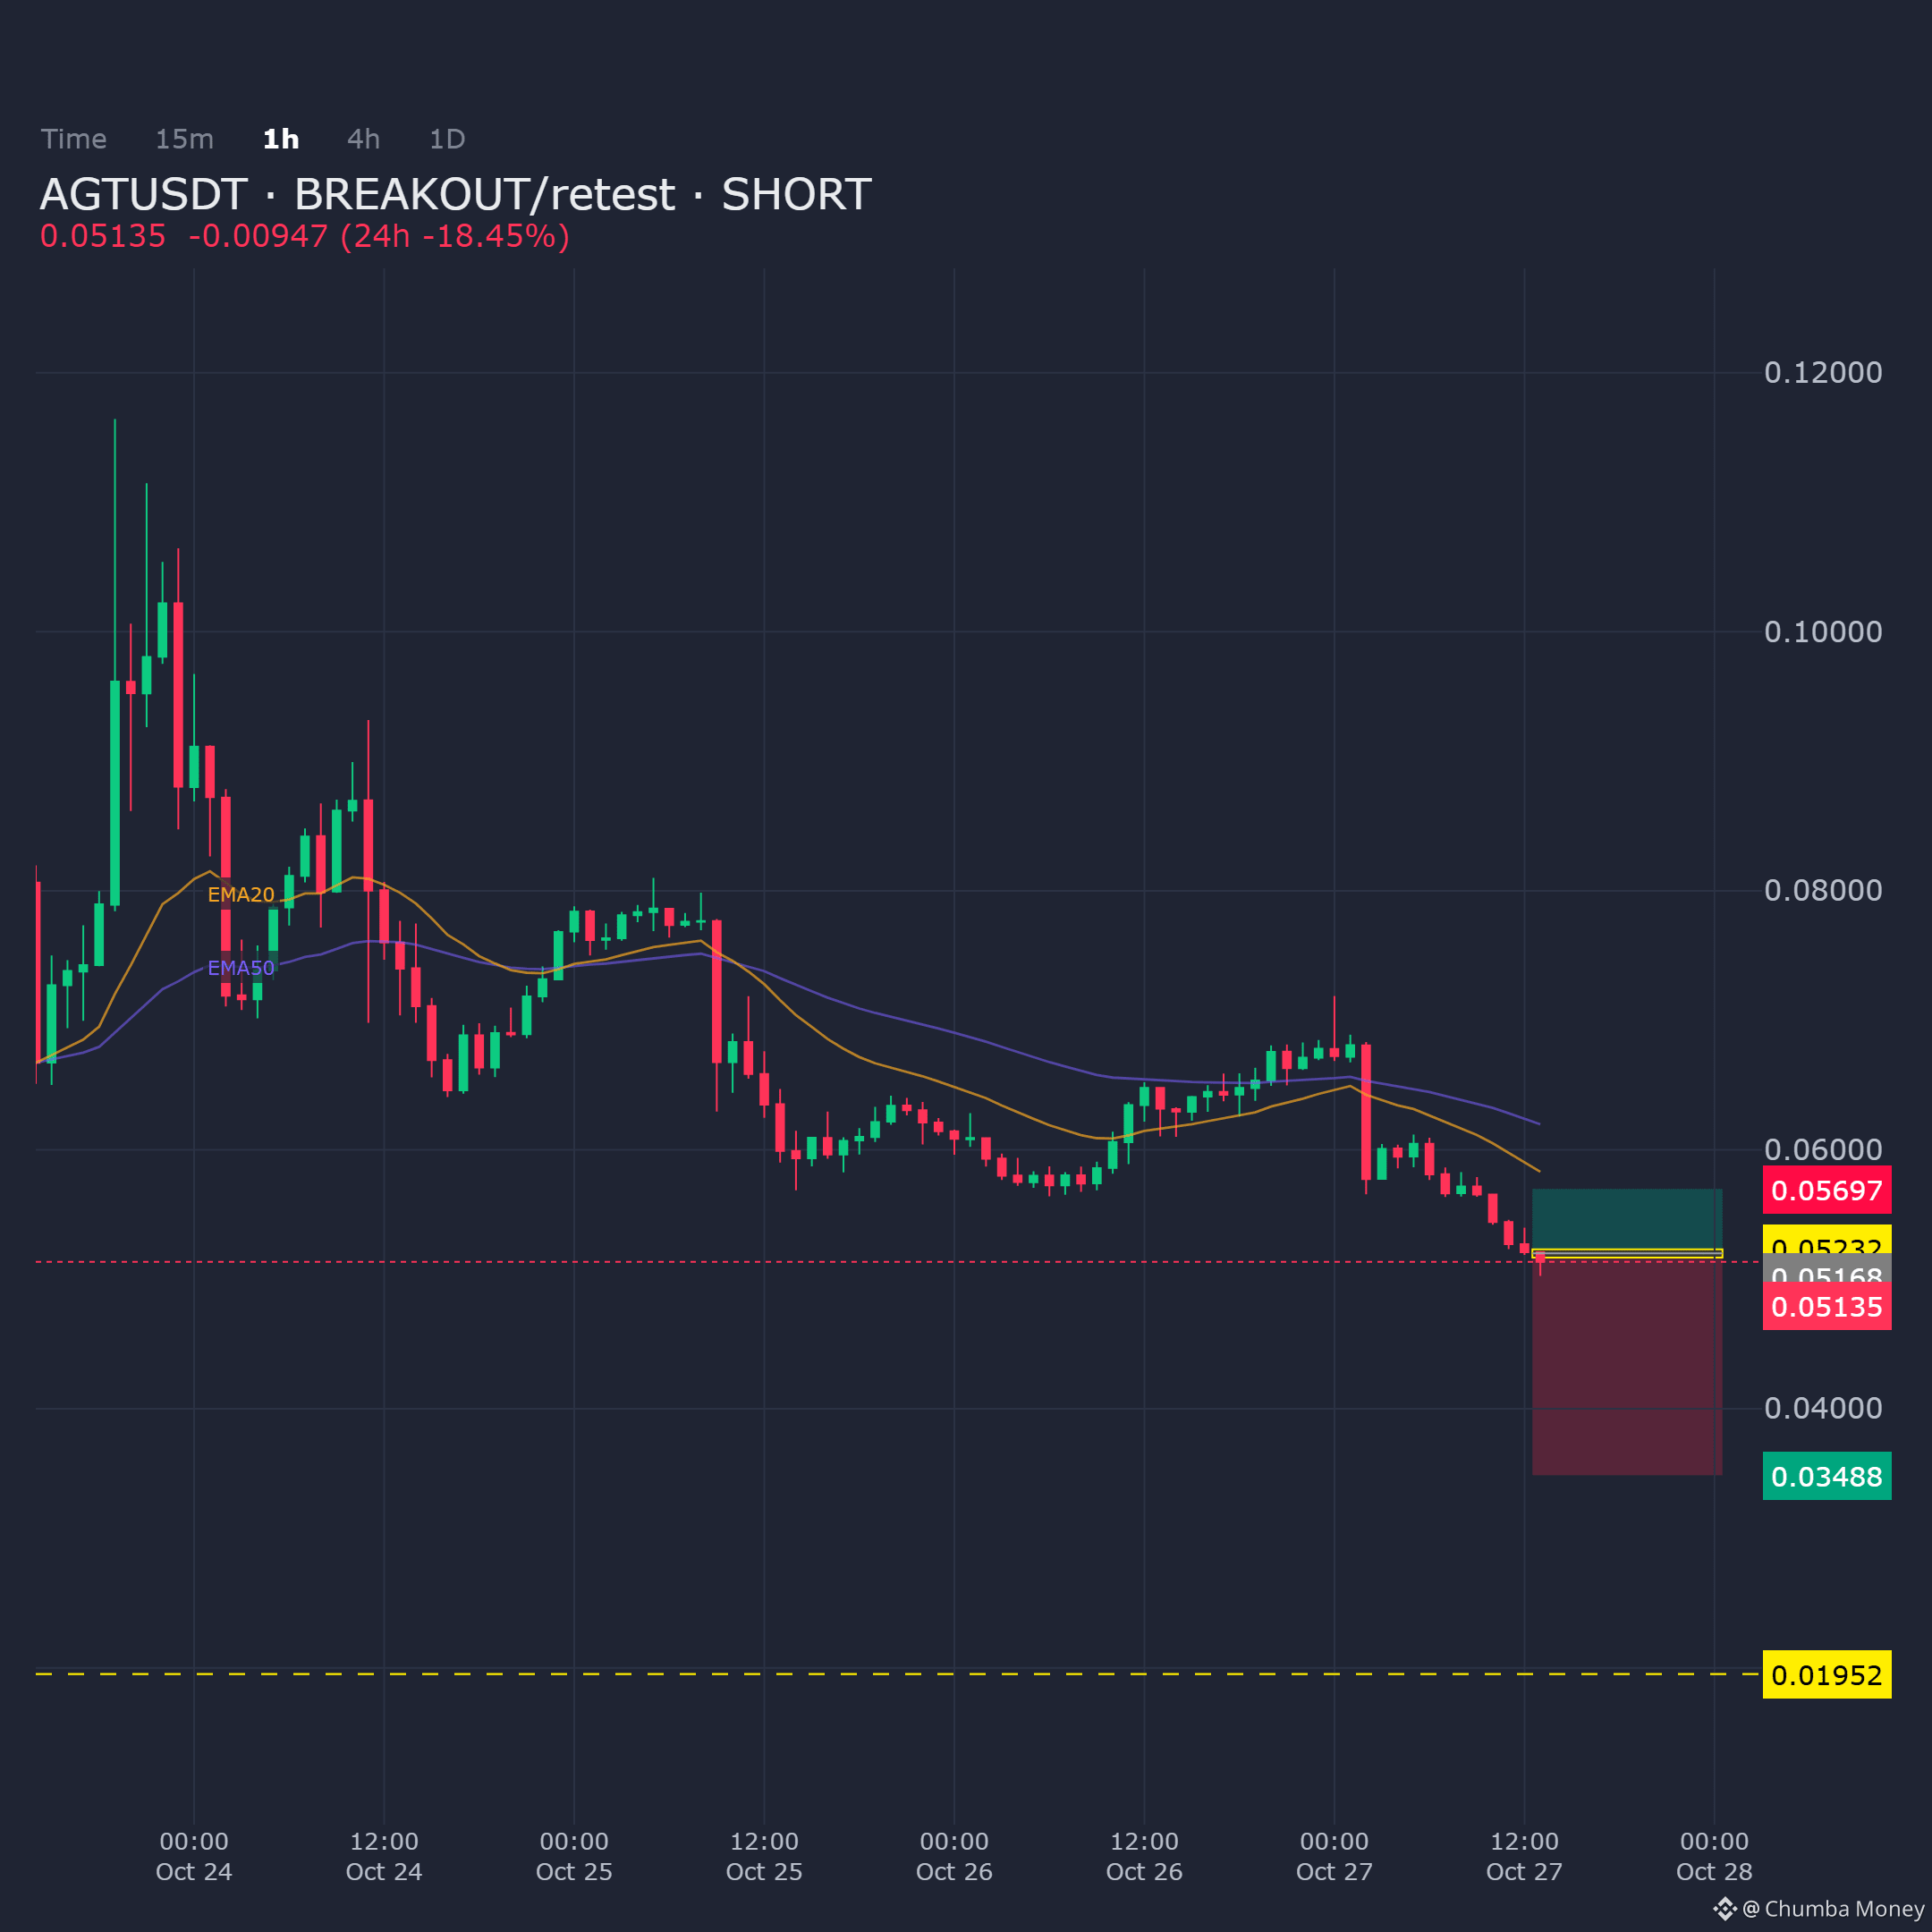
AGTUSDT on the 1H shows bullish momentum exhausting at resistance, favoring a breakout-retest short bias.
Entry: 0.05168 - 0.05232
Targets: TP1: 0.03488, TP2: 0.01952, TP3: 0.01952
Stop Loss: 0.056975
$AGT
AGTUSDT on the 1H shows bullish momentum exhausting at resistance, favoring a breakout-retest short bias.
Entry: 0.05168 - 0.05232
Targets: TP1: 0.03488, TP2: 0.01952, TP3: 0.01952
Stop Loss: 0.056975
$AGT
Entry: 0.05168 - 0.05232
Targets: TP1: 0.03488, TP2: 0.01952, TP3: 0.01952
Stop Loss: 0.056975
$AGT
28
·
--
Übersetzung ansehen
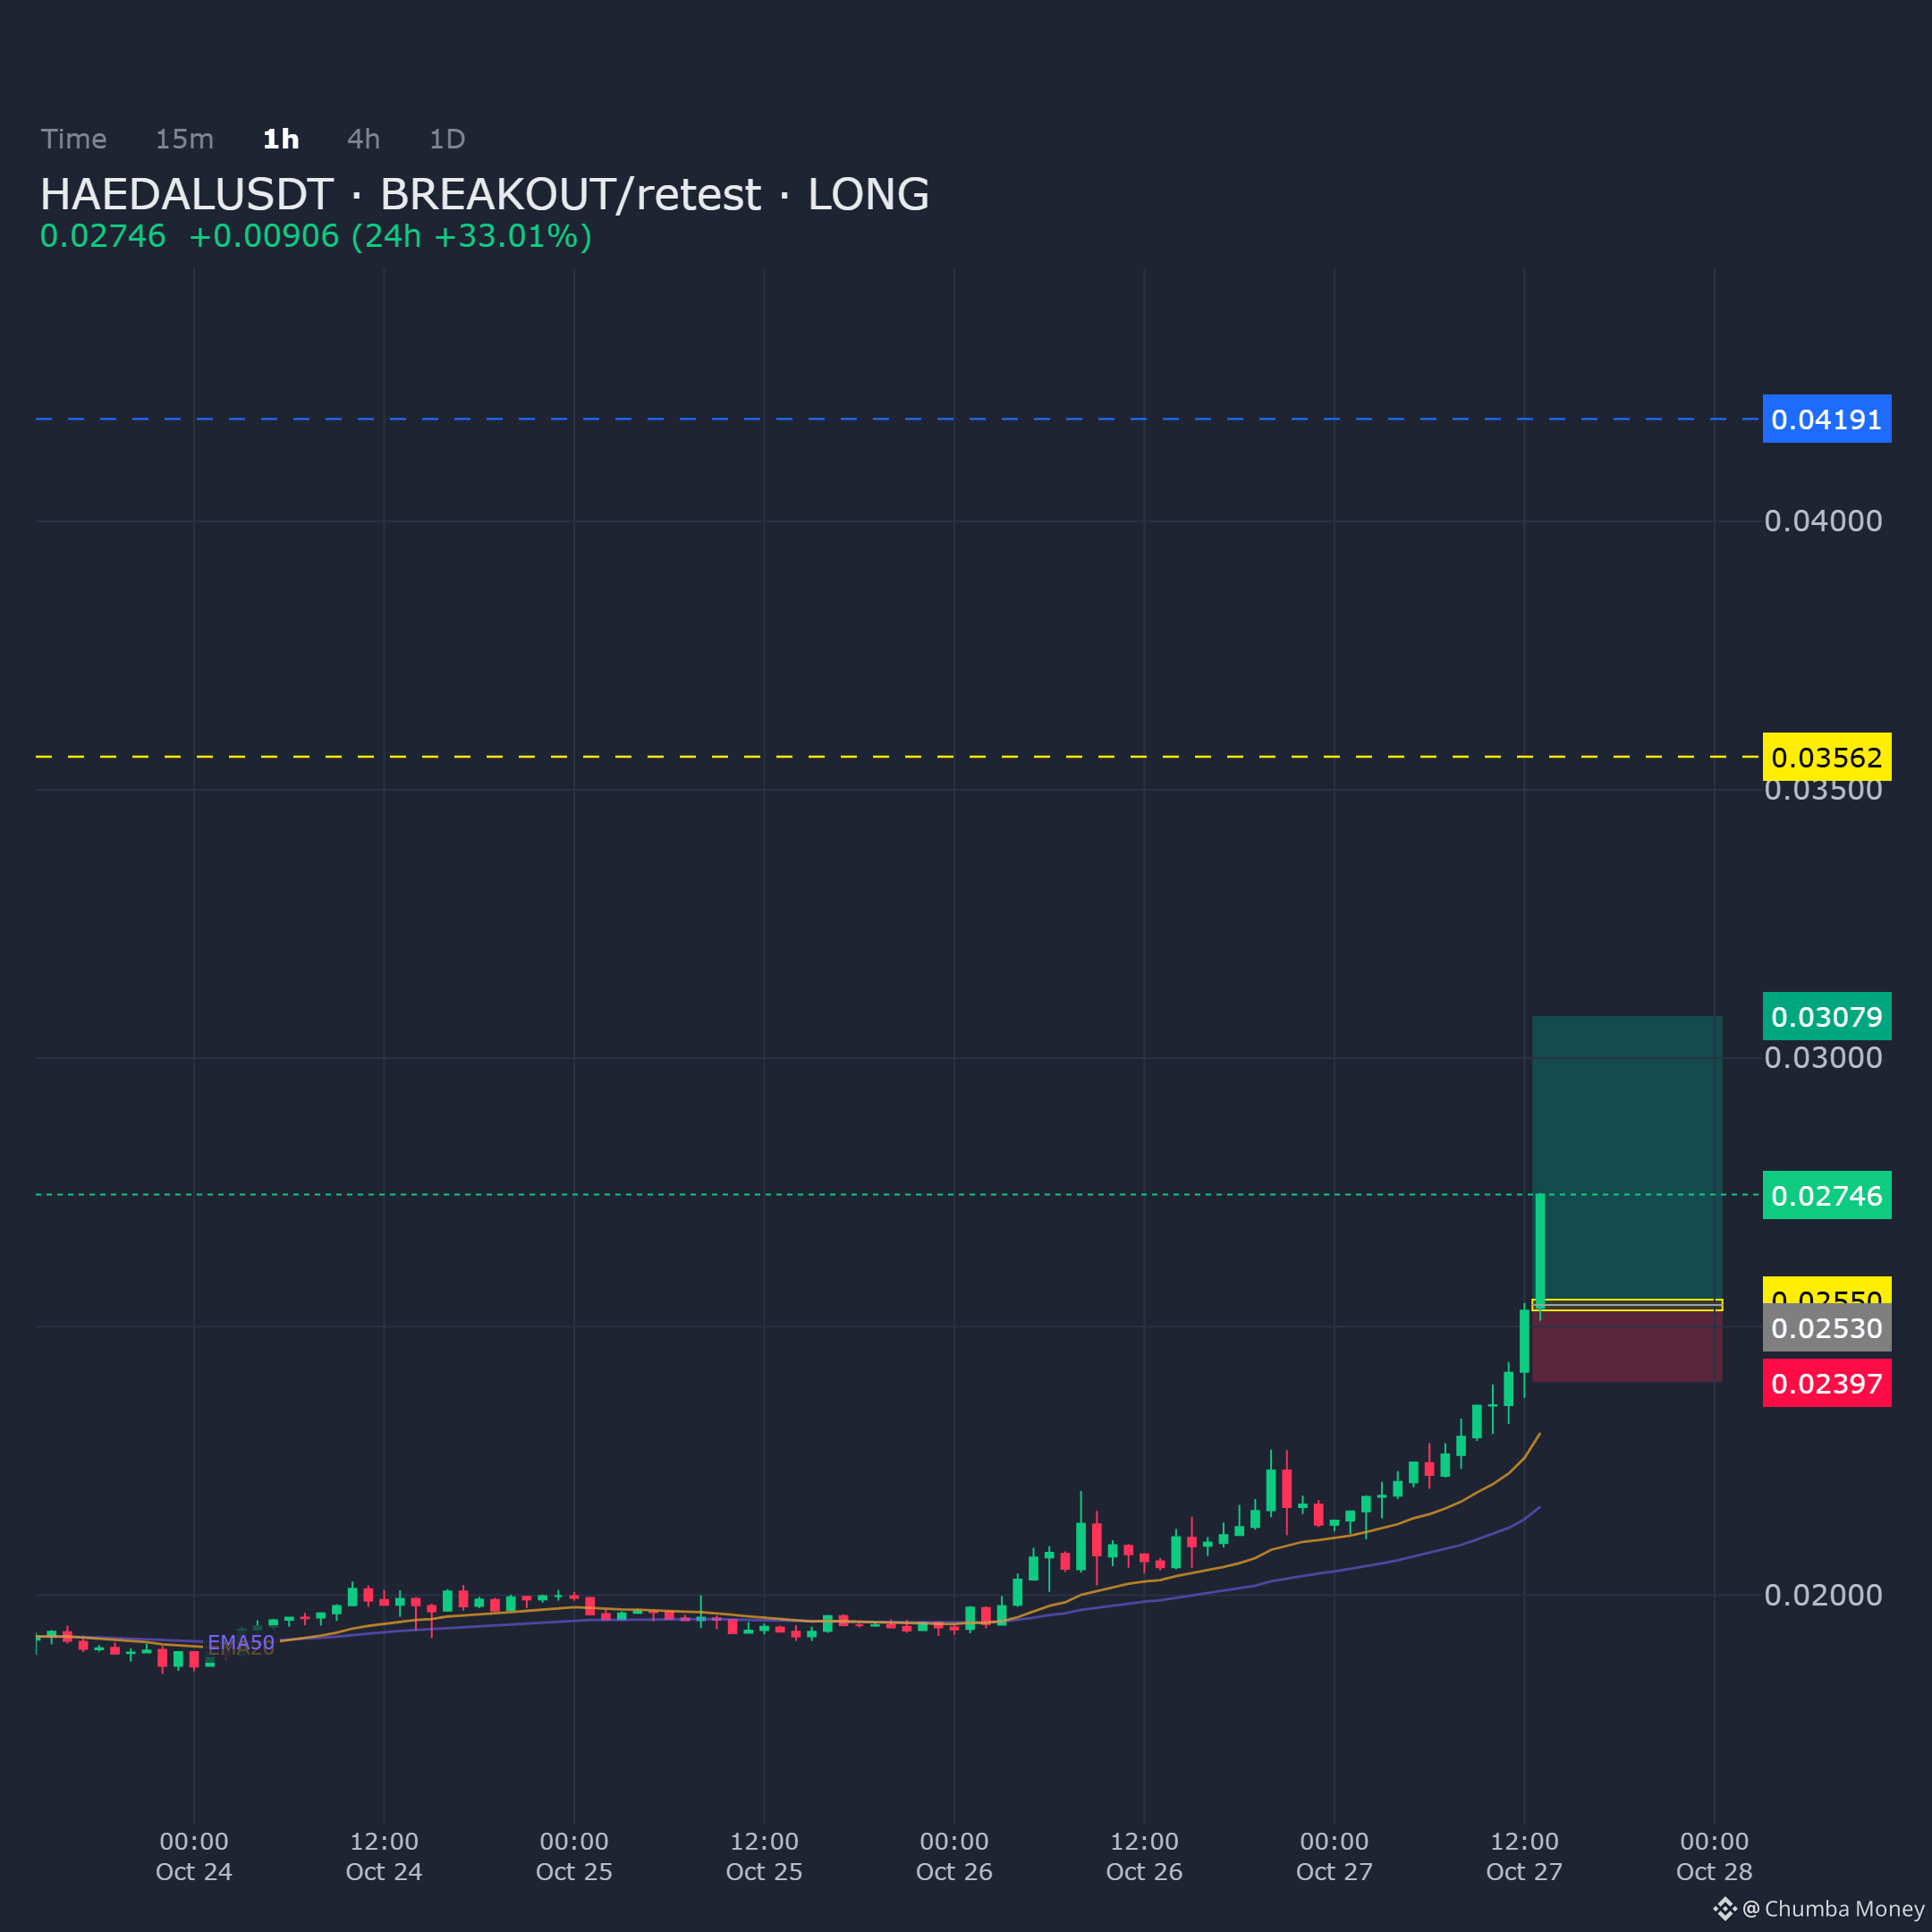
HAEDALUSDT on the 1H timeframe shows a clean breakout structure, with a retest of the broken zone offering a defined long entry into a clear resistance ladder.
Entry: 0.025302 - 0.025503
Targets: TP1: 0.030787, TP2: 0.035617, TP3: 0.041907
Stop Loss: 0.023966
$HAEDAL
HAEDALUSDT on the 1H timeframe shows a clean breakout structure, with a retest of the broken zone offering a defined long entry into a clear resistance ladder.
Entry: 0.025302 - 0.025503
Targets: TP1: 0.030787, TP2: 0.035617, TP3: 0.041907
Stop Loss: 0.023966
$HAEDAL
Entry: 0.025302 - 0.025503
Targets: TP1: 0.030787, TP2: 0.035617, TP3: 0.041907
Stop Loss: 0.023966
$HAEDAL
49
·
--
Übersetzung ansehen
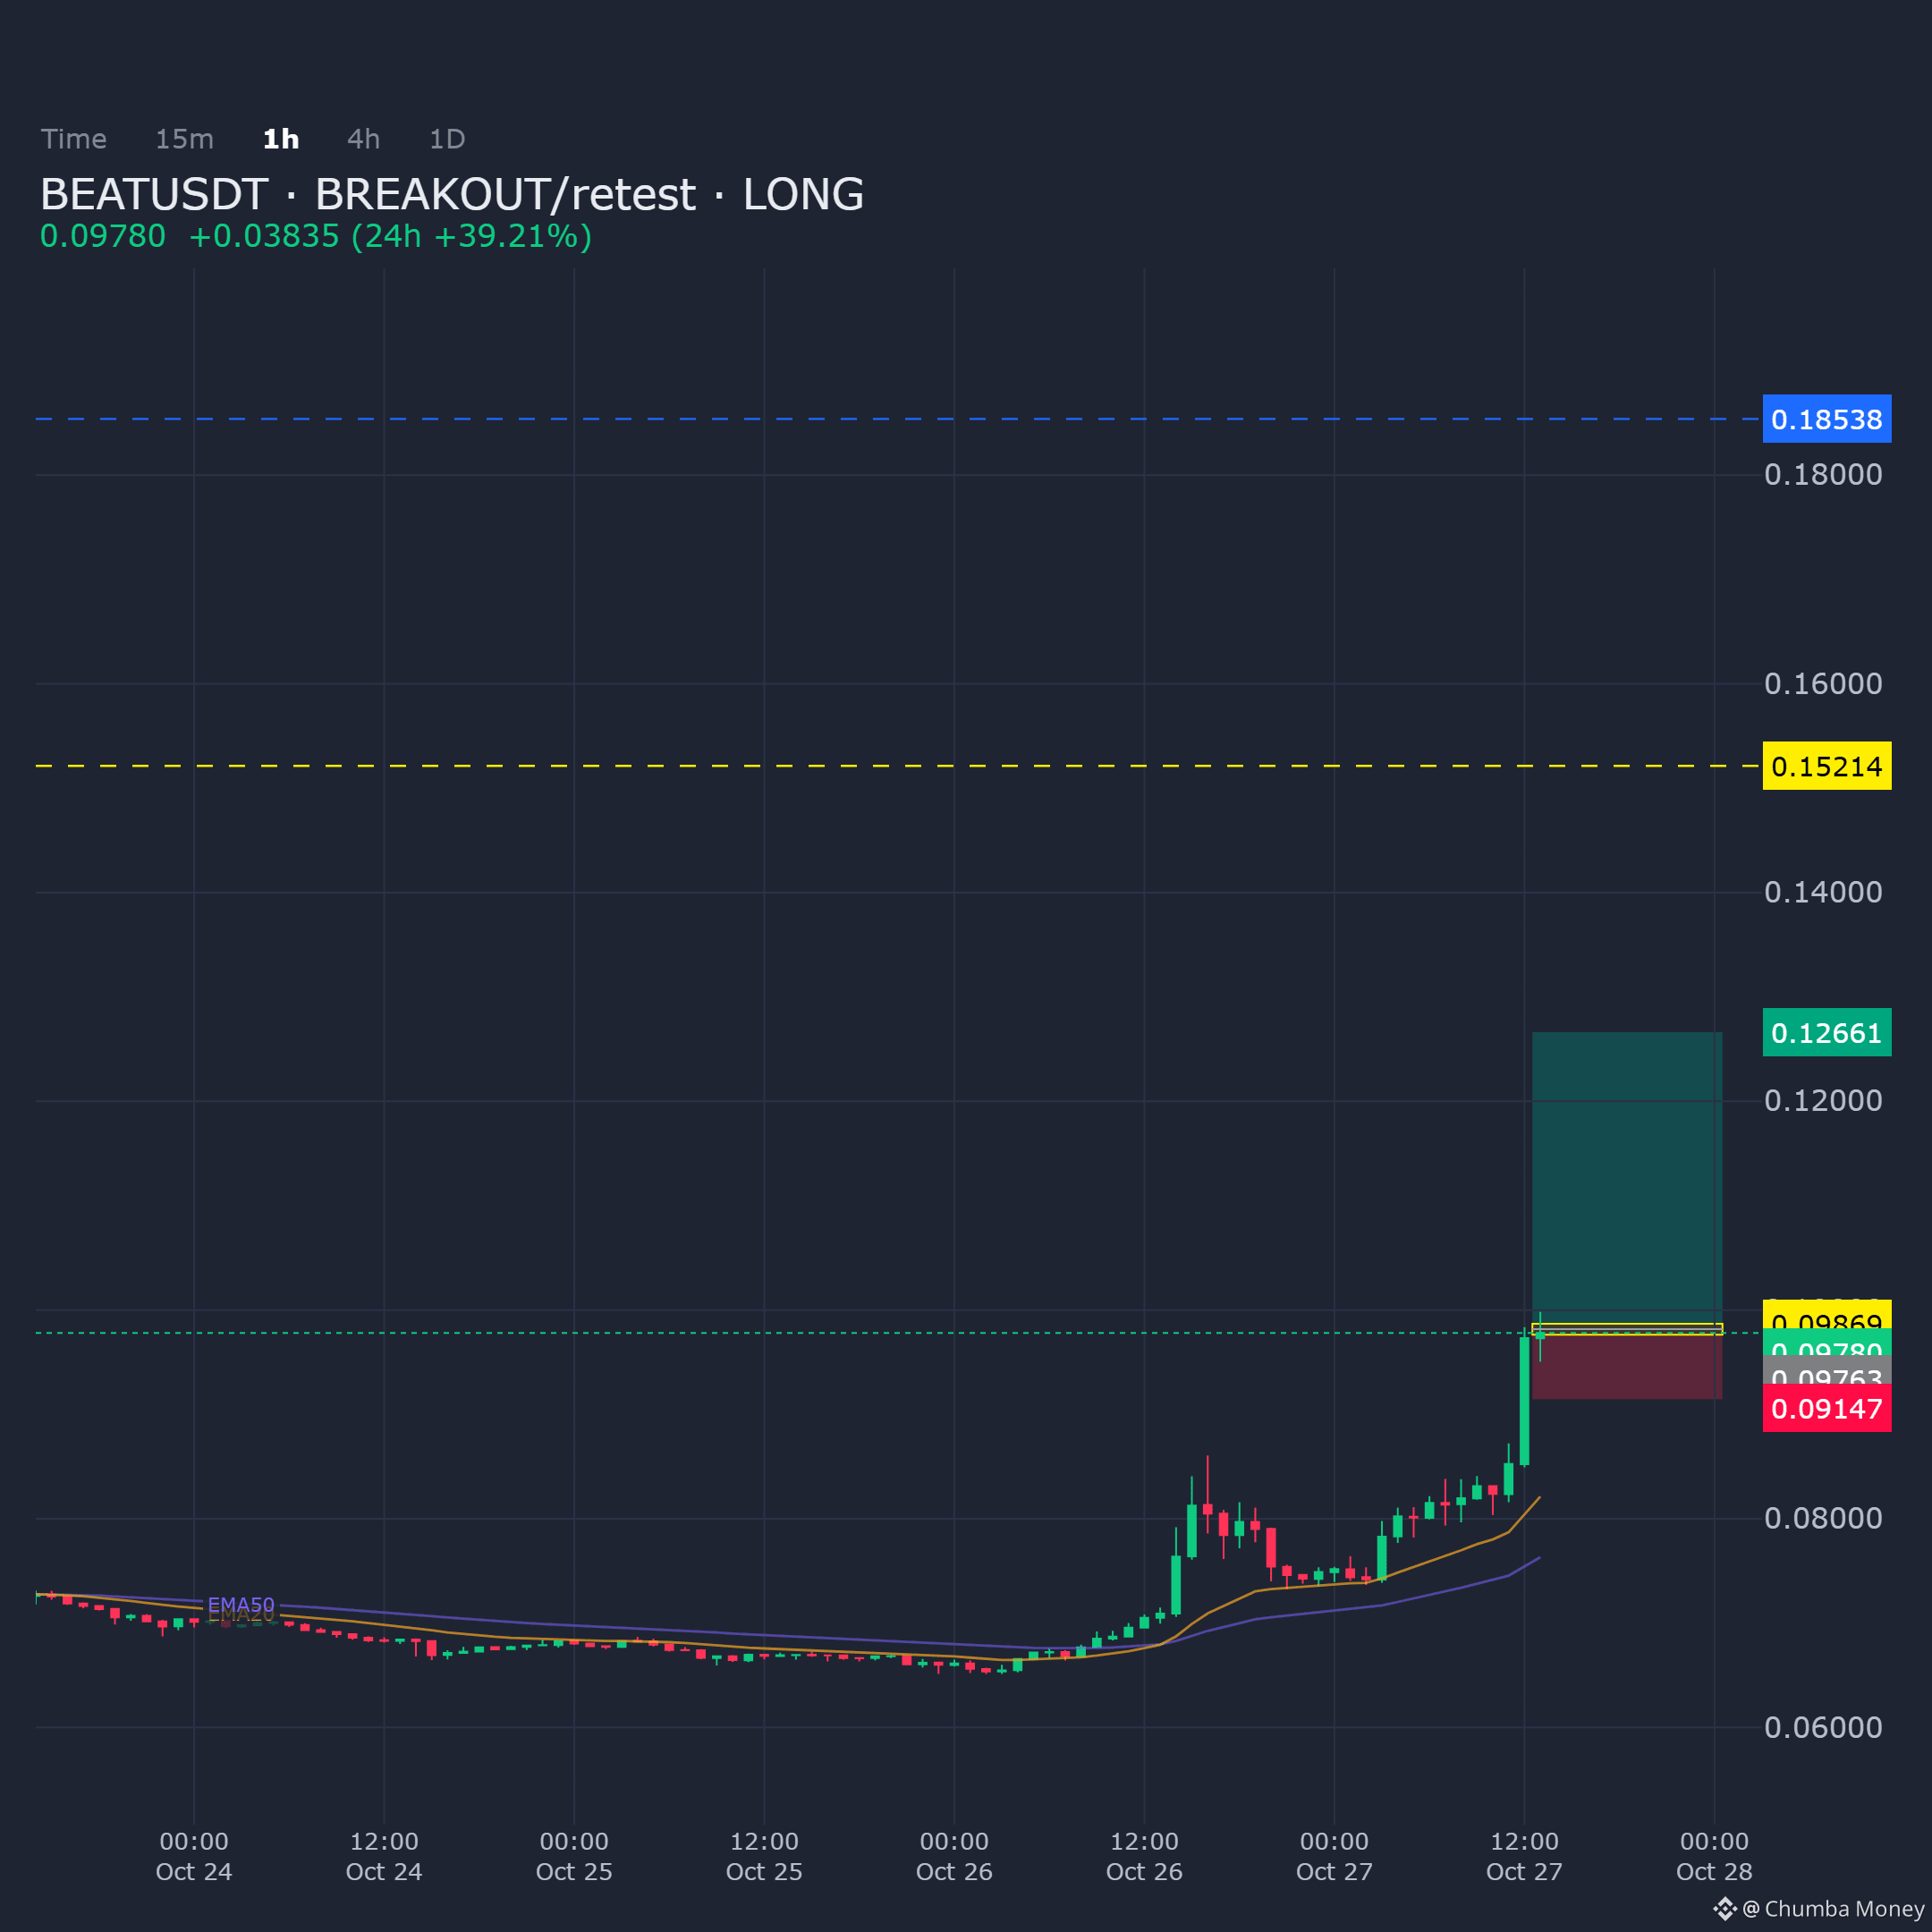
BEATUSDT on the 1H shows a potential breakout and retest scenario. I'm watching this zone for longs.
Entry: 0.097629 - 0.098692
Targets: TP1: 0.126614, TP2: 0.152142, TP3: 0.185382
Stop Loss: 0.091469
$BEAT
BEATUSDT on the 1H shows a potential breakout and retest scenario. I'm watching this zone for longs.
Entry: 0.097629 - 0.098692
Targets: TP1: 0.126614, TP2: 0.152142, TP3: 0.185382
Stop Loss: 0.091469
$BEAT
Entry: 0.097629 - 0.098692
Targets: TP1: 0.126614, TP2: 0.152142, TP3: 0.185382
Stop Loss: 0.091469
$BEAT
43
·
--
Übersetzung ansehen
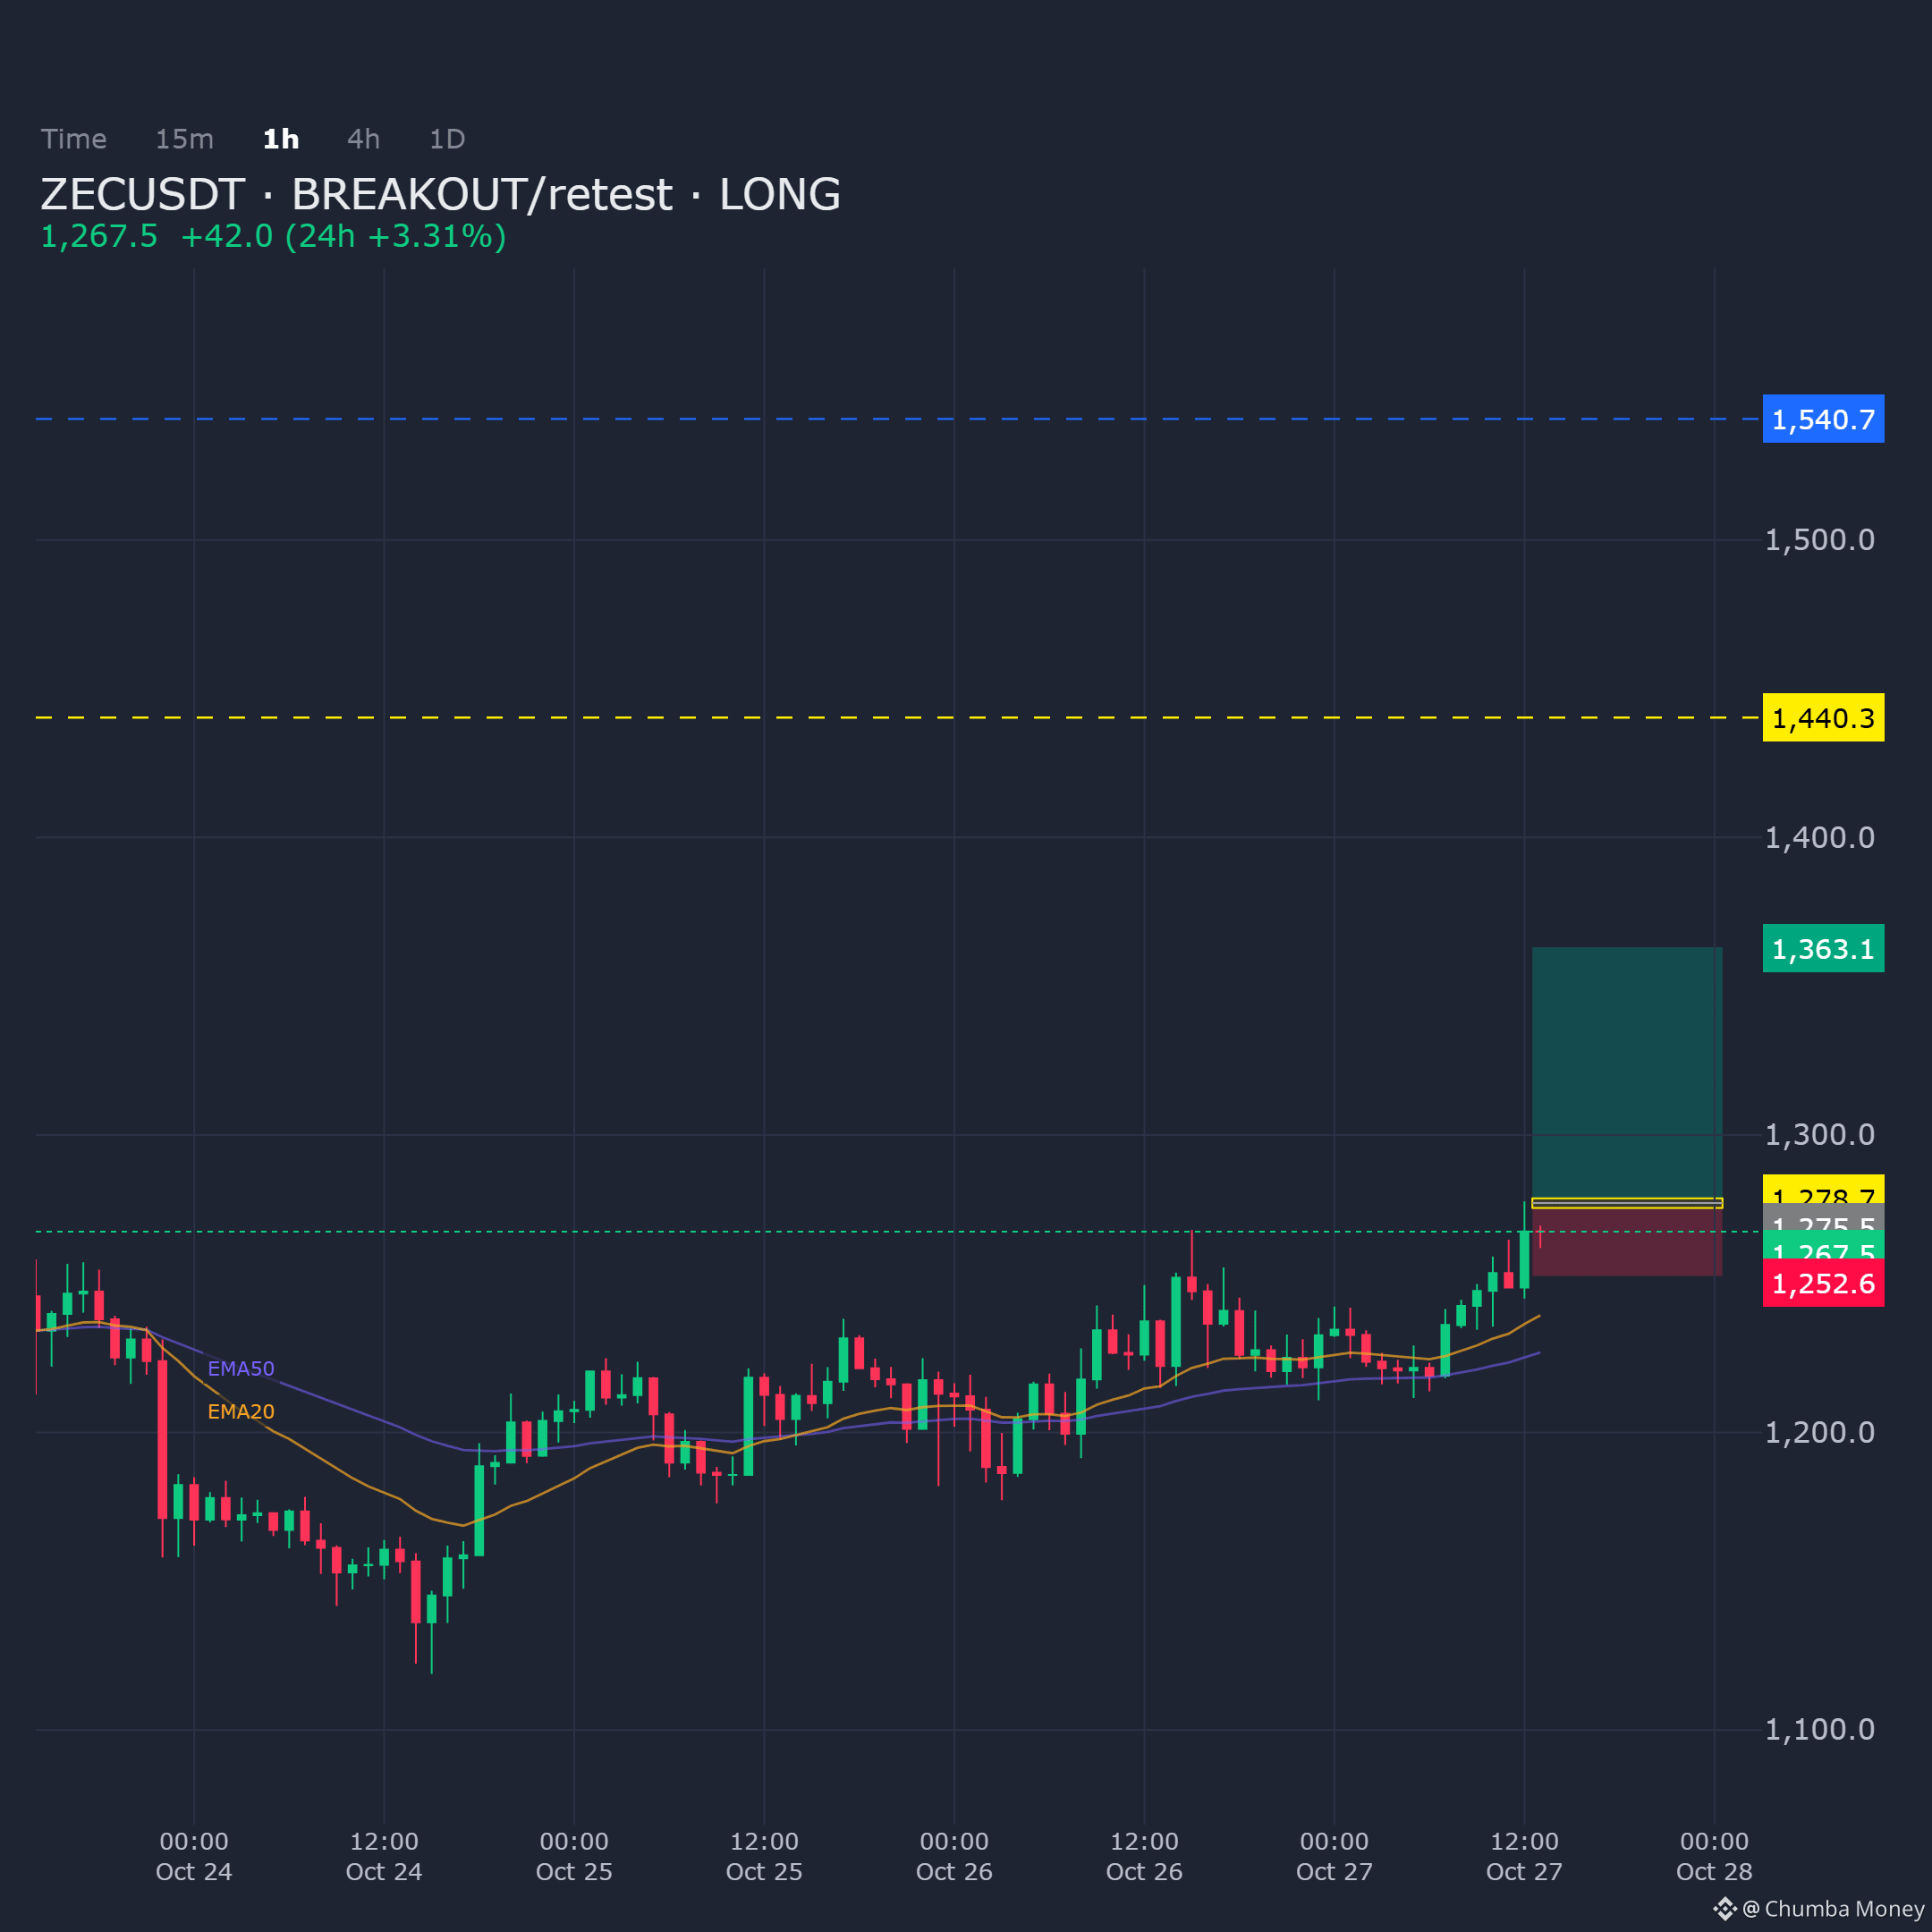
ZECUSDT on the 1H timeframe is showing a clean breakout-and-retest structure, leaning bullish around current demand. Price action is testing support while confluence lines up for a defined long setup.
Entry: 1275.5 - 1278.7
Targets: TP1: 1363.1, TP2: 1440.3, TP3: 1540.7
Stop Loss: 1252.6
$ZEC
ZECUSDT on the 1H timeframe is showing a clean breakout-and-retest structure, leaning bullish around current demand. Price action is testing support while confluence lines up for a defined long setup.
Entry: 1275.5 - 1278.7
Targets: TP1: 1363.1, TP2: 1440.3, TP3: 1540.7
Stop Loss: 1252.6
$ZEC
Entry: 1275.5 - 1278.7
Targets: TP1: 1363.1, TP2: 1440.3, TP3: 1540.7
Stop Loss: 1252.6
$ZEC
27
Anmelden und weiter Inhalte entdecken
Krypto-Nutzer weltweit auf Binance Square kennenlernen
⚡️ Bleib in Sachen Krypto stets am Puls.
💬 Die weltgrößte Kryptobörse vertraut darauf.
👍 Erhalte verlässliche Einblicke von verifizierten Creators.
E-Mail-Adresse/Telefonnummer