
BLOCKMACRO
16 Beiträge

BLOCKMACRO
Melden
Nutzer blockieren
Crypto Analyst | BTC, ETH & Altcoins | Macroeconomics, Stocks & Indices | Institutional Flows | Data-Driven Market Insights.
2 Following
2 Follower
9 Like gegeben
Beiträge
Alle
Zitierungen
PINNED
·
--
🚀 WILLKOMMEN BEI BLOCKMACRO
Mehr als Krypto. Die Kräfte verstehen.
Die Finanzmärkte sind miteinander verflochten. Und Krypto bewegt sich nicht isoliert.
Bei BLOCKMACRO blicken wir über Preischarts hinaus und untersuchen die Kräfte, die den Kryptowährungsmarkt prägen.
📊 Unsere Themen:
₿ Bitcoin & Ethereum
🌐 Altcoins & neue Krypto-Trends
🏦 Institutionelle Kapitalflüsse & Bitcoin-ETFs
📈 Makroökonomie & Geldpolitik der US-Notenbank
📉 US-Aktien, Nasdaq & globale Indizes
💧 Globale Liquidität & Marktstimmung
🐋 On-Chain-Daten & Aktivitäten von Walen
Unsere Mission ist einfach:
Verstehen, WARUM sich der Markt bewegt, herausfinden, WAS ihn antreibt, und erkunden, WAS als Nächstes passieren könnte.
Kein Hype. Keine leeren Versprechen. Nur Recherche, Analysen und Marktkenntnisse.
Folge BLOCKMACRO. Lass uns gemeinsam den Kryptomarkt entschlüsseln.
#BLOCKMACRO #Bitcoin #Krypto #Makroökonomie #BTC
🚀 WILLKOMMEN BEI BLOCKMACRO
Mehr als Krypto. Die Kräfte verstehen.
Die Finanzmärkte sind miteinander verflochten. Und Krypto bewegt sich nicht isoliert.
Bei BLOCKMACRO blicken wir über Preischarts hinaus und untersuchen die Kräfte, die den Kryptowährungsmarkt prägen.
📊 Unsere Themen:
₿ Bitcoin & Ethereum
🌐 Altcoins & neue Krypto-Trends
🏦 Institutionelle Kapitalflüsse & Bitcoin-ETFs
📈 Makroökonomie & Geldpolitik der US-Notenbank
📉 US-Aktien, Nasdaq & globale Indizes
💧 Globale Liquidität & Marktstimmung
🐋 On-Chain-Daten & Aktivitäten von Walen
Unsere Mission ist einfach:
Verstehen, WARUM sich der Markt bewegt, herausfinden, WAS ihn antreibt, und erkunden, WAS als Nächstes passieren könnte.
Kein Hype. Keine leeren Versprechen. Nur Recherche, Analysen und Marktkenntnisse.
Folge BLOCKMACRO. Lass uns gemeinsam den Kryptomarkt entschlüsseln.
#BLOCKMACRO #Bitcoin #Krypto #Makroökonomie #BTC
Mehr als Krypto. Die Kräfte verstehen.
Die Finanzmärkte sind miteinander verflochten. Und Krypto bewegt sich nicht isoliert.
Bei BLOCKMACRO blicken wir über Preischarts hinaus und untersuchen die Kräfte, die den Kryptowährungsmarkt prägen.
📊 Unsere Themen:
₿ Bitcoin & Ethereum
🌐 Altcoins & neue Krypto-Trends
🏦 Institutionelle Kapitalflüsse & Bitcoin-ETFs
📈 Makroökonomie & Geldpolitik der US-Notenbank
📉 US-Aktien, Nasdaq & globale Indizes
💧 Globale Liquidität & Marktstimmung
🐋 On-Chain-Daten & Aktivitäten von Walen
Unsere Mission ist einfach:
Verstehen, WARUM sich der Markt bewegt, herausfinden, WAS ihn antreibt, und erkunden, WAS als Nächstes passieren könnte.
Kein Hype. Keine leeren Versprechen. Nur Recherche, Analysen und Marktkenntnisse.
Folge BLOCKMACRO. Lass uns gemeinsam den Kryptomarkt entschlüsseln.
#BLOCKMACRO #Bitcoin #Krypto #Makroökonomie #BTC

1
130
·
--
Übersetzung ansehen
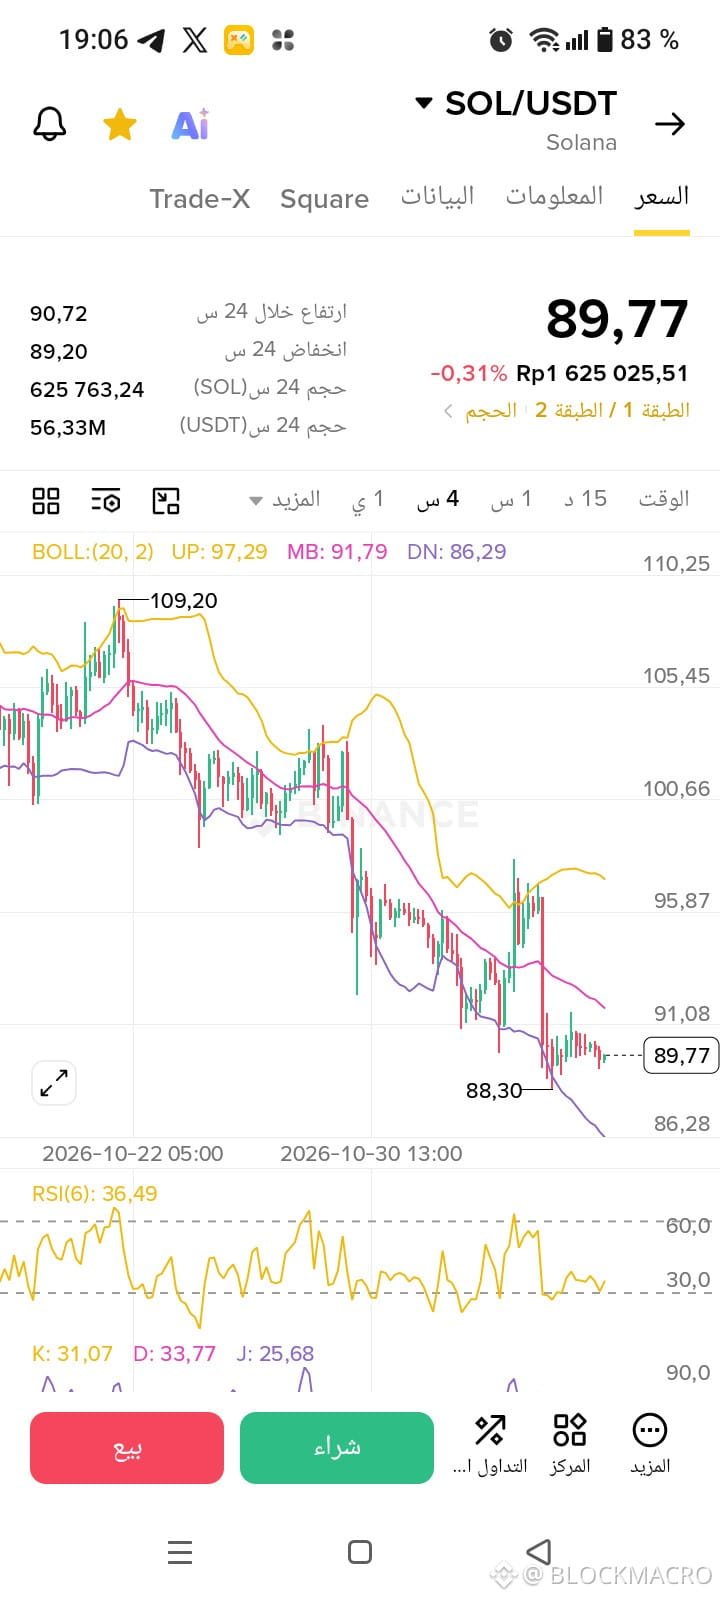
Solana — Beyond Price
⚡ Solana is more than a price chart.
When evaluating SOL, look beyond candles: network activity, transaction fees, ecosystem growth, liquidity and developer adoption all matter.
Strong fundamentals still need market demand.
#solana
Solana — Beyond Price
⚡ Solana is more than a price chart.
When evaluating SOL, look beyond candles: network activity, transaction fees, ecosystem growth, liquidity and developer adoption all matter.
Strong fundamentals still need market demand.
#solana
⚡ Solana is more than a price chart.
When evaluating SOL, look beyond candles: network activity, transaction fees, ecosystem growth, liquidity and developer adoption all matter.
Strong fundamentals still need market demand.
#solana
1
1
1
16
·
--
Übersetzung ansehen
The Dollar & Federal Reserve
💵 Strong economic data can change the crypto outlook.
Stronger US employment increased expectations of another Fed rate hike. A firmer dollar and rising yields can challenge risk assets.
Watch the reaction, not just the headline.
#FederalReserve #btc #Altcoins👀🚀
The Dollar & Federal Reserve
💵 Strong economic data can change the crypto outlook.
Stronger US employment increased expectations of another Fed rate hike. A firmer dollar and rising yields can challenge risk assets.
Watch the reaction, not just the headline.
#FederalReserve #btc #Altcoins👀🚀
💵 Strong economic data can change the crypto outlook.
Stronger US employment increased expectations of another Fed rate hike. A firmer dollar and rising yields can challenge risk assets.
Watch the reaction, not just the headline.
#FederalReserve #btc #Altcoins👀🚀
·
--
Übersetzung ansehen
US Economy — NFP
🇺🇸 The US labor market surprised investors.
October payrolls increased by 165,000, well above the 59,000 market expectation. Unemployment edged down to 4.1%.
Stronger jobs may complicate the Fed's rate-cut outlook.
#FederalReservepolicy #NFP
US Economy — NFP
🇺🇸 The US labor market surprised investors.
October payrolls increased by 165,000, well above the 59,000 market expectation. Unemployment edged down to 4.1%.
Stronger jobs may complicate the Fed's rate-cut outlook.
#FederalReservepolicy #NFP
🇺🇸 The US labor market surprised investors.
October payrolls increased by 165,000, well above the 59,000 market expectation. Unemployment edged down to 4.1%.
Stronger jobs may complicate the Fed's rate-cut outlook.
#FederalReservepolicy #NFP
1
1
·
--
Übersetzung ansehen
Trading Psychology
🧠 The market rewards patience more often than excitement.
You don't need to trade every breakout, catch every bottom or predict every reversal.
Sometimes the best trade is the one you avoid.
#psychology #BTC☀️
Trading Psychology
🧠 The market rewards patience more often than excitement.
You don't need to trade every breakout, catch every bottom or predict every reversal.
Sometimes the best trade is the one you avoid.
#psychology #BTC☀️
🧠 The market rewards patience more often than excitement.
You don't need to trade every breakout, catch every bottom or predict every reversal.
Sometimes the best trade is the one you avoid.
#psychology #BTC☀️
29
·
--
Übersetzung ansehen
Macro impact
"The Fed doesn't move crypto prices alone. The dollar, Treasury yields and liquidity matter too.
Follow the macro, not just the candles.#macroeconomic
Macro impact
"The Fed doesn't move crypto prices alone. The dollar, Treasury yields and liquidity matter too.
Follow the macro, not just the candles.#macroeconomic
"The Fed doesn't move crypto prices alone. The dollar, Treasury yields and liquidity matter too.
Follow the macro, not just the candles.#macroeconomic
51
·
--
Übersetzung ansehen
Bitcoin – Market question
"Bitcoin is testing market confidence again. Is this a buying opportunity or another leg down? What's your view? 👇
#BTC
Bitcoin – Market question
"Bitcoin is testing market confidence again. Is this a buying opportunity or another leg down? What's your view? 👇
#BTC
"Bitcoin is testing market confidence again. Is this a buying opportunity or another leg down? What's your view? 👇
#BTC
87
·
--
Übersetzung ansehen
let's go
let's go
BLOCKMACRO
·
--
“In trading, patience beats talent. Wait for the right setup, not every move.”
#BTC☀️ #etherreum
#BTC☀️ #etherreum

·
--
Übersetzung ansehen
BLOCKMACRO – SOLANA MARKET OUTLOOK
Solana (SOL): Weak Price Action, Stronger Long-Term Fundamentals?
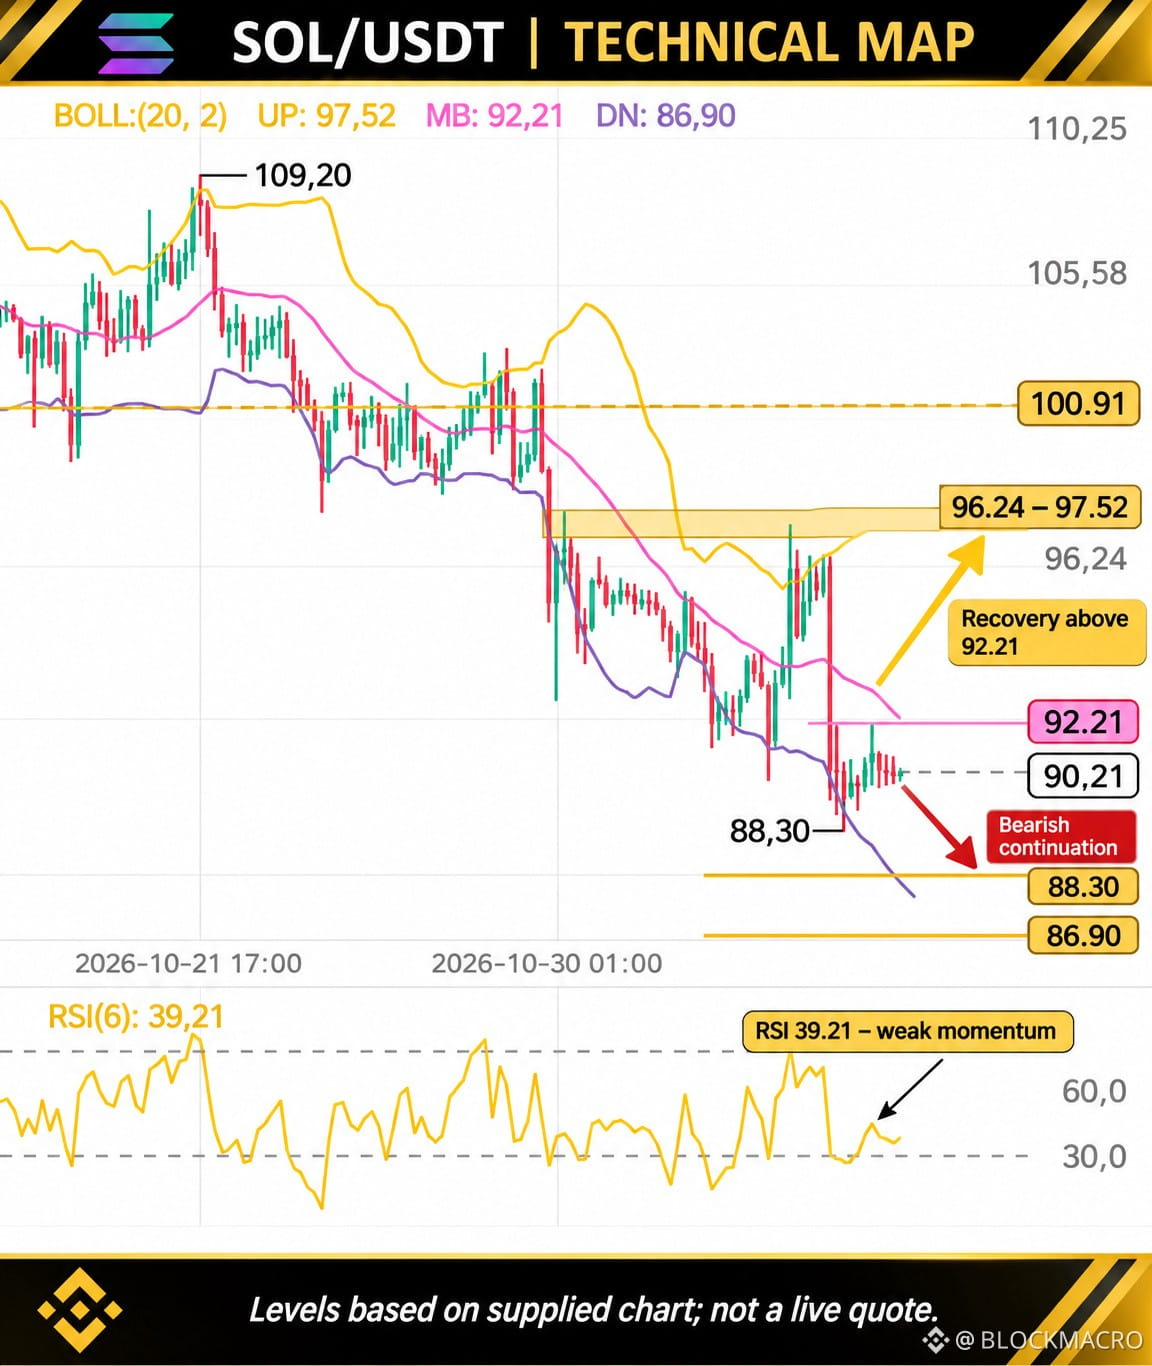
Solana is currently trading around $90.21 on the supplied chart, following a prolonged decline from its recent high near $109.20.
1. Technical Analysis
SOL remains below its Bollinger middle band at $92.21, indicating that sellers still have short-term control.
Immediate support: $88.30
Major support: $86.90
First resistance: $92.21
Key recovery zone: $96.24–$97.52
Upside targets: $100.91, followed by $105.58.
The RSI stands at 39.21, showing weak momentum but not yet confirming a bullish reversal.
Bullish scenario: A sustained move above $92.21 could open the way toward $96–$97.50. A confirmed breakout above this zone may expose $100.91 and $105.58.
Bearish scenario: A decisive break below $88.30 could expose the $86.90 support area. Losing that level would increase downside risk.
2. Fundamental Analysis
Despite short-term market weakness, Solana's ecosystem continues to develop.
The Solana Foundation reported that Alpenglow was activated, target slot times were reduced to 200 milliseconds, and the network's real-world asset value reached a record $5 billion in October.
Another important development is the integration of USDC on Solana into Samsung Wallet for eligible US Galaxy users, potentially expanding real-world payment access.
However, institutional sentiment requires attention: Solana spot ETFs recorded net outflows on November 6, suggesting that institutional demand remains cautious.
3. BLOCKMACRO Verdict
Solana has meaningful ecosystem developments, but positive fundamentals do not automatically create an immediate price rally.
For now, $92.21 is the first level bulls need to reclaim, while $88.30 remains critical support.
The next major move may depend on Bitcoin's direction, broader risk appetite, and renewed institutional demand.
Strong technology. Weak short-term momentum. Confirmation is still needed.
This analysis is based on the supplied chart and available public information. It is not financial advice.
#Solana
BLOCKMACRO – SOLANA MARKET OUTLOOK
Solana (SOL): Weak Price Action, Stronger Long-Term Fundamentals?
Solana is currently trading around $90.21 on the supplied chart, following a prolonged decline from its recent high near $109.20.
1. Technical Analysis
SOL remains below its Bollinger middle band at $92.21, indicating that sellers still have short-term control.
Immediate support: $88.30
Major support: $86.90
First resistance: $92.21
Key recovery zone: $96.24–$97.52
Upside targets: $100.91, followed by $105.58.
The RSI stands at 39.21, showing weak momentum but not yet confirming a bullish reversal.
Bullish scenario: A sustained move above $92.21 could open the way toward $96–$97.50. A confirmed breakout above this zone may expose $100.91 and $105.58.
Bearish scenario: A decisive break below $88.30 could expose the $86.90 support area. Losing that level would increase downside risk.
2. Fundamental Analysis
Despite short-term market weakness, Solana's ecosystem continues to develop.
The Solana Foundation reported that Alpenglow was activated, target slot times were reduced to 200 milliseconds, and the network's real-world asset value reached a record $5 billion in October.
Another important development is the integration of USDC on Solana into Samsung Wallet for eligible US Galaxy users, potentially expanding real-world payment access.
However, institutional sentiment requires attention: Solana spot ETFs recorded net outflows on November 6, suggesting that institutional demand remains cautious.
3. BLOCKMACRO Verdict
Solana has meaningful ecosystem developments, but positive fundamentals do not automatically create an immediate price rally.
For now, $92.21 is the first level bulls need to reclaim, while $88.30 remains critical support.
The next major move may depend on Bitcoin's direction, broader risk appetite, and renewed institutional demand.
Strong technology. Weak short-term momentum. Confirmation is still needed.
This analysis is based on the supplied chart and available public information. It is not financial advice.
#Solana
Solana (SOL): Weak Price Action, Stronger Long-Term Fundamentals?
Solana is currently trading around $90.21 on the supplied chart, following a prolonged decline from its recent high near $109.20.
1. Technical Analysis
SOL remains below its Bollinger middle band at $92.21, indicating that sellers still have short-term control.
Immediate support: $88.30
Major support: $86.90
First resistance: $92.21
Key recovery zone: $96.24–$97.52
Upside targets: $100.91, followed by $105.58.
The RSI stands at 39.21, showing weak momentum but not yet confirming a bullish reversal.
Bullish scenario: A sustained move above $92.21 could open the way toward $96–$97.50. A confirmed breakout above this zone may expose $100.91 and $105.58.
Bearish scenario: A decisive break below $88.30 could expose the $86.90 support area. Losing that level would increase downside risk.
2. Fundamental Analysis
Despite short-term market weakness, Solana's ecosystem continues to develop.
The Solana Foundation reported that Alpenglow was activated, target slot times were reduced to 200 milliseconds, and the network's real-world asset value reached a record $5 billion in October.
Another important development is the integration of USDC on Solana into Samsung Wallet for eligible US Galaxy users, potentially expanding real-world payment access.
However, institutional sentiment requires attention: Solana spot ETFs recorded net outflows on November 6, suggesting that institutional demand remains cautious.
3. BLOCKMACRO Verdict
Solana has meaningful ecosystem developments, but positive fundamentals do not automatically create an immediate price rally.
For now, $92.21 is the first level bulls need to reclaim, while $88.30 remains critical support.
The next major move may depend on Bitcoin's direction, broader risk appetite, and renewed institutional demand.
Strong technology. Weak short-term momentum. Confirmation is still needed.
This analysis is based on the supplied chart and available public information. It is not financial advice.
#Solana
75
·
--
Übersetzung ansehen
let's go
let's go
BLOCKMACRO
·
--
“In trading, patience beats talent. Wait for the right setup, not every move.”
#BTC☀️ #etherreum
#BTC☀️ #etherreum
·
--
Übersetzung ansehen

2
4
1
14
·
--
Übersetzung ansehen
BLOCKMACRO DAILY INTELLIGENCE
Bitcoin vs. Ethereum: Risk-Off Pressure Meets Oversold Conditions
Bitcoin and Ethereum are showing a similar technical structure: both experienced a sharp rejection after a brief recovery and are now trading close to their recent lows.
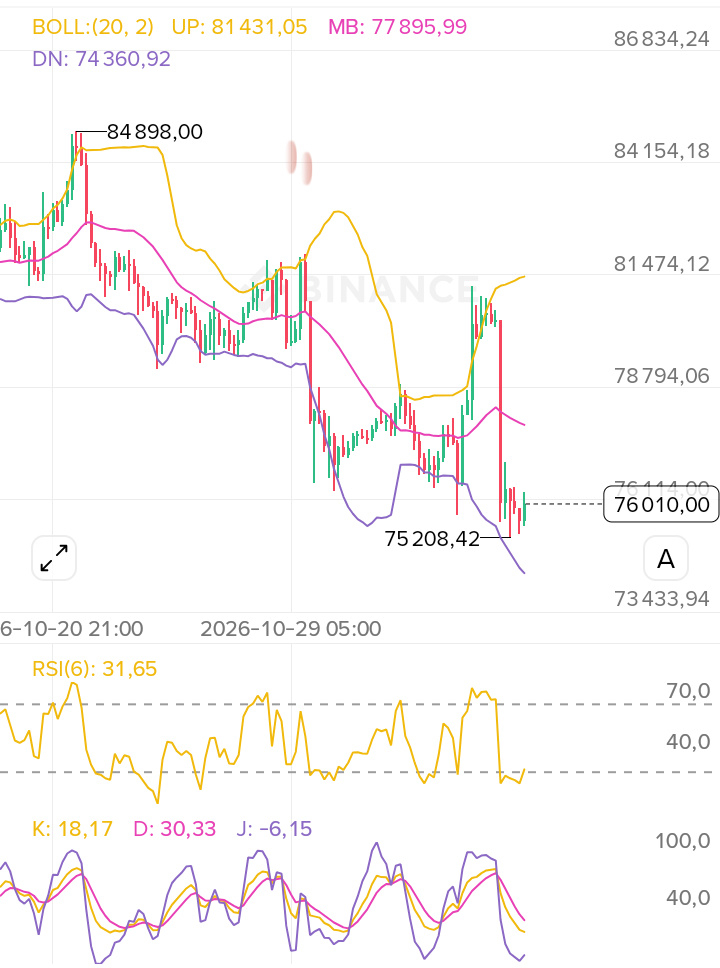
BTC — around $76,010
RSI: 31.65, approaching oversold territory.
Key support: $75,208, followed by $74,360.
First resistance: $77,896.
A sustained recovery above $77,900 could open the way toward $80,000–$81,400.
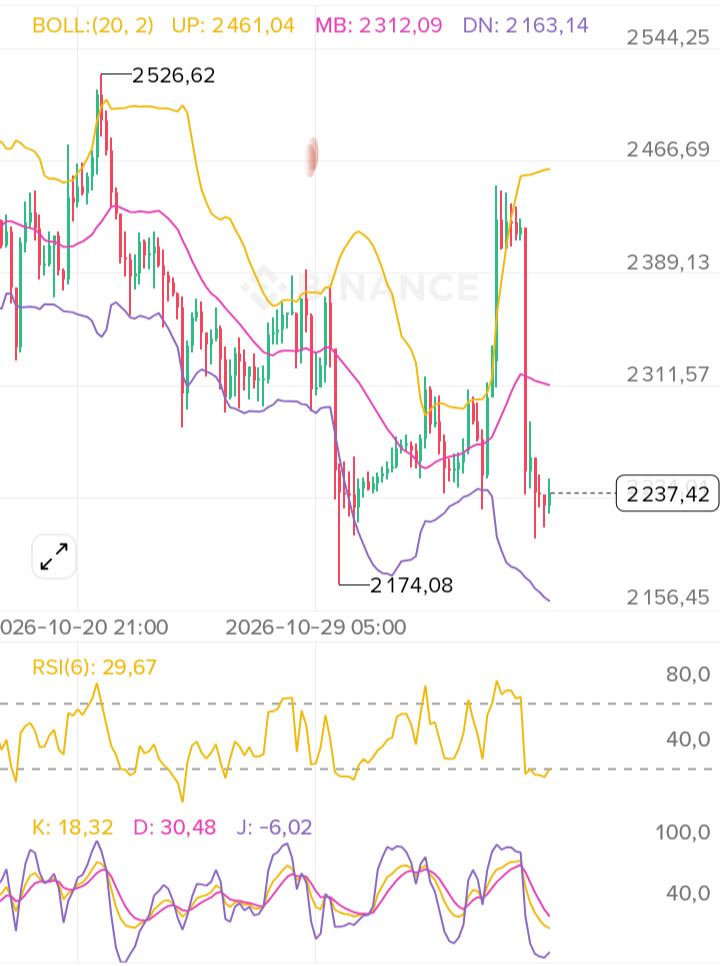
ETH — around $2,237
RSI: 29.67, indicating stronger short-term selling pressure.
Key support: $2,174–$2,163.
First resistance: $2,312.
Reclaiming $2,312 would be an initial sign of recovery.
The macro connection
The sharp sell-off in Nasdaq and Dow Jones, alongside the heavy decline in Japan’s Nikkei, reflects a broader risk-off environment. When investors reduce exposure to technology and growth assets, crypto often faces additional selling pressure.
Institutional ETF outflows add to the caution: Bitcoin and Ethereum funds both recorded significant withdrawals in the latest reported session.
Today's key catalyst: US NFP
The October US jobs report is scheduled for today. Strong employment data could support the dollar and keep pressure on risk assets if markets anticipate tighter monetary conditions. Weaker data could improve rate-cut expectations, although signs of economic weakness may also trigger further risk aversion.
BLOCKMACRO Outlook
Both assets are technically oversold, but neither has confirmed a bullish reversal. A break below their recent lows would increase downside risk. A recovery above the first resistance levels would provide an early signal that selling pressure is easing.
The key question: Will NFP trigger a relief bounce, or deepen the risk-off move?
Technical analysis and market scenarios for educational purposes only. Not financial advice.
#Bitcoin #Ethereum #BTC #ETH #NFP #Nasdaq #DowJones #Nikkei #MacroAnalysis #BLOCKMACRO
BLOCKMACRO DAILY INTELLIGENCE
Bitcoin vs. Ethereum: Risk-Off Pressure Meets Oversold Conditions
Bitcoin and Ethereum are showing a similar technical structure: both experienced a sharp rejection after a brief recovery and are now trading close to their recent lows.
BTC — around $76,010
RSI: 31.65, approaching oversold territory.
Key support: $75,208, followed by $74,360.
First resistance: $77,896.
A sustained recovery above $77,900 could open the way toward $80,000–$81,400.
ETH — around $2,237
RSI: 29.67, indicating stronger short-term selling pressure.
Key support: $2,174–$2,163.
First resistance: $2,312.
Reclaiming $2,312 would be an initial sign of recovery.
The macro connection
The sharp sell-off in Nasdaq and Dow Jones, alongside the heavy decline in Japan’s Nikkei, reflects a broader risk-off environment. When investors reduce exposure to technology and growth assets, crypto often faces additional selling pressure.
Institutional ETF outflows add to the caution: Bitcoin and Ethereum funds both recorded significant withdrawals in the latest reported session.
Today's key catalyst: US NFP
The October US jobs report is scheduled for today. Strong employment data could support the dollar and keep pressure on risk assets if markets anticipate tighter monetary conditions. Weaker data could improve rate-cut expectations, although signs of economic weakness may also trigger further risk aversion.
BLOCKMACRO Outlook
Both assets are technically oversold, but neither has confirmed a bullish reversal. A break below their recent lows would increase downside risk. A recovery above the first resistance levels would provide an early signal that selling pressure is easing.
The key question: Will NFP trigger a relief bounce, or deepen the risk-off move?
Technical analysis and market scenarios for educational purposes only. Not financial advice.
#Bitcoin #Ethereum #BTC #ETH #NFP #Nasdaq #DowJones #Nikkei #MacroAnalysis #BLOCKMACRO
Bitcoin vs. Ethereum: Risk-Off Pressure Meets Oversold Conditions
Bitcoin and Ethereum are showing a similar technical structure: both experienced a sharp rejection after a brief recovery and are now trading close to their recent lows.
BTC — around $76,010
RSI: 31.65, approaching oversold territory.
Key support: $75,208, followed by $74,360.
First resistance: $77,896.
A sustained recovery above $77,900 could open the way toward $80,000–$81,400.
ETH — around $2,237
RSI: 29.67, indicating stronger short-term selling pressure.
Key support: $2,174–$2,163.
First resistance: $2,312.
Reclaiming $2,312 would be an initial sign of recovery.
The macro connection
The sharp sell-off in Nasdaq and Dow Jones, alongside the heavy decline in Japan’s Nikkei, reflects a broader risk-off environment. When investors reduce exposure to technology and growth assets, crypto often faces additional selling pressure.
Institutional ETF outflows add to the caution: Bitcoin and Ethereum funds both recorded significant withdrawals in the latest reported session.
Today's key catalyst: US NFP
The October US jobs report is scheduled for today. Strong employment data could support the dollar and keep pressure on risk assets if markets anticipate tighter monetary conditions. Weaker data could improve rate-cut expectations, although signs of economic weakness may also trigger further risk aversion.
BLOCKMACRO Outlook
Both assets are technically oversold, but neither has confirmed a bullish reversal. A break below their recent lows would increase downside risk. A recovery above the first resistance levels would provide an early signal that selling pressure is easing.
The key question: Will NFP trigger a relief bounce, or deepen the risk-off move?
Technical analysis and market scenarios for educational purposes only. Not financial advice.
#Bitcoin #Ethereum #BTC #ETH #NFP #Nasdaq #DowJones #Nikkei #MacroAnalysis #BLOCKMACRO
2
138
·
--
Übersetzung ansehen
📉 BITCOIN UNDER PRESSURE: $81,000 TO $75,500
BLOCKMACRO | BTC Market Analysis
Bitcoin experienced a significant correction after approaching $81,000, dropping to approximately $75,500.
That's a decline of around 6.8% from the recent high.
🔎 KEY MARKET LEVELS
🔴 Resistance: $80,000–$81,000
🟢 Immediate support: $75,500–$76,000
📊 WHAT SHOULD WE WATCH?
1️⃣ BULLISH SCENARIO
If BTC holds above $75,500 and recovers $78,000, buyers may attempt another move toward $80,000–$81,000.
2️⃣ BEARISH SCENARIO
A decisive break below $75,500 could increase selling pressure and expose Bitcoin to lower support zones.
🌍 THE MACRO CONNECTION
Bitcoin doesn't move in isolation.
We need to monitor:
• Nasdaq and US technology stocks.
• Federal Reserve interest-rate expectations.
• US Dollar Index (DXY).
• Treasury yields and global liquidity.
• Bitcoin ETF flows and institutional positioning.
🎯 BLOCKMACRO INSIGHT
The key question is whether this correction represents a temporary liquidity-driven sell-off or a broader change in market sentiment.
Watch the price. Understand the forces.
What is your view: Will Bitcoin reclaim $81,000, or are we heading toward lower levels?
Follow @BLOCKMACRO for crypto and macroeconomic market intelligence.
Educational content only. Not financial advice.
#Bitcoin #BTC #CryptoAnalysis #Macroeconomics #BLOCKMACRO
📉 BITCOIN UNDER PRESSURE: $81,000 TO $75,500
BLOCKMACRO | BTC Market Analysis
Bitcoin experienced a significant correction after approaching $81,000, dropping to approximately $75,500.
That's a decline of around 6.8% from the recent high.
🔎 KEY MARKET LEVELS
🔴 Resistance: $80,000–$81,000
🟢 Immediate support: $75,500–$76,000
📊 WHAT SHOULD WE WATCH?
1️⃣ BULLISH SCENARIO
If BTC holds above $75,500 and recovers $78,000, buyers may attempt another move toward $80,000–$81,000.
2️⃣ BEARISH SCENARIO
A decisive break below $75,500 could increase selling pressure and expose Bitcoin to lower support zones.
🌍 THE MACRO CONNECTION
Bitcoin doesn't move in isolation.
We need to monitor:
• Nasdaq and US technology stocks.
• Federal Reserve interest-rate expectations.
• US Dollar Index (DXY).
• Treasury yields and global liquidity.
• Bitcoin ETF flows and institutional positioning.
🎯 BLOCKMACRO INSIGHT
The key question is whether this correction represents a temporary liquidity-driven sell-off or a broader change in market sentiment.
Watch the price. Understand the forces.
What is your view: Will Bitcoin reclaim $81,000, or are we heading toward lower levels?
Follow @BLOCKMACRO for crypto and macroeconomic market intelligence.
Educational content only. Not financial advice.
#Bitcoin #BTC #CryptoAnalysis #Macroeconomics #BLOCKMACRO
BLOCKMACRO | BTC Market Analysis
Bitcoin experienced a significant correction after approaching $81,000, dropping to approximately $75,500.
That's a decline of around 6.8% from the recent high.
🔎 KEY MARKET LEVELS
🔴 Resistance: $80,000–$81,000
🟢 Immediate support: $75,500–$76,000
📊 WHAT SHOULD WE WATCH?
1️⃣ BULLISH SCENARIO
If BTC holds above $75,500 and recovers $78,000, buyers may attempt another move toward $80,000–$81,000.
2️⃣ BEARISH SCENARIO
A decisive break below $75,500 could increase selling pressure and expose Bitcoin to lower support zones.
🌍 THE MACRO CONNECTION
Bitcoin doesn't move in isolation.
We need to monitor:
• Nasdaq and US technology stocks.
• Federal Reserve interest-rate expectations.
• US Dollar Index (DXY).
• Treasury yields and global liquidity.
• Bitcoin ETF flows and institutional positioning.
🎯 BLOCKMACRO INSIGHT
The key question is whether this correction represents a temporary liquidity-driven sell-off or a broader change in market sentiment.
Watch the price. Understand the forces.
What is your view: Will Bitcoin reclaim $81,000, or are we heading toward lower levels?
Follow @BLOCKMACRO for crypto and macroeconomic market intelligence.
Educational content only. Not financial advice.
#Bitcoin #BTC #CryptoAnalysis #Macroeconomics #BLOCKMACRO
1
60
Anmelden und weiter Inhalte entdecken
Krypto-Nutzer weltweit auf Binance Square kennenlernen
⚡️ Bleib in Sachen Krypto stets am Puls.
💬 Die weltgrößte Kryptobörse vertraut darauf.
👍 Erhalte verlässliche Einblicke von verifizierten Creators.
E-Mail-Adresse/Telefonnummer
Trendthemen
JobsReportRaisesHikeOdds
522,936 Aufrufe
3,367 Kommentare
TradFi-News | USA schaffen im Oktober 165.000 Stellen – mehr als doppelt so viele wie die prognostizierten 65.000 –, während die Arbeitslosenquote auf 4,1 % sinkt
Binance News
·42 Likes
·24.2k Aufrufe
CPITestsDecemberRateOutlook
152,745 Aufrufe
1,134 Kommentare
BitcoinRebounds$75KAsChipsLead
48,276 Aufrufe
343 Kommentare