

ScalpingX TG Channel
3.9k Beiträge

ScalpingX TG Channel
Melden
Nutzer blockieren
1 scalper with unconventional mindset, loves big risks with big profits. Don't ask about the leverage I use, it's always maximum!
0 Following
10 Follower
9 Like gegeben
Beiträge
Übersetzung ansehen
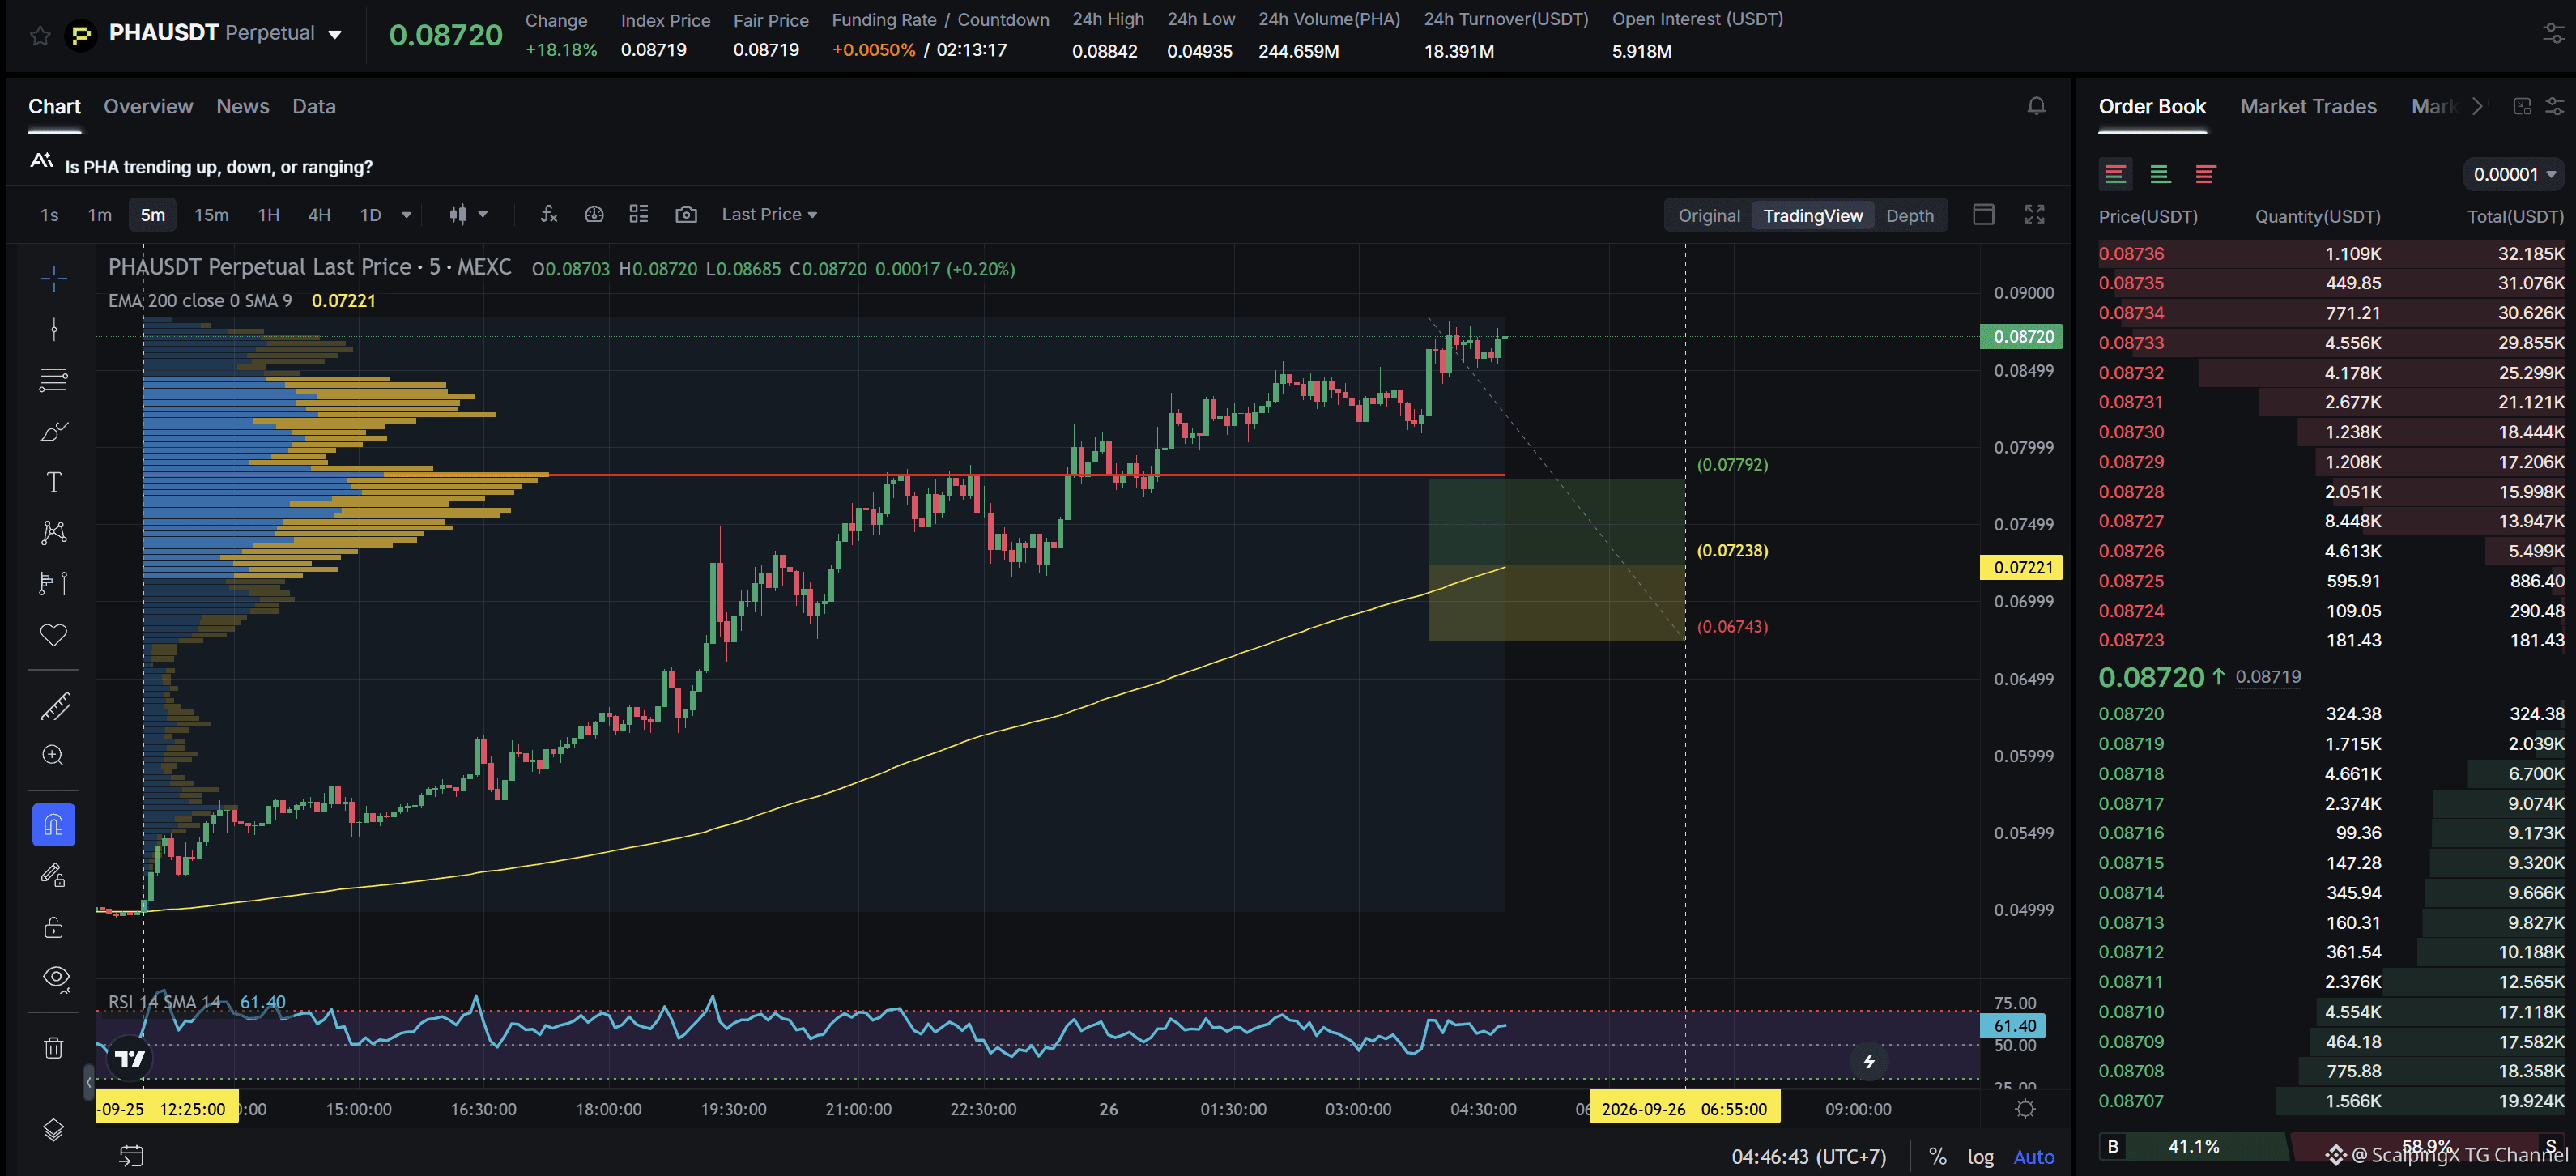
$PHA - Mcap 75.5M$ - 24h Sentiment +4.65 Bullish SC02 M5 - pending Long order. Entry lies within LVN + not affected by any weak zone, the current support zone is approximately 6.87% wide. The uptrend has lasted 16 hours 20 minutes, with a maximum recorded price increase of 79.55%. If price loses this support zone, the trend is highly likely to reverse downward.
$PHA - Mcap 75.5M$ - 24h Sentiment +4.65 Bullish SC02 M5 - pending Long order. Entry lies within LVN + not affected by any weak zone, the current support zone is approximately 6.87% wide. The uptrend has lasted 16 hours 20 minutes, with a maximum recorded price increase of 79.55%. If price loses this support zone, the trend is highly likely to reverse downward.
Übersetzung ansehen
US consumer sentiment falls to a four-month low as inflation expectations remain elevated
📉 The University of Michigan’s final September consumer sentiment index came in at 48.1, slightly above the preliminary 47.8 and expectations around 47.5–47.6, but still down 7% from August.
🔎 Weakness was concentrated in the outlook, with the Expectations Index falling 10.1% to 46.3, while Current Conditions declined only 1.9%. This suggests consumers are more concerned about the months ahead than about current conditions.
🔥 One-year inflation expectations held at 4.6%, while the five-year measure rose to 3.4%. Higher fuel costs and trade-related pressures continue to weigh on sentiment, leaving growth concerns elevated alongside persistent price risks.
🏦 The final reading did not deliver a new negative shock, as most of the deterioration was already visible in the preliminary release. Still, weak sentiment combined with elevated inflation expectations keeps the outlook for Fed policy easing more complicated.
#USMacro
$ETH
US consumer sentiment falls to a four-month low as inflation expectations remain elevated
📉 The University of Michigan’s final September consumer sentiment index came in at 48.1, slightly above the preliminary 47.8 and expectations around 47.5–47.6, but still down 7% from August.
🔎 Weakness was concentrated in the outlook, with the Expectations Index falling 10.1% to 46.3, while Current Conditions declined only 1.9%. This suggests consumers are more concerned about the months ahead than about current conditions.
🔥 One-year inflation expectations held at 4.6%, while the five-year measure rose to 3.4%. Higher fuel costs and trade-related pressures continue to weigh on sentiment, leaving growth concerns elevated alongside persistent price risks.
🏦 The final reading did not deliver a new negative shock, as most of the deterioration was already visible in the preliminary release. Still, weak sentiment combined with elevated inflation expectations keeps the outlook for Fed policy easing more complicated.
#USMacro
$ETH
📉 The University of Michigan’s final September consumer sentiment index came in at 48.1, slightly above the preliminary 47.8 and expectations around 47.5–47.6, but still down 7% from August.
🔎 Weakness was concentrated in the outlook, with the Expectations Index falling 10.1% to 46.3, while Current Conditions declined only 1.9%. This suggests consumers are more concerned about the months ahead than about current conditions.
🔥 One-year inflation expectations held at 4.6%, while the five-year measure rose to 3.4%. Higher fuel costs and trade-related pressures continue to weigh on sentiment, leaving growth concerns elevated alongside persistent price risks.
🏦 The final reading did not deliver a new negative shock, as most of the deterioration was already visible in the preliminary release. Still, weak sentiment combined with elevated inflation expectations keeps the outlook for Fed policy easing more complicated.
#USMacro
$ETH

2
Übersetzung ansehen
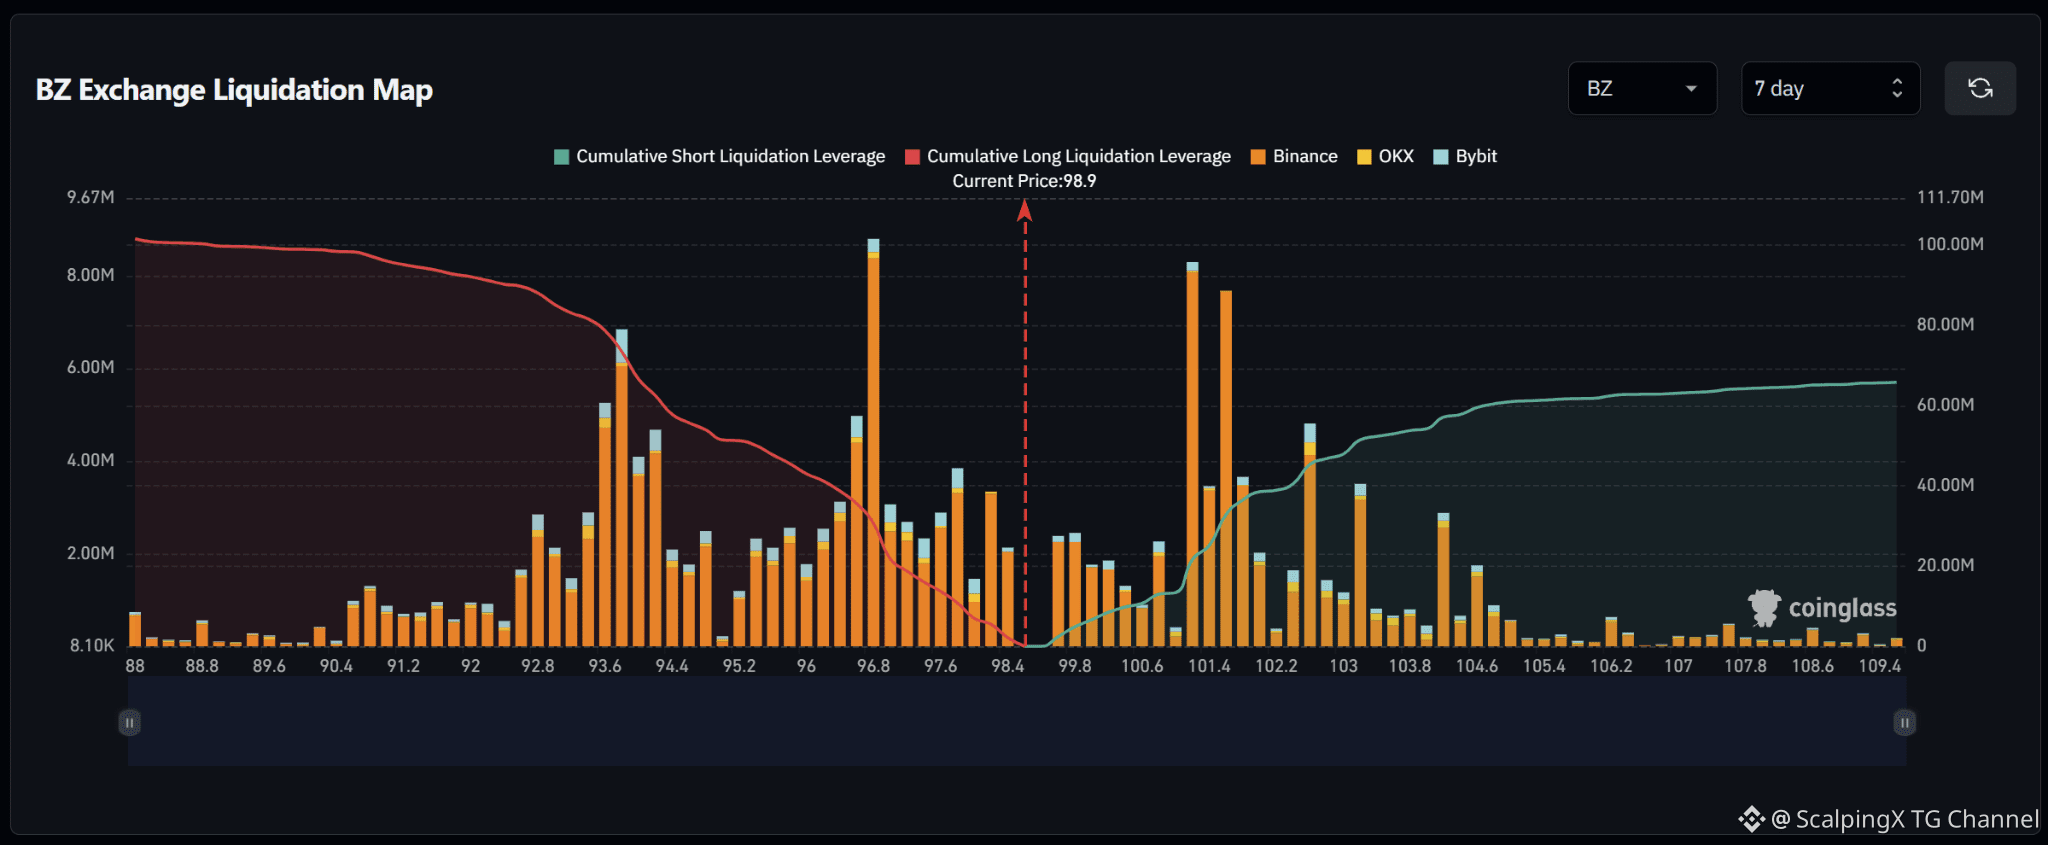
$BZ – Liquidation Map (7 Days) – Current Price 98.9 🔎 The 7-day liquidation map shows roughly 100 million USD in long liquidations below the current price, significantly exceeding approximately 65 million USD in short liquidations above. The liquidity structure therefore favors the downside, with around 1.5 times more cumulative liquidity below the market. 📉 Below the market, long-liquidation liquidity is concentrated heavily across 93.5–97.8. The strongest cluster sits around 96.7–96.9 with a bar close to 9 million USD; 93.5–94.2 also contains several bars around 4–7 million USD, while 97.5–97.8 holds another cluster near 4 million USD. Losing 98.4 would shift attention toward 97.8–96.7 and then 94.2–93.5. 📈 Above the market, short-liquidation liquidity is concentrated mainly across 101–103. The two strongest clusters sit around 101.2 and 101.6 with bars near 8 million USD, while 102.6–103.2 contains several pockets around 3–5 million USD. Further out, 104.2–104.6 still holds some notable liquidity. 🧭 The broader setup favors the downside because long-liquidation exposure below is larger. Losing 98.4 would increase the probability of a sweep toward 97.8–96.7, followed by 94.2–93.5. Breaking above 100.6 would instead expose 101.2–101.6 and then 102.6–103.2.
$BZ – Liquidation Map (7 Days) – Current Price 98.9 🔎 The 7-day liquidation map shows roughly 100 million USD in long liquidations below the current price, significantly exceeding approximately 65 million USD in short liquidations above. The liquidity structure therefore favors the downside, with around 1.5 times more cumulative liquidity below the market. 📉 Below the market, long-liquidation liquidity is concentrated heavily across 93.5–97.8. The strongest cluster sits around 96.7–96.9 with a bar close to 9 million USD; 93.5–94.2 also contains several bars around 4–7 million USD, while 97.5–97.8 holds another cluster near 4 million USD. Losing 98.4 would shift attention toward 97.8–96.7 and then 94.2–93.5. 📈 Above the market, short-liquidation liquidity is concentrated mainly across 101–103. The two strongest clusters sit around 101.2 and 101.6 with bars near 8 million USD, while 102.6–103.2 contains several pockets around 3–5 million USD. Further out, 104.2–104.6 still holds some notable liquidity. 🧭 The broader setup favors the downside because long-liquidation exposure below is larger. Losing 98.4 would increase the probability of a sweep toward 97.8–96.7, followed by 94.2–93.5. Breaking above 100.6 would instead expose 101.2–101.6 and then 102.6–103.2.
1
Übersetzung ansehen
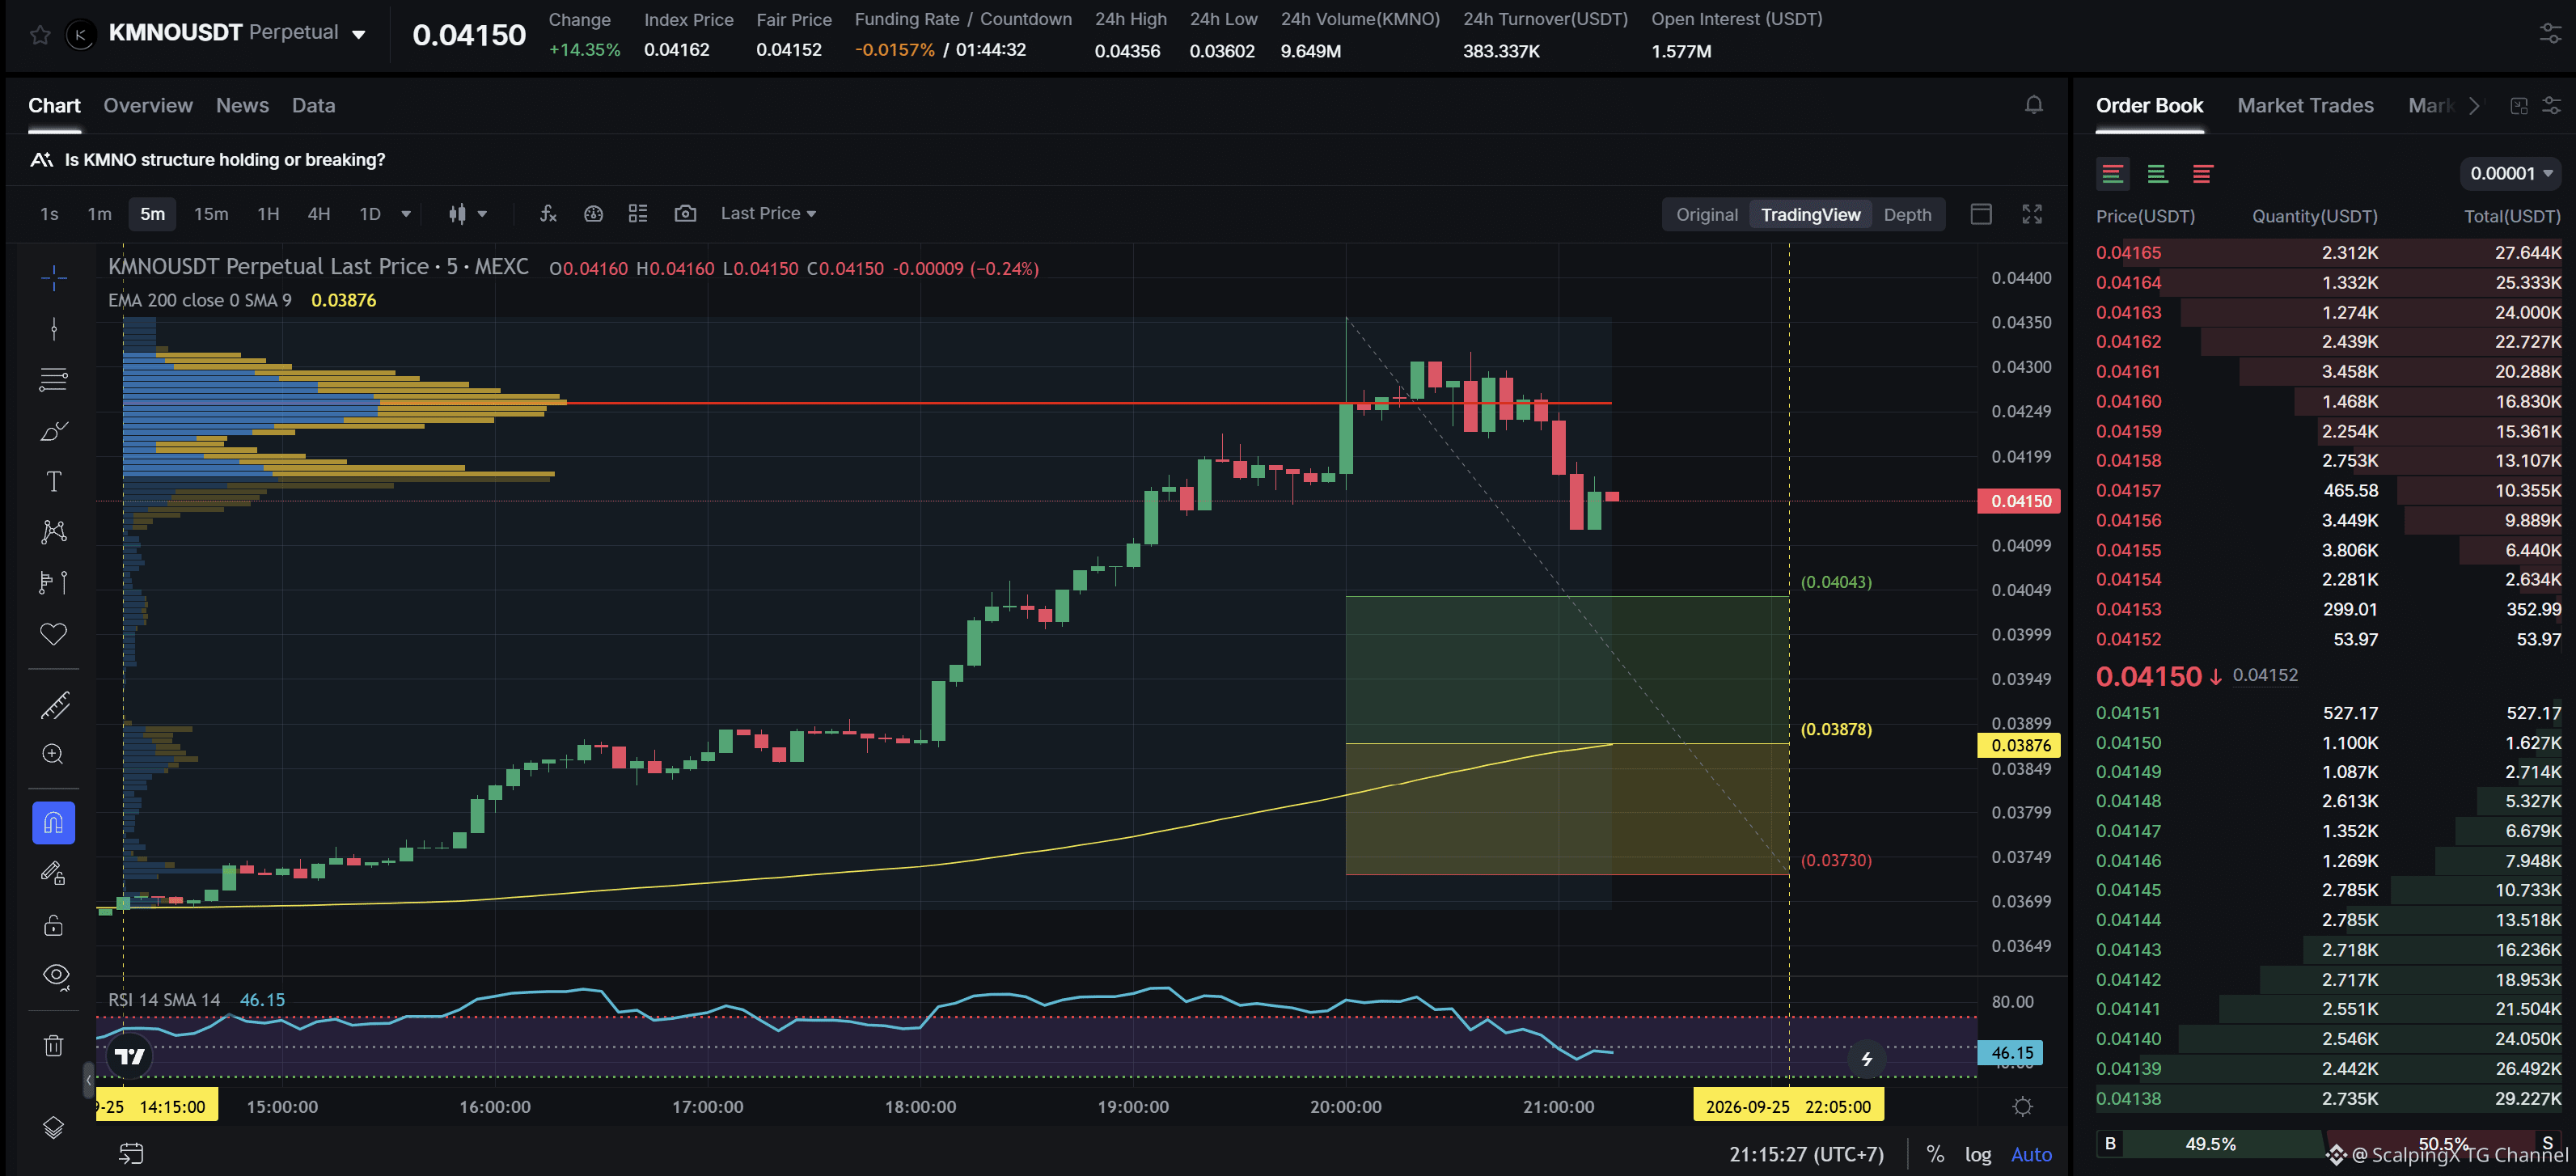
$KMNO - Mcap 235.4M$ - 24h Sentiment Neutral SC02 M5 - pending Long order. Entry lies within LVN + not affected by any weak zone, the current support zone is approximately 3.85% wide. The uptrend has lasted 7 hours, with a maximum recorded price increase of 17.91%. If price loses this support zone, the trend is highly likely to reverse downward.
$KMNO - Mcap 235.4M$ - 24h Sentiment Neutral SC02 M5 - pending Long order. Entry lies within LVN + not affected by any weak zone, the current support zone is approximately 3.85% wide. The uptrend has lasted 7 hours, with a maximum recorded price increase of 17.91%. If price loses this support zone, the trend is highly likely to reverse downward.
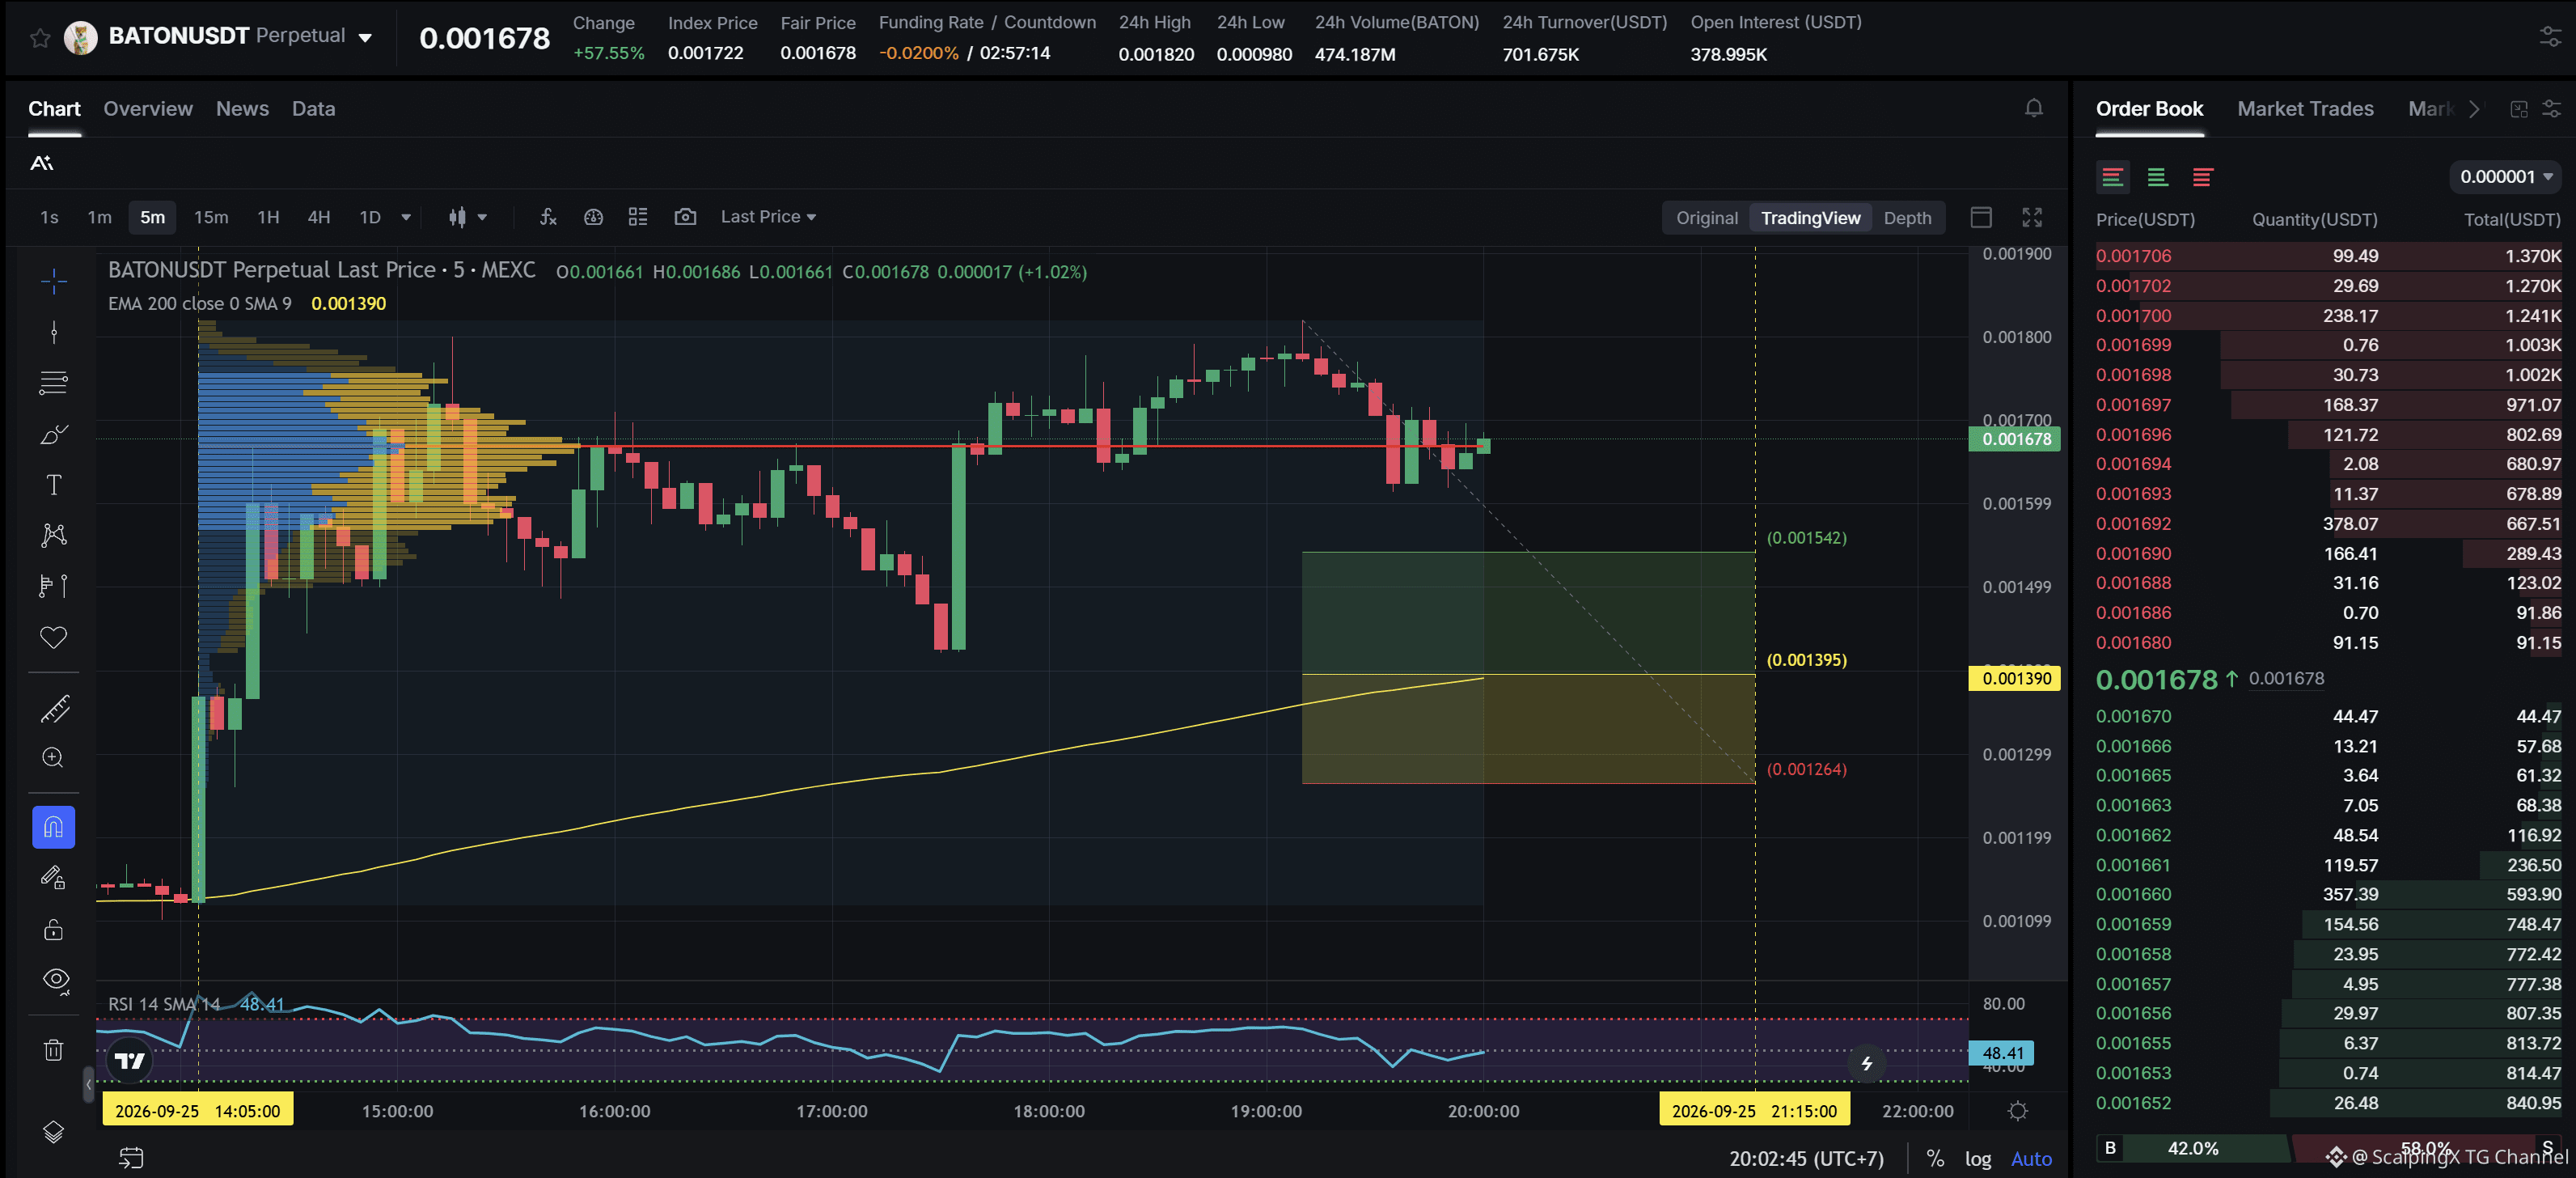
$BATON - FDV 1.7M$ SC02 M5 - ausstehende Langbestellung. Der Einstieg liegt innerhalb der LVN + ist nicht von irgendeiner Schwachzone betroffen; die aktuelle Unterstützungszone ist ungefähr 9,14% breit. Der Aufwärtstrend dauert seit 5 Stunden 55 Minuten, mit einem maximal aufgezeichneten Preisanstieg von 61,86%. Wenn der Kurs diese Unterstützungszone verliert, ist es sehr wahrscheinlich, dass der Trend nach unten dreht.
$BATON - FDV 1.7M$ SC02 M5 - ausstehende Langbestellung. Der Einstieg liegt innerhalb der LVN + ist nicht von irgendeiner Schwachzone betroffen; die aktuelle Unterstützungszone ist ungefähr 9,14% breit. Der Aufwärtstrend dauert seit 5 Stunden 55 Minuten, mit einem maximal aufgezeichneten Preisanstieg von 61,86%. Wenn der Kurs diese Unterstützungszone verliert, ist es sehr wahrscheinlich, dass der Trend nach unten dreht.
1
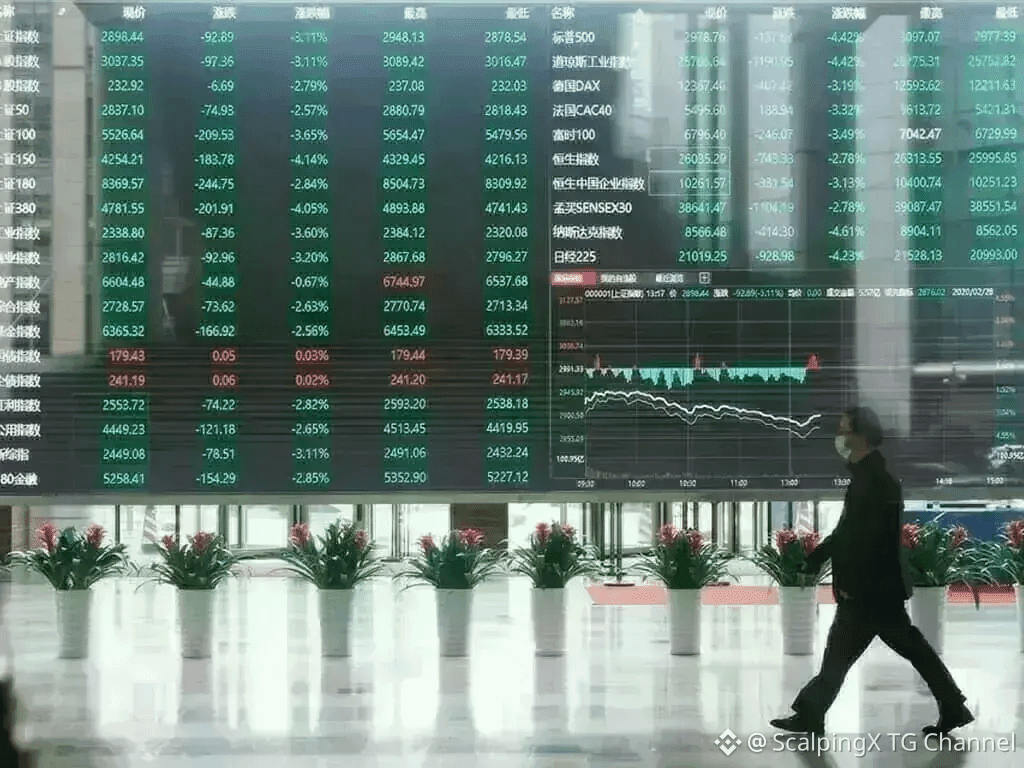
Der Hang-Seng-Index fällt zum dritten Mal in Folge, schließt nahe einem Zwei-Monats-Tief
📉 Der Hang-Seng-Index schloss am 25. September bei 24.510,09, 1,01% tiefer, und markierte damit die dritte aufeinanderfolgende Verlustsitzung. Der Hang-Seng-Tech-Index fiel um 1,13% auf 4.311,78. Technologie- und Versicherungsaktien lasten weiterhin auf dem Markt.
📊 Der HSI rutschte im Tagesverlauf um fast 2% auf 24.275,56 ab, bevor er am Nachmittag einen Teil seiner Verluste wieder wettmachte. Der Kurssprung deutet darauf hin, dass der anfängliche Verkaufsdruck nachließ, auch wenn der Index am Ende weiterhin in etwa auf dem niedrigsten Stand der vergangenen rund zwei Monate schloss.
💧 Das Marktvolumen lag nur bei rund 102,2 Mrd. HKD, da Stock Connect geschlossen war und die chinesischen Festlandmärkte wegen des Feiertags geschlossen blieben. Die Wiedereröffnung des Festlands am 28. September wird der nächste entscheidende Test dafür sein, ob der aktuelle Verkaufsdruck anhält.
#MarketInsights
$BNB
Der Hang-Seng-Index fällt zum dritten Mal in Folge, schließt nahe einem Zwei-Monats-Tief
📉 Der Hang-Seng-Index schloss am 25. September bei 24.510,09, 1,01% tiefer, und markierte damit die dritte aufeinanderfolgende Verlustsitzung. Der Hang-Seng-Tech-Index fiel um 1,13% auf 4.311,78. Technologie- und Versicherungsaktien lasten weiterhin auf dem Markt.
📊 Der HSI rutschte im Tagesverlauf um fast 2% auf 24.275,56 ab, bevor er am Nachmittag einen Teil seiner Verluste wieder wettmachte. Der Kurssprung deutet darauf hin, dass der anfängliche Verkaufsdruck nachließ, auch wenn der Index am Ende weiterhin in etwa auf dem niedrigsten Stand der vergangenen rund zwei Monate schloss.
💧 Das Marktvolumen lag nur bei rund 102,2 Mrd. HKD, da Stock Connect geschlossen war und die chinesischen Festlandmärkte wegen des Feiertags geschlossen blieben. Die Wiedereröffnung des Festlands am 28. September wird der nächste entscheidende Test dafür sein, ob der aktuelle Verkaufsdruck anhält.
#MarketInsights
$BNB
📉 Der Hang-Seng-Index schloss am 25. September bei 24.510,09, 1,01% tiefer, und markierte damit die dritte aufeinanderfolgende Verlustsitzung. Der Hang-Seng-Tech-Index fiel um 1,13% auf 4.311,78. Technologie- und Versicherungsaktien lasten weiterhin auf dem Markt.
📊 Der HSI rutschte im Tagesverlauf um fast 2% auf 24.275,56 ab, bevor er am Nachmittag einen Teil seiner Verluste wieder wettmachte. Der Kurssprung deutet darauf hin, dass der anfängliche Verkaufsdruck nachließ, auch wenn der Index am Ende weiterhin in etwa auf dem niedrigsten Stand der vergangenen rund zwei Monate schloss.
💧 Das Marktvolumen lag nur bei rund 102,2 Mrd. HKD, da Stock Connect geschlossen war und die chinesischen Festlandmärkte wegen des Feiertags geschlossen blieben. Die Wiedereröffnung des Festlands am 28. September wird der nächste entscheidende Test dafür sein, ob der aktuelle Verkaufsdruck anhält.
#MarketInsights
$BNB
2
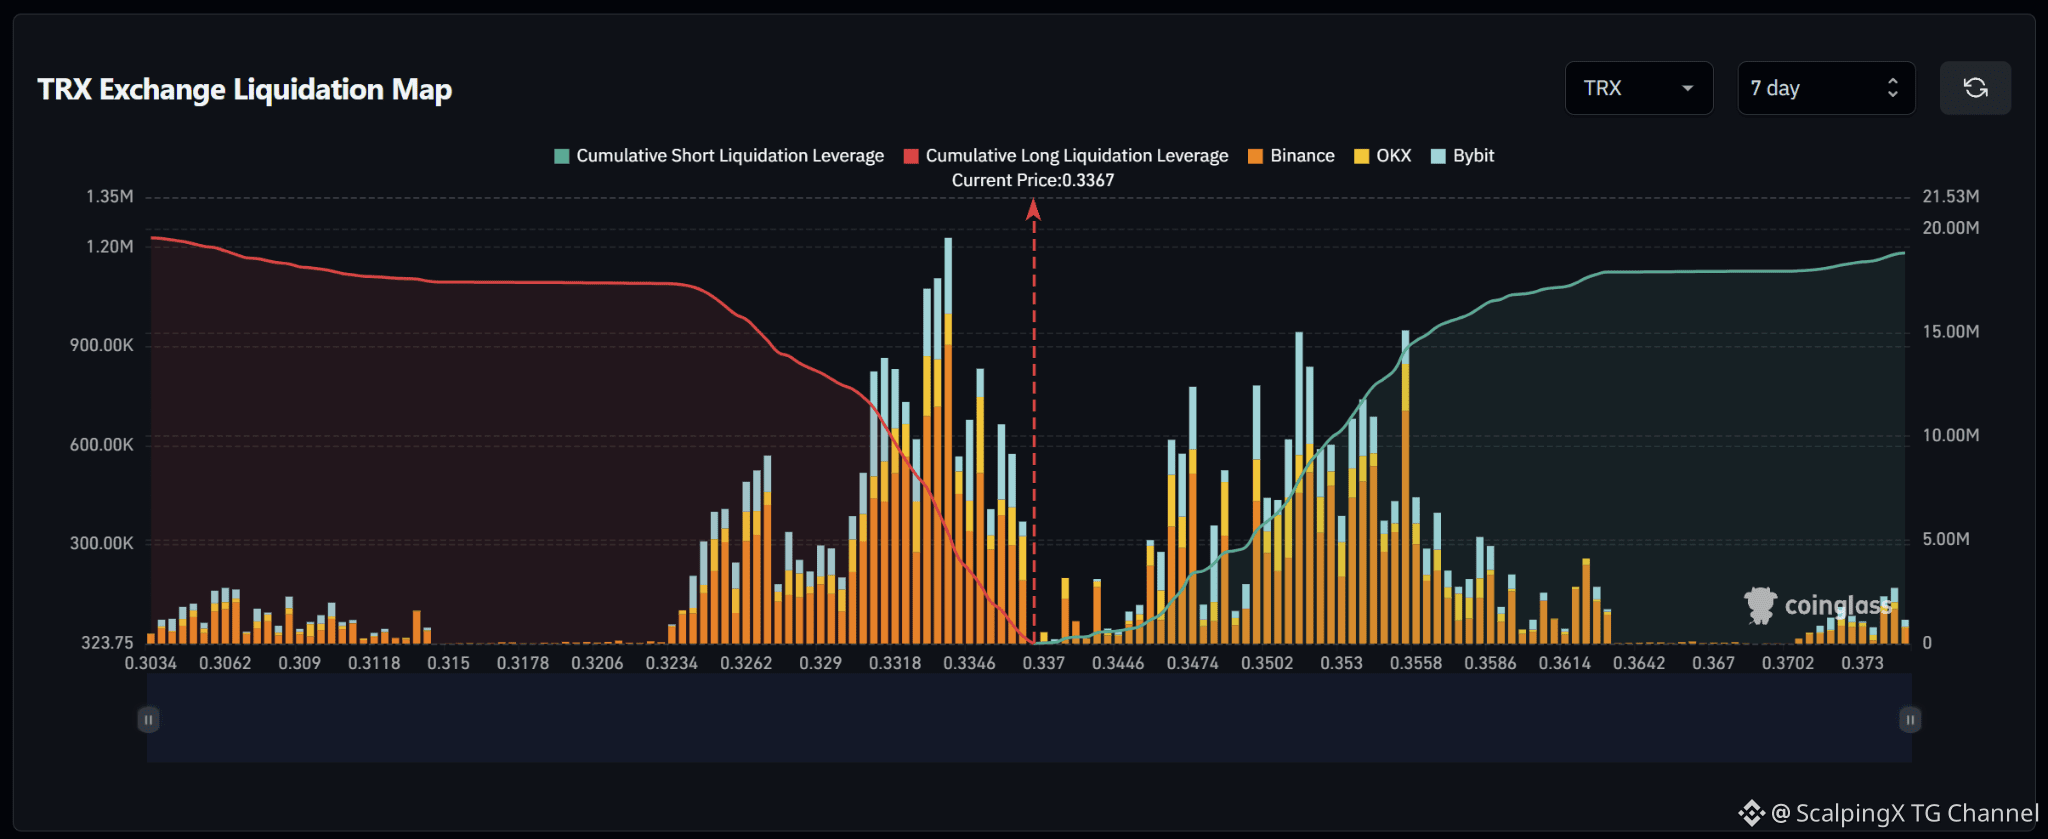
$TRX – Liquidationskarte (7 Tage) – Aktueller Preis 0.3367 🔎 Die Liquidationskarte der letzten 7 Tage zeigt eine relativ ausgeglichene Struktur: Sowohl Long-Liquidationen unterhalb als auch Short-Liquidationen oberhalb liegen bei etwa 19–20 Millionen USD. Die Exposure bei Long-Liquidationen ist nur geringfügig größer, wodurch die Karte eher leicht nach unten geneigt ist – statt einer starken Richtungs-Imbalance. 📉 Unterhalb des Marktes ist die Liquidität für Long-Liquidationen stark auf 0.326–0.335 konzentriert. Der stärkste Cluster liegt bei 0.333–0.334 mit einem Balken über 1.2 Millionen USD, während 0.331–0.333 ebenfalls mehrere Balken im Bereich von etwa 0.8–1.1 Millionen USD enthält. Wenn 0.331 verloren geht, würde sich der Fokus hin zu 0.329–0.326 verschieben. 📈 Oberhalb des Marktes ist die Liquidität für Short-Liquidationen hauptsächlich auf 0.347–0.356 konzentriert. Auffällige Cluster finden sich bei 0.351–0.353 und 0.355–0.356, mit mehreren Balken nahe 0.7–0.95 Millionen USD. Oberhalb von 0.359 wird die Liquidität deutlich dünner. 🧭 Die Gesamtstruktur ist nahezu ausgeglichen. Wenn 0.331 verloren geht, steigt die Wahrscheinlichkeit eines Sweeps Richtung 0.329–0.326. Ein Ausbruch über 0.347 würde stattdessen zunächst 0.351–0.356 freilegen, bevor der Preis in eine dünnere Liquiditätszone eintritt.
$TRX – Liquidationskarte (7 Tage) – Aktueller Preis 0.3367 🔎 Die Liquidationskarte der letzten 7 Tage zeigt eine relativ ausgeglichene Struktur: Sowohl Long-Liquidationen unterhalb als auch Short-Liquidationen oberhalb liegen bei etwa 19–20 Millionen USD. Die Exposure bei Long-Liquidationen ist nur geringfügig größer, wodurch die Karte eher leicht nach unten geneigt ist – statt einer starken Richtungs-Imbalance. 📉 Unterhalb des Marktes ist die Liquidität für Long-Liquidationen stark auf 0.326–0.335 konzentriert. Der stärkste Cluster liegt bei 0.333–0.334 mit einem Balken über 1.2 Millionen USD, während 0.331–0.333 ebenfalls mehrere Balken im Bereich von etwa 0.8–1.1 Millionen USD enthält. Wenn 0.331 verloren geht, würde sich der Fokus hin zu 0.329–0.326 verschieben. 📈 Oberhalb des Marktes ist die Liquidität für Short-Liquidationen hauptsächlich auf 0.347–0.356 konzentriert. Auffällige Cluster finden sich bei 0.351–0.353 und 0.355–0.356, mit mehreren Balken nahe 0.7–0.95 Millionen USD. Oberhalb von 0.359 wird die Liquidität deutlich dünner. 🧭 Die Gesamtstruktur ist nahezu ausgeglichen. Wenn 0.331 verloren geht, steigt die Wahrscheinlichkeit eines Sweeps Richtung 0.329–0.326. Ein Ausbruch über 0.347 würde stattdessen zunächst 0.351–0.356 freilegen, bevor der Preis in eine dünnere Liquiditätszone eintritt.
Übersetzung ansehen
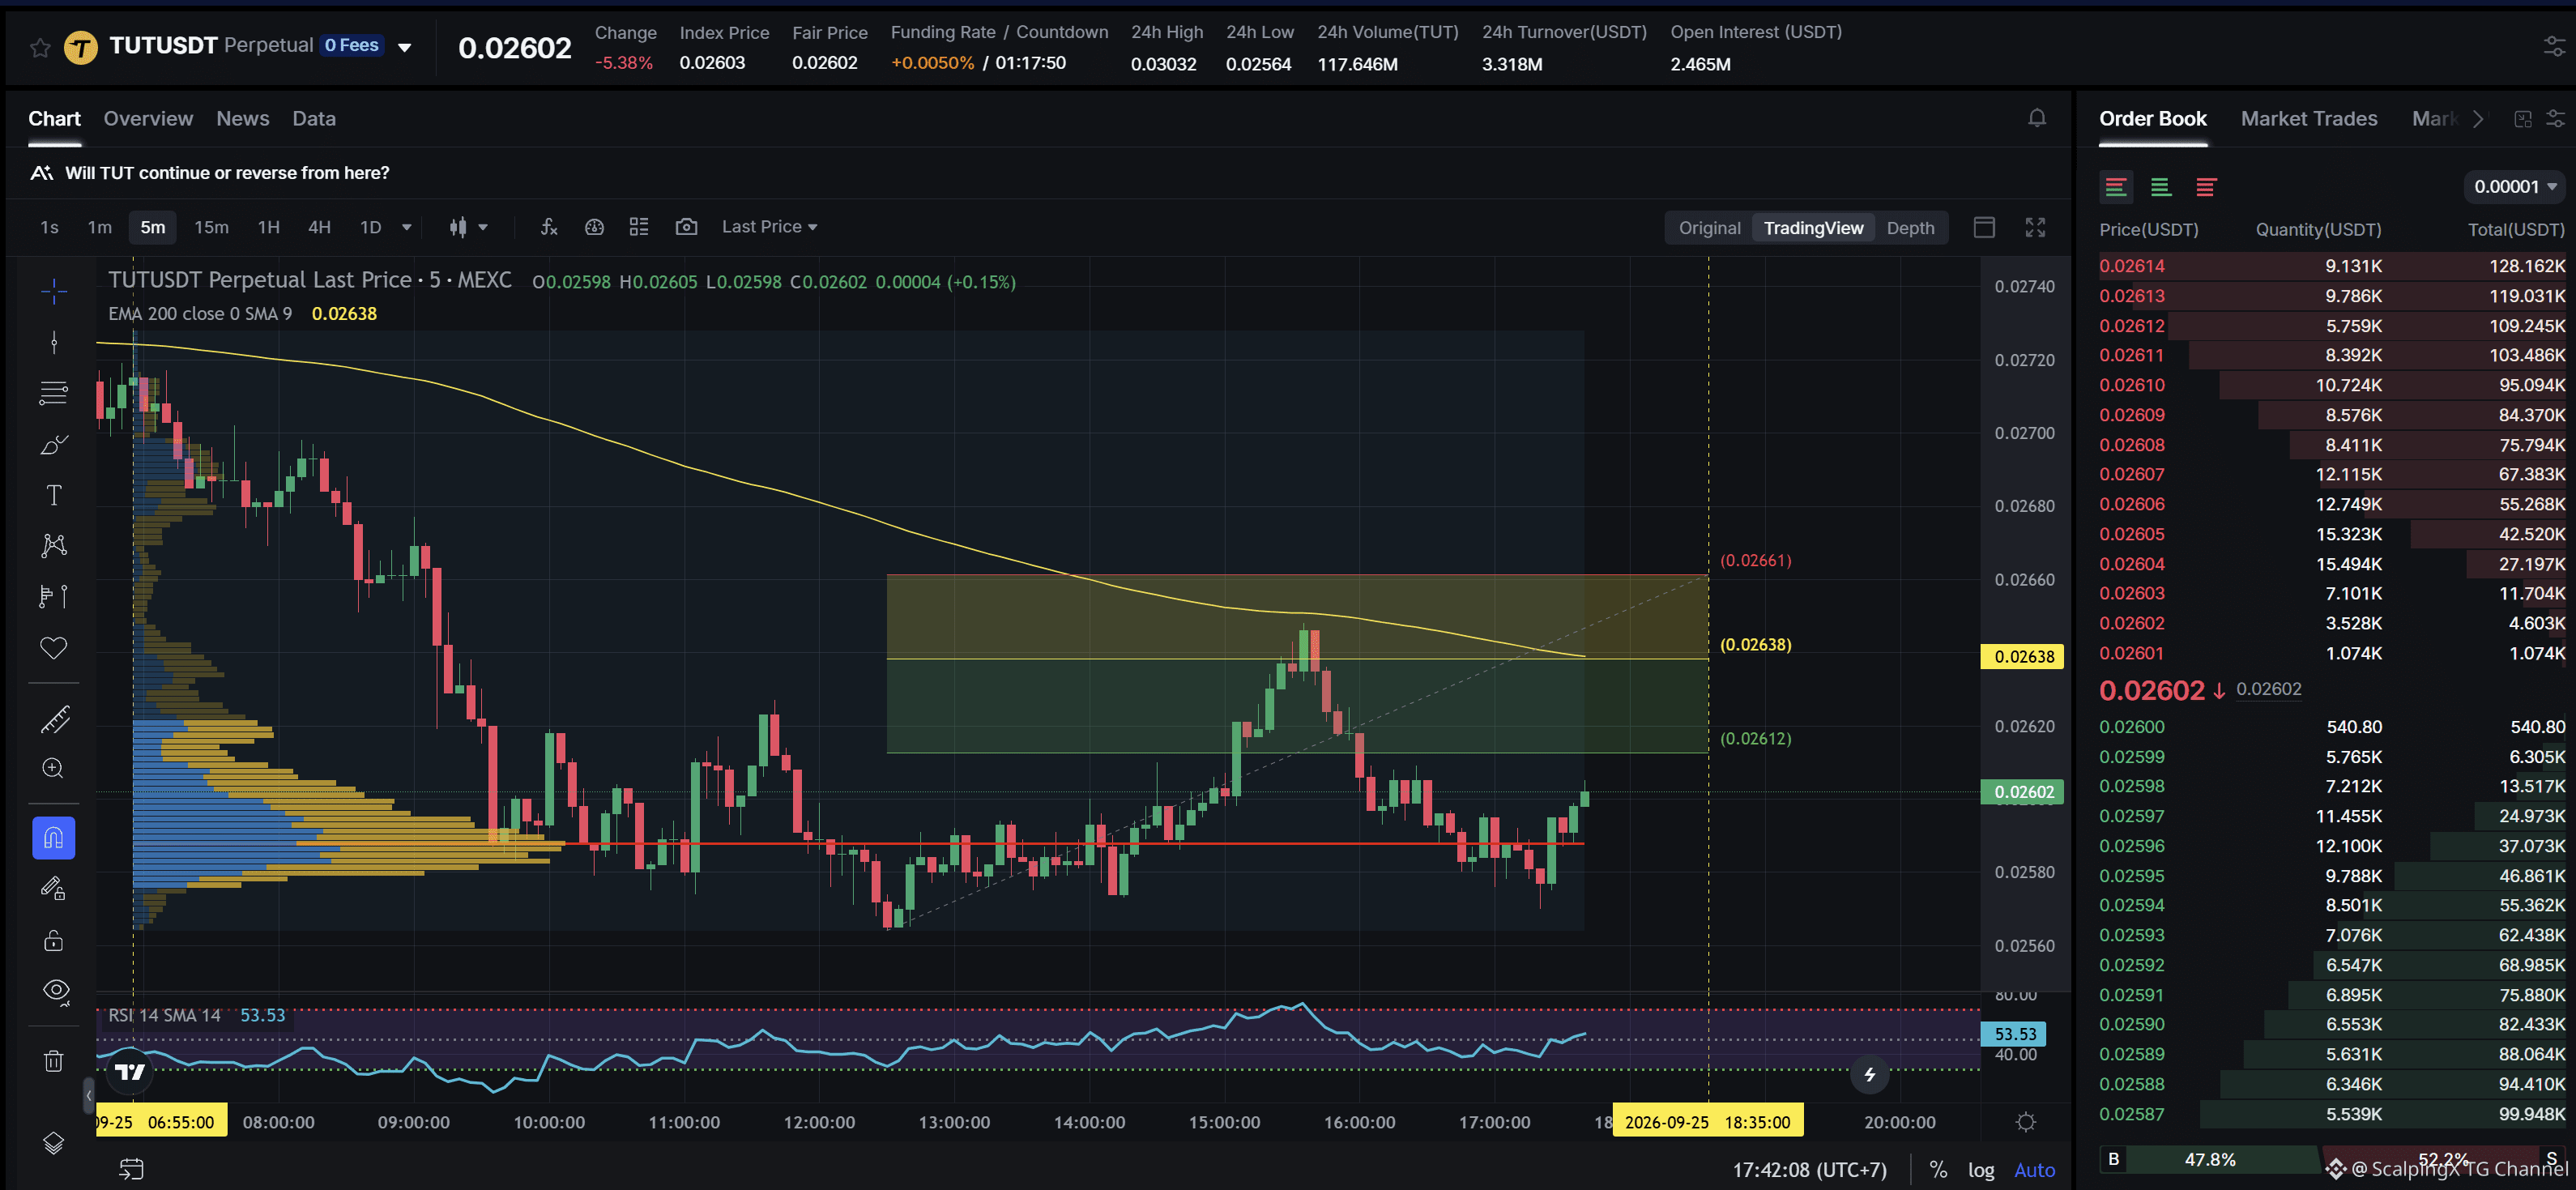
$TUT - Mcap 21.52M$ - 24h Sentiment +4.01 Bullish SC02 M5 - pending Short order. Entry lies within LVN + not affected by any weak zone, the current resistance zone is approximately 0.88% wide. The downtrend has lasted 10 hours 50 minutes, with a maximum recorded price decline of 5.93%. If price breaks above this resistance zone, the trend is highly likely to reverse upward.
$TUT - Mcap 21.52M$ - 24h Sentiment +4.01 Bullish SC02 M5 - pending Short order. Entry lies within LVN + not affected by any weak zone, the current resistance zone is approximately 0.88% wide. The downtrend has lasted 10 hours 50 minutes, with a maximum recorded price decline of 5.93%. If price breaks above this resistance zone, the trend is highly likely to reverse upward.
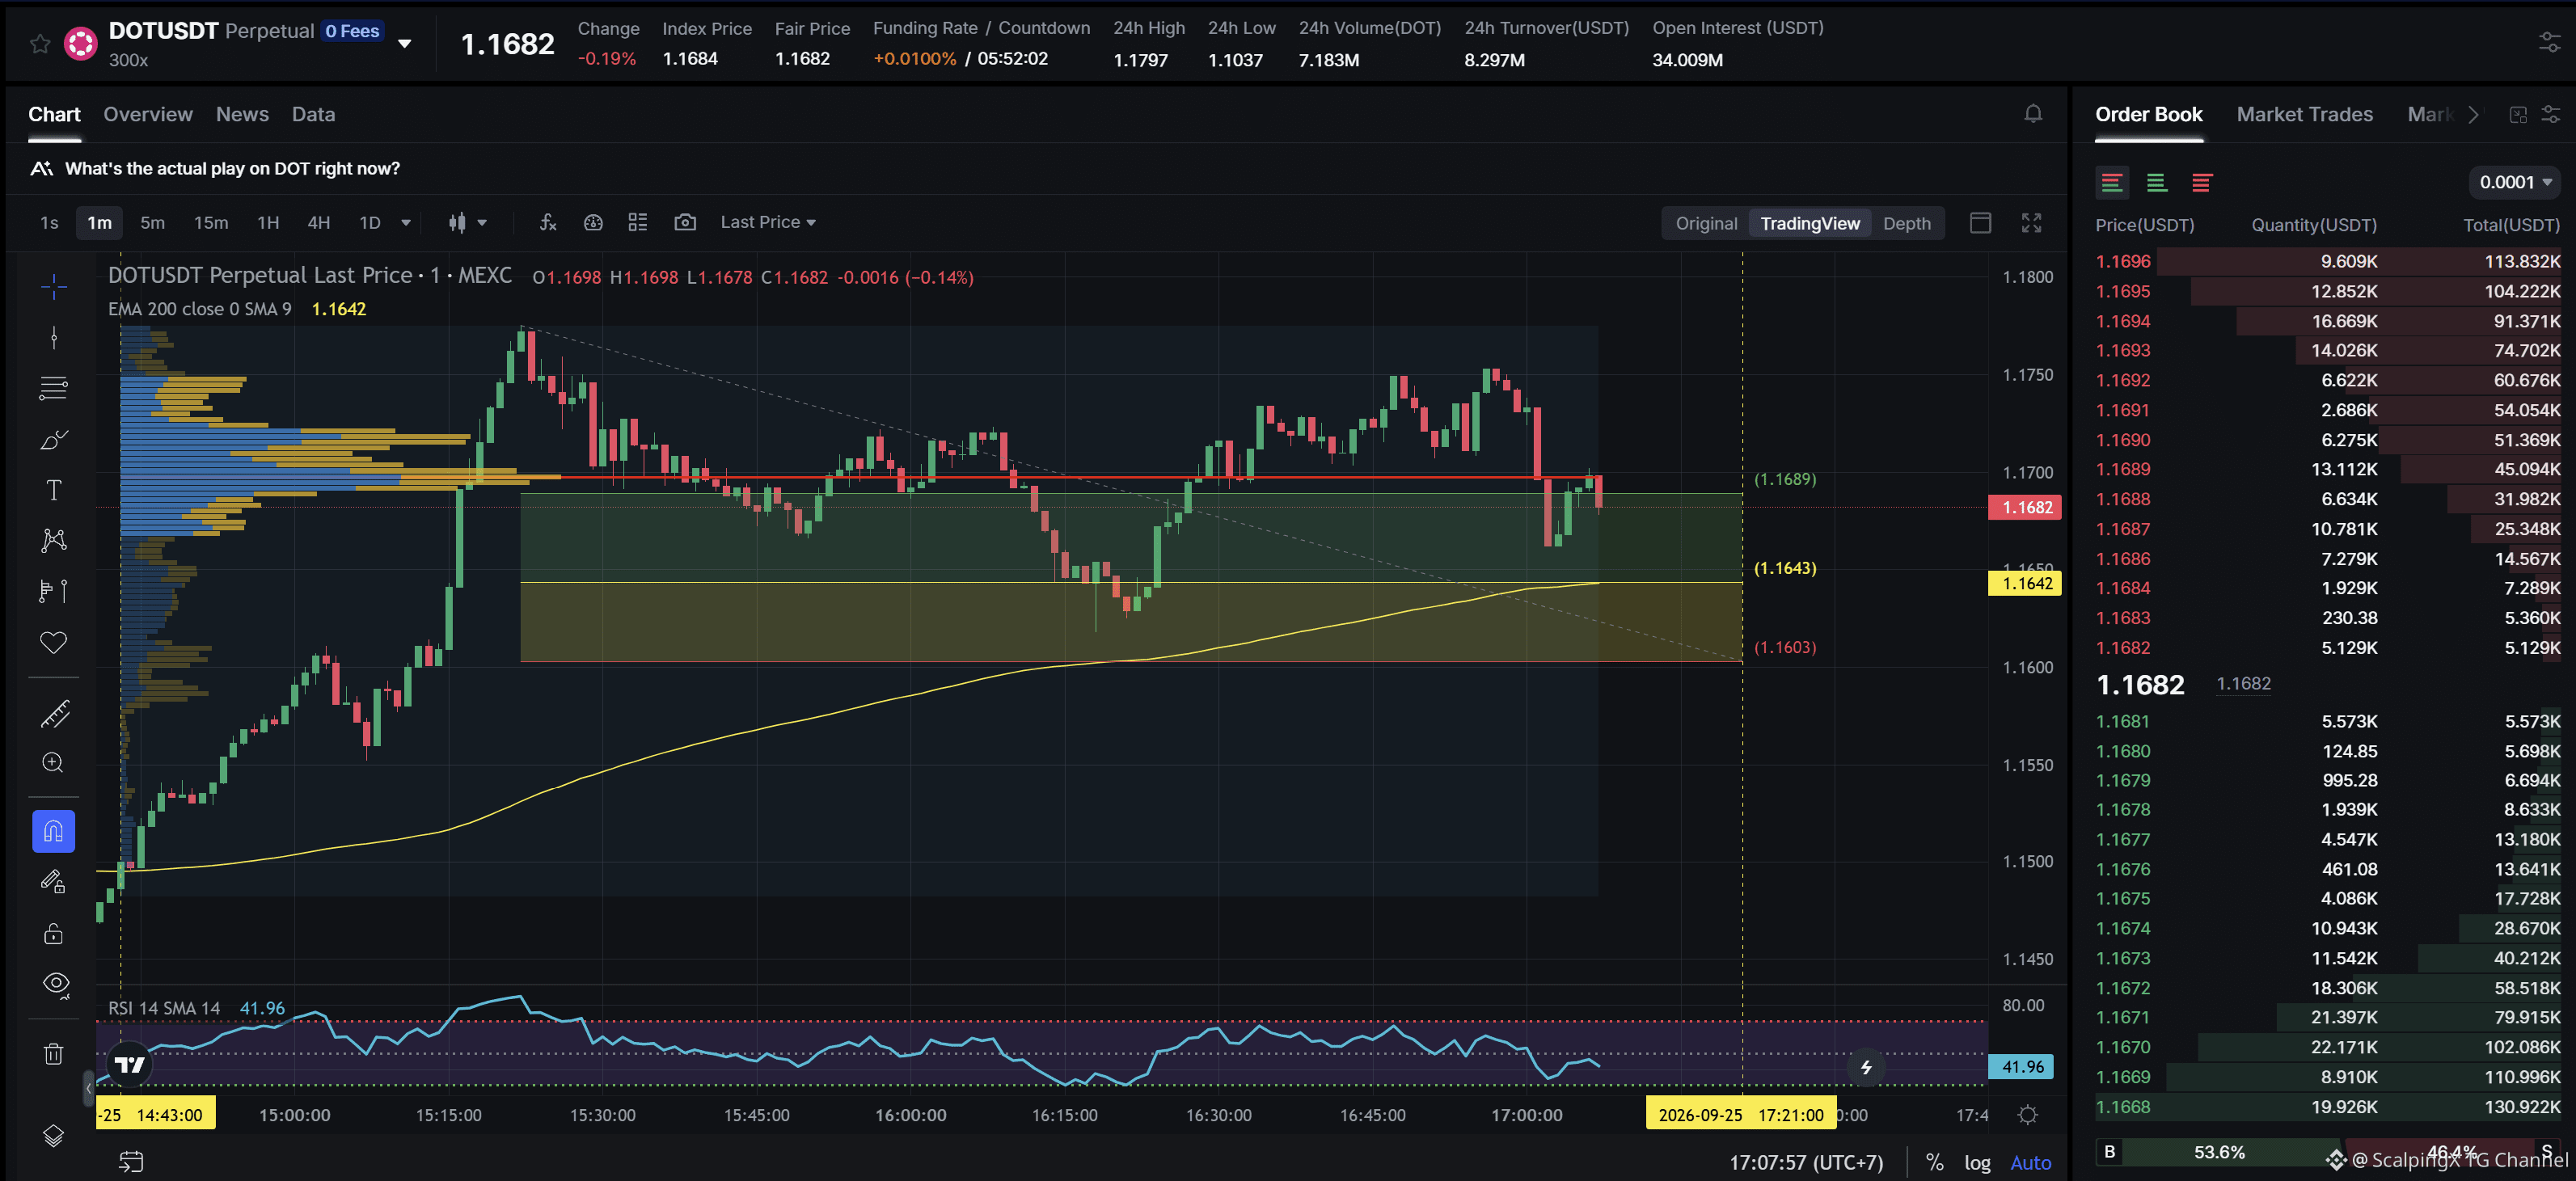
$DOT - Mcap 1.99B$ - 24h Sentiment +2.57 Bullisch SC02 M1 - ausstehend Lange Order. Der Einstieg liegt innerhalb der LVN und ist nicht von einer schwachen Zone betroffen; die aktuelle Unterstützungszone ist ungefähr 0,35% breit. Der Aufwärtstrend dauert seit 2 Stunden 26 Minuten, mit einem maximal aufgezeichneten Preisanstieg von 2,42%. Wenn der Kurs diese Unterstützungszone verliert, ist eine Umkehr des Trends nach unten sehr wahrscheinlich.
$DOT - Mcap 1.99B$ - 24h Sentiment +2.57 Bullisch SC02 M1 - ausstehend Lange Order. Der Einstieg liegt innerhalb der LVN und ist nicht von einer schwachen Zone betroffen; die aktuelle Unterstützungszone ist ungefähr 0,35% breit. Der Aufwärtstrend dauert seit 2 Stunden 26 Minuten, mit einem maximal aufgezeichneten Preisanstieg von 2,42%. Wenn der Kurs diese Unterstützungszone verliert, ist eine Umkehr des Trends nach unten sehr wahrscheinlich.
US-Renditen entspannen sich leicht, aber die asiatischen Märkte bleiben uneinheitlich
📉 Die Renditen US-amerikanischer Staatsanleihen haben sich nach dem jüngsten Ausverkauf stabilisiert. Die 10-jährige Rendite liegt bei rund 5,19% und die 30-jährige bei nahe 5,48%. Der Druck beschleunigt sich nicht mehr so stark wie in den beiden vorangegangenen Sitzungen, doch die langfristigen Renditen bleiben erhöht.
🛢 Brent ist nach zwei starken Sitzungen um etwa 0,8% auf rund 105,7 USD zurückgegangen. Der Rücksetzer bei Öl dämpft den Inflationsdruck in der nahen Frist, allerdings stützen die Preise über 100 USD weiterhin das Narrativ von „higher for longer“.
📊 An den asiatischen Aktienmärkten zeigte sich keine breite Bewegung hin zu „Risk-on“. Der Nikkei legte um rund 1% zu, während Hongkong- und australische Titel fielen, und der MSCI Asia ex-Japan veränderte sich kaum.
⚖️ Das aktuelle Bild wirkt eher wie eine Stabilisierung nach dem Ausverkauf als wie eine klare Rückkehr in die Stimmung „Risk-on“.
#MarketInsight
$USDT
US-Renditen entspannen sich leicht, aber die asiatischen Märkte bleiben uneinheitlich
📉 Die Renditen US-amerikanischer Staatsanleihen haben sich nach dem jüngsten Ausverkauf stabilisiert. Die 10-jährige Rendite liegt bei rund 5,19% und die 30-jährige bei nahe 5,48%. Der Druck beschleunigt sich nicht mehr so stark wie in den beiden vorangegangenen Sitzungen, doch die langfristigen Renditen bleiben erhöht.
🛢 Brent ist nach zwei starken Sitzungen um etwa 0,8% auf rund 105,7 USD zurückgegangen. Der Rücksetzer bei Öl dämpft den Inflationsdruck in der nahen Frist, allerdings stützen die Preise über 100 USD weiterhin das Narrativ von „higher for longer“.
📊 An den asiatischen Aktienmärkten zeigte sich keine breite Bewegung hin zu „Risk-on“. Der Nikkei legte um rund 1% zu, während Hongkong- und australische Titel fielen, und der MSCI Asia ex-Japan veränderte sich kaum.
⚖️ Das aktuelle Bild wirkt eher wie eine Stabilisierung nach dem Ausverkauf als wie eine klare Rückkehr in die Stimmung „Risk-on“.
#MarketInsight
$USDT
📉 Die Renditen US-amerikanischer Staatsanleihen haben sich nach dem jüngsten Ausverkauf stabilisiert. Die 10-jährige Rendite liegt bei rund 5,19% und die 30-jährige bei nahe 5,48%. Der Druck beschleunigt sich nicht mehr so stark wie in den beiden vorangegangenen Sitzungen, doch die langfristigen Renditen bleiben erhöht.
🛢 Brent ist nach zwei starken Sitzungen um etwa 0,8% auf rund 105,7 USD zurückgegangen. Der Rücksetzer bei Öl dämpft den Inflationsdruck in der nahen Frist, allerdings stützen die Preise über 100 USD weiterhin das Narrativ von „higher for longer“.
📊 An den asiatischen Aktienmärkten zeigte sich keine breite Bewegung hin zu „Risk-on“. Der Nikkei legte um rund 1% zu, während Hongkong- und australische Titel fielen, und der MSCI Asia ex-Japan veränderte sich kaum.
⚖️ Das aktuelle Bild wirkt eher wie eine Stabilisierung nach dem Ausverkauf als wie eine klare Rückkehr in die Stimmung „Risk-on“.
#MarketInsight
$USDT
1
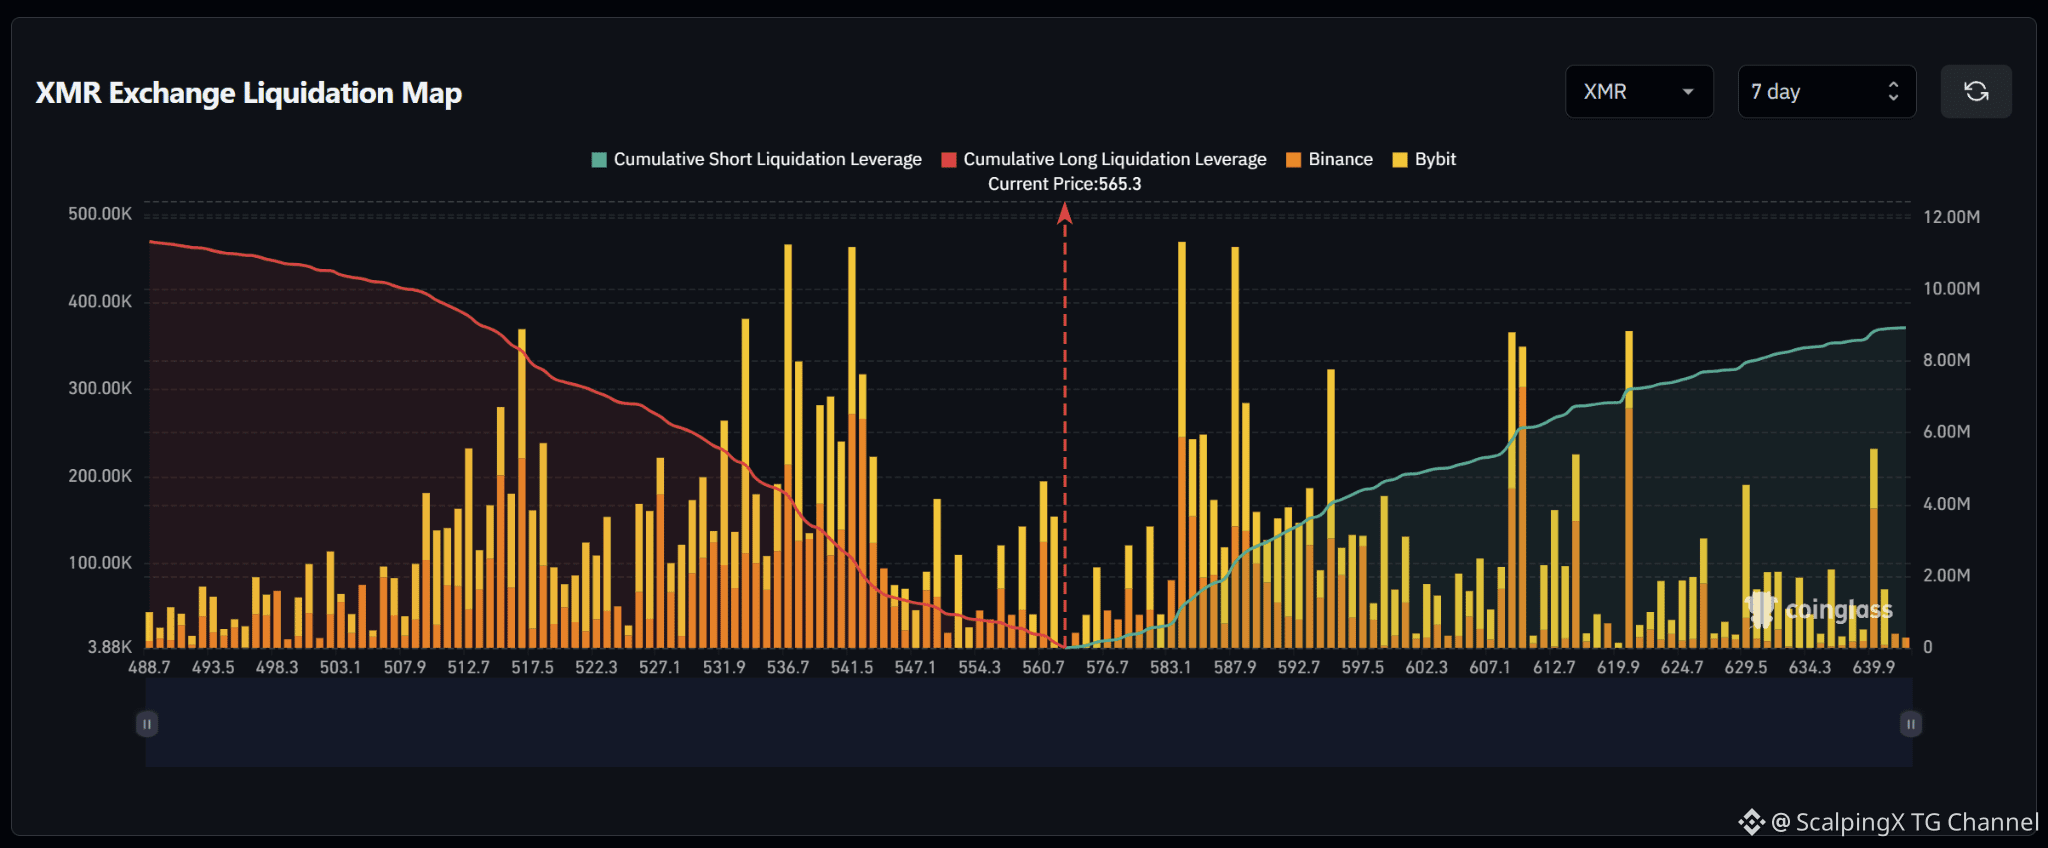
$XMR – Liquidationskarte (7 Tage) – Aktueller Preis 565.3 🔎 Die 7-Tage-Liquidationskarte zeigt ungefähr 11–11,5 Millionen USD an Long-Liquidationen unterhalb des aktuellen Preises, übersteigt dabei etwa 8,5–9 Millionen USD an Short-Liquidationen oberhalb. Die Liquiditätsstruktur hat daher eine leichte Abwärtsneigung: mit rund 1,3-mal mehr kumulativer Liquidität unterhalb des Marktes. 📉 Unterhalb des Marktes ist die Liquidität für Long-Liquidationen vor allem über 512–542 konzentriert. Die stärksten Cluster liegen bei 536–537 und 541–542 mit Balken nahe 0,46 Millionen USD; zudem halten 516–518 und 531–533 ebenfalls mehrere relativ große Bereiche. Wenn 560 fällt, würde sich der Fokus auf 547–542 und anschließend auf 537–532 verlagern. 📈 Oberhalb des Marktes ist die Liquidität für Short-Liquidationen stark über 582–589 konzentriert. Die beiden stärksten Cluster liegen bei etwa 583–584 und 587–588 mit Balken nahe 0,46–0,47 Millionen USD. Weiter außen enthalten auch 608–610 und 619–620 bemerkenswerte Taschen um 0,35–0,37 Millionen USD. 🧭 Das breitere Setup hat eine leichte Abwärtsneigung, weil die Exposure für Long-Liquidationen unterhalb weiterhin größer ist. Wenn 560 fällt, würde die Wahrscheinlichkeit für einen Sweep Richtung 547–542 steigen, gefolgt von 537–532. Ein Ausbruch über 576 würde stattdessen zunächst 583–588 freilegen, bevor der Fokus auf 608–620 übergeht.
$XMR – Liquidationskarte (7 Tage) – Aktueller Preis 565.3 🔎 Die 7-Tage-Liquidationskarte zeigt ungefähr 11–11,5 Millionen USD an Long-Liquidationen unterhalb des aktuellen Preises, übersteigt dabei etwa 8,5–9 Millionen USD an Short-Liquidationen oberhalb. Die Liquiditätsstruktur hat daher eine leichte Abwärtsneigung: mit rund 1,3-mal mehr kumulativer Liquidität unterhalb des Marktes. 📉 Unterhalb des Marktes ist die Liquidität für Long-Liquidationen vor allem über 512–542 konzentriert. Die stärksten Cluster liegen bei 536–537 und 541–542 mit Balken nahe 0,46 Millionen USD; zudem halten 516–518 und 531–533 ebenfalls mehrere relativ große Bereiche. Wenn 560 fällt, würde sich der Fokus auf 547–542 und anschließend auf 537–532 verlagern. 📈 Oberhalb des Marktes ist die Liquidität für Short-Liquidationen stark über 582–589 konzentriert. Die beiden stärksten Cluster liegen bei etwa 583–584 und 587–588 mit Balken nahe 0,46–0,47 Millionen USD. Weiter außen enthalten auch 608–610 und 619–620 bemerkenswerte Taschen um 0,35–0,37 Millionen USD. 🧭 Das breitere Setup hat eine leichte Abwärtsneigung, weil die Exposure für Long-Liquidationen unterhalb weiterhin größer ist. Wenn 560 fällt, würde die Wahrscheinlichkeit für einen Sweep Richtung 547–542 steigen, gefolgt von 537–532. Ein Ausbruch über 576 würde stattdessen zunächst 583–588 freilegen, bevor der Fokus auf 608–620 übergeht.
Übersetzung ansehen
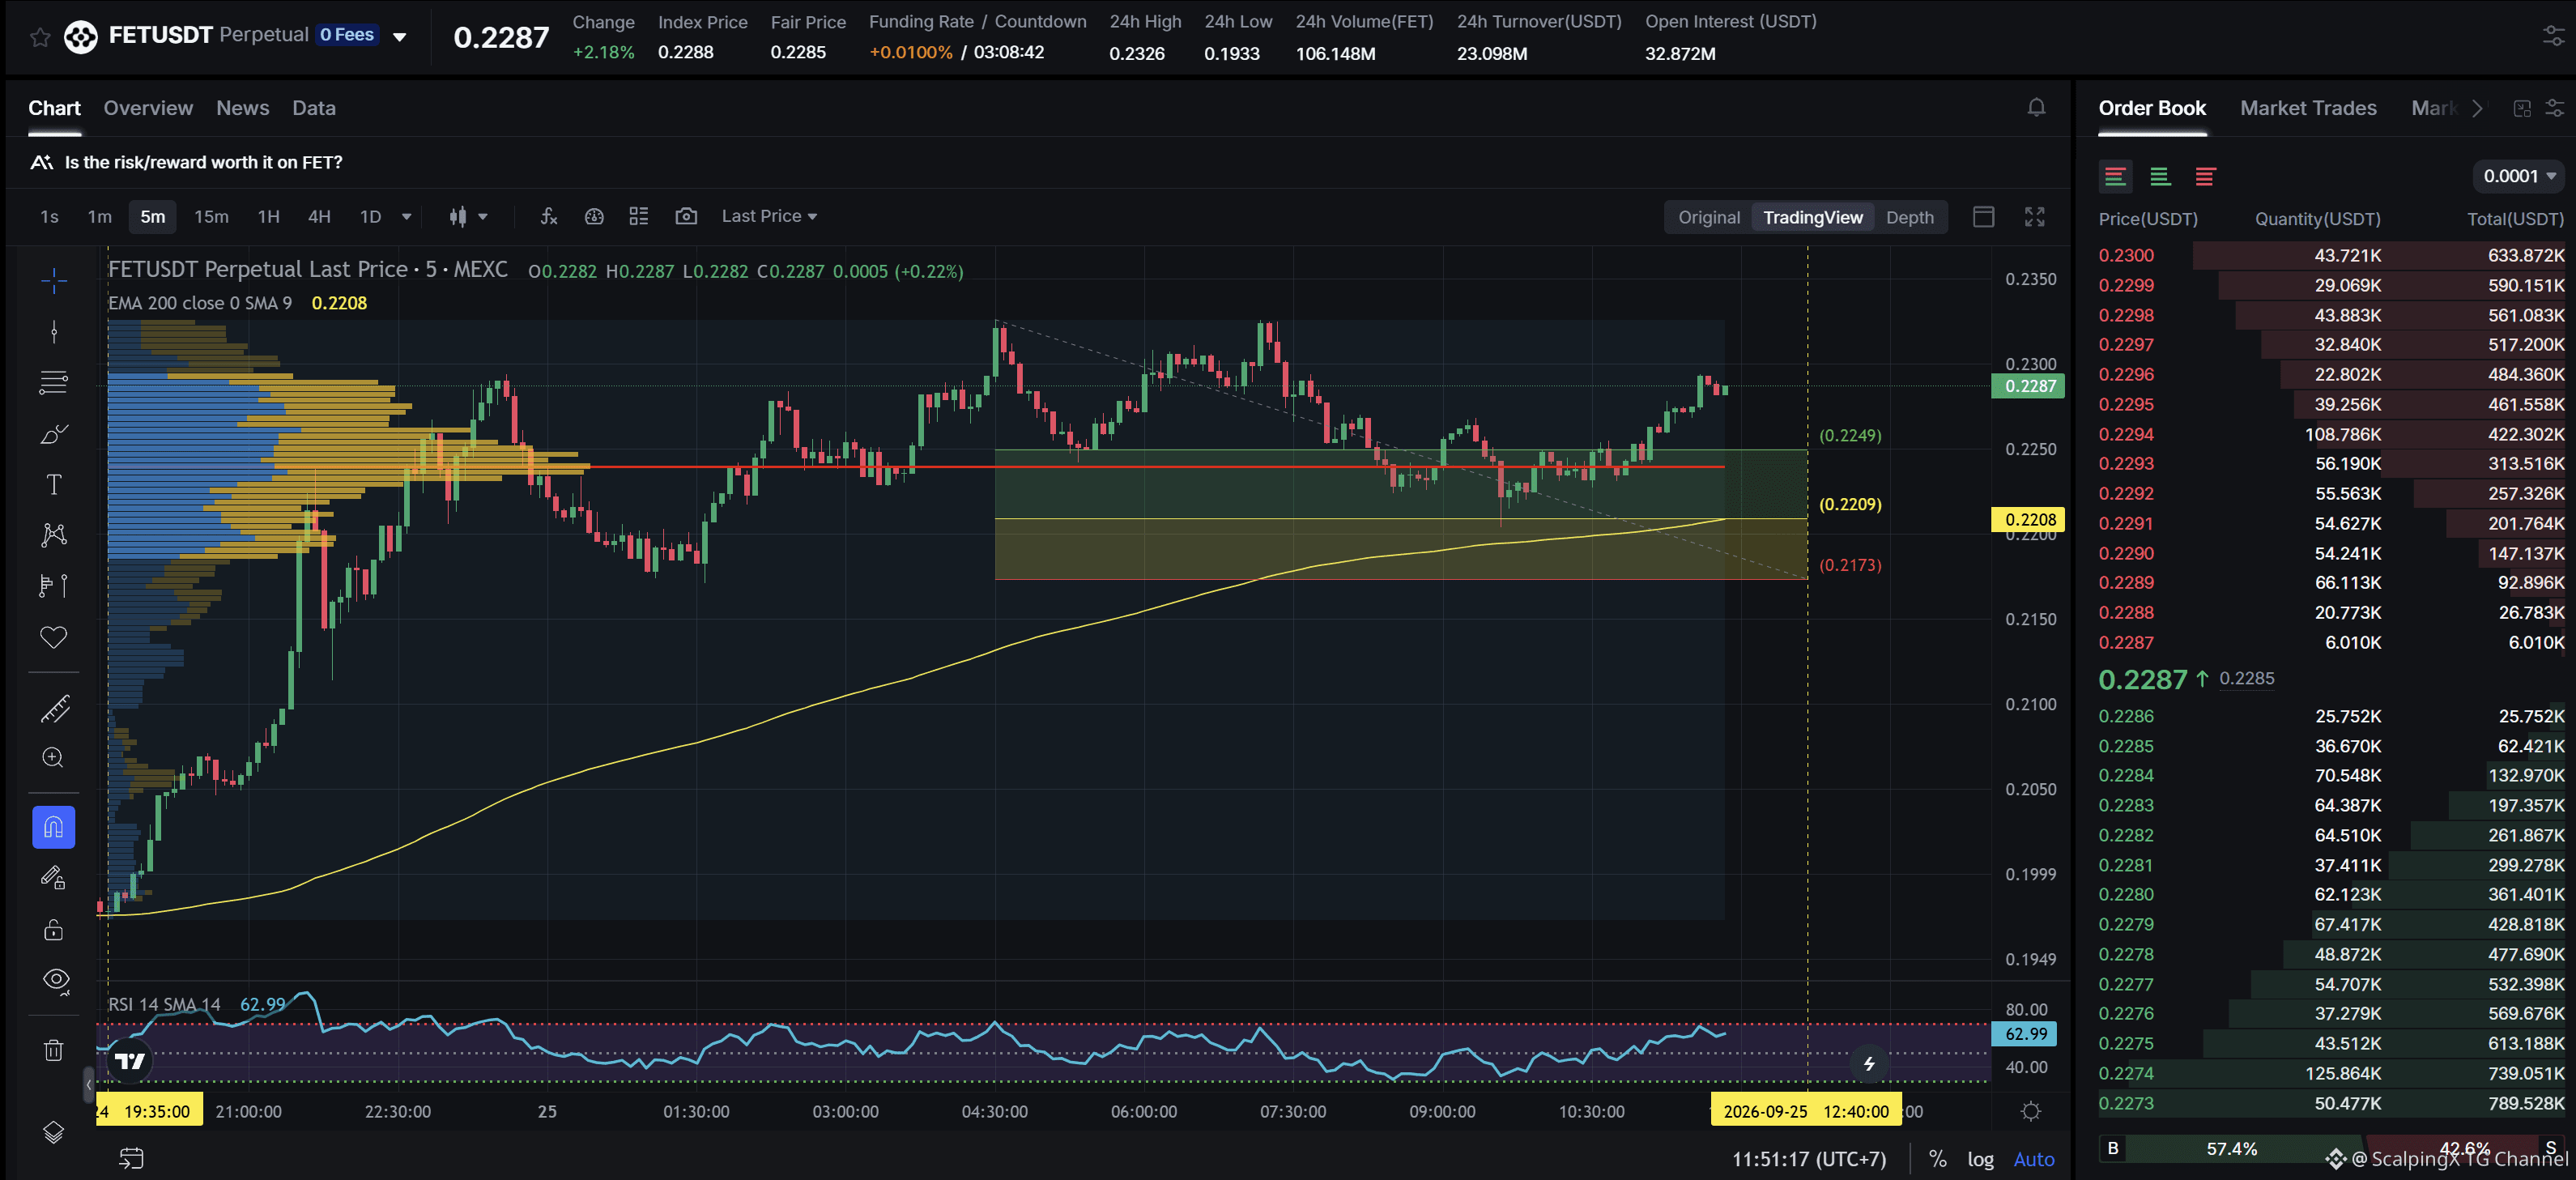
$FET - Mcap 528.3M$ - 24h Sentiment +4.01 Bullish SC02 M5 - pending Long order. Entry lies within HVN + not affected by any weak zone, the current support zone is approximately 1.62% wide. The uptrend has lasted 16 hours 15 minutes, with a maximum recorded price increase of 17.75%. If price loses this support zone, the trend is highly likely to reverse downward.
$FET - Mcap 528.3M$ - 24h Sentiment +4.01 Bullish SC02 M5 - pending Long order. Entry lies within HVN + not affected by any weak zone, the current support zone is approximately 1.62% wide. The uptrend has lasted 16 hours 15 minutes, with a maximum recorded price increase of 17.75%. If price loses this support zone, the trend is highly likely to reverse downward.
1
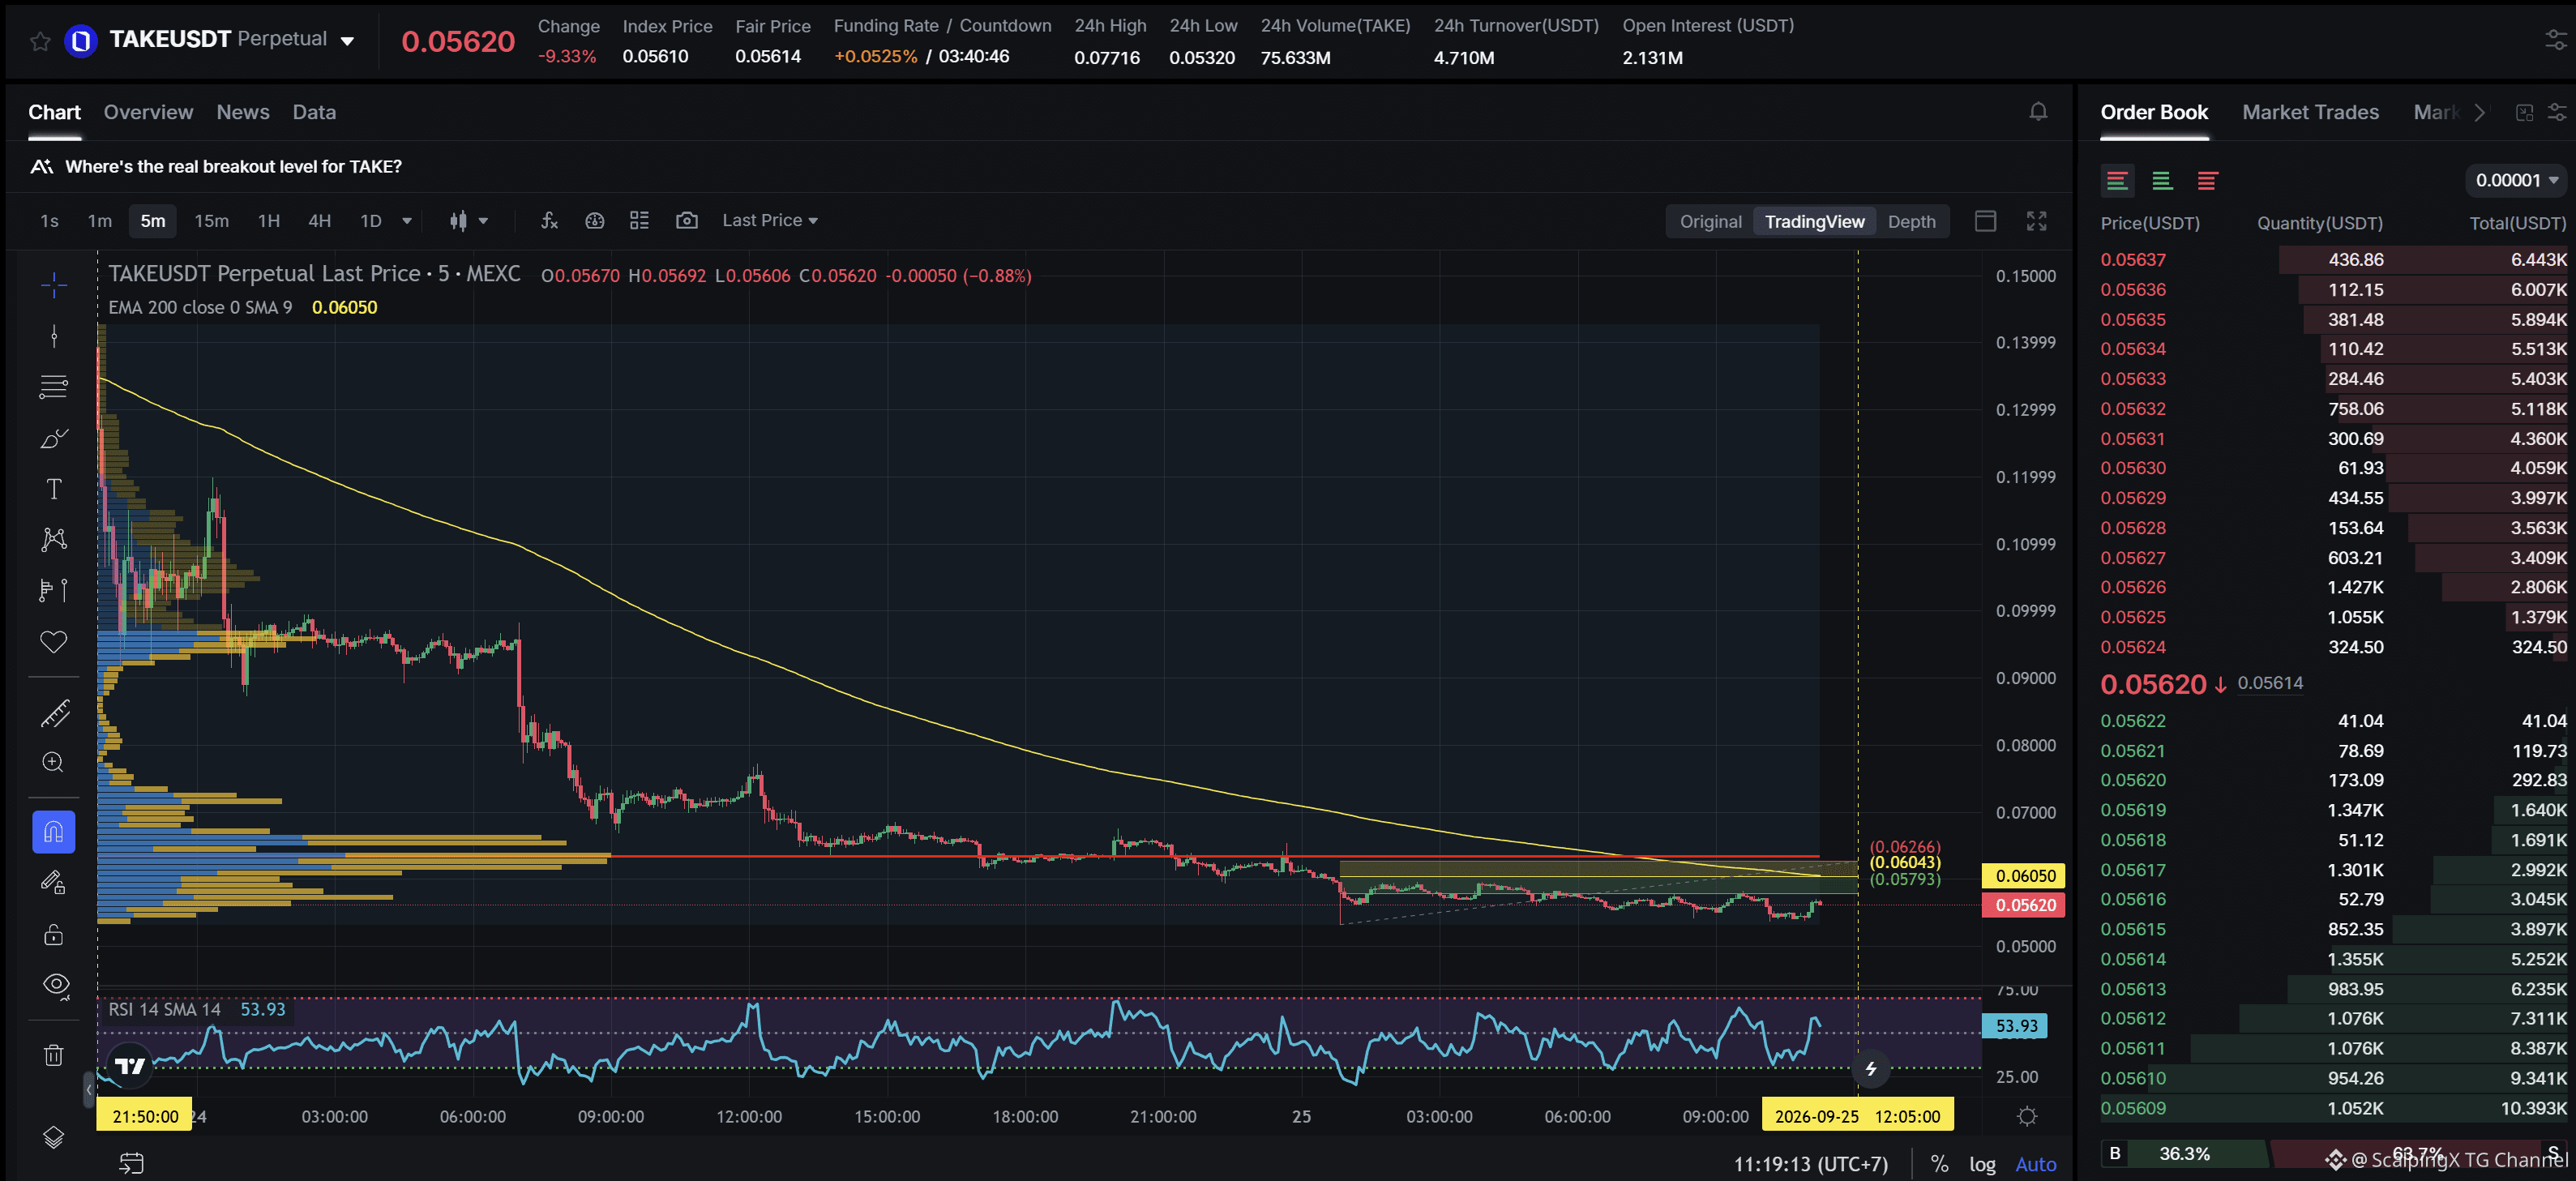
$TAKE - Mcap 21M$ - 24h Sentiment -3.06 Bearish SC02 M5 - pending Short order. Der Einstieg liegt innerhalb der HVN und wird von keiner schwachen Zone beeinträchtigt. Die aktuelle Widerstandszone ist ungefähr 3,75% breit. Der Abwärtstrend dauert seit 1 Tag 13 Stunden 30 Minuten, mit einem maximal aufgezeichneten Kursrückgang von 60,59%. Wenn der Kurs über diese Widerstandszone ausbricht, ist es sehr wahrscheinlich, dass sich der Trend nach oben dreht.
$TAKE - Mcap 21M$ - 24h Sentiment -3.06 Bearish SC02 M5 - pending Short order. Der Einstieg liegt innerhalb der HVN und wird von keiner schwachen Zone beeinträchtigt. Die aktuelle Widerstandszone ist ungefähr 3,75% breit. Der Abwärtstrend dauert seit 1 Tag 13 Stunden 30 Minuten, mit einem maximal aufgezeichneten Kursrückgang von 60,59%. Wenn der Kurs über diese Widerstandszone ausbricht, ist es sehr wahrscheinlich, dass sich der Trend nach oben dreht.
2
Akamai schließt einen Cloud-Deal über 11,6 Milliarden US-Dollar mit Anthropic ab und erweitert seine Rolle in der KI-Infrastruktur
☁️ Anthropic hat sich verpflichtet, etwa 11,6 Milliarden US-Dollar über sieben Jahre hinweg für die Nutzung der Cloud- und Managed-Services von Akamai einzusetzen, mit der Option, die Vereinbarung um weitere bis zu 9 Milliarden US-Dollar auszubauen. Der Deal konzentriert sich auf CPU-Workloads und verteilte Core-to-Edge-Infrastruktur, statt auf GPU-Cluster, die für das Training von Modellen genutzt werden.
🏗️ Zur Unterstützung des Vertrags erwartet Akamai, über die Laufzeit des Projekts rund 5,5 Milliarden US-Dollar in Capex zu investieren, einschließlich etwa 1,7 Milliarden US-Dollar, die in das Jahr 2026 vorgezogen werden für den Einkauf von Komponenten, insbesondere Speicher. Das Unternehmen erklärte, dass die Vereinbarung seine Umsatzprognose für 2026 nicht verändert.
📈 Die Aktien von AKAM stiegen nach der Bekanntgabe im After-Hours-Handel um mehr als 20%. Die Reaktion spiegelt die Erwartung wider, dass Akamai sich über CDN und Cybersecurity hinaus in Richtung KI-Infrastruktur ausweiten könnte, obwohl der wirtschaftliche Wert des Deals von der Umsetzung, den Capex-Anforderungen und der Kundenkonzentration bei Anthropic abhängen wird.
#AIInfrastructure
$AKAM
Akamai schließt einen Cloud-Deal über 11,6 Milliarden US-Dollar mit Anthropic ab und erweitert seine Rolle in der KI-Infrastruktur
☁️ Anthropic hat sich verpflichtet, etwa 11,6 Milliarden US-Dollar über sieben Jahre hinweg für die Nutzung der Cloud- und Managed-Services von Akamai einzusetzen, mit der Option, die Vereinbarung um weitere bis zu 9 Milliarden US-Dollar auszubauen. Der Deal konzentriert sich auf CPU-Workloads und verteilte Core-to-Edge-Infrastruktur, statt auf GPU-Cluster, die für das Training von Modellen genutzt werden.
🏗️ Zur Unterstützung des Vertrags erwartet Akamai, über die Laufzeit des Projekts rund 5,5 Milliarden US-Dollar in Capex zu investieren, einschließlich etwa 1,7 Milliarden US-Dollar, die in das Jahr 2026 vorgezogen werden für den Einkauf von Komponenten, insbesondere Speicher. Das Unternehmen erklärte, dass die Vereinbarung seine Umsatzprognose für 2026 nicht verändert.
📈 Die Aktien von AKAM stiegen nach der Bekanntgabe im After-Hours-Handel um mehr als 20%. Die Reaktion spiegelt die Erwartung wider, dass Akamai sich über CDN und Cybersecurity hinaus in Richtung KI-Infrastruktur ausweiten könnte, obwohl der wirtschaftliche Wert des Deals von der Umsetzung, den Capex-Anforderungen und der Kundenkonzentration bei Anthropic abhängen wird.
#AIInfrastructure
$AKAM
☁️ Anthropic hat sich verpflichtet, etwa 11,6 Milliarden US-Dollar über sieben Jahre hinweg für die Nutzung der Cloud- und Managed-Services von Akamai einzusetzen, mit der Option, die Vereinbarung um weitere bis zu 9 Milliarden US-Dollar auszubauen. Der Deal konzentriert sich auf CPU-Workloads und verteilte Core-to-Edge-Infrastruktur, statt auf GPU-Cluster, die für das Training von Modellen genutzt werden.
🏗️ Zur Unterstützung des Vertrags erwartet Akamai, über die Laufzeit des Projekts rund 5,5 Milliarden US-Dollar in Capex zu investieren, einschließlich etwa 1,7 Milliarden US-Dollar, die in das Jahr 2026 vorgezogen werden für den Einkauf von Komponenten, insbesondere Speicher. Das Unternehmen erklärte, dass die Vereinbarung seine Umsatzprognose für 2026 nicht verändert.
📈 Die Aktien von AKAM stiegen nach der Bekanntgabe im After-Hours-Handel um mehr als 20%. Die Reaktion spiegelt die Erwartung wider, dass Akamai sich über CDN und Cybersecurity hinaus in Richtung KI-Infrastruktur ausweiten könnte, obwohl der wirtschaftliche Wert des Deals von der Umsetzung, den Capex-Anforderungen und der Kundenkonzentration bei Anthropic abhängen wird.
#AIInfrastructure
$AKAM
2
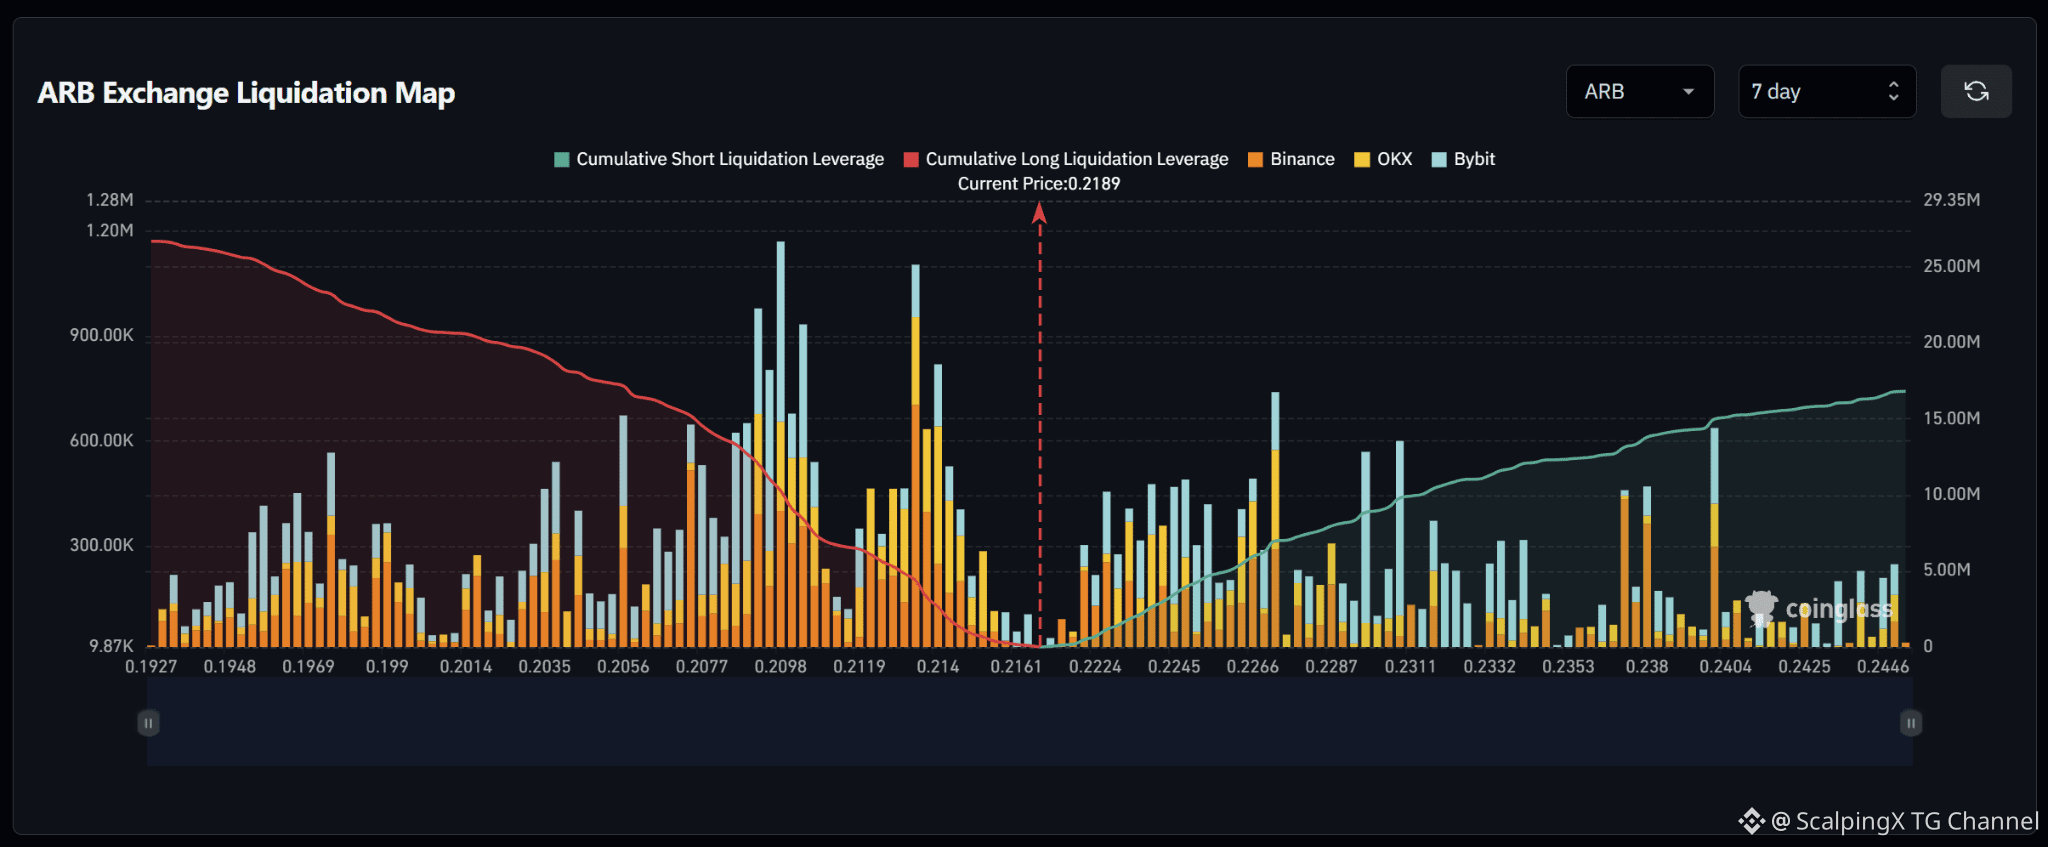
$ARB – Liquidationskarte (7 Tage) – Aktueller Preis 0.2189 🔎 Die 7-Tage-Liquidationskarte zeigt ungefähr 26–27 Millionen US-Dollar an Long-Liquidationen unter dem aktuellen Preis, während es oberhalb etwa 16–17 Millionen US-Dollar an Short-Liquidationen sind. Die Liquiditätsstruktur hat daher eine eher nach unten gerichtete Tendenz: Mit rund 1,6-mal mehr kumulierter Liquidität unter dem Markt. 📉 Unter dem Markt ist die Liquidität für Long-Liquidationen stark gebündelt in dem Bereich 0.207–0.214. Der stärkste Cluster liegt bei etwa 0.209–0.210 mit einem Balken nahe 1,2 Millionen US-Dollar, während 0.213–0.214 ebenfalls einen Balken über 1 Million US-Dollar enthält. Wenn 0.216 fällt, verschiebt sich der Fokus auf 0.214–0.212 und anschließend auf 0.210–0.208. 📈 Oberhalb des Marktes ist die Liquidität für Short-Liquidationen stark verteilt über 0.222–0.233. Ein auffälliger Cluster befindet sich bei etwa 0.226–0.227 mit einem Balken nahe 0,7 Millionen US-Dollar, während 0.230–0.231 ungefähr 0,6 Millionen US-Dollar erreicht. Weiter entfernt enthalten 0.237–0.240 zusätzliche Bereiche um 0,4–0,6 Millionen US-Dollar. 🧭 Das übergeordnete Setup begünstigt weiterhin die Abwärtsseite, weil die Long-Liquidations-Exponierung unterhalb größer ist. Wenn 0.216 fällt, steigt die Wahrscheinlichkeit eines Sweeps in Richtung 0.214–0.212, gefolgt von 0.210–0.208. Ein Bruch über 0.222 würde stattdessen zunächst 0.226–0.231 freilegen, bevor der Fokus auf 0.237–0.240 übergeht.
$ARB – Liquidationskarte (7 Tage) – Aktueller Preis 0.2189 🔎 Die 7-Tage-Liquidationskarte zeigt ungefähr 26–27 Millionen US-Dollar an Long-Liquidationen unter dem aktuellen Preis, während es oberhalb etwa 16–17 Millionen US-Dollar an Short-Liquidationen sind. Die Liquiditätsstruktur hat daher eine eher nach unten gerichtete Tendenz: Mit rund 1,6-mal mehr kumulierter Liquidität unter dem Markt. 📉 Unter dem Markt ist die Liquidität für Long-Liquidationen stark gebündelt in dem Bereich 0.207–0.214. Der stärkste Cluster liegt bei etwa 0.209–0.210 mit einem Balken nahe 1,2 Millionen US-Dollar, während 0.213–0.214 ebenfalls einen Balken über 1 Million US-Dollar enthält. Wenn 0.216 fällt, verschiebt sich der Fokus auf 0.214–0.212 und anschließend auf 0.210–0.208. 📈 Oberhalb des Marktes ist die Liquidität für Short-Liquidationen stark verteilt über 0.222–0.233. Ein auffälliger Cluster befindet sich bei etwa 0.226–0.227 mit einem Balken nahe 0,7 Millionen US-Dollar, während 0.230–0.231 ungefähr 0,6 Millionen US-Dollar erreicht. Weiter entfernt enthalten 0.237–0.240 zusätzliche Bereiche um 0,4–0,6 Millionen US-Dollar. 🧭 Das übergeordnete Setup begünstigt weiterhin die Abwärtsseite, weil die Long-Liquidations-Exponierung unterhalb größer ist. Wenn 0.216 fällt, steigt die Wahrscheinlichkeit eines Sweeps in Richtung 0.214–0.212, gefolgt von 0.210–0.208. Ein Bruch über 0.222 würde stattdessen zunächst 0.226–0.231 freilegen, bevor der Fokus auf 0.237–0.240 übergeht.
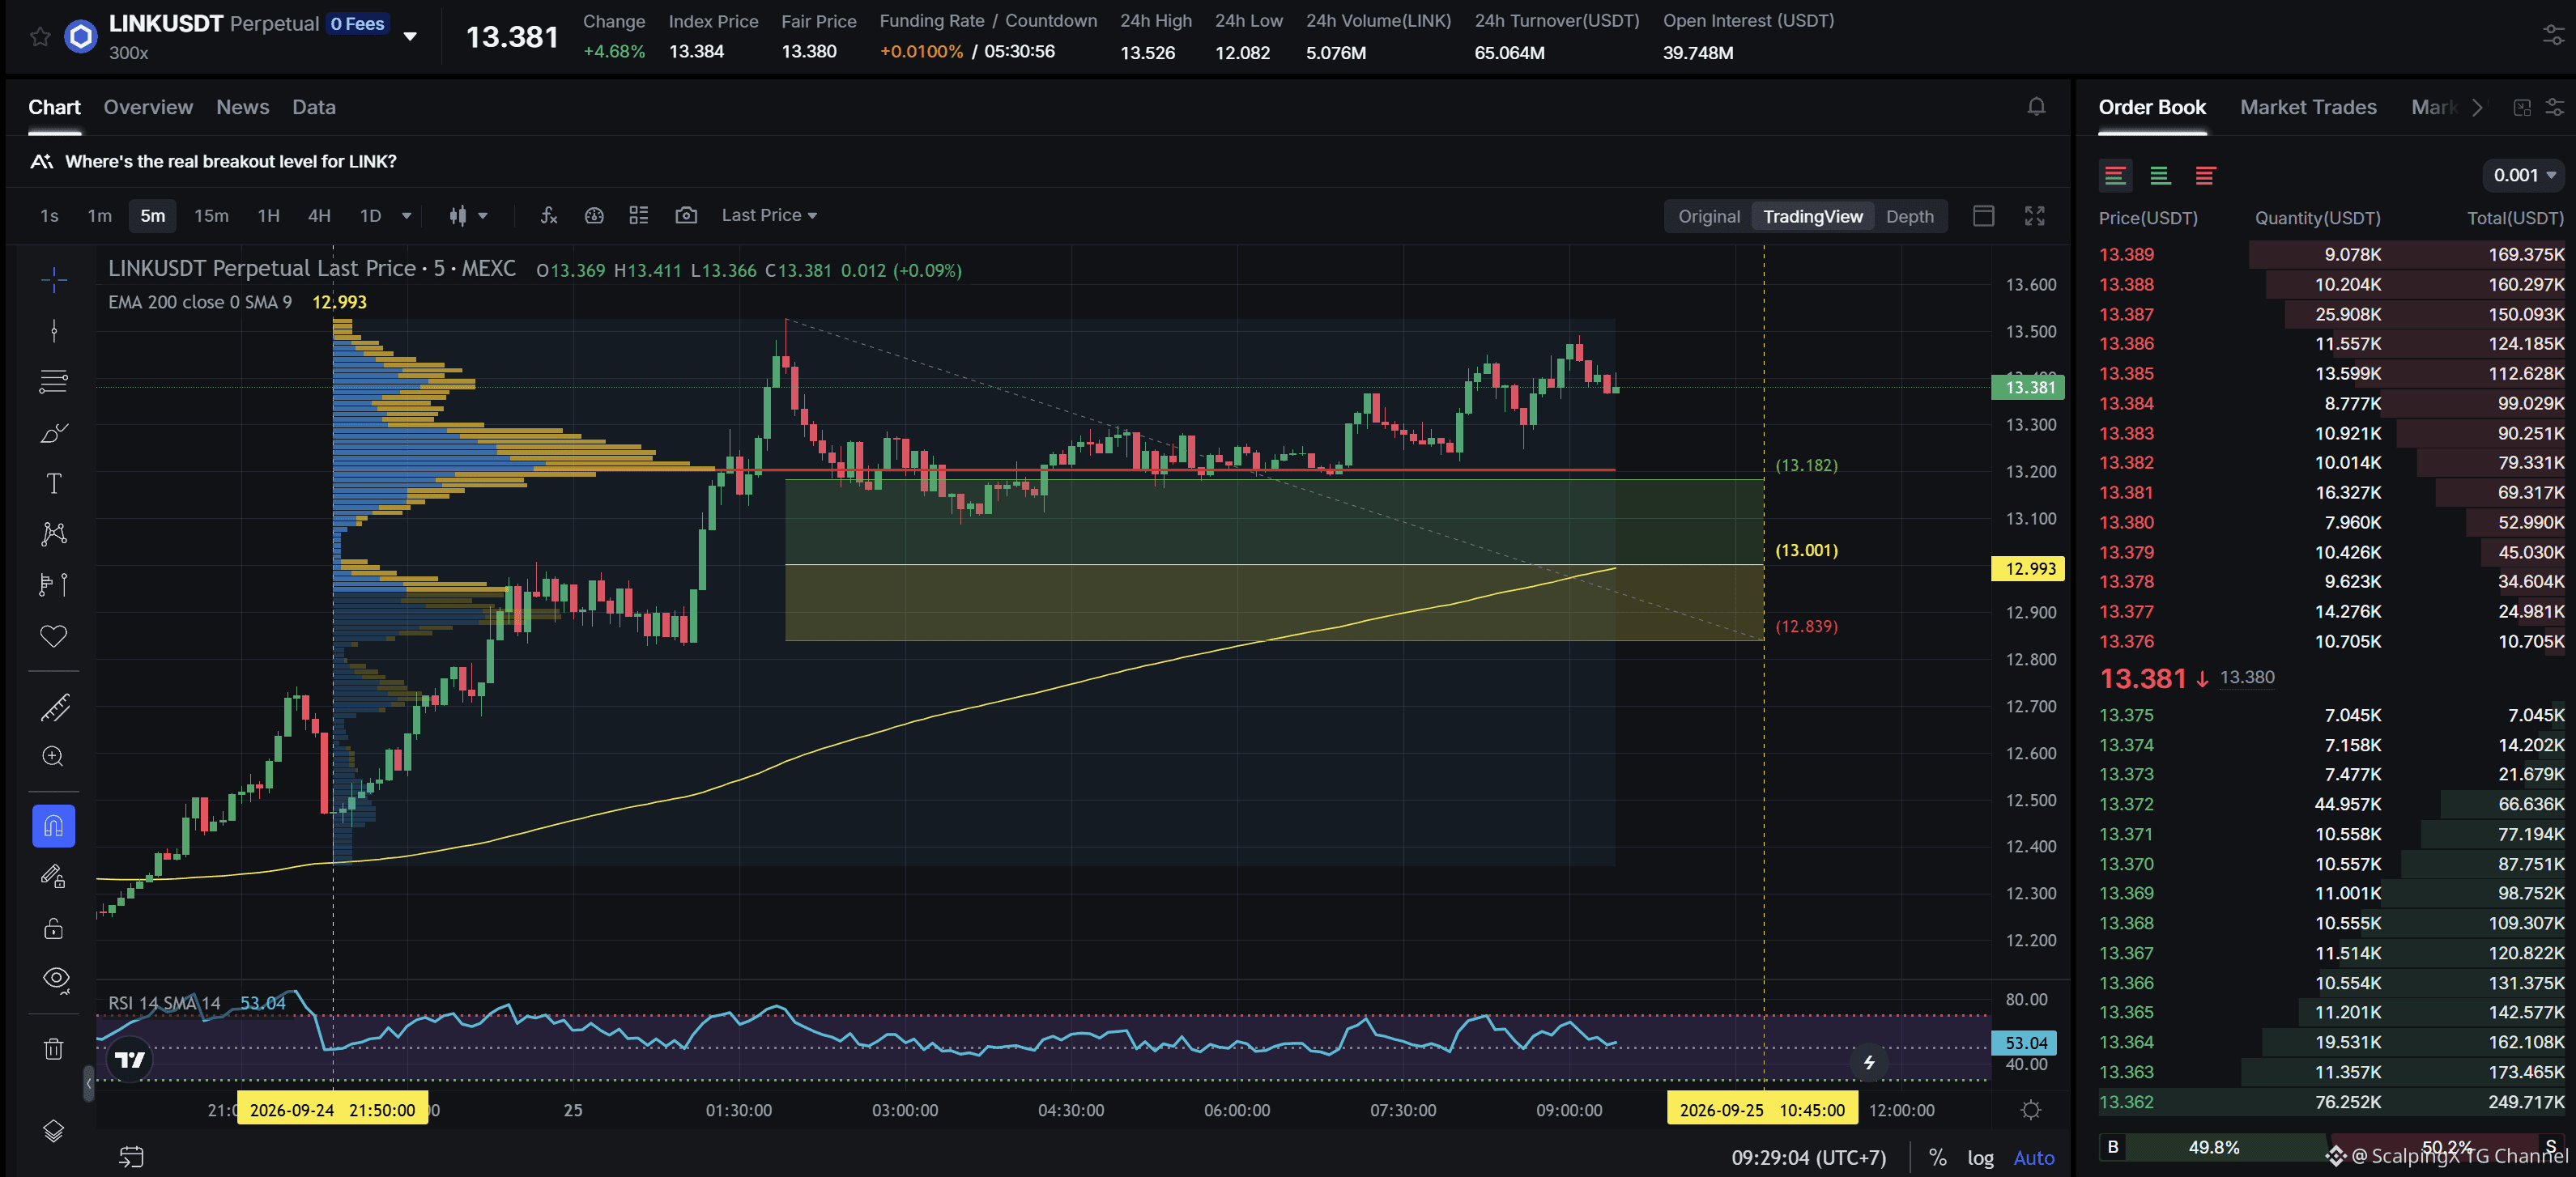
$LINK - Mcap 10.03B$ - 24h Sentiment +4.39 Bullisch SC02 M5 - ausstehende Long-Order. Der Entry liegt innerhalb der LVN + ist nicht von irgendeiner schwachen Zone betroffen, die aktuelle Support-Zone hat ungefähr eine Breite von 1,19%. Der Aufwärtstrend dauert seit 11 Stunden 40 Minuten, mit einem maximal aufgezeichneten Preisanstieg von 9,36%. Wenn der Preis diese Support-Zone verliert, ist es sehr wahrscheinlich, dass sich der Trend nach unten umkehrt.
$LINK - Mcap 10.03B$ - 24h Sentiment +4.39 Bullisch SC02 M5 - ausstehende Long-Order. Der Entry liegt innerhalb der LVN + ist nicht von irgendeiner schwachen Zone betroffen, die aktuelle Support-Zone hat ungefähr eine Breite von 1,19%. Der Aufwärtstrend dauert seit 11 Stunden 40 Minuten, mit einem maximal aufgezeichneten Preisanstieg von 9,36%. Wenn der Preis diese Support-Zone verliert, ist es sehr wahrscheinlich, dass sich der Trend nach unten umkehrt.
26
Übersetzung ansehen
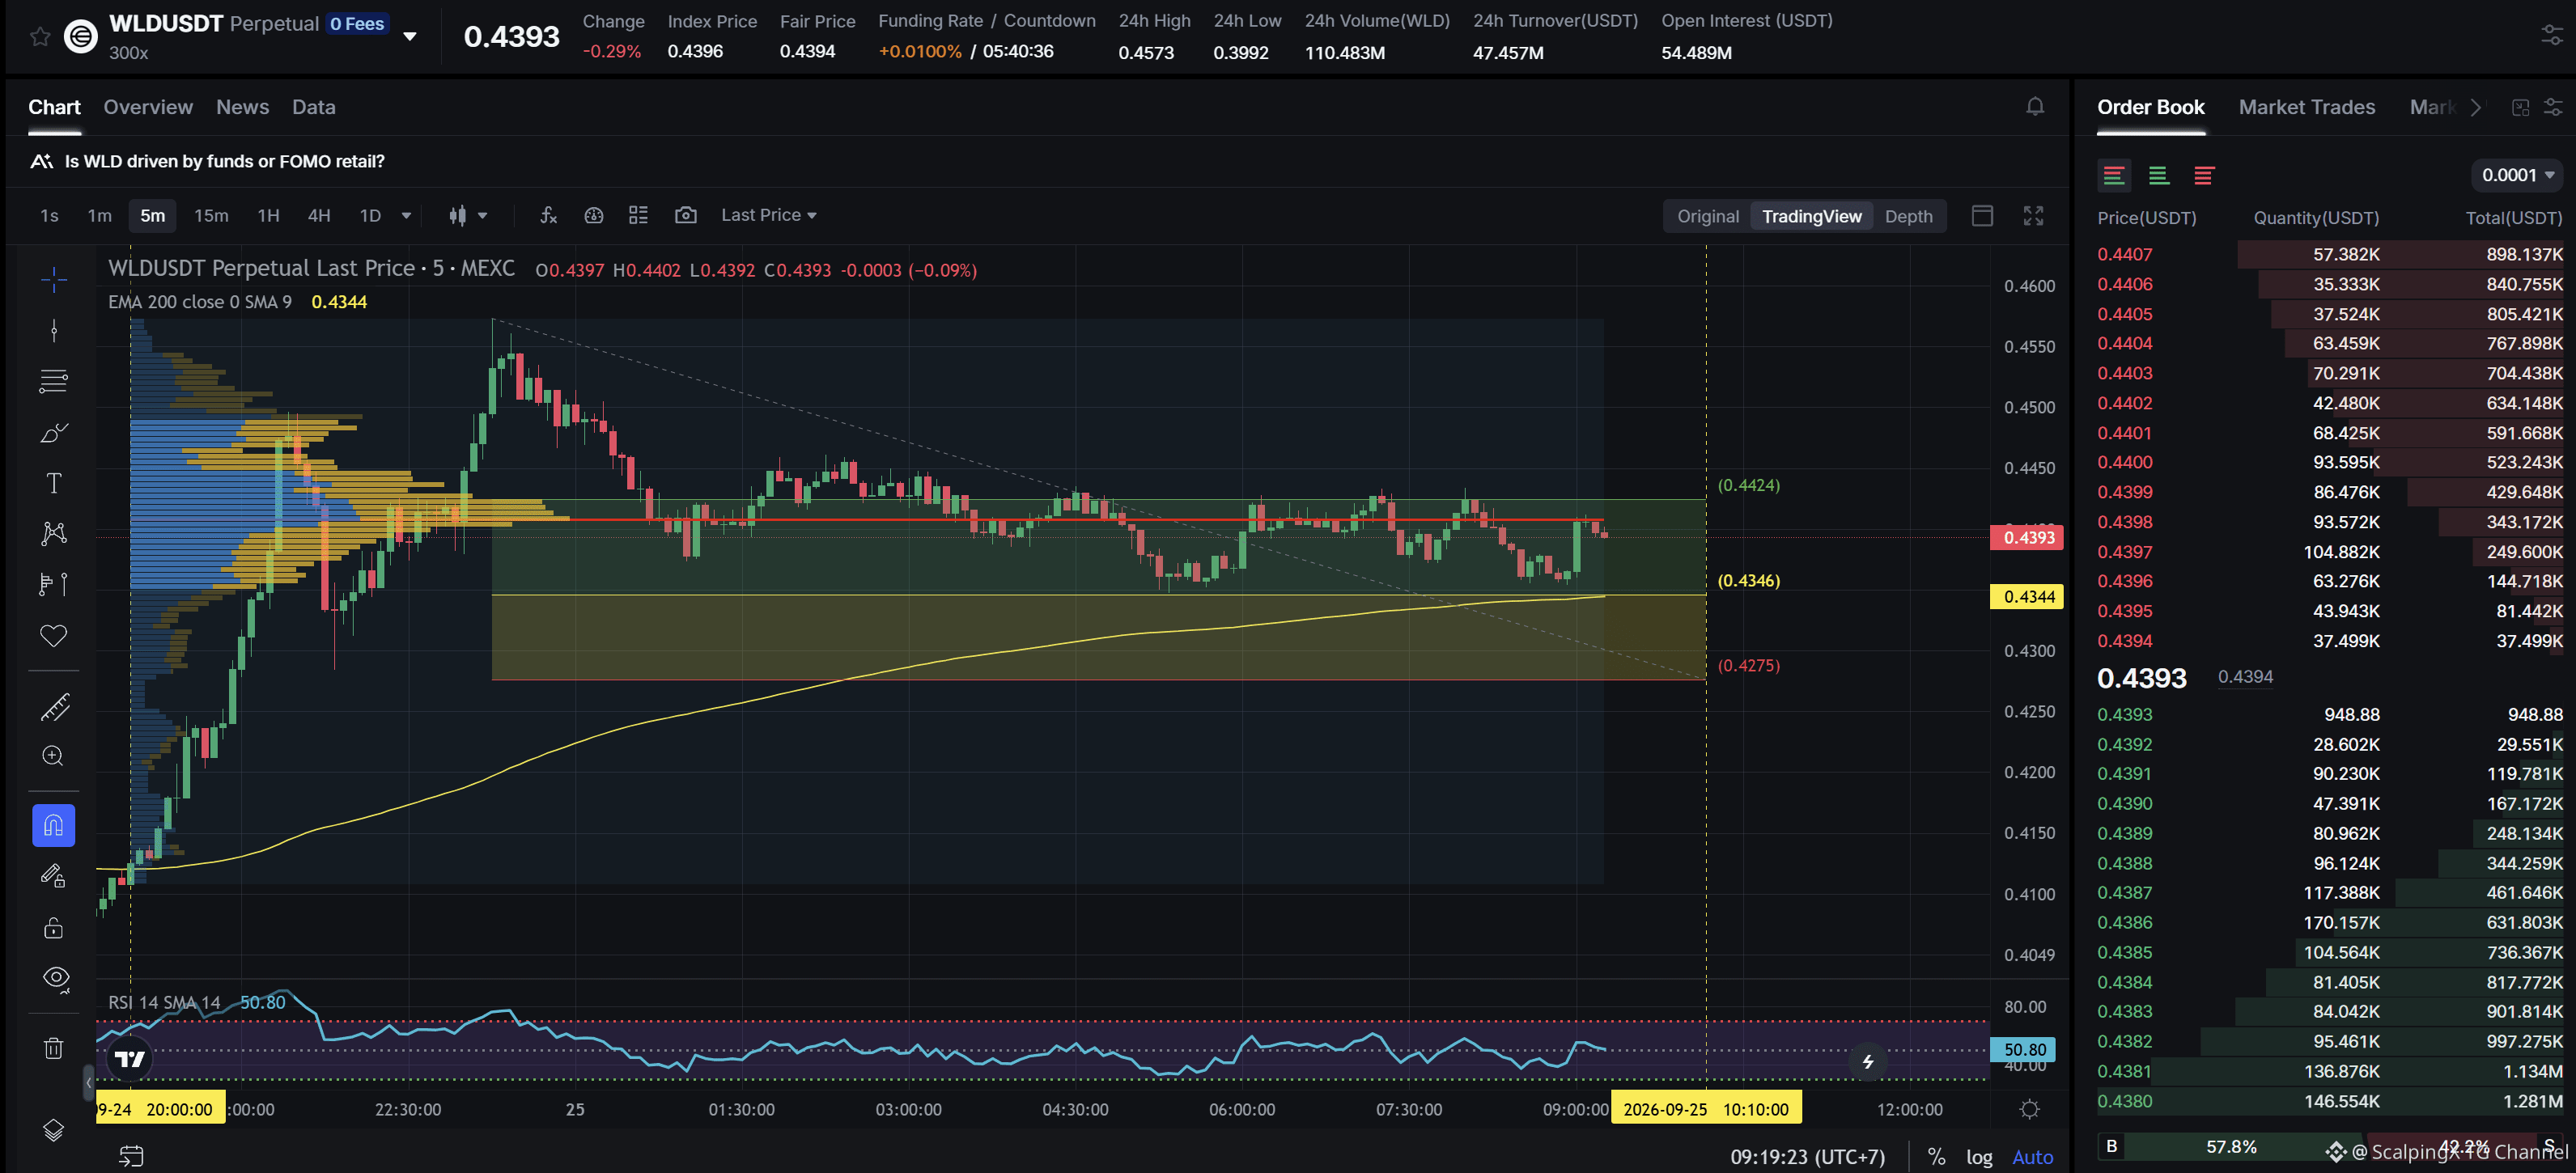
$WLD - Mcap 1.6B$ - 24h Sentiment Neutral SC02 M5 - pending Long order. Entry lies within LVN + not affected by any weak zone, the current support zone is approximately 1.63% wide. The uptrend has lasted 13 hours 20 minutes, with a maximum recorded price increase of 10.90%. If price loses this support zone, the trend is highly likely to reverse downward.
$WLD - Mcap 1.6B$ - 24h Sentiment Neutral SC02 M5 - pending Long order. Entry lies within LVN + not affected by any weak zone, the current support zone is approximately 1.63% wide. The uptrend has lasted 13 hours 20 minutes, with a maximum recorded price increase of 10.90%. If price loses this support zone, the trend is highly likely to reverse downward.
26
Oracle beruft sich auf höhere Gewalt im Projekt Jupiter, da die Terminrisiken zunehmen
⚠️ Oracle hat eine Mitteilung über höhere Gewalt im Zusammenhang mit dem Projekt Jupiter in New Mexico herausgegeben und sucht vertraglichen Schutz, falls das Rechenzentrum nicht wie geplant ans Netz geht. Der Schritt bedeutet nicht, dass Oracle sich aus dem Projekt zurückziehen will.
⚡ Die größte Bremse ist die Energieinfrastruktur. Die Gas-Pipeline, die den rund 2,45 GW großen AI-Campus versorgt, hat Verzögerungen erlitten, während einige Genehmigungen, die mit dem Stromsystem zusammenhängen, noch ausstehen.
🏗 Reuters zitierte eine Quelle, wonach das Projekt etwa ein Jahr hinter dem Zeitplan laufen könnte. Oracle hingegen betont, dass Jupiter weiterhin wie geplant voranschreitet, während Blue Owl sagt, dass sein finanzielles Engagement für das Projekt unverändert bleibt.
📉 Die Märkte reagierten vorsichtig: Sowohl ORCL als auch OWL fielen in der Sitzung um mehr als 3 %. Anleger richten ihren Fokus zunehmend auf die Verfügbarkeit von Strom und auf Ausführungsrisiken beim Ausbau der KI-Rechenzentren.
#AIInfrastructure
$ORCL
Oracle beruft sich auf höhere Gewalt im Projekt Jupiter, da die Terminrisiken zunehmen
⚠️ Oracle hat eine Mitteilung über höhere Gewalt im Zusammenhang mit dem Projekt Jupiter in New Mexico herausgegeben und sucht vertraglichen Schutz, falls das Rechenzentrum nicht wie geplant ans Netz geht. Der Schritt bedeutet nicht, dass Oracle sich aus dem Projekt zurückziehen will.
⚡ Die größte Bremse ist die Energieinfrastruktur. Die Gas-Pipeline, die den rund 2,45 GW großen AI-Campus versorgt, hat Verzögerungen erlitten, während einige Genehmigungen, die mit dem Stromsystem zusammenhängen, noch ausstehen.
🏗 Reuters zitierte eine Quelle, wonach das Projekt etwa ein Jahr hinter dem Zeitplan laufen könnte. Oracle hingegen betont, dass Jupiter weiterhin wie geplant voranschreitet, während Blue Owl sagt, dass sein finanzielles Engagement für das Projekt unverändert bleibt.
📉 Die Märkte reagierten vorsichtig: Sowohl ORCL als auch OWL fielen in der Sitzung um mehr als 3 %. Anleger richten ihren Fokus zunehmend auf die Verfügbarkeit von Strom und auf Ausführungsrisiken beim Ausbau der KI-Rechenzentren.
#AIInfrastructure
$ORCL
⚠️ Oracle hat eine Mitteilung über höhere Gewalt im Zusammenhang mit dem Projekt Jupiter in New Mexico herausgegeben und sucht vertraglichen Schutz, falls das Rechenzentrum nicht wie geplant ans Netz geht. Der Schritt bedeutet nicht, dass Oracle sich aus dem Projekt zurückziehen will.
⚡ Die größte Bremse ist die Energieinfrastruktur. Die Gas-Pipeline, die den rund 2,45 GW großen AI-Campus versorgt, hat Verzögerungen erlitten, während einige Genehmigungen, die mit dem Stromsystem zusammenhängen, noch ausstehen.
🏗 Reuters zitierte eine Quelle, wonach das Projekt etwa ein Jahr hinter dem Zeitplan laufen könnte. Oracle hingegen betont, dass Jupiter weiterhin wie geplant voranschreitet, während Blue Owl sagt, dass sein finanzielles Engagement für das Projekt unverändert bleibt.
📉 Die Märkte reagierten vorsichtig: Sowohl ORCL als auch OWL fielen in der Sitzung um mehr als 3 %. Anleger richten ihren Fokus zunehmend auf die Verfügbarkeit von Strom und auf Ausführungsrisiken beim Ausbau der KI-Rechenzentren.
#AIInfrastructure
$ORCL

57
Übersetzung ansehen
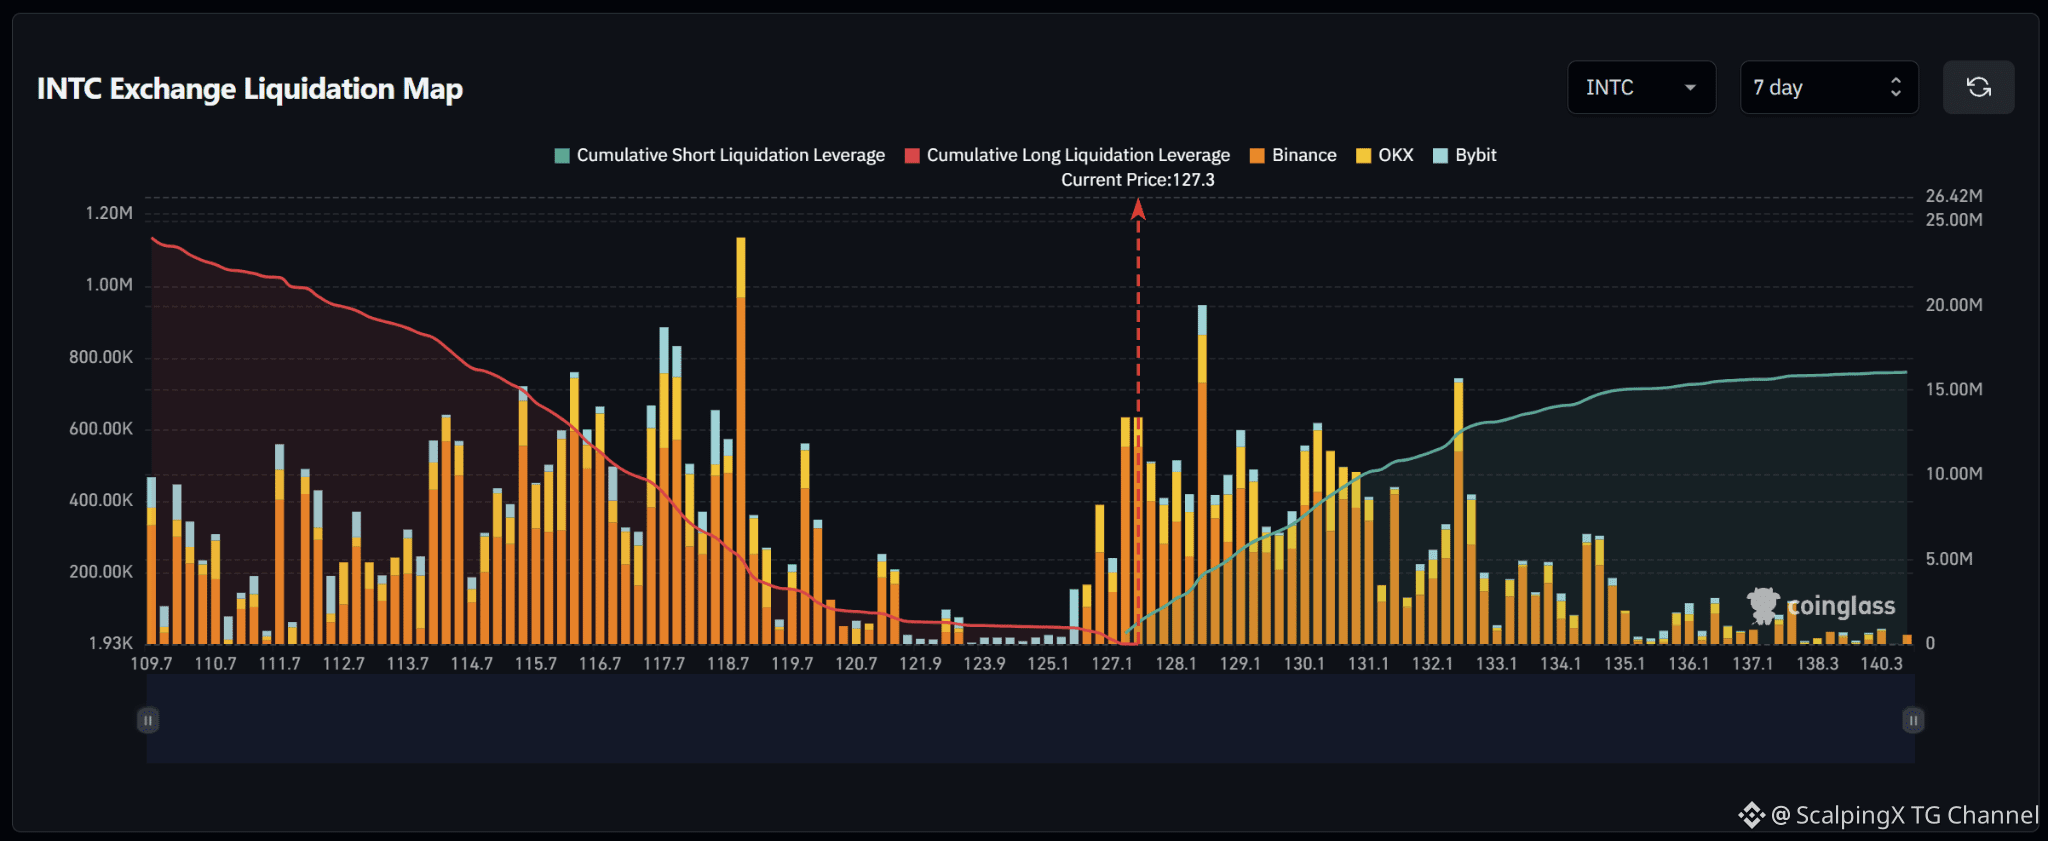
$INTC – Liquidation Map (7 Days) – Current Price 127.3 🔎 The 7-day liquidation map shows roughly $23–24 million in long liquidations below the current price, exceeding approximately $15–16 million in short liquidations above. The liquidity structure therefore favors the downside, with around 1.5 times more cumulative liquidity below the market. 📉 Below the market, long-liquidation liquidity is concentrated most heavily across 114–120. The strongest cluster sits around 118.7–119.0 with a bar above $1.1 million; the 117.5–118.0 area also contains several bars around $0.8–0.9 million, while 115.5–116.7 forms another relatively dense band. Liquidity between 121 and 125 is comparatively thin, so losing 125 could quickly shift attention toward 120–119 and then 118–117. 📈 Above the market, short-liquidation liquidity is concentrated mainly across 127–133. The strongest nearby cluster sits around 128.2–128.5 with a bar close to $0.95 million; 130–131 contains several bars around $0.5–0.6 million, while 132.2–132.5 holds another cluster near $0.7–0.75 million. Above 135, liquidity density declines noticeably. 🧭 The broader setup still favors the downside because long-liquidation exposure below is larger. Losing 125 would increase the probability of a sweep toward 120–119, followed by 118–117. Breaking above 128 would instead expose 128.5–131 and then 132–133.
$INTC – Liquidation Map (7 Days) – Current Price 127.3 🔎 The 7-day liquidation map shows roughly $23–24 million in long liquidations below the current price, exceeding approximately $15–16 million in short liquidations above. The liquidity structure therefore favors the downside, with around 1.5 times more cumulative liquidity below the market. 📉 Below the market, long-liquidation liquidity is concentrated most heavily across 114–120. The strongest cluster sits around 118.7–119.0 with a bar above $1.1 million; the 117.5–118.0 area also contains several bars around $0.8–0.9 million, while 115.5–116.7 forms another relatively dense band. Liquidity between 121 and 125 is comparatively thin, so losing 125 could quickly shift attention toward 120–119 and then 118–117. 📈 Above the market, short-liquidation liquidity is concentrated mainly across 127–133. The strongest nearby cluster sits around 128.2–128.5 with a bar close to $0.95 million; 130–131 contains several bars around $0.5–0.6 million, while 132.2–132.5 holds another cluster near $0.7–0.75 million. Above 135, liquidity density declines noticeably. 🧭 The broader setup still favors the downside because long-liquidation exposure below is larger. Losing 125 would increase the probability of a sweep toward 120–119, followed by 118–117. Breaking above 128 would instead expose 128.5–131 and then 132–133.
45
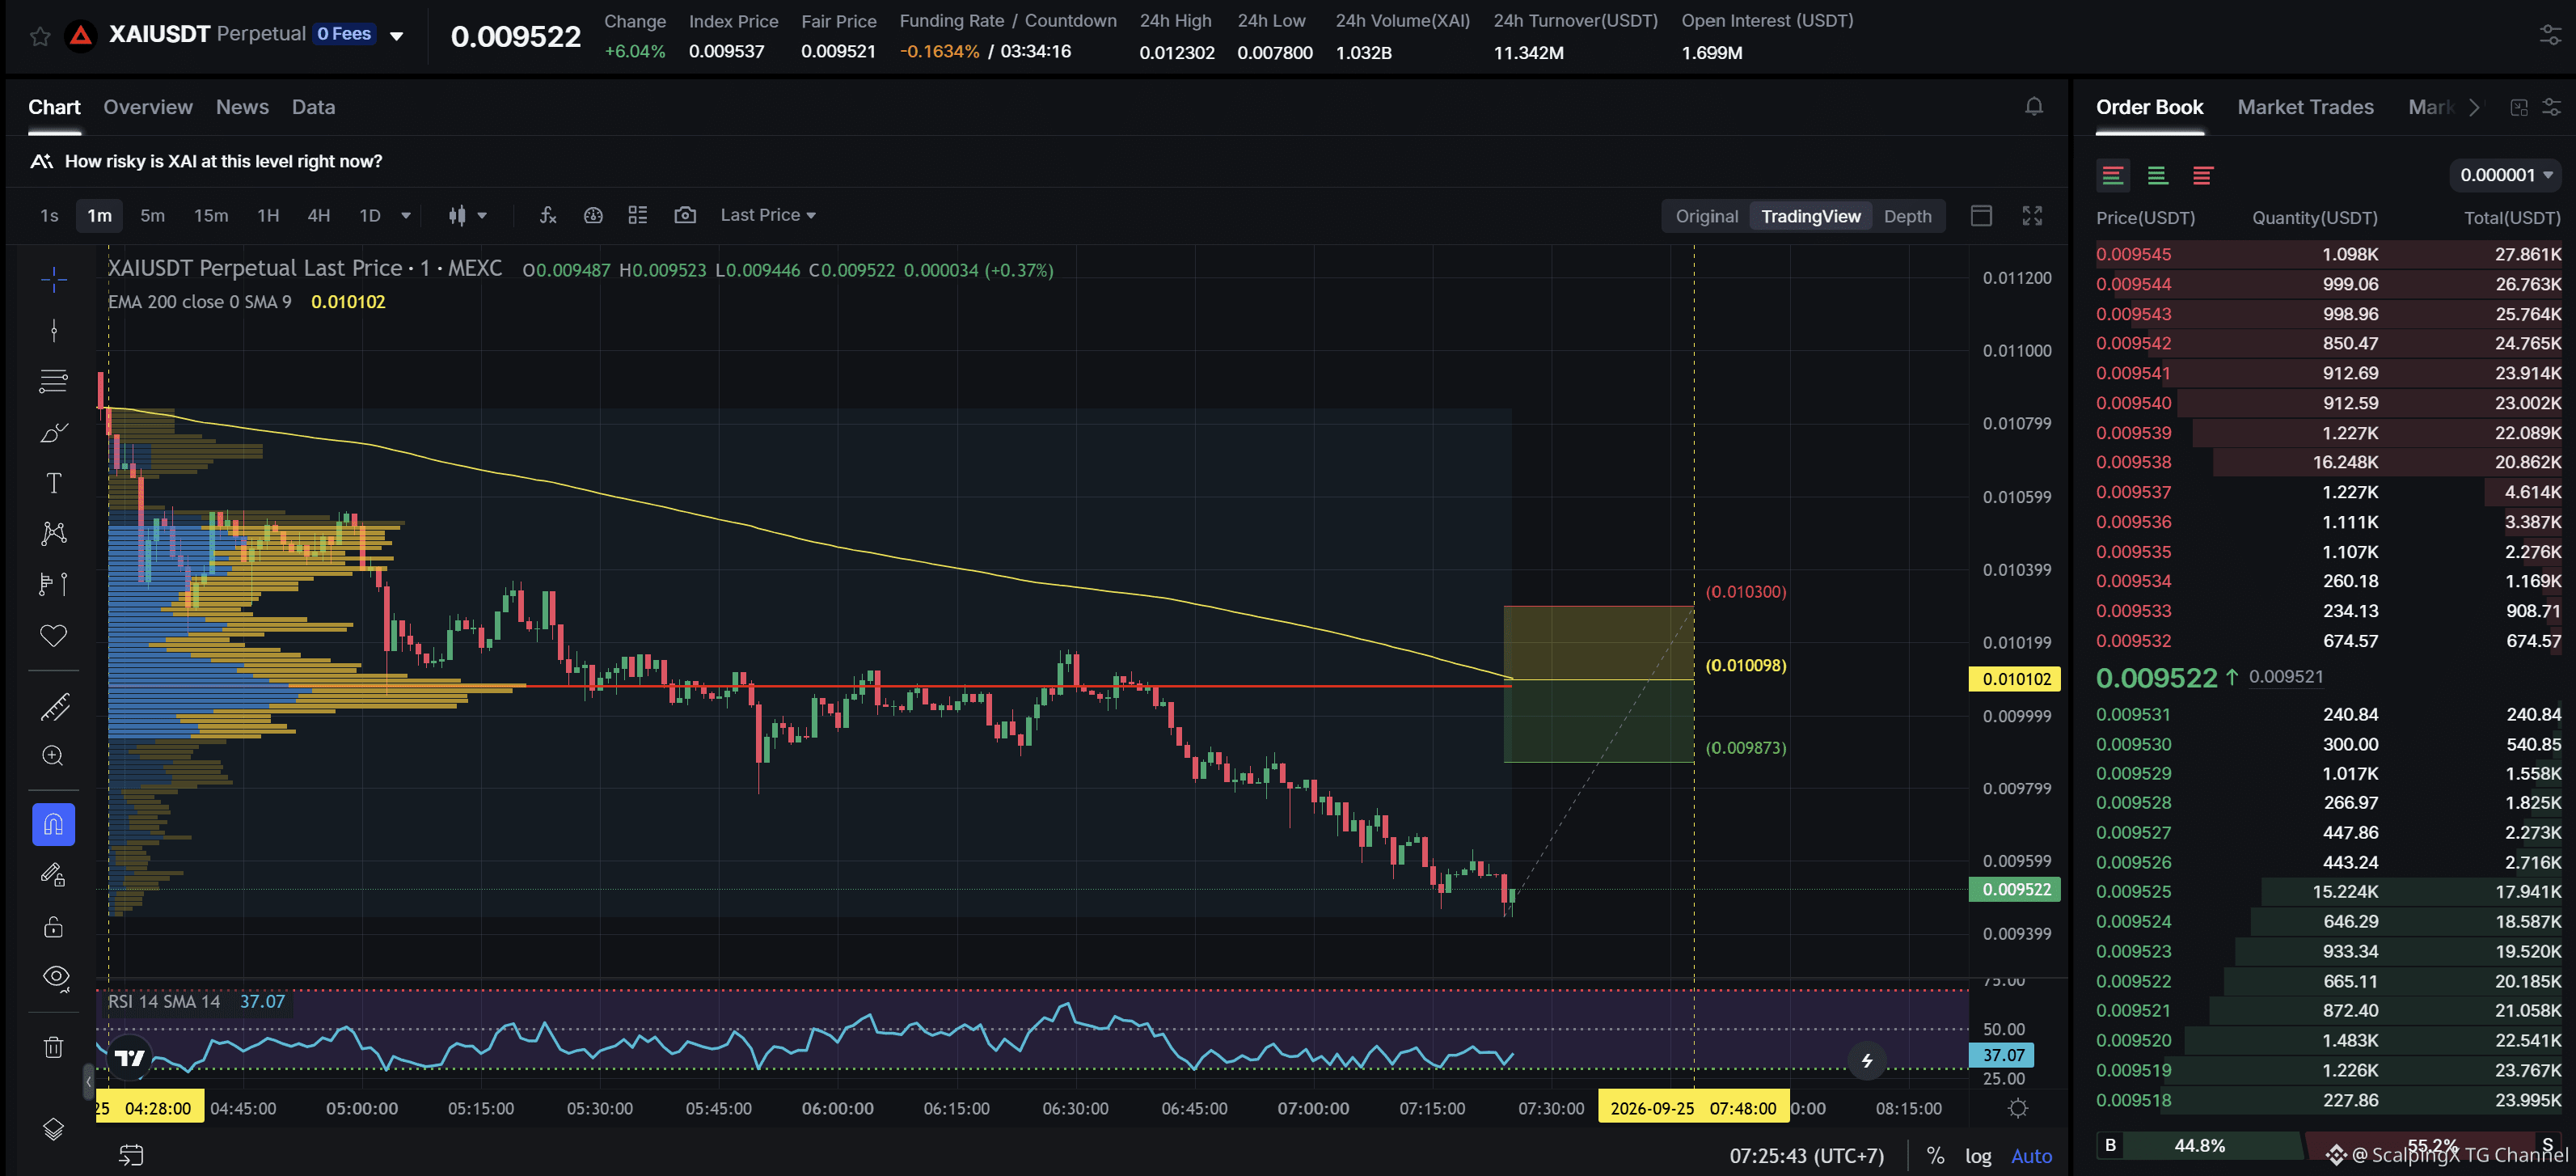
$XAI - Mcap 20.21M$ - 24h Sentiment +5.80 Bullish SC02 M1 - ausstehende Kurzorder. Der Einstieg liegt innerhalb des HVN und wird nicht durch eine der Schwachzonen beeinträchtigt. Die aktuelle Widerstandszone ist ungefähr 1,96 % breit. Der Abwärtstrend dauert seit 2 Stunden 59 Minuten, mit einem maximal aufgezeichneten Preisrückgang von 13,02 %. Wenn der Preis über diese Widerstandszone ausbricht, ist es sehr wahrscheinlich, dass der Trend nach oben dreht.
$XAI - Mcap 20.21M$ - 24h Sentiment +5.80 Bullish SC02 M1 - ausstehende Kurzorder. Der Einstieg liegt innerhalb des HVN und wird nicht durch eine der Schwachzonen beeinträchtigt. Die aktuelle Widerstandszone ist ungefähr 1,96 % breit. Der Abwärtstrend dauert seit 2 Stunden 59 Minuten, mit einem maximal aufgezeichneten Preisrückgang von 13,02 %. Wenn der Preis über diese Widerstandszone ausbricht, ist es sehr wahrscheinlich, dass der Trend nach oben dreht.
58
Anmelden und weiter Inhalte entdecken
Krypto-Nutzer weltweit auf Binance Square kennenlernen
⚡️ Bleib in Sachen Krypto stets am Puls.
💬 Die weltgrößte Kryptobörse vertraut darauf.
👍 Erhalte verlässliche Einblicke von verifizierten Creators.
E-Mail-Adresse/Telefonnummer
Trendthemen
QNTRises39%
34,700 Aufrufe
1,072 Kommentare
#qntrises39%
QNT zieht gerade einen Raketen-Sprung mit 39% 🚀 aber steuern wir jetzt den Mars an – oder fallen wir einfach nur vom Bett? 😂
Wenn man sich den Chart ansieht: QNT hat bei 105 USD einen verführerischen Peak erreicht, und jetzt zeigt dieser große rote Abwärtspfeil direkt nach unten Richtung 75 USD. Ist die Party offiziell vorbei – oder nimmt sie nur kurz Luft? 📉
Wenn du jetzt tradest: nicht panisch werden und nicht den Peak kaufen! Achte auf die Support-Level, sichere Gewinne oder warte auf die Erholung. Denk dran: Das ist keine Finanzberatung – mach immer deine eigene Recherche DYOR!
Fortsetzung bitte
Trade $QNTB
$NOM
$TAKE
#qntrises39% #QuantNetwork #CryptoTrading #Altcoins
Shamika Metting
·2 Likes
·3.3k Aufrufe
EthereumBreaksAbove$2700
3,193 Aufrufe
108 Kommentare
BitgetBreachForgedRequestsNotStolenKeys
33,213 Aufrufe
842 Kommentare