

Bitcoinworld
69.1k Beiträge

Bitcoinworld
 Square Verified+
Melden
Nutzer blockieren
BitcoinWorld is a leading media publication bringing the latest happenings in the Blockchain and Crypto Space.

#BinanceTurns7

Excellence Award (Market Buzz)

Creator of the Year
2 Following
100.7K+ Follower
287.4K+ Like gegeben
4 Abzeichen
Beiträge
Alle
Videos
Live
·
--
Artikel
Übersetzung ansehen
Reap and Collinson International Enter Landmark Partnership to Bring Priority Pass Airport Experi...BitcoinWorldReap and Collinson International Enter Landmark Partnership to Bring Priority Pass Airport Experiences to the Stablecoin and Crypto Ecosystem
The collaboration connects digital asset customers to premium travel benefits, giving eligible cardholders access to Priority Pass’ global network of over 1,900 airport lounges and travel experiences.
SINGAPORE, Oct. 5, 2026 /PRNewswire/ — Reap, a global financial technology company that enables financial connectivity and access for businesses worldwide through stablecoin-enabled infrastructure, has entered a strategic partnership with Collinson International, the global leader in the provision of airport experiences, loyalty and customer engagement solutions, and owner and operator of Priority Pass.
The collaboration enables Reap’s clients in the digital-assets landscape, including leading global crypto exchanges, Web3 neobanks, private banks, and asset managers, to offer premium travel benefits to their customers. This will grant eligible Reap cardholders access to Priority Pass’ global network of over 1,900 airport lounges and travel experiences, including spa, sleep pods, dining, and more.
The partnership comes as meaningful travel benefits take on an increasingly central role in enhancing customer value and engagement. According to Collinson International’s research report, access to airport lounges is ranked as the most desirable travel benefit, while 92% of respondents in Asia Pacific agree that travel rewards and benefits encourage card use for everyday and travel expenses. The findings highlight how travel benefits, including access to airport lounges through Priority Pass, can help drive card use, customer engagement and loyalty.
“As the payments landscape continues to evolve, the ability to provide experiential value is becoming an increasingly important differentiator among financial products,” said Rom Remy, SVP Commercial, APAC at Collinson International. “Travel experiences, in particular, offer payment providers a powerful way to deepen customer engagement, build loyalty and lifetime value. We are delighted to partner with Reap as it expands across high-growth markets. Through access to Priority Pass’ global network of airport lounges and travel experiences, Reap can help its clients to broaden their offerings and deliver more seamless, premium journeys to travellers worldwide.”
The partnership extends Reap’s card issuing offering into lifestyle and travel benefits. By connecting onchain spending to real-world experiences, Reap enables its clients to reward everyday card usage and strengthen their customer retention, bringing the experiential value that has long driven engagement in traditional card programmes to stablecoin-linked cards.
“At Reap, our stablecoin-native infrastructure is built to create real-world value for the businesses we support and the customers they serve,” said Pablo Che Leon, Head of Customer Growth, Reap. “Stablecoins are becoming everyday money for millions of people, and the cards they spend with should carry the same benefits as any premium card. By bringing Priority Pass to Reap-issued cards, a cardholder in Hong Kong or Tokyo can now enjoy the same airport lounge experience as a premium cardholder in London or New York. For our clients, it’s a new way to differentiate their card offerings, reward everyday spending and keep customers engaged.”
For more information, please visit https://reap.global/products/reap-rewards.
About Priority Pass
Priority Pass is the world’s original and market-leading airport experiences programme. We provide travellers with access to over 1,900 lounges and travel experiences in 865 airports in 143 countries. Members can access an ever-growing range of premium experiences – from spas to sleeping pods to dining – that help elevate every journey into something special. By building partnerships with other leading brands, we help to bring a better travel experience to the world.
Priority Pass is owned and operated by Collinson International, part of The Collinson Group, a family-owned business. Formed over 35 years ago, it now has five distinct operating companies that generate a combined annual revenue of £2.1bn, employing more than 2,500 people across 14 countries.
About Reap
Reap is a global financial technology company that enables financial connectivity and access for businesses worldwide through stablecoin-native infrastructure. We transform the financial landscape through more efficient money movement by merging traditional finance with digital assets, bridging disparate economies and connecting key financial markets.
Reap was an early leader in Asia to incorporate stablecoins into our solutions. In 2025, Reap processed billions in stablecoin-funded transaction flows. From stablecoin-enabled corporate cards to cross-border payments, we streamline financial operations and empower companies to scale with our integrated business accounts and embedded finance solutions.
Founded and headquartered in Hong Kong, Reap employs 300 people worldwide.
More information about Reap can be found at reap.global.
SOURCE Reap
This post Reap and Collinson International Enter Landmark Partnership to Bring Priority Pass Airport Experiences to the Stablecoin and Crypto Ecosystem first appeared on BitcoinWorld.
Reap and Collinson International Enter Landmark Partnership to Bring Priority Pass Airport Experi...
BitcoinWorldReap and Collinson International Enter Landmark Partnership to Bring Priority Pass Airport Experiences to the Stablecoin and Crypto Ecosystem
The collaboration connects digital asset customers to premium travel benefits, giving eligible cardholders access to Priority Pass’ global network of over 1,900 airport lounges and travel experiences.
SINGAPORE, Oct. 5, 2026 /PRNewswire/ — Reap, a global financial technology company that enables financial connectivity and access for businesses worldwide through stablecoin-enabled infrastructure, has entered a strategic partnership with Collinson International, the global leader in the provision of airport experiences, loyalty and customer engagement solutions, and owner and operator of Priority Pass.
The collaboration enables Reap’s clients in the digital-assets landscape, including leading global crypto exchanges, Web3 neobanks, private banks, and asset managers, to offer premium travel benefits to their customers. This will grant eligible Reap cardholders access to Priority Pass’ global network of over 1,900 airport lounges and travel experiences, including spa, sleep pods, dining, and more.
The partnership comes as meaningful travel benefits take on an increasingly central role in enhancing customer value and engagement. According to Collinson International’s research report, access to airport lounges is ranked as the most desirable travel benefit, while 92% of respondents in Asia Pacific agree that travel rewards and benefits encourage card use for everyday and travel expenses. The findings highlight how travel benefits, including access to airport lounges through Priority Pass, can help drive card use, customer engagement and loyalty.
“As the payments landscape continues to evolve, the ability to provide experiential value is becoming an increasingly important differentiator among financial products,” said Rom Remy, SVP Commercial, APAC at Collinson International. “Travel experiences, in particular, offer payment providers a powerful way to deepen customer engagement, build loyalty and lifetime value. We are delighted to partner with Reap as it expands across high-growth markets. Through access to Priority Pass’ global network of airport lounges and travel experiences, Reap can help its clients to broaden their offerings and deliver more seamless, premium journeys to travellers worldwide.”
The partnership extends Reap’s card issuing offering into lifestyle and travel benefits. By connecting onchain spending to real-world experiences, Reap enables its clients to reward everyday card usage and strengthen their customer retention, bringing the experiential value that has long driven engagement in traditional card programmes to stablecoin-linked cards.
“At Reap, our stablecoin-native infrastructure is built to create real-world value for the businesses we support and the customers they serve,” said Pablo Che Leon, Head of Customer Growth, Reap. “Stablecoins are becoming everyday money for millions of people, and the cards they spend with should carry the same benefits as any premium card. By bringing Priority Pass to Reap-issued cards, a cardholder in Hong Kong or Tokyo can now enjoy the same airport lounge experience as a premium cardholder in London or New York. For our clients, it’s a new way to differentiate their card offerings, reward everyday spending and keep customers engaged.”
For more information, please visit https://reap.global/products/reap-rewards.
About Priority Pass
Priority Pass is the world’s original and market-leading airport experiences programme. We provide travellers with access to over 1,900 lounges and travel experiences in 865 airports in 143 countries. Members can access an ever-growing range of premium experiences – from spas to sleeping pods to dining – that help elevate every journey into something special. By building partnerships with other leading brands, we help to bring a better travel experience to the world.
Priority Pass is owned and operated by Collinson International, part of The Collinson Group, a family-owned business. Formed over 35 years ago, it now has five distinct operating companies that generate a combined annual revenue of £2.1bn, employing more than 2,500 people across 14 countries.
About Reap
Reap is a global financial technology company that enables financial connectivity and access for businesses worldwide through stablecoin-native infrastructure. We transform the financial landscape through more efficient money movement by merging traditional finance with digital assets, bridging disparate economies and connecting key financial markets.
Reap was an early leader in Asia to incorporate stablecoins into our solutions. In 2025, Reap processed billions in stablecoin-funded transaction flows. From stablecoin-enabled corporate cards to cross-border payments, we streamline financial operations and empower companies to scale with our integrated business accounts and embedded finance solutions.
Founded and headquartered in Hong Kong, Reap employs 300 people worldwide.
More information about Reap can be found at reap.global.
SOURCE Reap
This post Reap and Collinson International Enter Landmark Partnership to Bring Priority Pass Airport Experiences to the Stablecoin and Crypto Ecosystem first appeared on BitcoinWorld.
The collaboration connects digital asset customers to premium travel benefits, giving eligible cardholders access to Priority Pass’ global network of over 1,900 airport lounges and travel experiences.
SINGAPORE, Oct. 5, 2026 /PRNewswire/ — Reap, a global financial technology company that enables financial connectivity and access for businesses worldwide through stablecoin-enabled infrastructure, has entered a strategic partnership with Collinson International, the global leader in the provision of airport experiences, loyalty and customer engagement solutions, and owner and operator of Priority Pass.
The collaboration enables Reap’s clients in the digital-assets landscape, including leading global crypto exchanges, Web3 neobanks, private banks, and asset managers, to offer premium travel benefits to their customers. This will grant eligible Reap cardholders access to Priority Pass’ global network of over 1,900 airport lounges and travel experiences, including spa, sleep pods, dining, and more.
The partnership comes as meaningful travel benefits take on an increasingly central role in enhancing customer value and engagement. According to Collinson International’s research report, access to airport lounges is ranked as the most desirable travel benefit, while 92% of respondents in Asia Pacific agree that travel rewards and benefits encourage card use for everyday and travel expenses. The findings highlight how travel benefits, including access to airport lounges through Priority Pass, can help drive card use, customer engagement and loyalty.
“As the payments landscape continues to evolve, the ability to provide experiential value is becoming an increasingly important differentiator among financial products,” said Rom Remy, SVP Commercial, APAC at Collinson International. “Travel experiences, in particular, offer payment providers a powerful way to deepen customer engagement, build loyalty and lifetime value. We are delighted to partner with Reap as it expands across high-growth markets. Through access to Priority Pass’ global network of airport lounges and travel experiences, Reap can help its clients to broaden their offerings and deliver more seamless, premium journeys to travellers worldwide.”
The partnership extends Reap’s card issuing offering into lifestyle and travel benefits. By connecting onchain spending to real-world experiences, Reap enables its clients to reward everyday card usage and strengthen their customer retention, bringing the experiential value that has long driven engagement in traditional card programmes to stablecoin-linked cards.
“At Reap, our stablecoin-native infrastructure is built to create real-world value for the businesses we support and the customers they serve,” said Pablo Che Leon, Head of Customer Growth, Reap. “Stablecoins are becoming everyday money for millions of people, and the cards they spend with should carry the same benefits as any premium card. By bringing Priority Pass to Reap-issued cards, a cardholder in Hong Kong or Tokyo can now enjoy the same airport lounge experience as a premium cardholder in London or New York. For our clients, it’s a new way to differentiate their card offerings, reward everyday spending and keep customers engaged.”
For more information, please visit https://reap.global/products/reap-rewards.
About Priority Pass
Priority Pass is the world’s original and market-leading airport experiences programme. We provide travellers with access to over 1,900 lounges and travel experiences in 865 airports in 143 countries. Members can access an ever-growing range of premium experiences – from spas to sleeping pods to dining – that help elevate every journey into something special. By building partnerships with other leading brands, we help to bring a better travel experience to the world.
Priority Pass is owned and operated by Collinson International, part of The Collinson Group, a family-owned business. Formed over 35 years ago, it now has five distinct operating companies that generate a combined annual revenue of £2.1bn, employing more than 2,500 people across 14 countries.
About Reap
Reap is a global financial technology company that enables financial connectivity and access for businesses worldwide through stablecoin-native infrastructure. We transform the financial landscape through more efficient money movement by merging traditional finance with digital assets, bridging disparate economies and connecting key financial markets.
Reap was an early leader in Asia to incorporate stablecoins into our solutions. In 2025, Reap processed billions in stablecoin-funded transaction flows. From stablecoin-enabled corporate cards to cross-border payments, we streamline financial operations and empower companies to scale with our integrated business accounts and embedded finance solutions.
Founded and headquartered in Hong Kong, Reap employs 300 people worldwide.
More information about Reap can be found at reap.global.
SOURCE Reap
This post Reap and Collinson International Enter Landmark Partnership to Bring Priority Pass Airport Experiences to the Stablecoin and Crypto Ecosystem first appeared on BitcoinWorld.
85
·
--

Artikel
Zahlungen mit Visa-Stablecoin-Karten im Jahresvergleich um fast 200 % gestiegenBitcoinWorld
Zahlungen mit Visa-Stablecoin-Karten im Jahresvergleich um fast 200 % gestiegen
Visa teilte am 1. Oktober mit, dass das Zahlungsvolumen über seine Kartenprogramme mit Stablecoin-Anbindung im Jahresvergleich um fast 200 % gestiegen ist. Inzwischen laufen mehr als 160 Verbraucher- und Geschäftsprogramme über das Netzwerk des Unternehmens. Visa legte den Gesamtbetrag in US-Dollar, der diesem Wachstum zugrunde liegt, nicht offen. Die Mitteilung unterscheidet das Zahlungsvolumen über Karten von Visas Stablecoin-Abwicklungsaktivitäten, die einen anderen Teil des Netzwerks abbilden.
Das Zahlungsvolumen von Visa-Karten mit Stablecoin-Anbindung stieg im Jahresvergleich um fast 200 %, wobei mehr als 160 Programme in Betrieb sind. Geschäftliche und kommerzielle Kartenprogramme machten im laufenden Geschäftsjahr 2026 bis heute etwa 17 % dieses Volumens aus. Visa zufolge hat die Abwicklung von Stablecoin-Transaktionen kürzlich ein annualisiertes Volumen von 20 Milliarden US-Dollar überschritten.
Zahlungen mit Visa-Stablecoin-Karten im Jahresvergleich um fast 200 % gestiegen
BitcoinWorld
Zahlungen mit Visa-Stablecoin-Karten im Jahresvergleich um fast 200 % gestiegen
Visa teilte am 1. Oktober mit, dass das Zahlungsvolumen über seine Kartenprogramme mit Stablecoin-Anbindung im Jahresvergleich um fast 200 % gestiegen ist. Inzwischen laufen mehr als 160 Verbraucher- und Geschäftsprogramme über das Netzwerk des Unternehmens. Visa legte den Gesamtbetrag in US-Dollar, der diesem Wachstum zugrunde liegt, nicht offen. Die Mitteilung unterscheidet das Zahlungsvolumen über Karten von Visas Stablecoin-Abwicklungsaktivitäten, die einen anderen Teil des Netzwerks abbilden.
Das Zahlungsvolumen von Visa-Karten mit Stablecoin-Anbindung stieg im Jahresvergleich um fast 200 %, wobei mehr als 160 Programme in Betrieb sind. Geschäftliche und kommerzielle Kartenprogramme machten im laufenden Geschäftsjahr 2026 bis heute etwa 17 % dieses Volumens aus. Visa zufolge hat die Abwicklung von Stablecoin-Transaktionen kürzlich ein annualisiertes Volumen von 20 Milliarden US-Dollar überschritten.
Zahlungen mit Visa-Stablecoin-Karten im Jahresvergleich um fast 200 % gestiegen
Visa teilte am 1. Oktober mit, dass das Zahlungsvolumen über seine Kartenprogramme mit Stablecoin-Anbindung im Jahresvergleich um fast 200 % gestiegen ist. Inzwischen laufen mehr als 160 Verbraucher- und Geschäftsprogramme über das Netzwerk des Unternehmens. Visa legte den Gesamtbetrag in US-Dollar, der diesem Wachstum zugrunde liegt, nicht offen. Die Mitteilung unterscheidet das Zahlungsvolumen über Karten von Visas Stablecoin-Abwicklungsaktivitäten, die einen anderen Teil des Netzwerks abbilden.
Das Zahlungsvolumen von Visa-Karten mit Stablecoin-Anbindung stieg im Jahresvergleich um fast 200 %, wobei mehr als 160 Programme in Betrieb sind. Geschäftliche und kommerzielle Kartenprogramme machten im laufenden Geschäftsjahr 2026 bis heute etwa 17 % dieses Volumens aus. Visa zufolge hat die Abwicklung von Stablecoin-Transaktionen kürzlich ein annualisiertes Volumen von 20 Milliarden US-Dollar überschritten.
135
·
--
Artikel
More & More wird den Agentic Finance Summit mit Etoro, Pantera Capital und Chainlink ausrichten – während TOKE...BitcoinWorld
More & More wird den Agentic Finance Summit mit etoro, Pantera Capital und Chainlink ausrichten – während TOKEN2049 Singapore
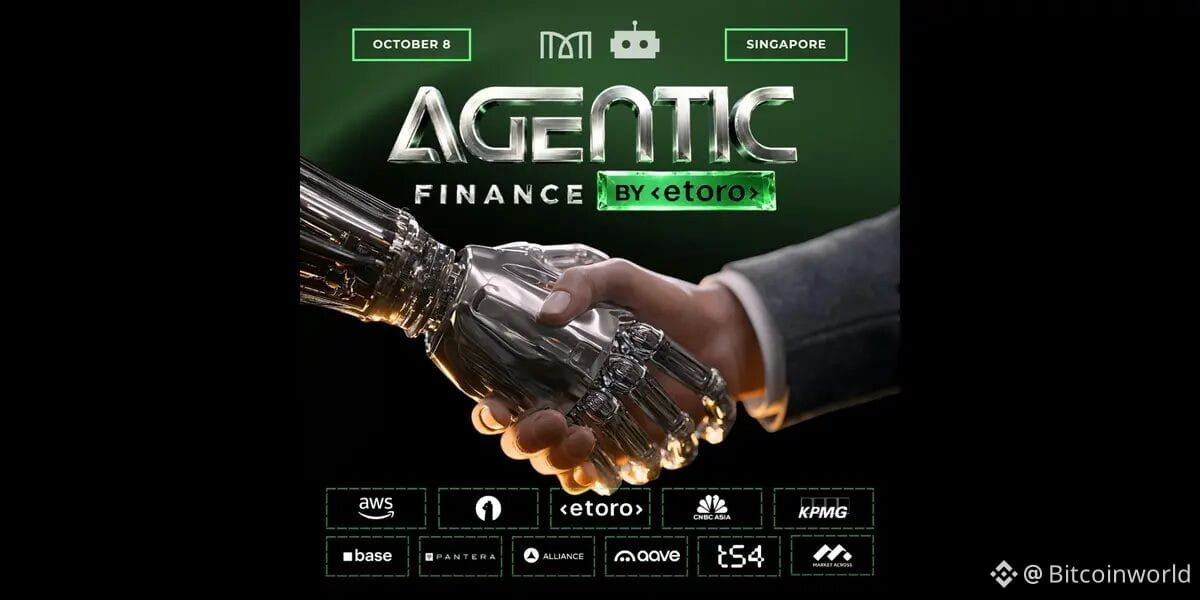
Das exklusive Gipfeltreffen am 8. Oktober bringt 400 Führungskräfte von Banken, Börsen, Zahlungsnetzwerken und Fonds nach Suntec City, um zu untersuchen, wie KI-Agenten in den Handel, die Zahlungsabwicklung und die Compliance Einzug halten.
Singapur, 5. Oktober 2026 — More & More veranstaltet am 8. Oktober 2026 im Suntec Singapore Convention and Exhibition Centre den Agentic Finance Summit, ein offizielles Side-Event von TOKEN2049 Singapore. etoro ist der Lead-Partner des Gipfeltreffens.
More & More wird den Agentic Finance Summit mit Etoro, Pantera Capital und Chainlink ausrichten – während TOKE...
BitcoinWorld
More & More wird den Agentic Finance Summit mit etoro, Pantera Capital und Chainlink ausrichten – während TOKEN2049 Singapore
Das exklusive Gipfeltreffen am 8. Oktober bringt 400 Führungskräfte von Banken, Börsen, Zahlungsnetzwerken und Fonds nach Suntec City, um zu untersuchen, wie KI-Agenten in den Handel, die Zahlungsabwicklung und die Compliance Einzug halten.
Singapur, 5. Oktober 2026 — More & More veranstaltet am 8. Oktober 2026 im Suntec Singapore Convention and Exhibition Centre den Agentic Finance Summit, ein offizielles Side-Event von TOKEN2049 Singapore. etoro ist der Lead-Partner des Gipfeltreffens.
More & More wird den Agentic Finance Summit mit etoro, Pantera Capital und Chainlink ausrichten – während TOKEN2049 Singapore
Das exklusive Gipfeltreffen am 8. Oktober bringt 400 Führungskräfte von Banken, Börsen, Zahlungsnetzwerken und Fonds nach Suntec City, um zu untersuchen, wie KI-Agenten in den Handel, die Zahlungsabwicklung und die Compliance Einzug halten.
Singapur, 5. Oktober 2026 — More & More veranstaltet am 8. Oktober 2026 im Suntec Singapore Convention and Exhibition Centre den Agentic Finance Summit, ein offizielles Side-Event von TOKEN2049 Singapore. etoro ist der Lead-Partner des Gipfeltreffens.
152
·
--
Artikel
Payward und Singapore Gulf Bank schließen Partnerschaft für eine 24/7-Abwicklung an institutionellen Märkten für digitale Vermögenswerte...BitcoinWorld
Payward und Singapore Gulf Bank schließen Partnerschaft für eine 24/7-Abwicklung an institutionellen Märkten für digitale Vermögenswerte
Payward hat SGB Net, das Echtzeit-Clearingnetzwerk der Singapore Gulf Bank, integriert. Dadurch können institutionelle Kunden in Asien und der Golfregion jederzeit sofortige Abwicklungen vornehmen. Außerdem wird SGB Kraken Prime als zusätzliche Quelle für Liquidität bei digitalen Vermögenswerten aufnehmen.
SYDNEY, 5. Okt. 2026 /PRNewswire/ — Payward, die einheitliche Finanzinfrastrukturplattform hinter Kraken, und die Singapore Gulf Bank (SGB), eine voll lizenzierte Digitalbank unter der Aufsicht der Zentralbank von Bahrain, gaben heute eine strategische Partnerschaft bekannt, um eine durchgehende Abwicklung für institutionelle Märkte für digitale Vermögenswerte bereitzustellen, zunächst jedoch nur in bestimmten Rechtsgebieten.
Payward und Singapore Gulf Bank schließen Partnerschaft für eine 24/7-Abwicklung an institutionellen Märkten für digitale Vermögenswerte...
BitcoinWorld
Payward und Singapore Gulf Bank schließen Partnerschaft für eine 24/7-Abwicklung an institutionellen Märkten für digitale Vermögenswerte
Payward hat SGB Net, das Echtzeit-Clearingnetzwerk der Singapore Gulf Bank, integriert. Dadurch können institutionelle Kunden in Asien und der Golfregion jederzeit sofortige Abwicklungen vornehmen. Außerdem wird SGB Kraken Prime als zusätzliche Quelle für Liquidität bei digitalen Vermögenswerten aufnehmen.
SYDNEY, 5. Okt. 2026 /PRNewswire/ — Payward, die einheitliche Finanzinfrastrukturplattform hinter Kraken, und die Singapore Gulf Bank (SGB), eine voll lizenzierte Digitalbank unter der Aufsicht der Zentralbank von Bahrain, gaben heute eine strategische Partnerschaft bekannt, um eine durchgehende Abwicklung für institutionelle Märkte für digitale Vermögenswerte bereitzustellen, zunächst jedoch nur in bestimmten Rechtsgebieten.
Payward und Singapore Gulf Bank schließen Partnerschaft für eine 24/7-Abwicklung an institutionellen Märkten für digitale Vermögenswerte
Payward hat SGB Net, das Echtzeit-Clearingnetzwerk der Singapore Gulf Bank, integriert. Dadurch können institutionelle Kunden in Asien und der Golfregion jederzeit sofortige Abwicklungen vornehmen. Außerdem wird SGB Kraken Prime als zusätzliche Quelle für Liquidität bei digitalen Vermögenswerten aufnehmen.
SYDNEY, 5. Okt. 2026 /PRNewswire/ — Payward, die einheitliche Finanzinfrastrukturplattform hinter Kraken, und die Singapore Gulf Bank (SGB), eine voll lizenzierte Digitalbank unter der Aufsicht der Zentralbank von Bahrain, gaben heute eine strategische Partnerschaft bekannt, um eine durchgehende Abwicklung für institutionelle Märkte für digitale Vermögenswerte bereitzustellen, zunächst jedoch nur in bestimmten Rechtsgebieten.
88
·
--
Artikel
Kryptohandelsvolumen in Südkorea sinkt innerhalb einer Woche um 19,56 %BitcoinWorld
Kryptohandelsvolumen in Südkorea sinkt innerhalb einer Woche um 19,56 %
Das kombinierte Handelsvolumen an den fünf größten Kryptobörsen Südkoreas sank in der Woche bis zum 2. Oktober auf rund 20,5 Billionen Won beziehungsweise etwa 15,1 Milliarden US-Dollar. Das entspricht einem Rückgang von 19,56 % gegenüber der Vorwoche, wie Crypto.news unter Berufung auf Daten von Digital Asset berichtet. Im siebentägigen Zeitraum bis zum 2. Oktober um 14 Uhr koreanischer Standardzeit ging das Handelsvolumen um rund 5 Billionen Won beziehungsweise etwa 3,7 Milliarden US-Dollar zurück.
An den fünf größten Börsen Südkoreas wurden in der Woche bis zum 2. Oktober Kryptowährungen im Wert von rund 20,5 Billionen Won gehandelt – ein Rückgang von 19,56 % gegenüber der Vorwoche. Der Wochenrückgang folgte auf Regierungsdaten, denen zufolge das durchschnittliche tägliche Handelsvolumen an den Börsen des Landes in der ersten Hälfte des Jahres 2026 um 44 % sank und der Betriebsgewinn um 78 % zurückging.
Kryptohandelsvolumen in Südkorea sinkt innerhalb einer Woche um 19,56 %
BitcoinWorld
Kryptohandelsvolumen in Südkorea sinkt innerhalb einer Woche um 19,56 %
Das kombinierte Handelsvolumen an den fünf größten Kryptobörsen Südkoreas sank in der Woche bis zum 2. Oktober auf rund 20,5 Billionen Won beziehungsweise etwa 15,1 Milliarden US-Dollar. Das entspricht einem Rückgang von 19,56 % gegenüber der Vorwoche, wie Crypto.news unter Berufung auf Daten von Digital Asset berichtet. Im siebentägigen Zeitraum bis zum 2. Oktober um 14 Uhr koreanischer Standardzeit ging das Handelsvolumen um rund 5 Billionen Won beziehungsweise etwa 3,7 Milliarden US-Dollar zurück.
An den fünf größten Börsen Südkoreas wurden in der Woche bis zum 2. Oktober Kryptowährungen im Wert von rund 20,5 Billionen Won gehandelt – ein Rückgang von 19,56 % gegenüber der Vorwoche. Der Wochenrückgang folgte auf Regierungsdaten, denen zufolge das durchschnittliche tägliche Handelsvolumen an den Börsen des Landes in der ersten Hälfte des Jahres 2026 um 44 % sank und der Betriebsgewinn um 78 % zurückging.
Kryptohandelsvolumen in Südkorea sinkt innerhalb einer Woche um 19,56 %
Das kombinierte Handelsvolumen an den fünf größten Kryptobörsen Südkoreas sank in der Woche bis zum 2. Oktober auf rund 20,5 Billionen Won beziehungsweise etwa 15,1 Milliarden US-Dollar. Das entspricht einem Rückgang von 19,56 % gegenüber der Vorwoche, wie Crypto.news unter Berufung auf Daten von Digital Asset berichtet. Im siebentägigen Zeitraum bis zum 2. Oktober um 14 Uhr koreanischer Standardzeit ging das Handelsvolumen um rund 5 Billionen Won beziehungsweise etwa 3,7 Milliarden US-Dollar zurück.
An den fünf größten Börsen Südkoreas wurden in der Woche bis zum 2. Oktober Kryptowährungen im Wert von rund 20,5 Billionen Won gehandelt – ein Rückgang von 19,56 % gegenüber der Vorwoche. Der Wochenrückgang folgte auf Regierungsdaten, denen zufolge das durchschnittliche tägliche Handelsvolumen an den Börsen des Landes in der ersten Hälfte des Jahres 2026 um 44 % sank und der Betriebsgewinn um 78 % zurückging.
219
·
--
Verifiziert

Artikel
OpenPayd Zielt Auf Nasdaq-Notierung Bis Jahresende Unter Ticker OPBitcoinWorld
OpenPayd zielt auf eine Nasdaq-Listung bis Jahresende unter dem Ticker OP
OpenPayd, das in London ansässige Unternehmen für Stablecoin-Zahlungsinfrastruktur, rechnet damit, seine Fusion mit Titan Acquisition Corp. abzuschließen und bis Ende 2026 an der Nasdaq unter dem Ticker OP zu notieren, so Crypto.news. Die Transaktion, die mit rund 1,1 Milliarden US-Dollar beziffert wurde, würde dem fusionierten Unternehmen einen implizierten Pro-Forma-Eigenkapitalwert von bis zu 1,145 Milliarden US-Dollar verleihen.
OpenPayd plant, seine Fusion mit Titan Acquisition Corp. abzuschließen und bis Ende 2026 an der Nasdaq unter OP zu listen. Dabei wird das fusionierte Unternehmen mit einem Wert von bis zu 1,145 Milliarden US-Dollar bewertet. Das Unternehmen für Stablecoin-Zahlungen will bis April 2027 US-Dienste auf den Markt bringen, unter Nutzung von 43 im September erworbenen Money-Transmitter-Lizenzen.
OpenPayd Zielt Auf Nasdaq-Notierung Bis Jahresende Unter Ticker OP
BitcoinWorld
OpenPayd zielt auf eine Nasdaq-Listung bis Jahresende unter dem Ticker OP
OpenPayd, das in London ansässige Unternehmen für Stablecoin-Zahlungsinfrastruktur, rechnet damit, seine Fusion mit Titan Acquisition Corp. abzuschließen und bis Ende 2026 an der Nasdaq unter dem Ticker OP zu notieren, so Crypto.news. Die Transaktion, die mit rund 1,1 Milliarden US-Dollar beziffert wurde, würde dem fusionierten Unternehmen einen implizierten Pro-Forma-Eigenkapitalwert von bis zu 1,145 Milliarden US-Dollar verleihen.
OpenPayd plant, seine Fusion mit Titan Acquisition Corp. abzuschließen und bis Ende 2026 an der Nasdaq unter OP zu listen. Dabei wird das fusionierte Unternehmen mit einem Wert von bis zu 1,145 Milliarden US-Dollar bewertet. Das Unternehmen für Stablecoin-Zahlungen will bis April 2027 US-Dienste auf den Markt bringen, unter Nutzung von 43 im September erworbenen Money-Transmitter-Lizenzen.
OpenPayd zielt auf eine Nasdaq-Listung bis Jahresende unter dem Ticker OP
OpenPayd, das in London ansässige Unternehmen für Stablecoin-Zahlungsinfrastruktur, rechnet damit, seine Fusion mit Titan Acquisition Corp. abzuschließen und bis Ende 2026 an der Nasdaq unter dem Ticker OP zu notieren, so Crypto.news. Die Transaktion, die mit rund 1,1 Milliarden US-Dollar beziffert wurde, würde dem fusionierten Unternehmen einen implizierten Pro-Forma-Eigenkapitalwert von bis zu 1,145 Milliarden US-Dollar verleihen.
OpenPayd plant, seine Fusion mit Titan Acquisition Corp. abzuschließen und bis Ende 2026 an der Nasdaq unter OP zu listen. Dabei wird das fusionierte Unternehmen mit einem Wert von bis zu 1,145 Milliarden US-Dollar bewertet. Das Unternehmen für Stablecoin-Zahlungen will bis April 2027 US-Dienste auf den Markt bringen, unter Nutzung von 43 im September erworbenen Money-Transmitter-Lizenzen.
1
3
779
·
--

Artikel
Lloyds-Umfrage: 71 % der Führungskräfte im Finanzsektor erwarten einen Wandel durch TokenisierungBitcoinWorld
Lloyds-Umfrage: 71 % der Führungskräfte im Finanzsektor des Vereinigten Königreichs erwarten einen Wandel durch Tokenisierung
Fast drei Viertel der leitenden Entscheidungsträger großer britischer Finanzinstitute glauben, dass die Tokenisierung die Finanzdienstleistungen neu gestalten wird. Das geht aus einer jährlichen Umfrage der Lloyds Banking Group hervor, die am 2. Oktober 2026 veröffentlicht wurde. Die Befragung von 100 Führungskräften in Banken, Versicherungen, Asset-Managern und Finanzsponsoren ergab, dass 71 % erwarten, dass die blockchainbasierte Darstellung von Vermögenswerten wie Bargeld, Anleihen und Fonds verändern wird, wie die Branche funktioniert – wie Cointelegraph berichtete.
Lloyds-Umfrage: 71 % der Führungskräfte im Finanzsektor erwarten einen Wandel durch Tokenisierung
BitcoinWorld
Lloyds-Umfrage: 71 % der Führungskräfte im Finanzsektor des Vereinigten Königreichs erwarten einen Wandel durch Tokenisierung
Fast drei Viertel der leitenden Entscheidungsträger großer britischer Finanzinstitute glauben, dass die Tokenisierung die Finanzdienstleistungen neu gestalten wird. Das geht aus einer jährlichen Umfrage der Lloyds Banking Group hervor, die am 2. Oktober 2026 veröffentlicht wurde. Die Befragung von 100 Führungskräften in Banken, Versicherungen, Asset-Managern und Finanzsponsoren ergab, dass 71 % erwarten, dass die blockchainbasierte Darstellung von Vermögenswerten wie Bargeld, Anleihen und Fonds verändern wird, wie die Branche funktioniert – wie Cointelegraph berichtete.
Lloyds-Umfrage: 71 % der Führungskräfte im Finanzsektor des Vereinigten Königreichs erwarten einen Wandel durch Tokenisierung
Fast drei Viertel der leitenden Entscheidungsträger großer britischer Finanzinstitute glauben, dass die Tokenisierung die Finanzdienstleistungen neu gestalten wird. Das geht aus einer jährlichen Umfrage der Lloyds Banking Group hervor, die am 2. Oktober 2026 veröffentlicht wurde. Die Befragung von 100 Führungskräften in Banken, Versicherungen, Asset-Managern und Finanzsponsoren ergab, dass 71 % erwarten, dass die blockchainbasierte Darstellung von Vermögenswerten wie Bargeld, Anleihen und Fonds verändern wird, wie die Branche funktioniert – wie Cointelegraph berichtete.
256
·
--

Artikel
Chainalysis AI verfolgt den Bitget-Hack über 387 Mio. US-Dollar auf Nordkorea zurückBitcoinWorld
Chainalysis AI verfolgt den Bitget-Hack über 387 Mio. US-Dollar auf Akteure mit Verbindung zu Nordkorea zurück
Die Blockchain-Analysefirma Chainalysis hat den Hack an der Bitget-Börse in Höhe von 387 Millionen US-Dollar Akteuren zugeschrieben, die mit Nordkorea in Verbindung stehen. Dadurch stieg die gesamte Summe der Krypto-Diebstähle des Landes für 2026 auf über 1 Milliarde US-Dollar, wie aus einem am Mittwoch veröffentlichten Bericht hervorgeht, der von Decrypt aufgegriffen wurde. Der Einbruch am 24. September führte dazu, dass 387 Millionen US-Dollar in 23 Überweisungen über vier Blockchains innerhalb von drei Stunden von Bitget abflossen. Chainalysis erklärte, dass es mithilfe einer eigenen KI das Nachverfolgen beschleunigt habe und die Zeit, die es für die manuelle Abstimmung von Brücken schätzungsweise für mehr als 20 Stunden benötigt hätte, auf unter 10 Minuten verkürzt habe.
Chainalysis AI verfolgt den Bitget-Hack über 387 Mio. US-Dollar auf Nordkorea zurück
BitcoinWorld
Chainalysis AI verfolgt den Bitget-Hack über 387 Mio. US-Dollar auf Akteure mit Verbindung zu Nordkorea zurück
Die Blockchain-Analysefirma Chainalysis hat den Hack an der Bitget-Börse in Höhe von 387 Millionen US-Dollar Akteuren zugeschrieben, die mit Nordkorea in Verbindung stehen. Dadurch stieg die gesamte Summe der Krypto-Diebstähle des Landes für 2026 auf über 1 Milliarde US-Dollar, wie aus einem am Mittwoch veröffentlichten Bericht hervorgeht, der von Decrypt aufgegriffen wurde. Der Einbruch am 24. September führte dazu, dass 387 Millionen US-Dollar in 23 Überweisungen über vier Blockchains innerhalb von drei Stunden von Bitget abflossen. Chainalysis erklärte, dass es mithilfe einer eigenen KI das Nachverfolgen beschleunigt habe und die Zeit, die es für die manuelle Abstimmung von Brücken schätzungsweise für mehr als 20 Stunden benötigt hätte, auf unter 10 Minuten verkürzt habe.
Chainalysis AI verfolgt den Bitget-Hack über 387 Mio. US-Dollar auf Akteure mit Verbindung zu Nordkorea zurück
Die Blockchain-Analysefirma Chainalysis hat den Hack an der Bitget-Börse in Höhe von 387 Millionen US-Dollar Akteuren zugeschrieben, die mit Nordkorea in Verbindung stehen. Dadurch stieg die gesamte Summe der Krypto-Diebstähle des Landes für 2026 auf über 1 Milliarde US-Dollar, wie aus einem am Mittwoch veröffentlichten Bericht hervorgeht, der von Decrypt aufgegriffen wurde. Der Einbruch am 24. September führte dazu, dass 387 Millionen US-Dollar in 23 Überweisungen über vier Blockchains innerhalb von drei Stunden von Bitget abflossen. Chainalysis erklärte, dass es mithilfe einer eigenen KI das Nachverfolgen beschleunigt habe und die Zeit, die es für die manuelle Abstimmung von Brücken schätzungsweise für mehr als 20 Stunden benötigt hätte, auf unter 10 Minuten verkürzt habe.
1
2
286
·
--
Artikel
Bitcoin stürzt unter 84.000 US-Dollar ab, während sich die Liquidationen $600M nähernBitcoinWorld
Bitcoin stürzt unter 84.000 US-Dollar ab, während Liquidationen sich $600M nähern
Bitcoin fiel am 2. Oktober 2026 unter 84.000 US-Dollar, Stunden nachdem es erstmals seit etwa zehn Tagen kurz die Marke von 87.000 US-Dollar übertroffen hatte, so Cryptopotato. Die scharfe Kehrtwende löste eine Welle von Zwangsverkäufen aus, die die gesamten Krypto-Liquidationen innerhalb von 24 Stunden auf über 570 Millionen US-Dollar trieben; davon wurden 186 Millionen US-Dollar in einer einzigen Stunde liquidiert.
Bitcoin stürzte am 2. Oktober unter 84.000 US-Dollar ab, nachdem ein gescheiterter Anstieg über 87.000 US-Dollar ausblieb, was zu über 570 Millionen US-Dollar an Krypto-Liquidationen führte. Long-Positionen machten 99 % der in der vergangenen Stunde liquidierten 186 Millionen US-Dollar aus, laut CoinGlass-Daten, die von Cryptopotato zitiert wurden.
Bitcoin stürzt unter 84.000 US-Dollar ab, während sich die Liquidationen $600M nähern
BitcoinWorld
Bitcoin stürzt unter 84.000 US-Dollar ab, während Liquidationen sich $600M nähern
Bitcoin fiel am 2. Oktober 2026 unter 84.000 US-Dollar, Stunden nachdem es erstmals seit etwa zehn Tagen kurz die Marke von 87.000 US-Dollar übertroffen hatte, so Cryptopotato. Die scharfe Kehrtwende löste eine Welle von Zwangsverkäufen aus, die die gesamten Krypto-Liquidationen innerhalb von 24 Stunden auf über 570 Millionen US-Dollar trieben; davon wurden 186 Millionen US-Dollar in einer einzigen Stunde liquidiert.
Bitcoin stürzte am 2. Oktober unter 84.000 US-Dollar ab, nachdem ein gescheiterter Anstieg über 87.000 US-Dollar ausblieb, was zu über 570 Millionen US-Dollar an Krypto-Liquidationen führte. Long-Positionen machten 99 % der in der vergangenen Stunde liquidierten 186 Millionen US-Dollar aus, laut CoinGlass-Daten, die von Cryptopotato zitiert wurden.
Bitcoin stürzt unter 84.000 US-Dollar ab, während Liquidationen sich $600M nähern
Bitcoin fiel am 2. Oktober 2026 unter 84.000 US-Dollar, Stunden nachdem es erstmals seit etwa zehn Tagen kurz die Marke von 87.000 US-Dollar übertroffen hatte, so Cryptopotato. Die scharfe Kehrtwende löste eine Welle von Zwangsverkäufen aus, die die gesamten Krypto-Liquidationen innerhalb von 24 Stunden auf über 570 Millionen US-Dollar trieben; davon wurden 186 Millionen US-Dollar in einer einzigen Stunde liquidiert.
Bitcoin stürzte am 2. Oktober unter 84.000 US-Dollar ab, nachdem ein gescheiterter Anstieg über 87.000 US-Dollar ausblieb, was zu über 570 Millionen US-Dollar an Krypto-Liquidationen führte. Long-Positionen machten 99 % der in der vergangenen Stunde liquidierten 186 Millionen US-Dollar aus, laut CoinGlass-Daten, die von Cryptopotato zitiert wurden.
1
254
·
--
Artikel
Blast schaltet Layer 2 ab, da die Kosten die Einnahmen übertreffen, und setzt Frist bis zum 26. Okt.BitcoinWorld
Blast schließt Layer 2, wenn die Kosten die Einnahmen übersteigen, und setzt Frist bis zum 26. Okt.
Blast wird sein Ethereum-Layer-2-Netzwerk schließen, nachdem festgestellt wurde, dass die Kosten für den Betrieb der Kette höher sind als das, was sie einbringt, so das Projekt in einer Ankündigung vom 2. Oktober auf X. Nutzer haben bis zum 26. Okt. 2026 Zeit, um über die normale Oberfläche von Blast abzuheben, laut Crypto.news.
Blast fährt sein Ethereum-Layer-2-Netzwerk herunter, weil die Kosten für die Netzwerkwartung die Einnahmen überstiegen, die die Layer-2-Operationen generierten. Nutzer müssen bis zum 26. Okt. 2026 über die Standardoberfläche abziehen; danach sind die Vermögenswerte nur noch durch die direkte Interaktion mit den Bridge-Verträgen von Blast im Ethereum-Mainnet wiederherstellbar.
Blast schaltet Layer 2 ab, da die Kosten die Einnahmen übertreffen, und setzt Frist bis zum 26. Okt.
BitcoinWorld
Blast schließt Layer 2, wenn die Kosten die Einnahmen übersteigen, und setzt Frist bis zum 26. Okt.
Blast wird sein Ethereum-Layer-2-Netzwerk schließen, nachdem festgestellt wurde, dass die Kosten für den Betrieb der Kette höher sind als das, was sie einbringt, so das Projekt in einer Ankündigung vom 2. Oktober auf X. Nutzer haben bis zum 26. Okt. 2026 Zeit, um über die normale Oberfläche von Blast abzuheben, laut Crypto.news.
Blast fährt sein Ethereum-Layer-2-Netzwerk herunter, weil die Kosten für die Netzwerkwartung die Einnahmen überstiegen, die die Layer-2-Operationen generierten. Nutzer müssen bis zum 26. Okt. 2026 über die Standardoberfläche abziehen; danach sind die Vermögenswerte nur noch durch die direkte Interaktion mit den Bridge-Verträgen von Blast im Ethereum-Mainnet wiederherstellbar.
Blast schließt Layer 2, wenn die Kosten die Einnahmen übersteigen, und setzt Frist bis zum 26. Okt.
Blast wird sein Ethereum-Layer-2-Netzwerk schließen, nachdem festgestellt wurde, dass die Kosten für den Betrieb der Kette höher sind als das, was sie einbringt, so das Projekt in einer Ankündigung vom 2. Oktober auf X. Nutzer haben bis zum 26. Okt. 2026 Zeit, um über die normale Oberfläche von Blast abzuheben, laut Crypto.news.
Blast fährt sein Ethereum-Layer-2-Netzwerk herunter, weil die Kosten für die Netzwerkwartung die Einnahmen überstiegen, die die Layer-2-Operationen generierten. Nutzer müssen bis zum 26. Okt. 2026 über die Standardoberfläche abziehen; danach sind die Vermögenswerte nur noch durch die direkte Interaktion mit den Bridge-Verträgen von Blast im Ethereum-Mainnet wiederherstellbar.
215
·
--
Artikel
Kraken-Mutter Payward im Gespräch mit BNY über Krypto-PartnerschaftBitcoinWorld
Kraken-Mutter Payward im Gespräch mit BNY über eine Krypto-Partnerschaft
Payward, das Mutterunternehmen der Krypto-Börse Kraken, hat Gespräche mit BNY über eine mögliche Partnerschaft aufgenommen, die sich über sechs Geschäftsbereiche erstreckt, darunter Krypto-Custody, Handel und Zahlungen, wie Crypto.news berichtet. Zwei mit den Gesprächen vertraute Personen, die anonym sprachen, weil die Verhandlungen privat sind, sagten, dass keine Einigung garantiert sei.
Payward und BNY diskutieren eine mögliche Partnerschaft, die Krypto-Produkte, Verwahrung (Custody), Vermögensverwaltung, Handel, Zahlungen und finanzielle Infrastruktur umfasst. Die Gespräche wurden erstmals von Crypto.news am 2. Oktober 2026 gemeldet, während PANews am 3. Oktober über dieselben Gespräche berichtete. Die Verhandlungen dauern an, und es wurde kein Deal bestätigt.
Kraken-Mutter Payward im Gespräch mit BNY über Krypto-Partnerschaft
BitcoinWorld
Kraken-Mutter Payward im Gespräch mit BNY über eine Krypto-Partnerschaft
Payward, das Mutterunternehmen der Krypto-Börse Kraken, hat Gespräche mit BNY über eine mögliche Partnerschaft aufgenommen, die sich über sechs Geschäftsbereiche erstreckt, darunter Krypto-Custody, Handel und Zahlungen, wie Crypto.news berichtet. Zwei mit den Gesprächen vertraute Personen, die anonym sprachen, weil die Verhandlungen privat sind, sagten, dass keine Einigung garantiert sei.
Payward und BNY diskutieren eine mögliche Partnerschaft, die Krypto-Produkte, Verwahrung (Custody), Vermögensverwaltung, Handel, Zahlungen und finanzielle Infrastruktur umfasst. Die Gespräche wurden erstmals von Crypto.news am 2. Oktober 2026 gemeldet, während PANews am 3. Oktober über dieselben Gespräche berichtete. Die Verhandlungen dauern an, und es wurde kein Deal bestätigt.
Kraken-Mutter Payward im Gespräch mit BNY über eine Krypto-Partnerschaft
Payward, das Mutterunternehmen der Krypto-Börse Kraken, hat Gespräche mit BNY über eine mögliche Partnerschaft aufgenommen, die sich über sechs Geschäftsbereiche erstreckt, darunter Krypto-Custody, Handel und Zahlungen, wie Crypto.news berichtet. Zwei mit den Gesprächen vertraute Personen, die anonym sprachen, weil die Verhandlungen privat sind, sagten, dass keine Einigung garantiert sei.
Payward und BNY diskutieren eine mögliche Partnerschaft, die Krypto-Produkte, Verwahrung (Custody), Vermögensverwaltung, Handel, Zahlungen und finanzielle Infrastruktur umfasst. Die Gespräche wurden erstmals von Crypto.news am 2. Oktober 2026 gemeldet, während PANews am 3. Oktober über dieselben Gespräche berichtete. Die Verhandlungen dauern an, und es wurde kein Deal bestätigt.
156
·
--
Artikel
SEC schlägt Regeln zur Krypto-Verwahrung für Berater und Fonds vorBitcoinWorld
SEC schlägt Regeln zur Krypto-Verwahrung für Berater und Fonds vor
Die US-Börsenaufsicht SEC hat neue Regeln vorgeschlagen, die regeln sollen, wie registrierte Anlageberater und regulierte Fonds Kryptowerte verwahren. Dies ist ein Vorhaben, das der Vorsitzende Paul Atkins als Ersatz für „den grauen Schleier der Unsicherheit“ bezeichnete, der durch Verwahrvorschriften entstanden sei, die für eine längst vergangene Ära ausgearbeitet wurden, wie Cryptopotato berichtet. Der Vorschlag, der unter dem Investment Advisers Act von 1940 und dem Investment Company Act von 1940 erlassen wurde, soll klarstellen, welche Vorkehrungen die Anforderungen an den „qualified custodian“-Standard erfüllen, der seit langem viele Unternehmen davon abhält, überhaupt digitale-Asset-Strategien anzubieten.
SEC schlägt Regeln zur Krypto-Verwahrung für Berater und Fonds vor
BitcoinWorld
SEC schlägt Regeln zur Krypto-Verwahrung für Berater und Fonds vor
Die US-Börsenaufsicht SEC hat neue Regeln vorgeschlagen, die regeln sollen, wie registrierte Anlageberater und regulierte Fonds Kryptowerte verwahren. Dies ist ein Vorhaben, das der Vorsitzende Paul Atkins als Ersatz für „den grauen Schleier der Unsicherheit“ bezeichnete, der durch Verwahrvorschriften entstanden sei, die für eine längst vergangene Ära ausgearbeitet wurden, wie Cryptopotato berichtet. Der Vorschlag, der unter dem Investment Advisers Act von 1940 und dem Investment Company Act von 1940 erlassen wurde, soll klarstellen, welche Vorkehrungen die Anforderungen an den „qualified custodian“-Standard erfüllen, der seit langem viele Unternehmen davon abhält, überhaupt digitale-Asset-Strategien anzubieten.
SEC schlägt Regeln zur Krypto-Verwahrung für Berater und Fonds vor
Die US-Börsenaufsicht SEC hat neue Regeln vorgeschlagen, die regeln sollen, wie registrierte Anlageberater und regulierte Fonds Kryptowerte verwahren. Dies ist ein Vorhaben, das der Vorsitzende Paul Atkins als Ersatz für „den grauen Schleier der Unsicherheit“ bezeichnete, der durch Verwahrvorschriften entstanden sei, die für eine längst vergangene Ära ausgearbeitet wurden, wie Cryptopotato berichtet. Der Vorschlag, der unter dem Investment Advisers Act von 1940 und dem Investment Company Act von 1940 erlassen wurde, soll klarstellen, welche Vorkehrungen die Anforderungen an den „qualified custodian“-Standard erfüllen, der seit langem viele Unternehmen davon abhält, überhaupt digitale-Asset-Strategien anzubieten.
2
174
·
--
Artikel
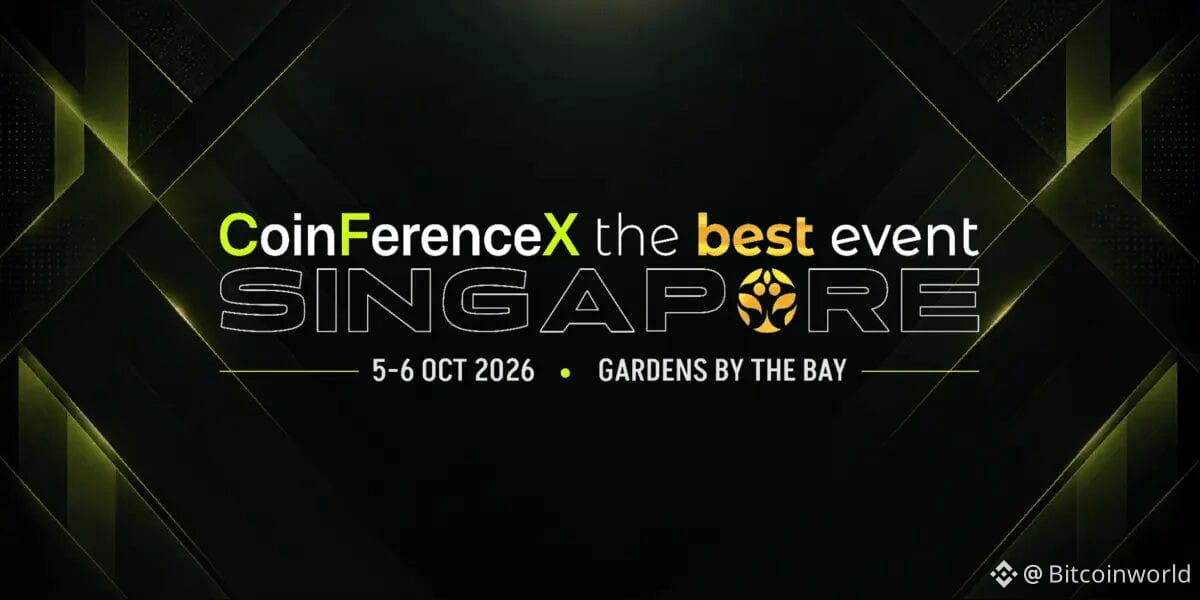
Das größte Lineup von Token Week ist da: Arthur Hayes, Raoul Pal sind die Headliner bei CoinFerenceX The Best ...BitcoinWorld
Das größte Lineup von Token Week ist da: Arthur Hayes, Raoul Pal sind die Headliner bei CoinFerenceX The Best Event Singapore 2026
SINGAPUR, 1. Oktober 2026 – Die größte Speaker-Lineup von Token Week kommt in die Gardens by the Bay. CoinFerenceX The Best Event Singapore 2026 bringt mehr als 85 Sprecher in die Flower Field Hall am 5.–6. Oktober für zwei Tage mit Keynotes, Panels und Fireside Chats während der TOKEN2049-Woche.
Der Gipfel wird von Arthur Hayes, CIO von Maelstrom, angeführt; Raoul Pal, Mitbegründer und CEO von Real Vision; Yat Siu, Mitbegründer und Executive Chairman von Animoca Brands; Sandeep Nailwal, Mitbegründer und CEO von Polygon; sowie Andrei Grachev, Managing Partner von DWF Labs. Sie werden von leitenden Führungskräften von Binance, Coinbase, Crypto.com, BNB Chain, MEXC, Gate, BingX, KuCoin, CertiK, Hacken, MetaMask, Base, Berachain und Spartan Group begleitet.
Das größte Lineup von Token Week ist da: Arthur Hayes, Raoul Pal sind die Headliner bei CoinFerenceX The Best ...
BitcoinWorld
Das größte Lineup von Token Week ist da: Arthur Hayes, Raoul Pal sind die Headliner bei CoinFerenceX The Best Event Singapore 2026
SINGAPUR, 1. Oktober 2026 – Die größte Speaker-Lineup von Token Week kommt in die Gardens by the Bay. CoinFerenceX The Best Event Singapore 2026 bringt mehr als 85 Sprecher in die Flower Field Hall am 5.–6. Oktober für zwei Tage mit Keynotes, Panels und Fireside Chats während der TOKEN2049-Woche.
Der Gipfel wird von Arthur Hayes, CIO von Maelstrom, angeführt; Raoul Pal, Mitbegründer und CEO von Real Vision; Yat Siu, Mitbegründer und Executive Chairman von Animoca Brands; Sandeep Nailwal, Mitbegründer und CEO von Polygon; sowie Andrei Grachev, Managing Partner von DWF Labs. Sie werden von leitenden Führungskräften von Binance, Coinbase, Crypto.com, BNB Chain, MEXC, Gate, BingX, KuCoin, CertiK, Hacken, MetaMask, Base, Berachain und Spartan Group begleitet.
Das größte Lineup von Token Week ist da: Arthur Hayes, Raoul Pal sind die Headliner bei CoinFerenceX The Best Event Singapore 2026
SINGAPUR, 1. Oktober 2026 – Die größte Speaker-Lineup von Token Week kommt in die Gardens by the Bay. CoinFerenceX The Best Event Singapore 2026 bringt mehr als 85 Sprecher in die Flower Field Hall am 5.–6. Oktober für zwei Tage mit Keynotes, Panels und Fireside Chats während der TOKEN2049-Woche.
Der Gipfel wird von Arthur Hayes, CIO von Maelstrom, angeführt; Raoul Pal, Mitbegründer und CEO von Real Vision; Yat Siu, Mitbegründer und Executive Chairman von Animoca Brands; Sandeep Nailwal, Mitbegründer und CEO von Polygon; sowie Andrei Grachev, Managing Partner von DWF Labs. Sie werden von leitenden Führungskräften von Binance, Coinbase, Crypto.com, BNB Chain, MEXC, Gate, BingX, KuCoin, CertiK, Hacken, MetaMask, Base, Berachain und Spartan Group begleitet.
151
·
--
Artikel
Circle bittet die EU, die MiCA-Bankeinlagenregel für Stablecoins fallen zu lassenBitcoinWorld
Circle bittet die EU, die MiCA-Bankeinlagenregel für Stablecoins fallen zu lassen
Circle hat die Europäische Kommission aufgefordert, die Reserve-Regeln im Mittelpunkt der EU-Verordnung über Märkte für Krypto-Assets zu überarbeiten. Dabei teilte das Unternehmen Brüssel mit, dass ein festes Mandat für Bankeinlagen Emittenten von Stablecoins stärker dem Bankensystem aussetze – nicht weniger. Der USDC-Emittent reichte seine Antwort auf die MiCA-Konsultation der Kommission am Donnerstag, 2. Oktober, ein, wie Decrypt berichtet.
Circle möchte, dass die Europäische Kommission die Anforderung aus MiCA ersetzt, wonach Emittenten von Stablecoins mindestens 30 % der Reserven in Einlagen bei Geschäftsbanken halten müssen – mit einer Anhebung auf 60 % für Token, die als bedeutend eingestuft werden –, durch liquiditätsbasierte Anforderungen. Das Unternehmen forderte die EU außerdem auf, die Mehrfach-Emission beizubehalten, und warnte, dass eine Einschränkung diese Aktivität ins Ausland verlagern würde.
Circle bittet die EU, die MiCA-Bankeinlagenregel für Stablecoins fallen zu lassen
BitcoinWorld
Circle bittet die EU, die MiCA-Bankeinlagenregel für Stablecoins fallen zu lassen
Circle hat die Europäische Kommission aufgefordert, die Reserve-Regeln im Mittelpunkt der EU-Verordnung über Märkte für Krypto-Assets zu überarbeiten. Dabei teilte das Unternehmen Brüssel mit, dass ein festes Mandat für Bankeinlagen Emittenten von Stablecoins stärker dem Bankensystem aussetze – nicht weniger. Der USDC-Emittent reichte seine Antwort auf die MiCA-Konsultation der Kommission am Donnerstag, 2. Oktober, ein, wie Decrypt berichtet.
Circle möchte, dass die Europäische Kommission die Anforderung aus MiCA ersetzt, wonach Emittenten von Stablecoins mindestens 30 % der Reserven in Einlagen bei Geschäftsbanken halten müssen – mit einer Anhebung auf 60 % für Token, die als bedeutend eingestuft werden –, durch liquiditätsbasierte Anforderungen. Das Unternehmen forderte die EU außerdem auf, die Mehrfach-Emission beizubehalten, und warnte, dass eine Einschränkung diese Aktivität ins Ausland verlagern würde.
Circle bittet die EU, die MiCA-Bankeinlagenregel für Stablecoins fallen zu lassen
Circle hat die Europäische Kommission aufgefordert, die Reserve-Regeln im Mittelpunkt der EU-Verordnung über Märkte für Krypto-Assets zu überarbeiten. Dabei teilte das Unternehmen Brüssel mit, dass ein festes Mandat für Bankeinlagen Emittenten von Stablecoins stärker dem Bankensystem aussetze – nicht weniger. Der USDC-Emittent reichte seine Antwort auf die MiCA-Konsultation der Kommission am Donnerstag, 2. Oktober, ein, wie Decrypt berichtet.
Circle möchte, dass die Europäische Kommission die Anforderung aus MiCA ersetzt, wonach Emittenten von Stablecoins mindestens 30 % der Reserven in Einlagen bei Geschäftsbanken halten müssen – mit einer Anhebung auf 60 % für Token, die als bedeutend eingestuft werden –, durch liquiditätsbasierte Anforderungen. Das Unternehmen forderte die EU außerdem auf, die Mehrfach-Emission beizubehalten, und warnte, dass eine Einschränkung diese Aktivität ins Ausland verlagern würde.
800
·
--

Artikel
THORChain eröffnet Zcash-Pool; ZEC-Swaps noch nicht liveBitcoinWorld
THORChain eröffnet Zcash-Pool; ZEC-Swaps noch nicht live
THORChain hat am 2. Okt. 2026 einen Liquiditätspool für Zcash (ZEC) aktiviert – nur wenige Stunden nachdem es einen Node-Churn abgeschlossen hatte, bei dem jeder Knoten damit begonnen hat, die Zcash-Blockchain zu beobachten. Das Protokoll sagte, der Pool sei live, aber der „Handel ist der nächste Schritt“, und nannte keinen konkreten Startzeitpunkt oder eine Zahl zur Pool-Tiefe, so Crypto.news.
THORChain hat am 2. Okt. 2026 seinen Liquiditätspool für Zcash (ZEC) gestartet, nachdem ein Netzwerk-Churn dazu geführt hatte, dass jeder Knoten die Zcash-Blockchain überwachte. Der Handel mit nativen ZEC hat noch nicht begonnen, und THORChain sagte, die Liquidität sei vorerst eher flach, weshalb es Nutzer dazu auffordert, in den frühen Tagen mit Vorsicht zu handeln.
THORChain eröffnet Zcash-Pool; ZEC-Swaps noch nicht live
BitcoinWorld
THORChain eröffnet Zcash-Pool; ZEC-Swaps noch nicht live
THORChain hat am 2. Okt. 2026 einen Liquiditätspool für Zcash (ZEC) aktiviert – nur wenige Stunden nachdem es einen Node-Churn abgeschlossen hatte, bei dem jeder Knoten damit begonnen hat, die Zcash-Blockchain zu beobachten. Das Protokoll sagte, der Pool sei live, aber der „Handel ist der nächste Schritt“, und nannte keinen konkreten Startzeitpunkt oder eine Zahl zur Pool-Tiefe, so Crypto.news.
THORChain hat am 2. Okt. 2026 seinen Liquiditätspool für Zcash (ZEC) gestartet, nachdem ein Netzwerk-Churn dazu geführt hatte, dass jeder Knoten die Zcash-Blockchain überwachte. Der Handel mit nativen ZEC hat noch nicht begonnen, und THORChain sagte, die Liquidität sei vorerst eher flach, weshalb es Nutzer dazu auffordert, in den frühen Tagen mit Vorsicht zu handeln.
THORChain eröffnet Zcash-Pool; ZEC-Swaps noch nicht live
THORChain hat am 2. Okt. 2026 einen Liquiditätspool für Zcash (ZEC) aktiviert – nur wenige Stunden nachdem es einen Node-Churn abgeschlossen hatte, bei dem jeder Knoten damit begonnen hat, die Zcash-Blockchain zu beobachten. Das Protokoll sagte, der Pool sei live, aber der „Handel ist der nächste Schritt“, und nannte keinen konkreten Startzeitpunkt oder eine Zahl zur Pool-Tiefe, so Crypto.news.
THORChain hat am 2. Okt. 2026 seinen Liquiditätspool für Zcash (ZEC) gestartet, nachdem ein Netzwerk-Churn dazu geführt hatte, dass jeder Knoten die Zcash-Blockchain überwachte. Der Handel mit nativen ZEC hat noch nicht begonnen, und THORChain sagte, die Liquidität sei vorerst eher flach, weshalb es Nutzer dazu auffordert, in den frühen Tagen mit Vorsicht zu handeln.
1
706
·
--
Artikel
Exploit eines Drittanbieter-Aave-Adapters entzieht 114 ETH aus SafesBitcoinWorld
Exploit eines Drittanbieter-Aave-Adapters entzieht 114 ETH aus Safes
Ein Angreifer hat am 2. Oktober etwa 114,09 ETH – im Wert von rund 305.000 US-Dollar – aus zwei Safe-Multisig-Wallets abgezogen, indem er eine Schwachstelle in einem Drittanbieter-Adapter ausnutzte, der auf Aave v3 basiert, laut Cryptoslate. Das Blockchain-Sicherheitsunternehmen SlowMist hat den Verlust auf den FlashLoopAdapter zurückgeführt, ein Modul, das über Safe-Wallets zum Öffnen und Schließen gehebelter Aave-v3-Positionen verwendet wird, während Aave-eigene Verträge nicht betroffen waren.
Die zentralen Smart Contracts von Aave v3 waren nicht betroffen. SlowMist zufolge hat der Angreifer zwei Safe-Multisig-Wallets durch einen Fehler im Drittanbieter-FlashLoopAdapter kompromittiert, indem er die Authentifizierungsprüfung umging, um etwa 114,09 ETH, also rund 305.000 US-Dollar, abzuziehen. Aave-Gründer Stani Kulechov bestätigte, dass der Vorfall externe Infrastruktur betraf, die auf Aave aufgebaut ist, nicht das Protokoll selbst.
Exploit eines Drittanbieter-Aave-Adapters entzieht 114 ETH aus Safes
BitcoinWorld
Exploit eines Drittanbieter-Aave-Adapters entzieht 114 ETH aus Safes
Ein Angreifer hat am 2. Oktober etwa 114,09 ETH – im Wert von rund 305.000 US-Dollar – aus zwei Safe-Multisig-Wallets abgezogen, indem er eine Schwachstelle in einem Drittanbieter-Adapter ausnutzte, der auf Aave v3 basiert, laut Cryptoslate. Das Blockchain-Sicherheitsunternehmen SlowMist hat den Verlust auf den FlashLoopAdapter zurückgeführt, ein Modul, das über Safe-Wallets zum Öffnen und Schließen gehebelter Aave-v3-Positionen verwendet wird, während Aave-eigene Verträge nicht betroffen waren.
Die zentralen Smart Contracts von Aave v3 waren nicht betroffen. SlowMist zufolge hat der Angreifer zwei Safe-Multisig-Wallets durch einen Fehler im Drittanbieter-FlashLoopAdapter kompromittiert, indem er die Authentifizierungsprüfung umging, um etwa 114,09 ETH, also rund 305.000 US-Dollar, abzuziehen. Aave-Gründer Stani Kulechov bestätigte, dass der Vorfall externe Infrastruktur betraf, die auf Aave aufgebaut ist, nicht das Protokoll selbst.
Exploit eines Drittanbieter-Aave-Adapters entzieht 114 ETH aus Safes
Ein Angreifer hat am 2. Oktober etwa 114,09 ETH – im Wert von rund 305.000 US-Dollar – aus zwei Safe-Multisig-Wallets abgezogen, indem er eine Schwachstelle in einem Drittanbieter-Adapter ausnutzte, der auf Aave v3 basiert, laut Cryptoslate. Das Blockchain-Sicherheitsunternehmen SlowMist hat den Verlust auf den FlashLoopAdapter zurückgeführt, ein Modul, das über Safe-Wallets zum Öffnen und Schließen gehebelter Aave-v3-Positionen verwendet wird, während Aave-eigene Verträge nicht betroffen waren.
Die zentralen Smart Contracts von Aave v3 waren nicht betroffen. SlowMist zufolge hat der Angreifer zwei Safe-Multisig-Wallets durch einen Fehler im Drittanbieter-FlashLoopAdapter kompromittiert, indem er die Authentifizierungsprüfung umging, um etwa 114,09 ETH, also rund 305.000 US-Dollar, abzuziehen. Aave-Gründer Stani Kulechov bestätigte, dass der Vorfall externe Infrastruktur betraf, die auf Aave aufgebaut ist, nicht das Protokoll selbst.
448
·
--

Artikel
Evernorth gewinnt die Zustimmung der Aktionäre für Nasdaq-Debüt mit 473 Mio. XRPBitcoinWorld
Evernorth gewinnt die Zustimmung der Aktionäre für Nasdaq-Debüt mit 473 Mio. XRP
Der Plan von Evernorth für einen Börsengang an der Nasdaq machte diese Woche den letzten großen Schritt: Aktionäre der Blank-Check-Gesellschaft Armada Acquisition Corp. II genehmigten die vorgeschlagene Unternehmensfusion, wie Cointelegraph berichtete. Die Abstimmung nimmt die letzte Hürde vor dem für den 7. Oktober erwarteten Abschluss des Deals. Die Aktien sollen am Folgetag unter dem Ticker XRPN zu handeln beginnen, vorbehaltlich der noch zu erfüllenden Abschlussbedingungen.
Die Fusion von Evernorth mit Armada Acquisition Corp. II erhielt die Zustimmung der Aktionäre und ebnet damit den Weg dafür, dass das fusionierte Unternehmen an der Nasdaq unter dem Ticker XRPN gehandelt wird. Der Deal soll am 7. Oktober abgeschlossen werden, und Evernorth rechnet damit, etwa 473 Millionen XRP zu halten – ein Treasury im Wert von rund 710 Millionen US-Dollar zu den aktuellen Preisen. Wichtige Fakten
Evernorth gewinnt die Zustimmung der Aktionäre für Nasdaq-Debüt mit 473 Mio. XRP
BitcoinWorld
Evernorth gewinnt die Zustimmung der Aktionäre für Nasdaq-Debüt mit 473 Mio. XRP
Der Plan von Evernorth für einen Börsengang an der Nasdaq machte diese Woche den letzten großen Schritt: Aktionäre der Blank-Check-Gesellschaft Armada Acquisition Corp. II genehmigten die vorgeschlagene Unternehmensfusion, wie Cointelegraph berichtete. Die Abstimmung nimmt die letzte Hürde vor dem für den 7. Oktober erwarteten Abschluss des Deals. Die Aktien sollen am Folgetag unter dem Ticker XRPN zu handeln beginnen, vorbehaltlich der noch zu erfüllenden Abschlussbedingungen.
Die Fusion von Evernorth mit Armada Acquisition Corp. II erhielt die Zustimmung der Aktionäre und ebnet damit den Weg dafür, dass das fusionierte Unternehmen an der Nasdaq unter dem Ticker XRPN gehandelt wird. Der Deal soll am 7. Oktober abgeschlossen werden, und Evernorth rechnet damit, etwa 473 Millionen XRP zu halten – ein Treasury im Wert von rund 710 Millionen US-Dollar zu den aktuellen Preisen. Wichtige Fakten
Evernorth gewinnt die Zustimmung der Aktionäre für Nasdaq-Debüt mit 473 Mio. XRP
Der Plan von Evernorth für einen Börsengang an der Nasdaq machte diese Woche den letzten großen Schritt: Aktionäre der Blank-Check-Gesellschaft Armada Acquisition Corp. II genehmigten die vorgeschlagene Unternehmensfusion, wie Cointelegraph berichtete. Die Abstimmung nimmt die letzte Hürde vor dem für den 7. Oktober erwarteten Abschluss des Deals. Die Aktien sollen am Folgetag unter dem Ticker XRPN zu handeln beginnen, vorbehaltlich der noch zu erfüllenden Abschlussbedingungen.
Die Fusion von Evernorth mit Armada Acquisition Corp. II erhielt die Zustimmung der Aktionäre und ebnet damit den Weg dafür, dass das fusionierte Unternehmen an der Nasdaq unter dem Ticker XRPN gehandelt wird. Der Deal soll am 7. Oktober abgeschlossen werden, und Evernorth rechnet damit, etwa 473 Millionen XRP zu halten – ein Treasury im Wert von rund 710 Millionen US-Dollar zu den aktuellen Preisen. Wichtige Fakten
504
·
--

Artikel
Ethereum testet 2,8 Tsd. US-Dollar Widerstand, während RENDER 2 US-Dollar erneut testetBitcoinWorld
Ethereum testet 2,8 Tsd. US-Dollar Widerstand, während RENDER 2 US-Dollar erneut testet
Ethereum handelt bei rund 2,75 Tsd. US-Dollar und drängt in eine Widerstandszone bei 2,8 Tsd. US-Dollar, nachdem es eine mehrwöchige Konsolidierung über 2,4 Tsd. US-Dollar gehalten hat – so eine technische und On-Chain-Analyse, die von Cryptopotato veröffentlicht wurde. In derselben Woche hält ein separater Bericht von AMBCrypto fest, dass der AI-verknüpfte Token RENDER nach einem September-Run von 35% zum 2-US-Dollar-Niveau zurückgekehrt ist – einer Preismarke, die es seit dem Oktober-Crash seit drei Versuchen nicht durchbrechen konnte.
Ethereum handelt bei rund 2,75 Tsd. US-Dollar und testet den Widerstand bei 2,8 Tsd. US-Dollar. Der Coinbase Premium Index ist weiterhin negativ und liegt bei etwa -0,03. RENDER, das separat von AMBCrypto verfolgt wird, testet erneut 2 US-Dollar, nachdem es nach einem September-Anstieg von 35% dort angekommen ist – eine Marke, die es bereits dreimal nicht durchbrechen konnte. Wichtige Fakten
Ethereum testet 2,8 Tsd. US-Dollar Widerstand, während RENDER 2 US-Dollar erneut testet
BitcoinWorld
Ethereum testet 2,8 Tsd. US-Dollar Widerstand, während RENDER 2 US-Dollar erneut testet
Ethereum handelt bei rund 2,75 Tsd. US-Dollar und drängt in eine Widerstandszone bei 2,8 Tsd. US-Dollar, nachdem es eine mehrwöchige Konsolidierung über 2,4 Tsd. US-Dollar gehalten hat – so eine technische und On-Chain-Analyse, die von Cryptopotato veröffentlicht wurde. In derselben Woche hält ein separater Bericht von AMBCrypto fest, dass der AI-verknüpfte Token RENDER nach einem September-Run von 35% zum 2-US-Dollar-Niveau zurückgekehrt ist – einer Preismarke, die es seit dem Oktober-Crash seit drei Versuchen nicht durchbrechen konnte.
Ethereum handelt bei rund 2,75 Tsd. US-Dollar und testet den Widerstand bei 2,8 Tsd. US-Dollar. Der Coinbase Premium Index ist weiterhin negativ und liegt bei etwa -0,03. RENDER, das separat von AMBCrypto verfolgt wird, testet erneut 2 US-Dollar, nachdem es nach einem September-Anstieg von 35% dort angekommen ist – eine Marke, die es bereits dreimal nicht durchbrechen konnte. Wichtige Fakten
Ethereum testet 2,8 Tsd. US-Dollar Widerstand, während RENDER 2 US-Dollar erneut testet
Ethereum handelt bei rund 2,75 Tsd. US-Dollar und drängt in eine Widerstandszone bei 2,8 Tsd. US-Dollar, nachdem es eine mehrwöchige Konsolidierung über 2,4 Tsd. US-Dollar gehalten hat – so eine technische und On-Chain-Analyse, die von Cryptopotato veröffentlicht wurde. In derselben Woche hält ein separater Bericht von AMBCrypto fest, dass der AI-verknüpfte Token RENDER nach einem September-Run von 35% zum 2-US-Dollar-Niveau zurückgekehrt ist – einer Preismarke, die es seit dem Oktober-Crash seit drei Versuchen nicht durchbrechen konnte.
Ethereum handelt bei rund 2,75 Tsd. US-Dollar und testet den Widerstand bei 2,8 Tsd. US-Dollar. Der Coinbase Premium Index ist weiterhin negativ und liegt bei etwa -0,03. RENDER, das separat von AMBCrypto verfolgt wird, testet erneut 2 US-Dollar, nachdem es nach einem September-Anstieg von 35% dort angekommen ist – eine Marke, die es bereits dreimal nicht durchbrechen konnte. Wichtige Fakten
350
·
--

Artikel
Porsche beendet PIONΞERS CIRCLE Web3-Projekt nach fast vier JahrenBitcoinWorld
Porsche beendet PIONΞERS CIRCLE Web3-Projekt nach fast vier Jahren
Porsche hat sein Web3-Projekt sowie die PIONΞERS CIRCLE-Community beendet – fast vier Jahre nachdem das Unternehmen seine 911-NFT-Initiative gestartet hatte, wie das Unternehmen in einem Beitrag auf X mitteilte. Die Ankündigung, die erstmals von Crypto.news am 2. Oktober 2026 berichtet wurde, bestätigt, dass die bestehenden PORSCHΞ 911 NFTs bei ihren Inhabern bleiben und auf der Blockchain weiterhin existieren, auch wenn die offizielle Infrastruktur rund um sie schrittweise abgebaut wird.
Porsche kündigte am 1. Oktober 2026 an, dass es sein Web3-Projekt und die PIONΞERS CIRCLE-Community beendet – fast vier Jahre nachdem das Unternehmen seine 911-NFT-Kollektion auf den Markt gebracht hatte. Die PORSCHΞ 911 NFTs bleiben in den Wallets der Inhaber onchain, während der Discord-Server zu einem reinen Lese-Archiv wird und der X-Account @eth_porsche nicht mehr aktiv aktualisiert wird. Wichtige Fakten
Porsche beendet PIONΞERS CIRCLE Web3-Projekt nach fast vier Jahren
BitcoinWorld
Porsche beendet PIONΞERS CIRCLE Web3-Projekt nach fast vier Jahren
Porsche hat sein Web3-Projekt sowie die PIONΞERS CIRCLE-Community beendet – fast vier Jahre nachdem das Unternehmen seine 911-NFT-Initiative gestartet hatte, wie das Unternehmen in einem Beitrag auf X mitteilte. Die Ankündigung, die erstmals von Crypto.news am 2. Oktober 2026 berichtet wurde, bestätigt, dass die bestehenden PORSCHΞ 911 NFTs bei ihren Inhabern bleiben und auf der Blockchain weiterhin existieren, auch wenn die offizielle Infrastruktur rund um sie schrittweise abgebaut wird.
Porsche kündigte am 1. Oktober 2026 an, dass es sein Web3-Projekt und die PIONΞERS CIRCLE-Community beendet – fast vier Jahre nachdem das Unternehmen seine 911-NFT-Kollektion auf den Markt gebracht hatte. Die PORSCHΞ 911 NFTs bleiben in den Wallets der Inhaber onchain, während der Discord-Server zu einem reinen Lese-Archiv wird und der X-Account @eth_porsche nicht mehr aktiv aktualisiert wird. Wichtige Fakten
Porsche beendet PIONΞERS CIRCLE Web3-Projekt nach fast vier Jahren
Porsche hat sein Web3-Projekt sowie die PIONΞERS CIRCLE-Community beendet – fast vier Jahre nachdem das Unternehmen seine 911-NFT-Initiative gestartet hatte, wie das Unternehmen in einem Beitrag auf X mitteilte. Die Ankündigung, die erstmals von Crypto.news am 2. Oktober 2026 berichtet wurde, bestätigt, dass die bestehenden PORSCHΞ 911 NFTs bei ihren Inhabern bleiben und auf der Blockchain weiterhin existieren, auch wenn die offizielle Infrastruktur rund um sie schrittweise abgebaut wird.
Porsche kündigte am 1. Oktober 2026 an, dass es sein Web3-Projekt und die PIONΞERS CIRCLE-Community beendet – fast vier Jahre nachdem das Unternehmen seine 911-NFT-Kollektion auf den Markt gebracht hatte. Die PORSCHΞ 911 NFTs bleiben in den Wallets der Inhaber onchain, während der Discord-Server zu einem reinen Lese-Archiv wird und der X-Account @eth_porsche nicht mehr aktiv aktualisiert wird. Wichtige Fakten
174
·
--
Artikel
SMBC Nikko und Uniswap unterzeichnen MoU für Japans DeFi-GatewayBitcoinWorld
SMBC Nikko und Uniswap unterzeichnen MoU für Japans DeFi-Gateway
SMBC Nikko Securities und der Blockchain-Entwickler Nethermind unterzeichneten am 2. Oktober 2026 ein Memorandum of Understanding mit Uniswap Labs, Base und der Nyx Foundation. Darin wird ein Fünf-Parteien-Plan festgelegt, um ein auf Japan ausgerichtetes dezentrales Finanz-Gateway aufzubauen. Laut Crypto.news wollen die Partner das Projekt bis Mitte 2027 abschließen; es wurde kein Live-Produkt gestartet und es gibt keine öffentliche Genehmigung durch die Financial Services Agency Japans.
Das DeFi-Gateway ist ein Entwicklungsprojekt, das von SMBC Nikko Securities und Nethermind gemeinsam mit Uniswap Labs, Base und der Nyx Foundation geleitet wird und auf eine Fertigstellung bis Mitte 2027 abzielt. Es würde Uniswap-v4-Hooks verwenden, um regelkonforme Liquiditätspools mit Kontrollen gegen Geldwäsche, Terrorismusfinanzierung und zum Anlegerschutz aufzubauen, jedoch ist kein Produkt live und die FSA hat keines für die öffentliche Nutzung genehmigt. Kernaussagen
SMBC Nikko und Uniswap unterzeichnen MoU für Japans DeFi-Gateway
BitcoinWorld
SMBC Nikko und Uniswap unterzeichnen MoU für Japans DeFi-Gateway
SMBC Nikko Securities und der Blockchain-Entwickler Nethermind unterzeichneten am 2. Oktober 2026 ein Memorandum of Understanding mit Uniswap Labs, Base und der Nyx Foundation. Darin wird ein Fünf-Parteien-Plan festgelegt, um ein auf Japan ausgerichtetes dezentrales Finanz-Gateway aufzubauen. Laut Crypto.news wollen die Partner das Projekt bis Mitte 2027 abschließen; es wurde kein Live-Produkt gestartet und es gibt keine öffentliche Genehmigung durch die Financial Services Agency Japans.
Das DeFi-Gateway ist ein Entwicklungsprojekt, das von SMBC Nikko Securities und Nethermind gemeinsam mit Uniswap Labs, Base und der Nyx Foundation geleitet wird und auf eine Fertigstellung bis Mitte 2027 abzielt. Es würde Uniswap-v4-Hooks verwenden, um regelkonforme Liquiditätspools mit Kontrollen gegen Geldwäsche, Terrorismusfinanzierung und zum Anlegerschutz aufzubauen, jedoch ist kein Produkt live und die FSA hat keines für die öffentliche Nutzung genehmigt. Kernaussagen
SMBC Nikko und Uniswap unterzeichnen MoU für Japans DeFi-Gateway
SMBC Nikko Securities und der Blockchain-Entwickler Nethermind unterzeichneten am 2. Oktober 2026 ein Memorandum of Understanding mit Uniswap Labs, Base und der Nyx Foundation. Darin wird ein Fünf-Parteien-Plan festgelegt, um ein auf Japan ausgerichtetes dezentrales Finanz-Gateway aufzubauen. Laut Crypto.news wollen die Partner das Projekt bis Mitte 2027 abschließen; es wurde kein Live-Produkt gestartet und es gibt keine öffentliche Genehmigung durch die Financial Services Agency Japans.
Das DeFi-Gateway ist ein Entwicklungsprojekt, das von SMBC Nikko Securities und Nethermind gemeinsam mit Uniswap Labs, Base und der Nyx Foundation geleitet wird und auf eine Fertigstellung bis Mitte 2027 abzielt. Es würde Uniswap-v4-Hooks verwenden, um regelkonforme Liquiditätspools mit Kontrollen gegen Geldwäsche, Terrorismusfinanzierung und zum Anlegerschutz aufzubauen, jedoch ist kein Produkt live und die FSA hat keines für die öffentliche Nutzung genehmigt. Kernaussagen
167
Anmelden und weiter Inhalte entdecken
Krypto-Nutzer weltweit auf Binance Square kennenlernen
⚡️ Bleib in Sachen Krypto stets am Puls.
💬 Die weltgrößte Kryptobörse vertraut darauf.
👍 Erhalte verlässliche Einblicke von verifizierten Creators.
E-Mail-Adresse/Telefonnummer
Trendthemen
Nikkei225Jumps2.5%ToThreeMonthHigh
17,403 Aufrufe
388 Kommentare
#Nikkei225Jumps2.5%ToThreeMonthHigh
🚀 Nikkei 225 steigt um 2,45 % auf den höchsten Stand seit 3 Monaten!
Japans Leitindex Nikkei 225 legte am Montag kräftig zu und schloss bei 69,946.86, nachdem er kurzzeitig erstmals seit drei Monaten die Marke von 70,000 überschritten hatte.
💡 Was treibt den Anstieg an?
KI- und Halbleiterboom: Große Technologieführer wie Advantest und Tokyo Electron gaben mit deutlichen Kursgewinnen den Ton an.
Aufwind von der Wall Street: Positive Impulse von den US-Märkten stärkten das Vertrauen der Anleger insgesamt.
Makroökonomische Veränderungen: Niedriger als erwartet ausgefallene US-Arbeitsmarktdaten milderten die Sorgen und senkten die Erwartungen an eine aggressive Zinserhöhung der Fed im Oktober.
📊 Fazit für den Markt:
Diese kräftige Rally signalisiert ein starkes Wiederaufleben des Anlegerinteresses an Technologie- und KI-bezogenen Anlagen. Händler sollten jedoch die erhöhten Anleiherenditen als anhaltenden Risikofaktor genau im Blick behalten.
Glaubt ihr, dass der Nikkei sich erfolgreich über 70,000 halten und neue Höchststände erreichen kann? Teilt uns eure Meinung mit!
#JapanStocks #StockMarket" #AIStocks #Semiconductors #Investing #Nikkei225
$EWJ
Nurul Hasnat Samir
·0 Likes
·430 Aufrufe
DriftHackVictimsBeginClaims
93,671 Aufrufe
1,061 Kommentare
SolanaTokenizedStockVolumeTops$4.4BInSeptember
8,834 Aufrufe
101 Kommentare