

AshokRomeo
48 Beiträge

AshokRomeo
Melden
Nutzer blockieren
hello I'm ashok ,I am doing job in textile industries,my passion to become big crypto player 🙏 I will do it by my self ,best crypto trader
Trade eröffnen
Hochfrequenz-Trader
5.4 Jahre
11 Following
29 Follower
26 Like gegeben
Beiträge
Portfolio
·
--
Artikel
Übersetzung ansehen
🚨 IDOLUSDT +45%: THE BIG BREAKOUT IS COMING? Bulls Are Testing a Major Resistance!🚨 IDOLUSDT +45%: THE BIG BREAKOUT IS COMING? Bulls Are Testing a Major Resistance!
🔥 IDOL is approaching a critical decision point!
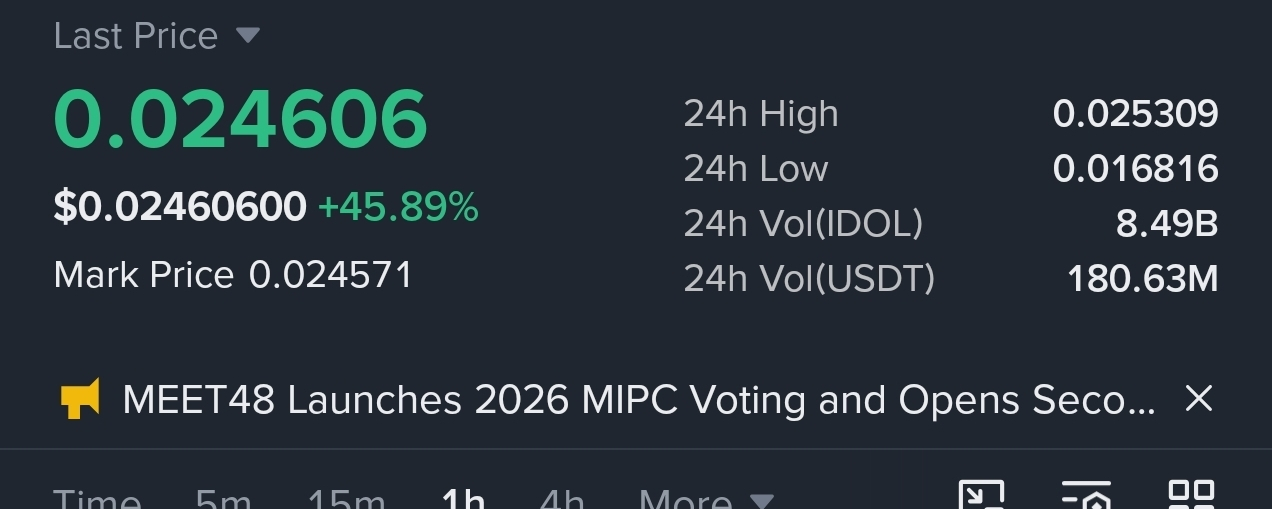
MEET48 (IDOLUSDT) is showing impressive bullish momentum, with price climbing more than 45% in 24 hours.
But there is one important question:
Can bulls break the resistance, or are we about to see another rejection?
Let's analyze the 1H chart.
📊 MARKET DATA
- Current Price: $0.024676
- 24H Change: +45.56%
- 24H High: $0.025309
- 24H Low: $0.016816
- 24H Volume: 180.53M USDT
High volatility and strong trading activity are making IDOL an interesting altcoin to watch.
🟢 1. BULLISH EMA STRUCTURE
EMA 50: $0.020262
EMA 200: $0.014904
Price is trading above both moving averages.
EMA 50 is also above EMA 200, indicating a bullish structure on the 1H timeframe.
As long as price holds above the EMA 50 area, buyers may retain short-term control.
🔴 2. THE MOST IMPORTANT RESISTANCE
IDOL is approaching a major supply zone around:
$0.0247 – $0.0260
This is the key battle area for buyers and sellers.
A confirmed 1H candle close above this zone, supported by strong volume, could signal a potential breakout.
But a rejection here could trigger short-term profit booking.
🎯 3. KEY LEVELS TO WATCH
Resistance:
- $0.025309 – 24H High
- $0.0260 – Major resistance area
- $0.031411 – Previous swing high
Support:
- $0.0224 – Near-term support
- $0.0202 – EMA 50 area
- $0.0170–$0.0178 – Major demand zone
🚀 4. TWO POSSIBLE SCENARIOS
🟢 BULLISH SCENARIO:
If IDOL breaks above $0.0260 with strong volume and successfully retests the zone, the next major upside level to watch is $0.0292, followed by $0.031411.
🔴 BEARISH SCENARIO:
If price fails to break resistance and falls below $0.0224, a pullback toward $0.0202 becomes possible.
Losing the EMA 50 area could weaken the current bullish structure.
🧠 MY FINAL ANALYSIS
IDOL is showing strong bullish momentum, but price is now approaching an important resistance zone.
I am watching one thing closely:
Will buyers convert this resistance into support?
A breakout confirmation matters more than simply buying into a green candle.
Patience, volume confirmation and risk management are essential.
💬 YOUR TURN!
What do you think happens next?
🔥 BULLISH – IDOL breaks $0.0260 and targets $0.0314.
🐻 BEARISH – Resistance rejects price and a correction begins.
Drop your prediction below! 👇
#IDOL #MEET48 #IDOLUSDT #CryptoAnalysis #BinanceSquare #Altcoins #CryptoTrading #TechnicalAnalysis
⚠️ Disclaimer: This is educational technical analysis based on the displayed chart, not financial advice. Crypto futures are highly risky. Always manage your risk.
🚨 IDOLUSDT +45%: THE BIG BREAKOUT IS COMING? Bulls Are Testing a Major Resistance!
🚨 IDOLUSDT +45%: THE BIG BREAKOUT IS COMING? Bulls Are Testing a Major Resistance!
🔥 IDOL is approaching a critical decision point!
MEET48 (IDOLUSDT) is showing impressive bullish momentum, with price climbing more than 45% in 24 hours.
But there is one important question:
Can bulls break the resistance, or are we about to see another rejection?
Let's analyze the 1H chart.
📊 MARKET DATA
- Current Price: $0.024676
- 24H Change: +45.56%
- 24H High: $0.025309
- 24H Low: $0.016816
- 24H Volume: 180.53M USDT
High volatility and strong trading activity are making IDOL an interesting altcoin to watch.
🟢 1. BULLISH EMA STRUCTURE
EMA 50: $0.020262
EMA 200: $0.014904
Price is trading above both moving averages.
EMA 50 is also above EMA 200, indicating a bullish structure on the 1H timeframe.
As long as price holds above the EMA 50 area, buyers may retain short-term control.
🔴 2. THE MOST IMPORTANT RESISTANCE
IDOL is approaching a major supply zone around:
$0.0247 – $0.0260
This is the key battle area for buyers and sellers.
A confirmed 1H candle close above this zone, supported by strong volume, could signal a potential breakout.
But a rejection here could trigger short-term profit booking.
🎯 3. KEY LEVELS TO WATCH
Resistance:
- $0.025309 – 24H High
- $0.0260 – Major resistance area
- $0.031411 – Previous swing high
Support:
- $0.0224 – Near-term support
- $0.0202 – EMA 50 area
- $0.0170–$0.0178 – Major demand zone
🚀 4. TWO POSSIBLE SCENARIOS
🟢 BULLISH SCENARIO:
If IDOL breaks above $0.0260 with strong volume and successfully retests the zone, the next major upside level to watch is $0.0292, followed by $0.031411.
🔴 BEARISH SCENARIO:
If price fails to break resistance and falls below $0.0224, a pullback toward $0.0202 becomes possible.
Losing the EMA 50 area could weaken the current bullish structure.
🧠 MY FINAL ANALYSIS
IDOL is showing strong bullish momentum, but price is now approaching an important resistance zone.
I am watching one thing closely:
Will buyers convert this resistance into support?
A breakout confirmation matters more than simply buying into a green candle.
Patience, volume confirmation and risk management are essential.
💬 YOUR TURN!
What do you think happens next?
🔥 BULLISH – IDOL breaks $0.0260 and targets $0.0314.
🐻 BEARISH – Resistance rejects price and a correction begins.
Drop your prediction below! 👇
#IDOL #MEET48 #IDOLUSDT #CryptoAnalysis #BinanceSquare #Altcoins #CryptoTrading #TechnicalAnalysis
⚠️ Disclaimer: This is educational technical analysis based on the displayed chart, not financial advice. Crypto futures are highly risky. Always manage your risk.
282
·
--
Artikel
Übersetzung ansehen
$ESPORTS UP 117%🚀 $ESPORTS UP 117% — Is Yooldo Preparing for Another Breakout or a Major Correction?
A massive rally has brought $ESPORTS into the spotlight. But is the bullish momentum strong enough to continue?
Let's break down the technical structure.
📊 CHART ANALYSIS — 15 MIN TIMEFRAME
According to the chart snapshot:
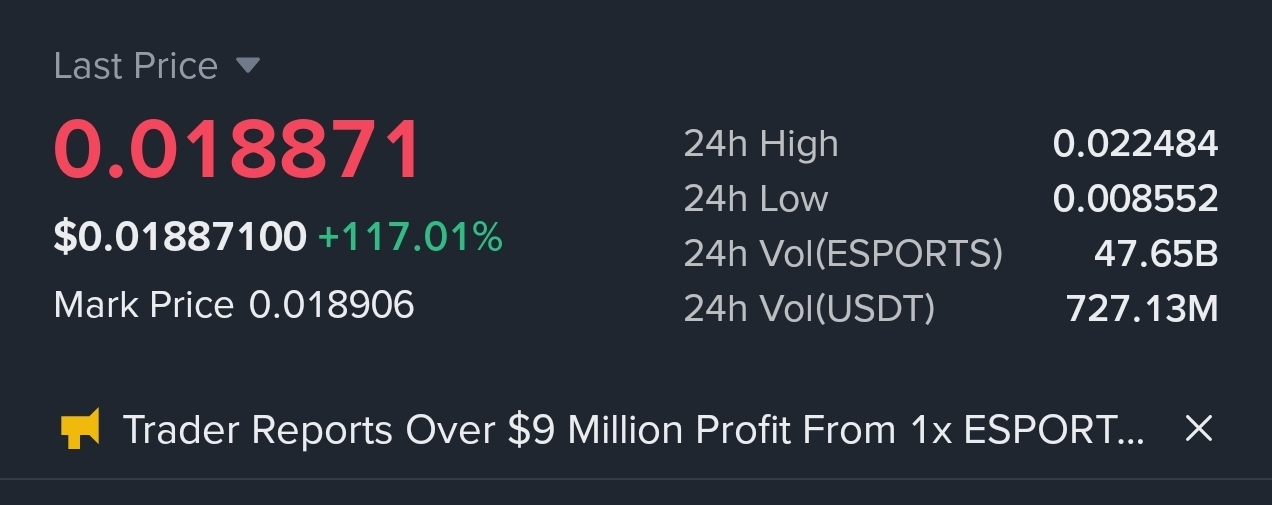
- Current price: 0.018871 USDT
- 24H change: +117.01%
- 24H high: 0.022484
- 24H low: 0.008552
- EMA 50: 0.017513
- EMA 200: 0.012397
🟢 1. Bullish Market Structure
ESPORTS has experienced a strong upward move, breaking above its previous consolidation zone.
The price is currently trading above both EMA 50 and EMA 200.
This indicates strong short-term momentum.
However, after such a sharp rally, volatility and profit-taking should not be ignored.
🔴 2. Important Resistance Zone
The immediate resistance to watch is:
0.0217 – 0.0225 USDT
The previous high near 0.022484 is an important level.
If buyers manage to push price above this zone and hold it with strong volume, another bullish move could develop.
A rejection from this zone could trigger further consolidation.
🟢 3. Important Support Levels
Here are the levels I am watching:
- 0.0175 — EMA 50 / immediate support area
- 0.0131 — Previous breakout and support zone
- 0.0124 — EMA 200
- 0.0090 — Lower historical support area
A sustained move below EMA 50 could weaken the immediate bullish structure.
📈 4. Two Possible Scenarios
BULLISH SCENARIO
If ESPORTS holds above 0.0175 and buyers regain momentum, a retest of 0.0217–0.0225 becomes possible.
A confirmed breakout above 0.0225 could open the door for further price discovery.
BEARISH SCENARIO
If price loses 0.0175 with strong selling pressure, a deeper correction toward 0.0131 could become possible.
Failure to hold that zone would make the structure weaker.
⚠️ 5. My Final View
ESPORTS is showing strong bullish momentum, but chasing a coin after a 117% rally can be risky.
I would rather wait for a confirmed breakout or a healthy support retest than enter emotionally.
Remember: High volume does not guarantee further upside.
The next important battle is between buyers near support and sellers near 0.0225.
👇 COMMUNITY QUESTION
What do you think happens next?
🟢 BULLISH — ESPORTS breaks above 0.0225
🔴 BEARISH — ESPORTS corrects toward 0.0131
Share your analysis in the comments!
#ESPORTS #YOOLDO #CryptoAnalysis #BinanceSquare #Altcoins #TechnicalAnalysis
Disclaimer: This is technical analysis based on a chart snapshot, not financial advice. Levels are indicative, not guaranteed. Cryptocurrency futures carry significant risk.
$ESPORTS UP 117%
🚀 $ESPORTS UP 117% — Is Yooldo Preparing for Another Breakout or a Major Correction?
A massive rally has brought $ESPORTS into the spotlight. But is the bullish momentum strong enough to continue?
Let's break down the technical structure.
📊 CHART ANALYSIS — 15 MIN TIMEFRAME
According to the chart snapshot:
- Current price: 0.018871 USDT
- 24H change: +117.01%
- 24H high: 0.022484
- 24H low: 0.008552
- EMA 50: 0.017513
- EMA 200: 0.012397
🟢 1. Bullish Market Structure
ESPORTS has experienced a strong upward move, breaking above its previous consolidation zone.
The price is currently trading above both EMA 50 and EMA 200.
This indicates strong short-term momentum.
However, after such a sharp rally, volatility and profit-taking should not be ignored.
🔴 2. Important Resistance Zone
The immediate resistance to watch is:
0.0217 – 0.0225 USDT
The previous high near 0.022484 is an important level.
If buyers manage to push price above this zone and hold it with strong volume, another bullish move could develop.
A rejection from this zone could trigger further consolidation.
🟢 3. Important Support Levels
Here are the levels I am watching:
- 0.0175 — EMA 50 / immediate support area
- 0.0131 — Previous breakout and support zone
- 0.0124 — EMA 200
- 0.0090 — Lower historical support area
A sustained move below EMA 50 could weaken the immediate bullish structure.
📈 4. Two Possible Scenarios
BULLISH SCENARIO
If ESPORTS holds above 0.0175 and buyers regain momentum, a retest of 0.0217–0.0225 becomes possible.
A confirmed breakout above 0.0225 could open the door for further price discovery.
BEARISH SCENARIO
If price loses 0.0175 with strong selling pressure, a deeper correction toward 0.0131 could become possible.
Failure to hold that zone would make the structure weaker.
⚠️ 5. My Final View
ESPORTS is showing strong bullish momentum, but chasing a coin after a 117% rally can be risky.
I would rather wait for a confirmed breakout or a healthy support retest than enter emotionally.
Remember: High volume does not guarantee further upside.
The next important battle is between buyers near support and sellers near 0.0225.
👇 COMMUNITY QUESTION
What do you think happens next?
🟢 BULLISH — ESPORTS breaks above 0.0225
🔴 BEARISH — ESPORTS corrects toward 0.0131
Share your analysis in the comments!
#ESPORTS #YOOLDO #CryptoAnalysis #BinanceSquare #Altcoins #TechnicalAnalysis
Disclaimer: This is technical analysis based on a chart snapshot, not financial advice. Levels are indicative, not guaranteed. Cryptocurrency futures carry significant risk.
426
·
--
Übersetzung ansehen
Gold Spot (XAU/USD) Market Flash: Sharp Pullback Tests Key Support at $3,870
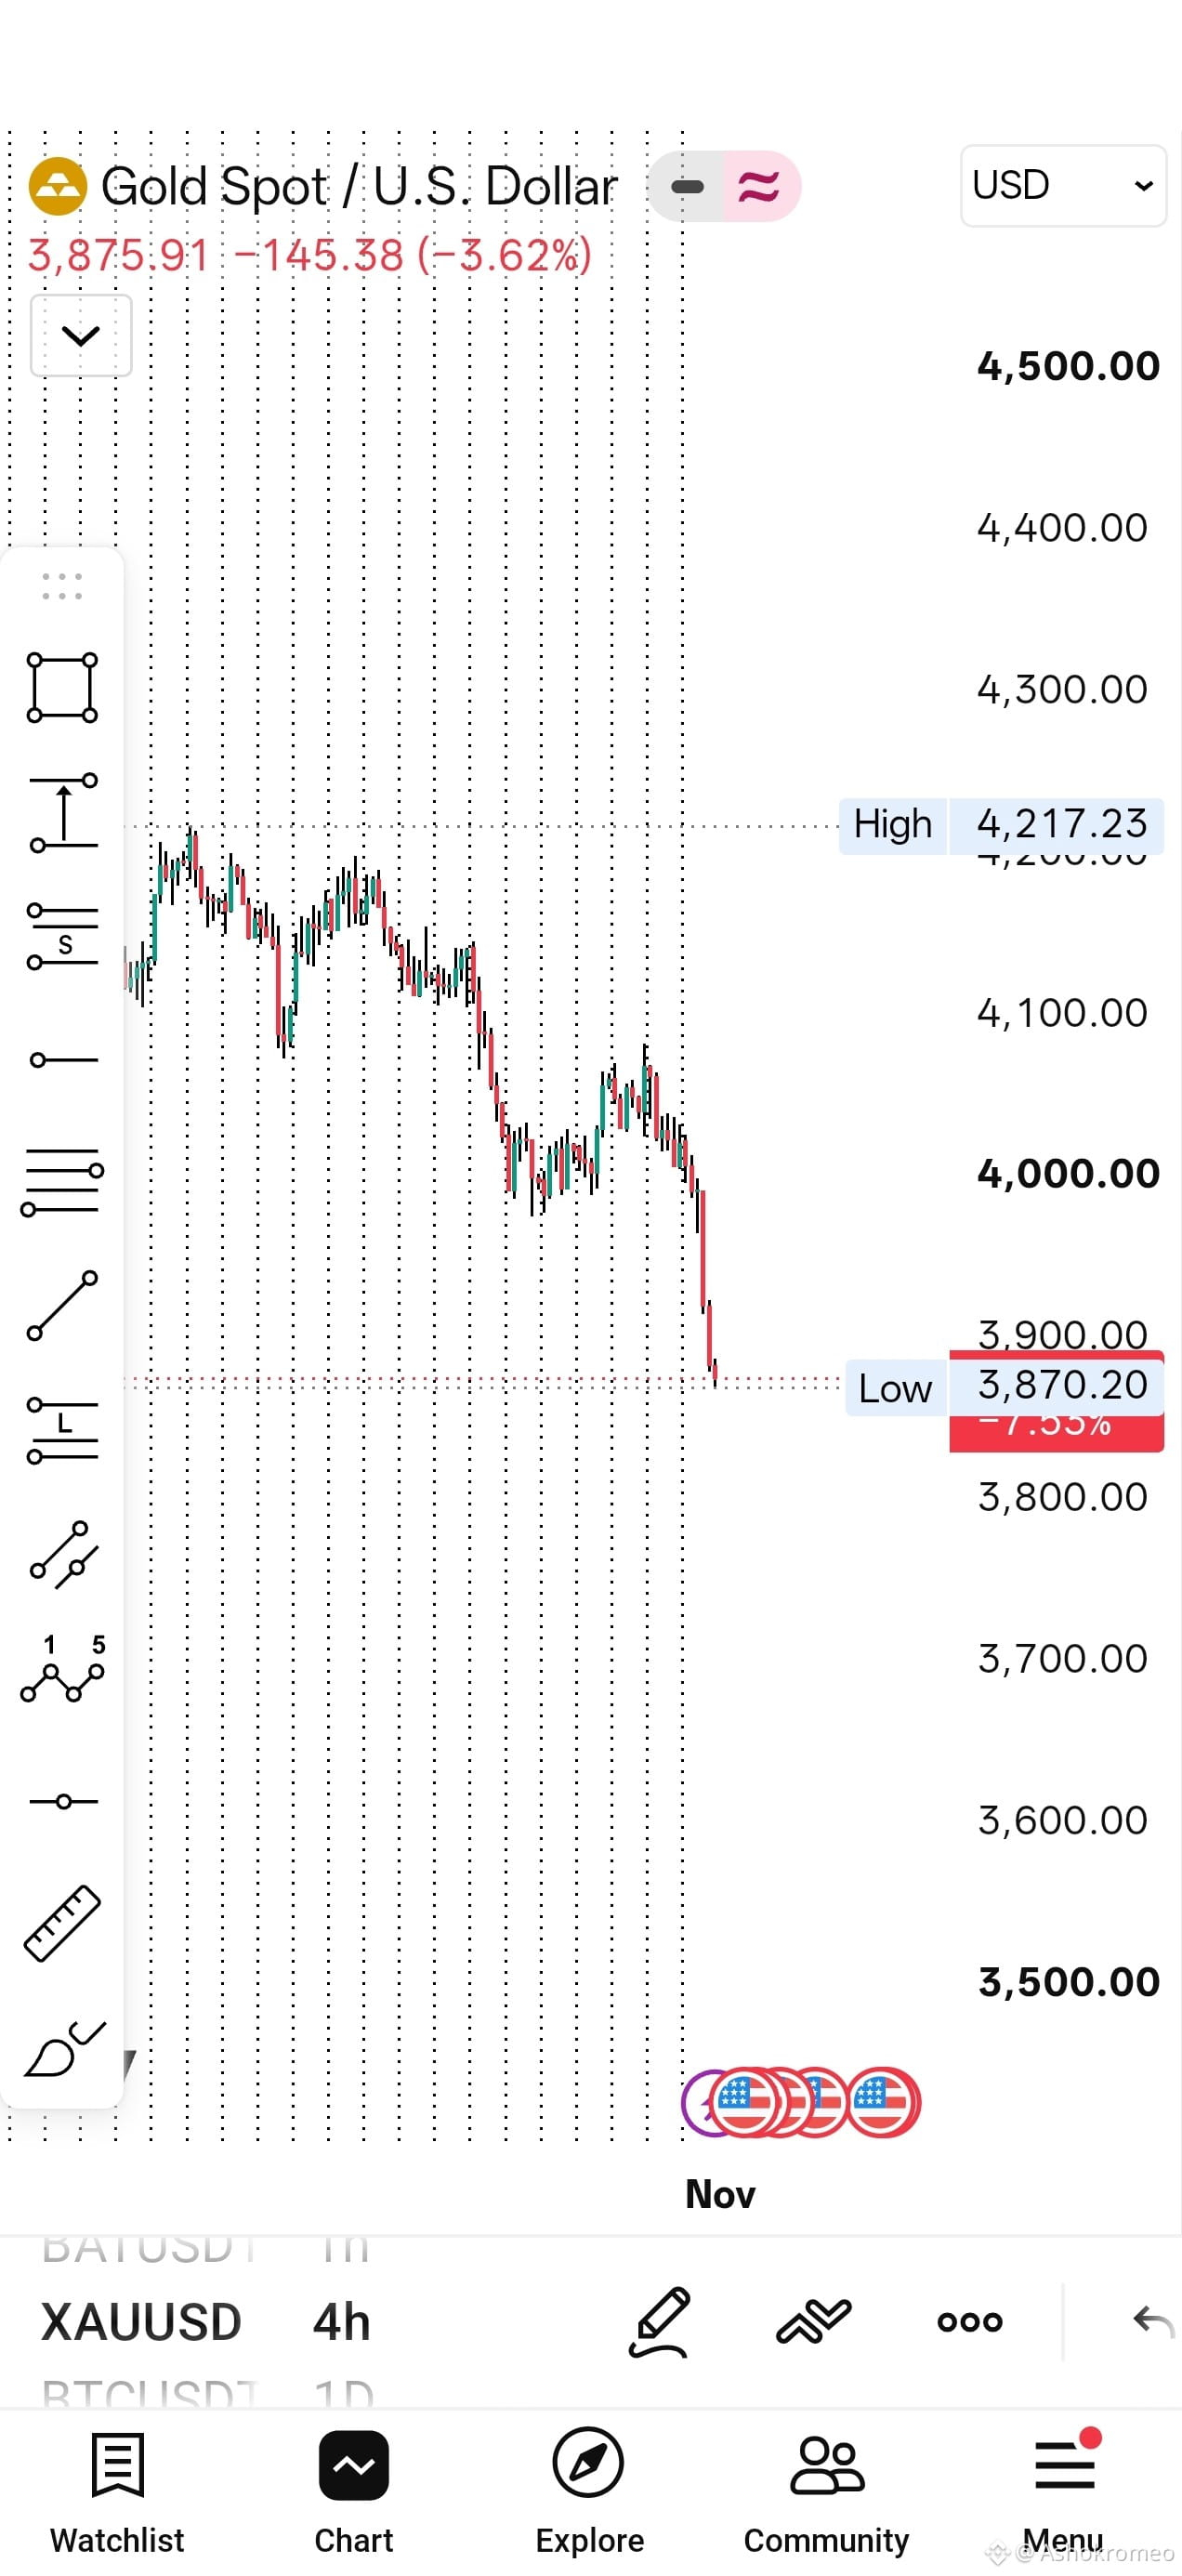
Gold ($XAUUSD) has experienced a steep decline on the 4-hour timeframe, falling from recent highs above $4,217 down to test fresh local lows near $3,870. Currently trading at $3,875.91, the asset is down -3.62% (-$145.38) as aggressive selling pressure takes control heading into November.
Key Market Data
* Current Price: $3,875.91
* Session Change: -$145.38 (-3.62%)
* Recent Swing High: $4,217.23
* Local Low: $3,870.20
* Critical Psychological Level: $3,900.00
Technical Breakdown
* Breakdown Below $4,000: After consolidating between $4,000 and $4,100, gold failed to maintain higher support, triggering a high-momentum sell-off that sliced cleanly through the key $4,000 psychological threshold.
* Support Test at $3,870: The sharp drop halted directly at the $3,870.20 level. A reaction from buyers is visible here, but price remains pinned beneath the immediate overhead level at $3,900.00.
* Market Sentiment: Bears firmly control the short-to-medium structure following lower highs off the $4,217.23 peak. Until bulls can reclaim key levels above $3,900, the market remains in an oversold consolidation phase.
Levels to Watch
* Immediate Resistance ($3,900.00 – $4,000.00): Bulls must reclaim $3,900 to slow the downward trend, with $4,000 serving as primary resistance on any relief bounce.
* Crucial Support ($3,870.20): A decisive break below the $3,870.20 low would signal continuation toward lower liquidity zones around $3,800.00 – $3,700.00.
Disclaimer: This analysis is for informational purposes only and does not constitute financial advice. Always apply strict risk management and appropriate stop-loss limits when trading leveraged commodity pairs.
$XAUT
$BTC
$BNB
230
·
--
Bullisch
Übersetzung ansehen
🚨 $AIN at Critical Decision Zone — Breakout or Bull Trap?
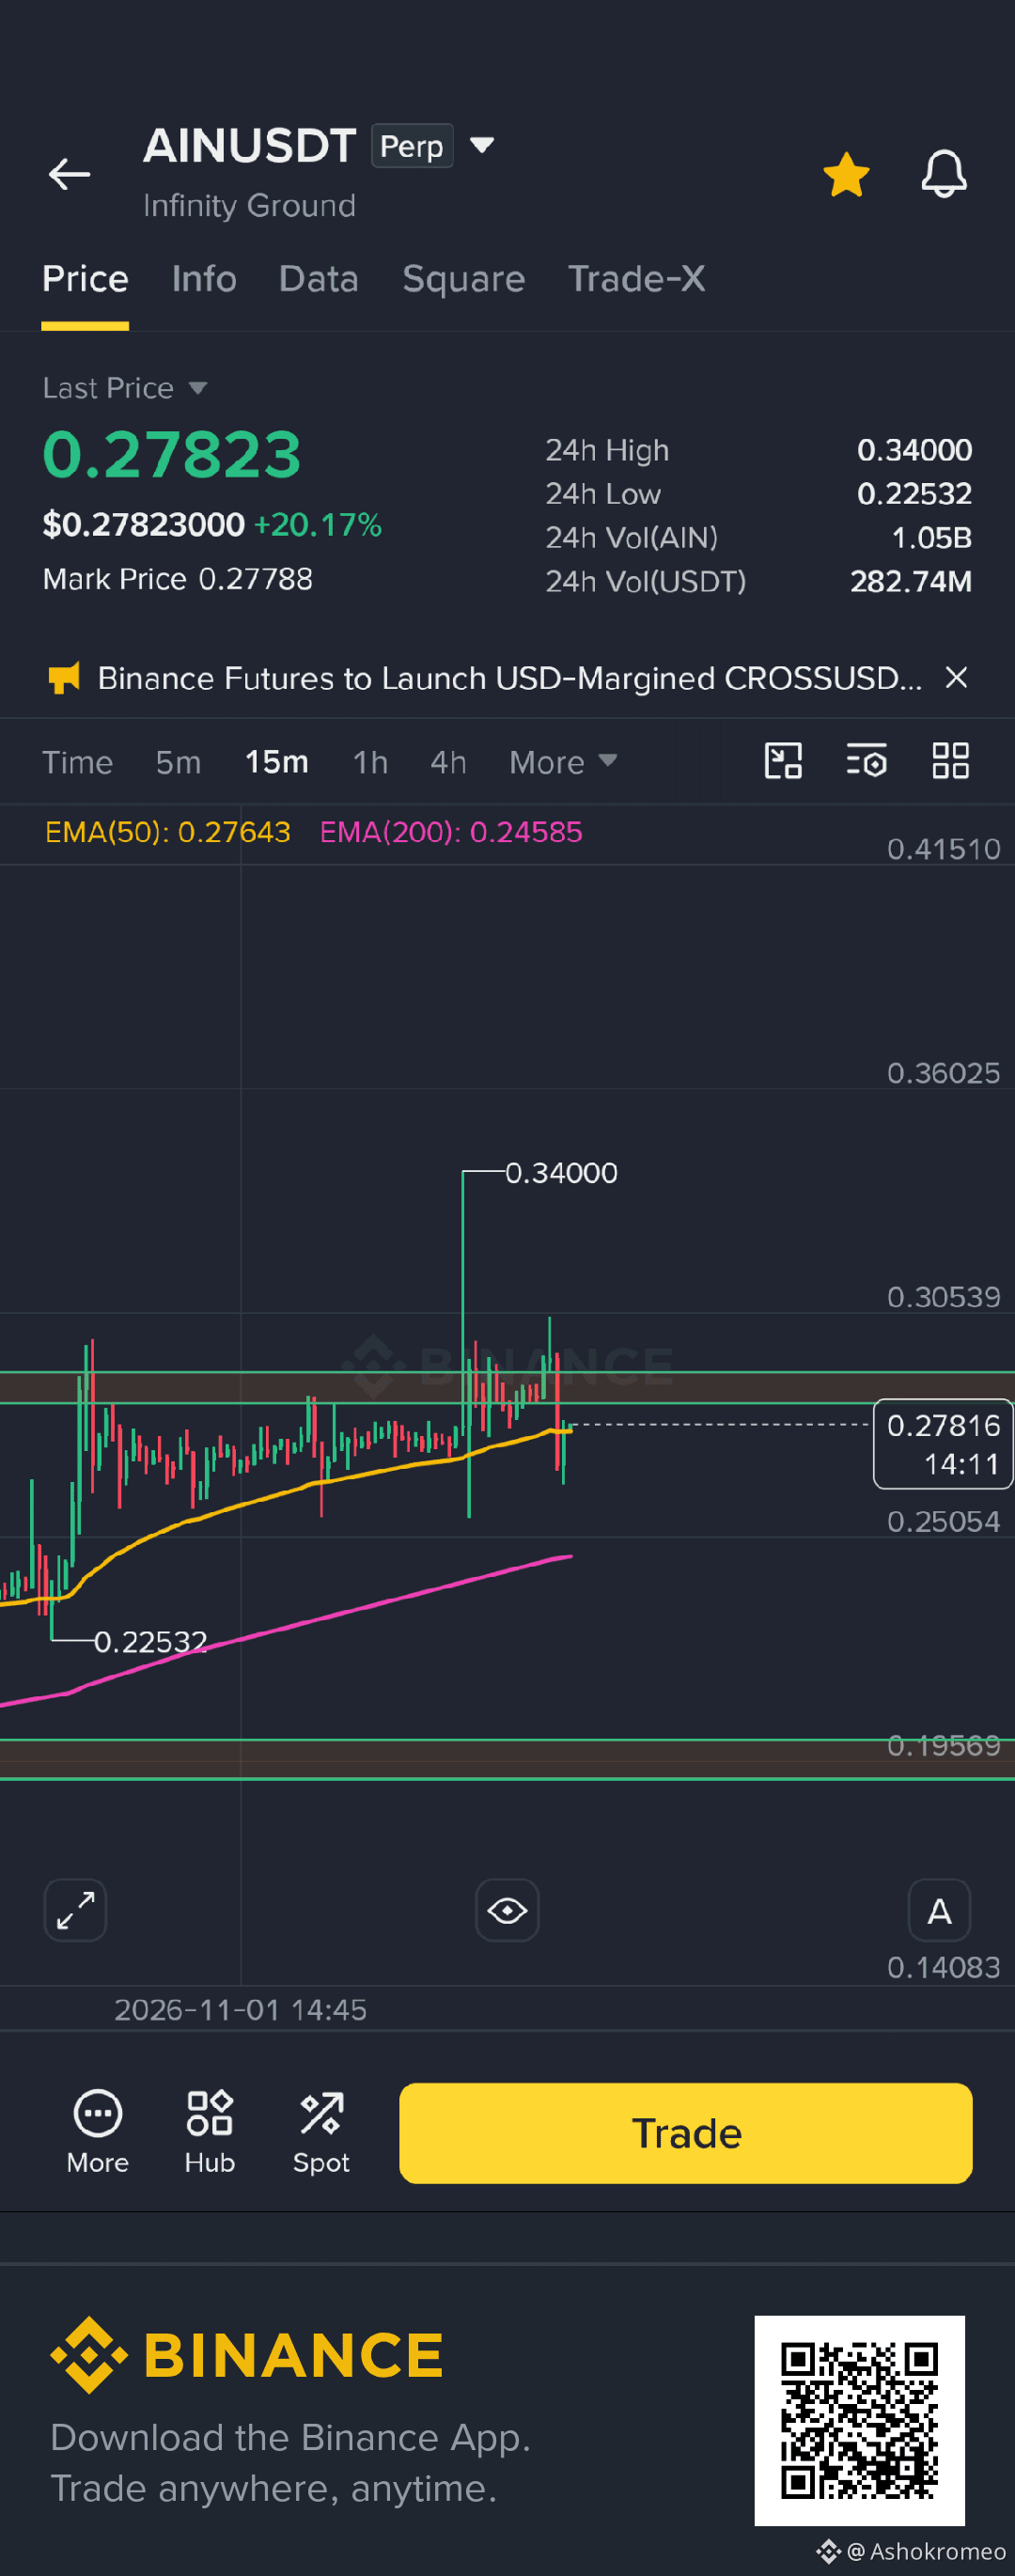
$AIN is testing a major HTF level after sweeping liquidity below . Here is the exact invalidation and where the smart money is positioned:
📊 The Technical Structure:
• Timeframe: [5M / 15 M]
• Trend/Pattern: [Ascending Channel / Range Equilibrium / Double Bottom]
• Key Support / Demand
• Major Resistance / Supply
• EMA 50/200 Market is moving up
so it's clear market is bullish
🎯 Two Scenarios on My Watchlist:
1️⃣ Bullish Continuation:
• Trigger: 15M candle close above Resistance
• Target 1: 0.31
• Target 2: 0.35
• Invalidation: Close below 0.25
2️⃣ Rejection & Sweep:
• If rejected from resistance area , looking for a liquidity re-test 200 EMA
⚠️ Risk Note:
[Insert key macro catalyst or token unlock date]. Always manage position size—never chase green candles.
👇 Poll / Discussion:
Are you longing this breakout or waiting for a dip back Support.Let’s hear your target below!
#CryptoTrading #TechnicalAnalysis #Write2Earn $AIN #AIN
349
·
--
Bullisch
Übersetzung ansehen
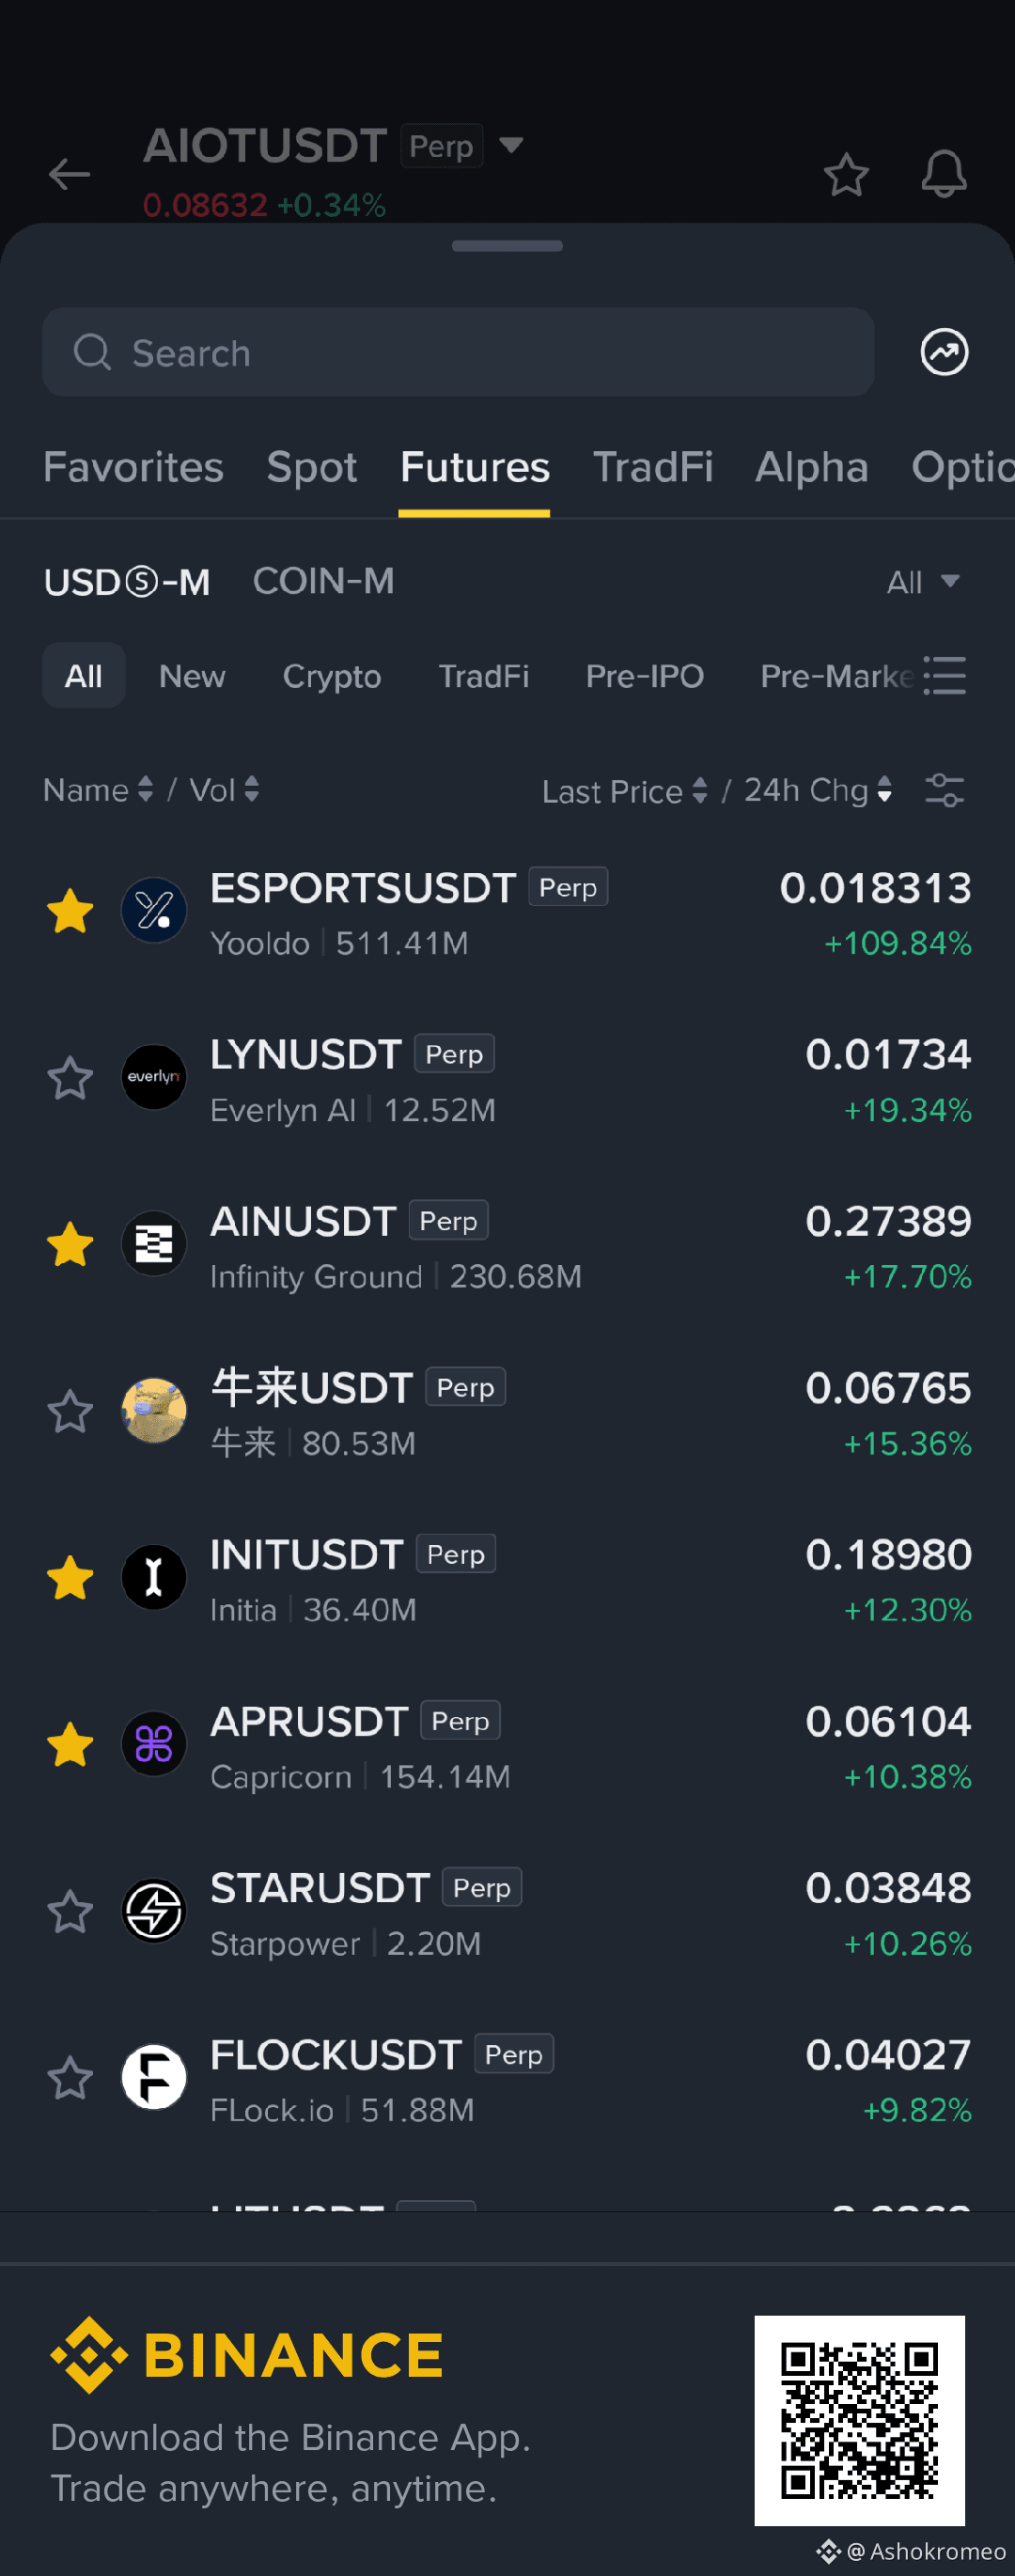
omg #ESPOPTSUSDT pump 109%
rest all 19-20 %
more liquidity in #ESPOPTSUSDT
be careful liquidity mean liquidation
trade with small amount 🤏
$ESPORTS
omg #ESPOPTSUSDT pump 109%
rest all 19-20 %
more liquidity in #ESPOPTSUSDT
be careful liquidity mean liquidation
trade with small amount 🤏
$ESPORTS
rest all 19-20 %
more liquidity in #ESPOPTSUSDT
be careful liquidity mean liquidation
trade with small amount 🤏
$ESPORTS
379
·
--
Bullisch
Übersetzung ansehen
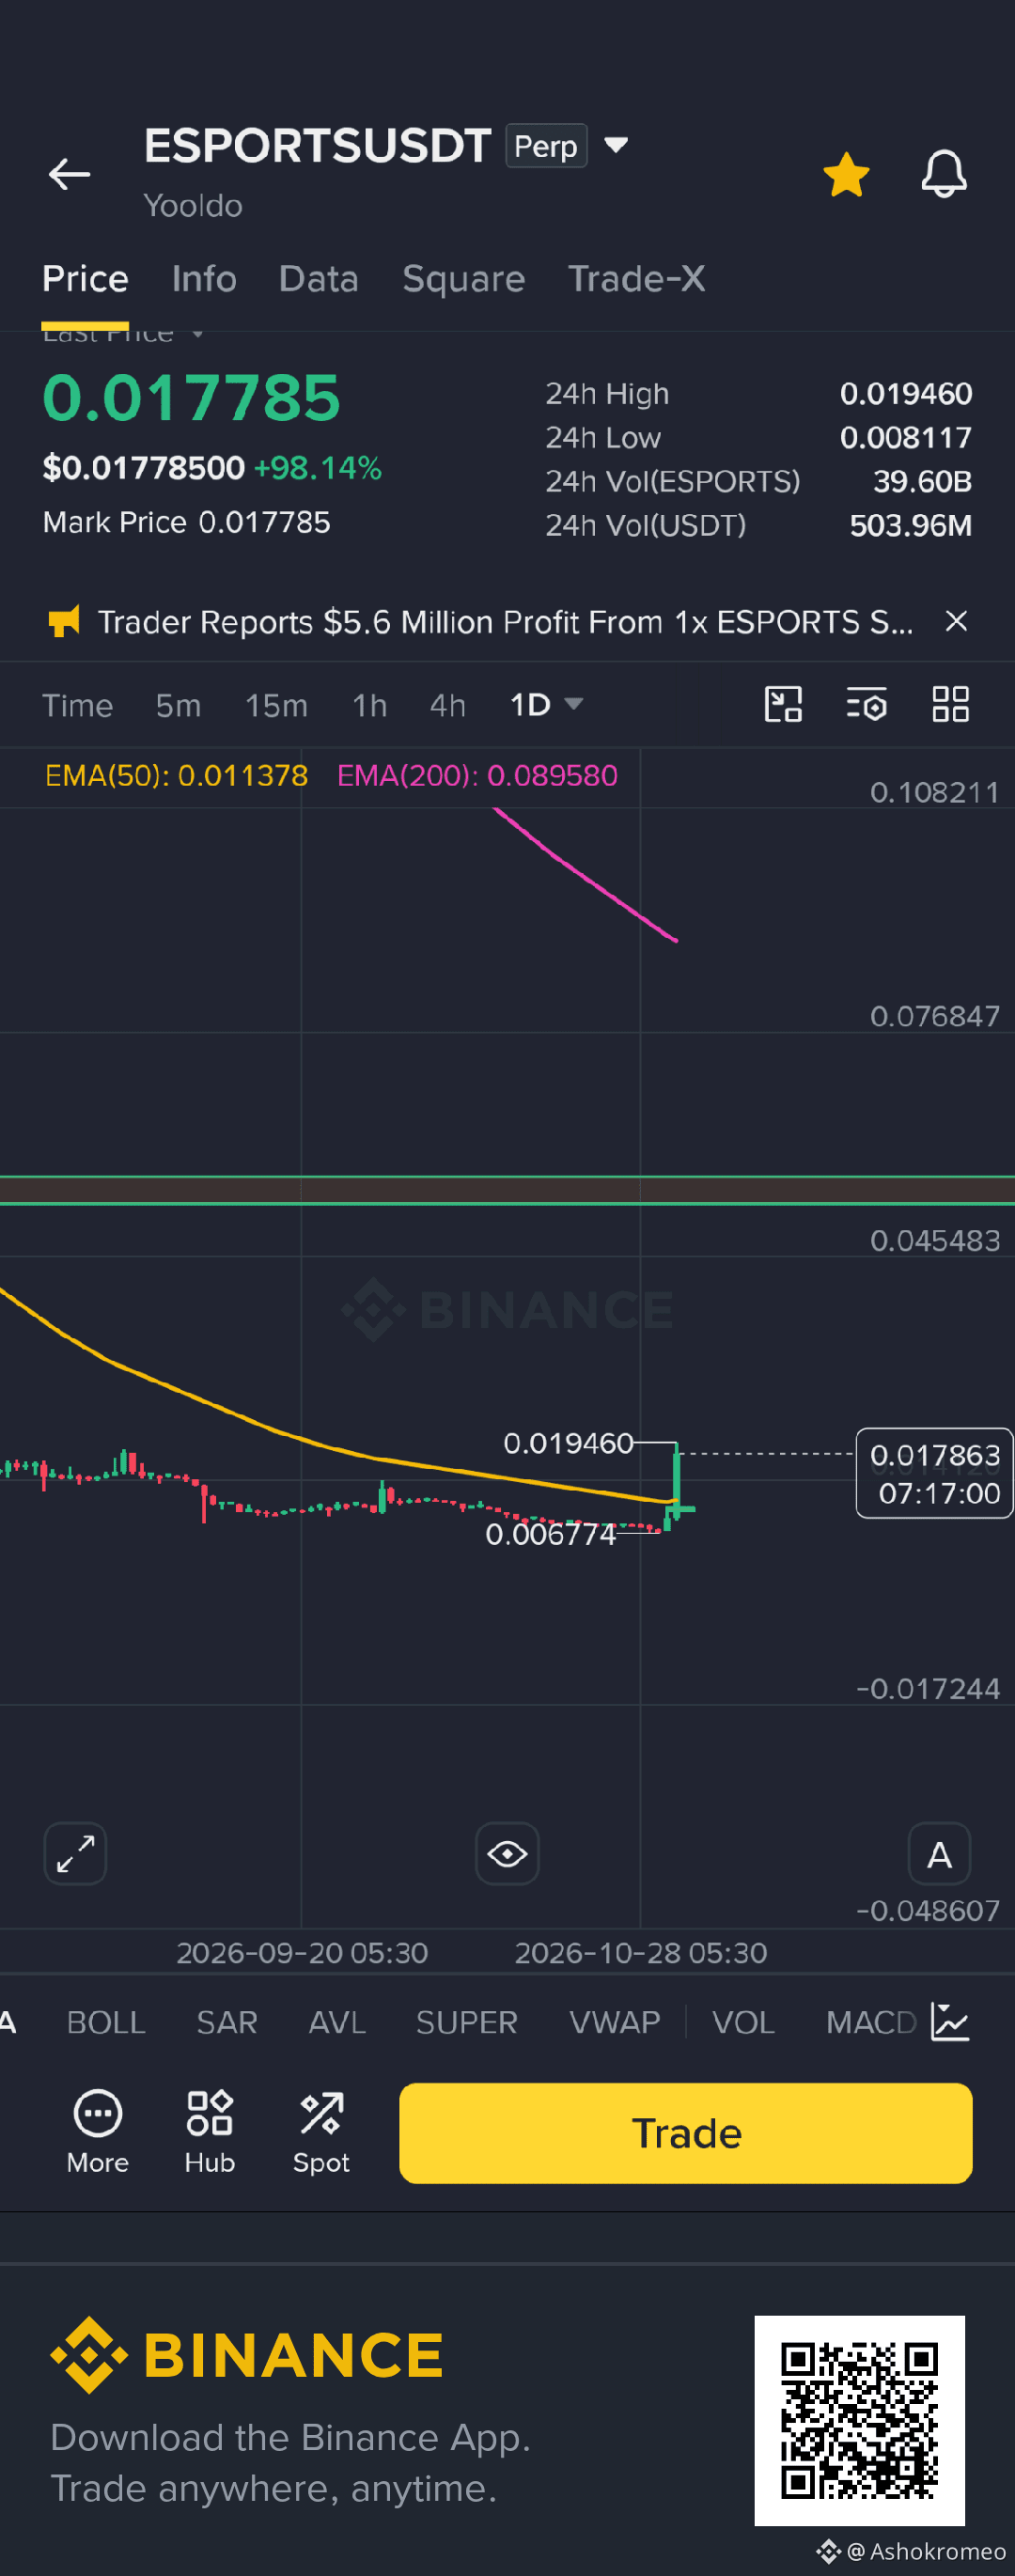
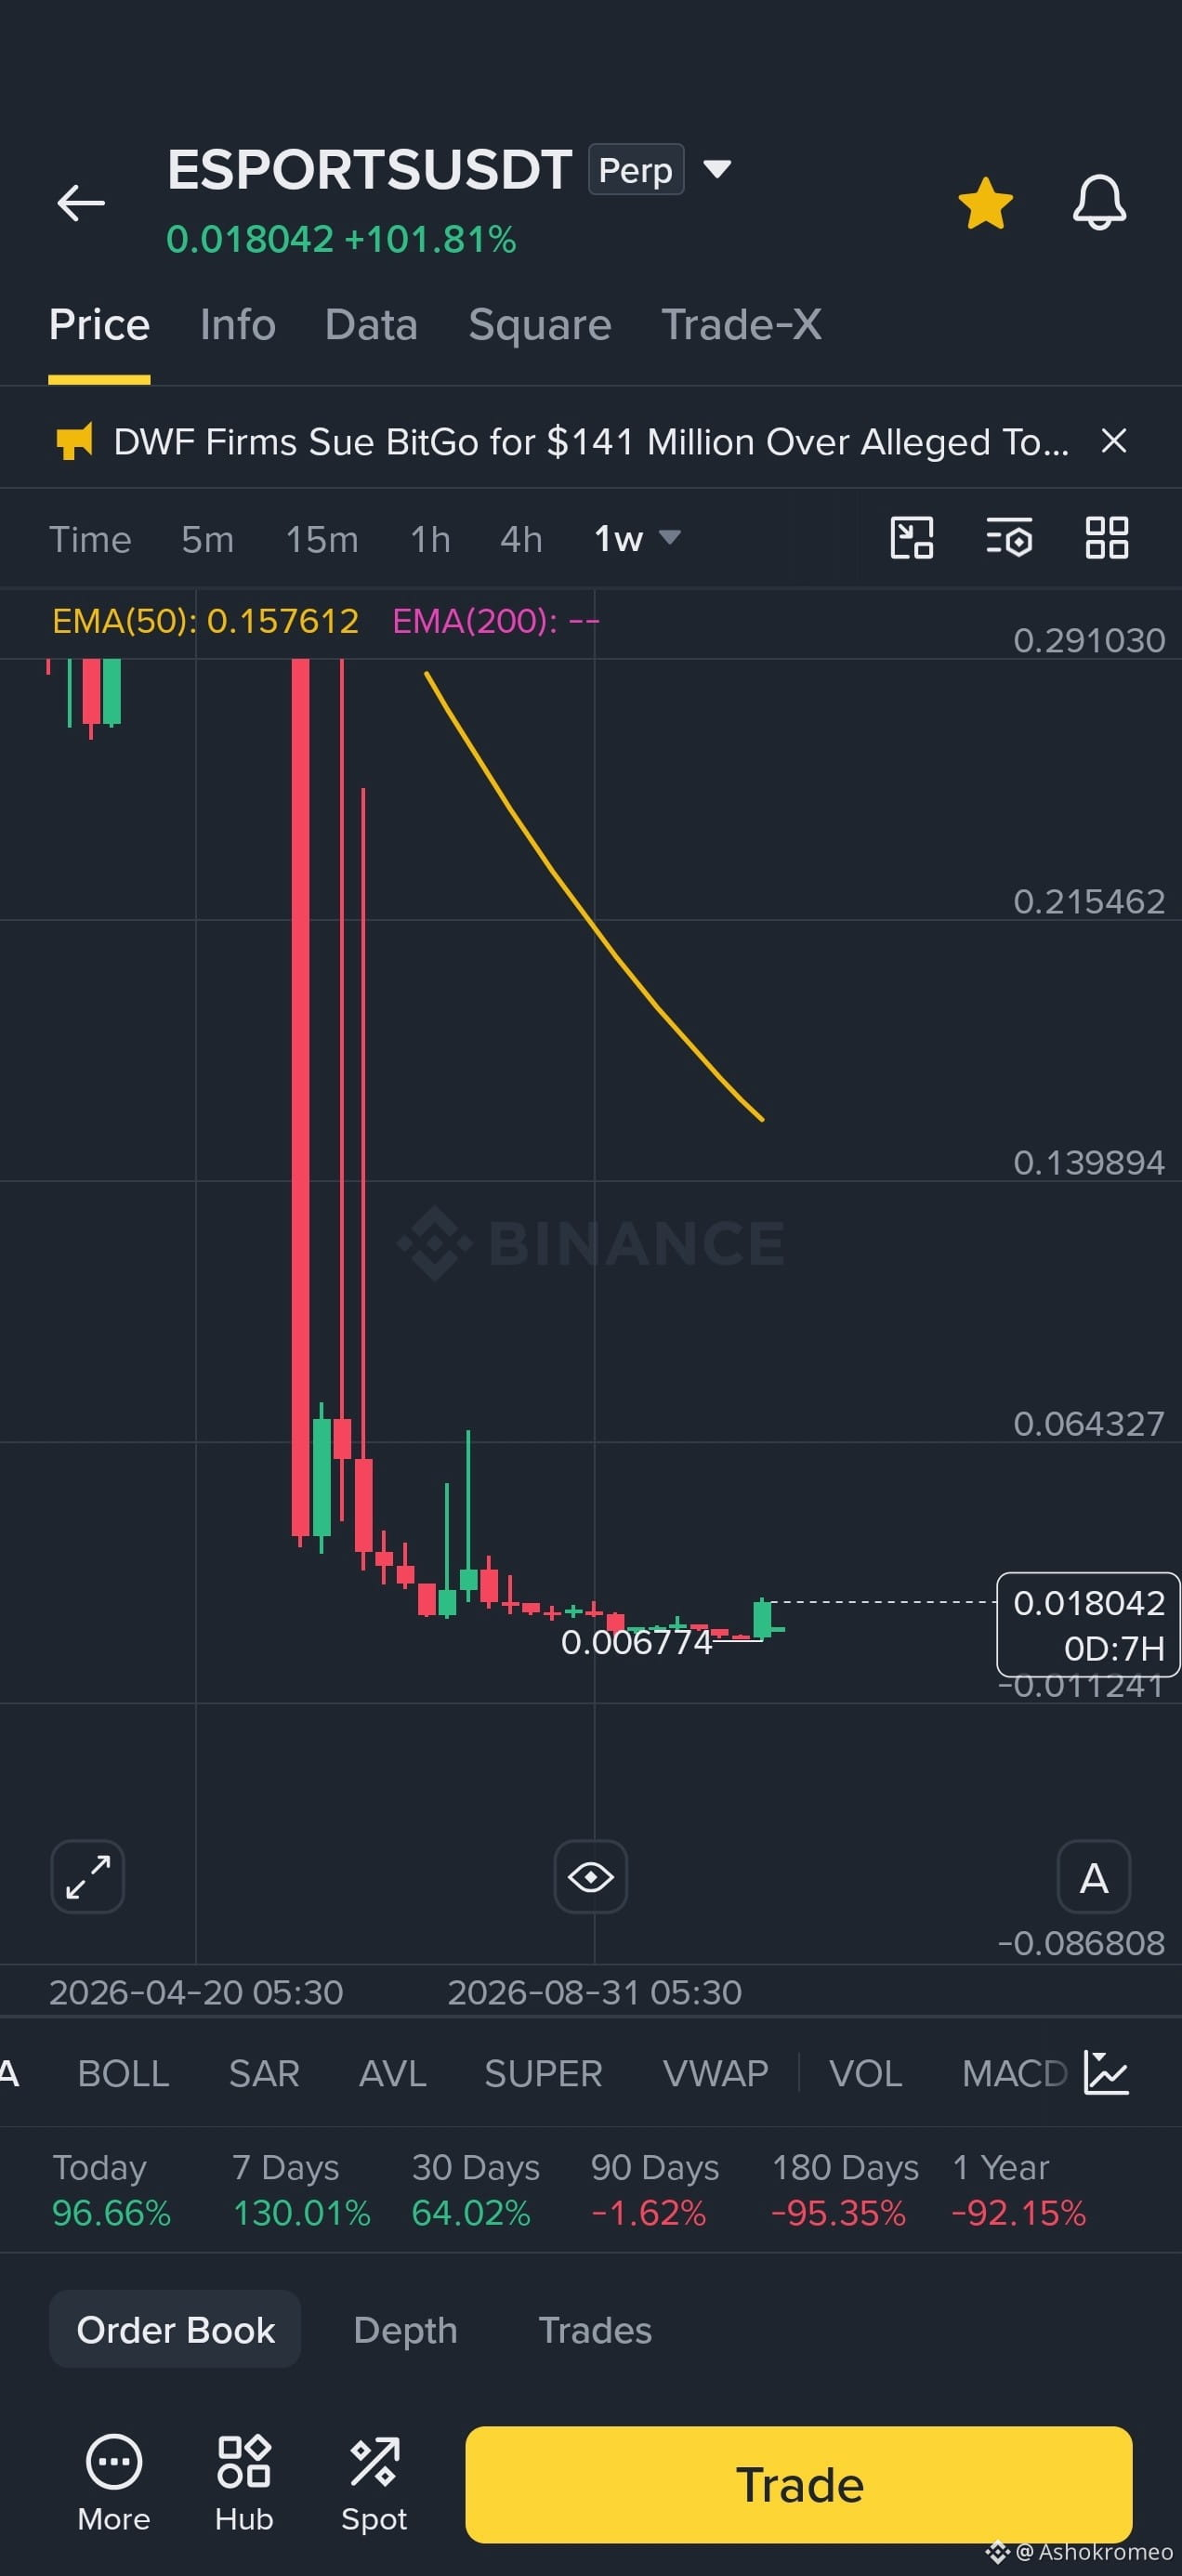
#ESPOPTSUSDT next resistance is to high level so time to moon according to 1D time frame
weekly looks good
what you think so comment your suggestion
$ESPORTS
$BTC
$ETH
#ESPOPTSUSDT next resistance is to high level so time to moon according to 1D time frame
weekly looks good
what you think so comment your suggestion
$ESPORTS
$BTC
$ETH
weekly looks good
what you think so comment your suggestion
$ESPORTS
$BTC
$ETH
336
·
--
Bärisch
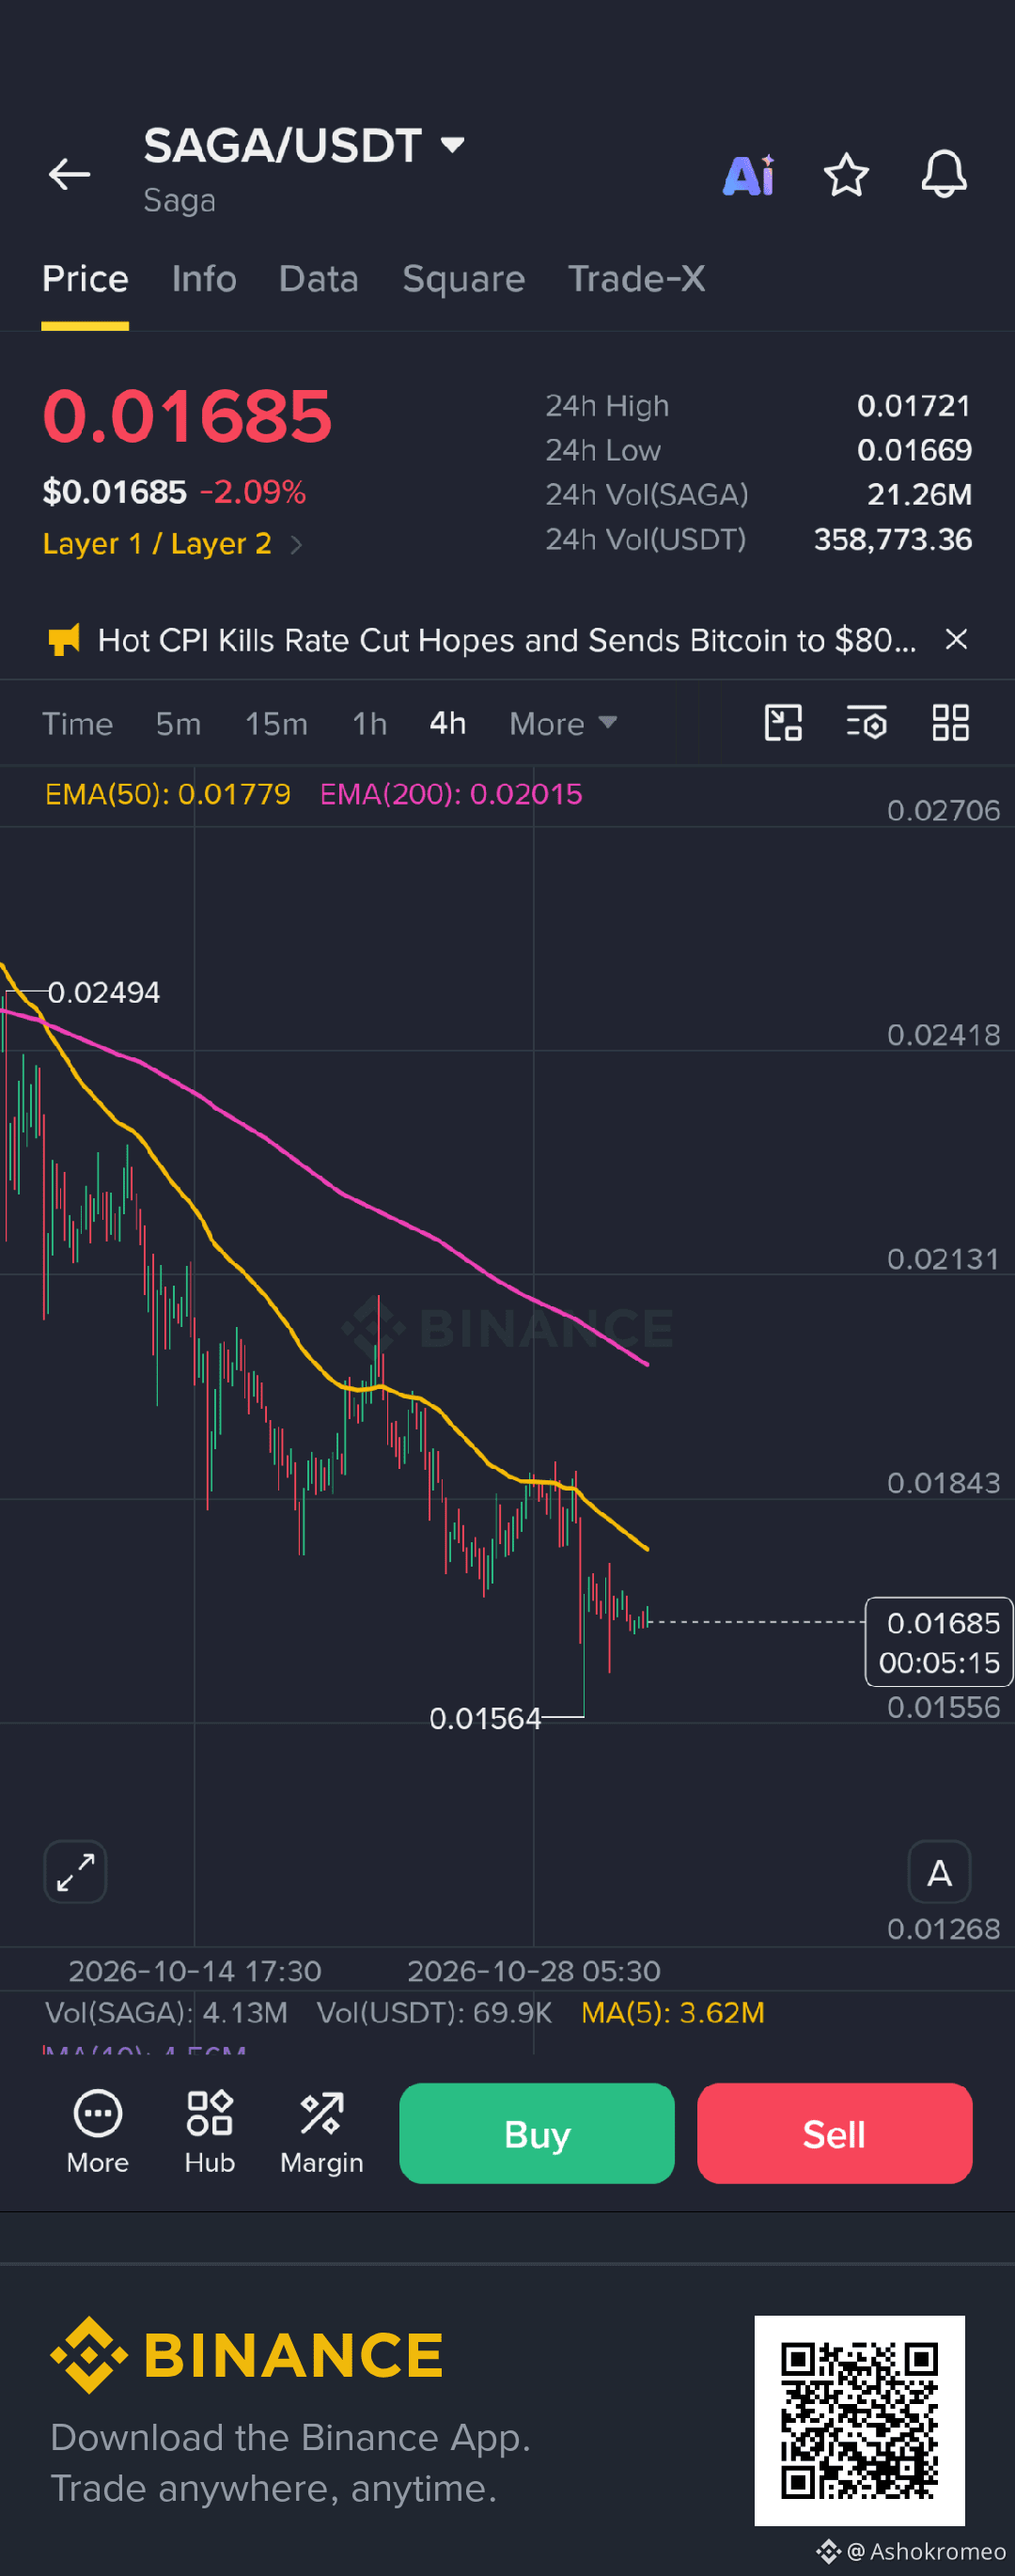
$SAGA
Der Abwärtstrend setzt sich fort,
also sei vorsichtig
$SAGA
Der Abwärtstrend setzt sich fort,
also sei vorsichtig
Der Abwärtstrend setzt sich fort,
also sei vorsichtig
282
·
--
Bärisch
Übersetzung ansehen
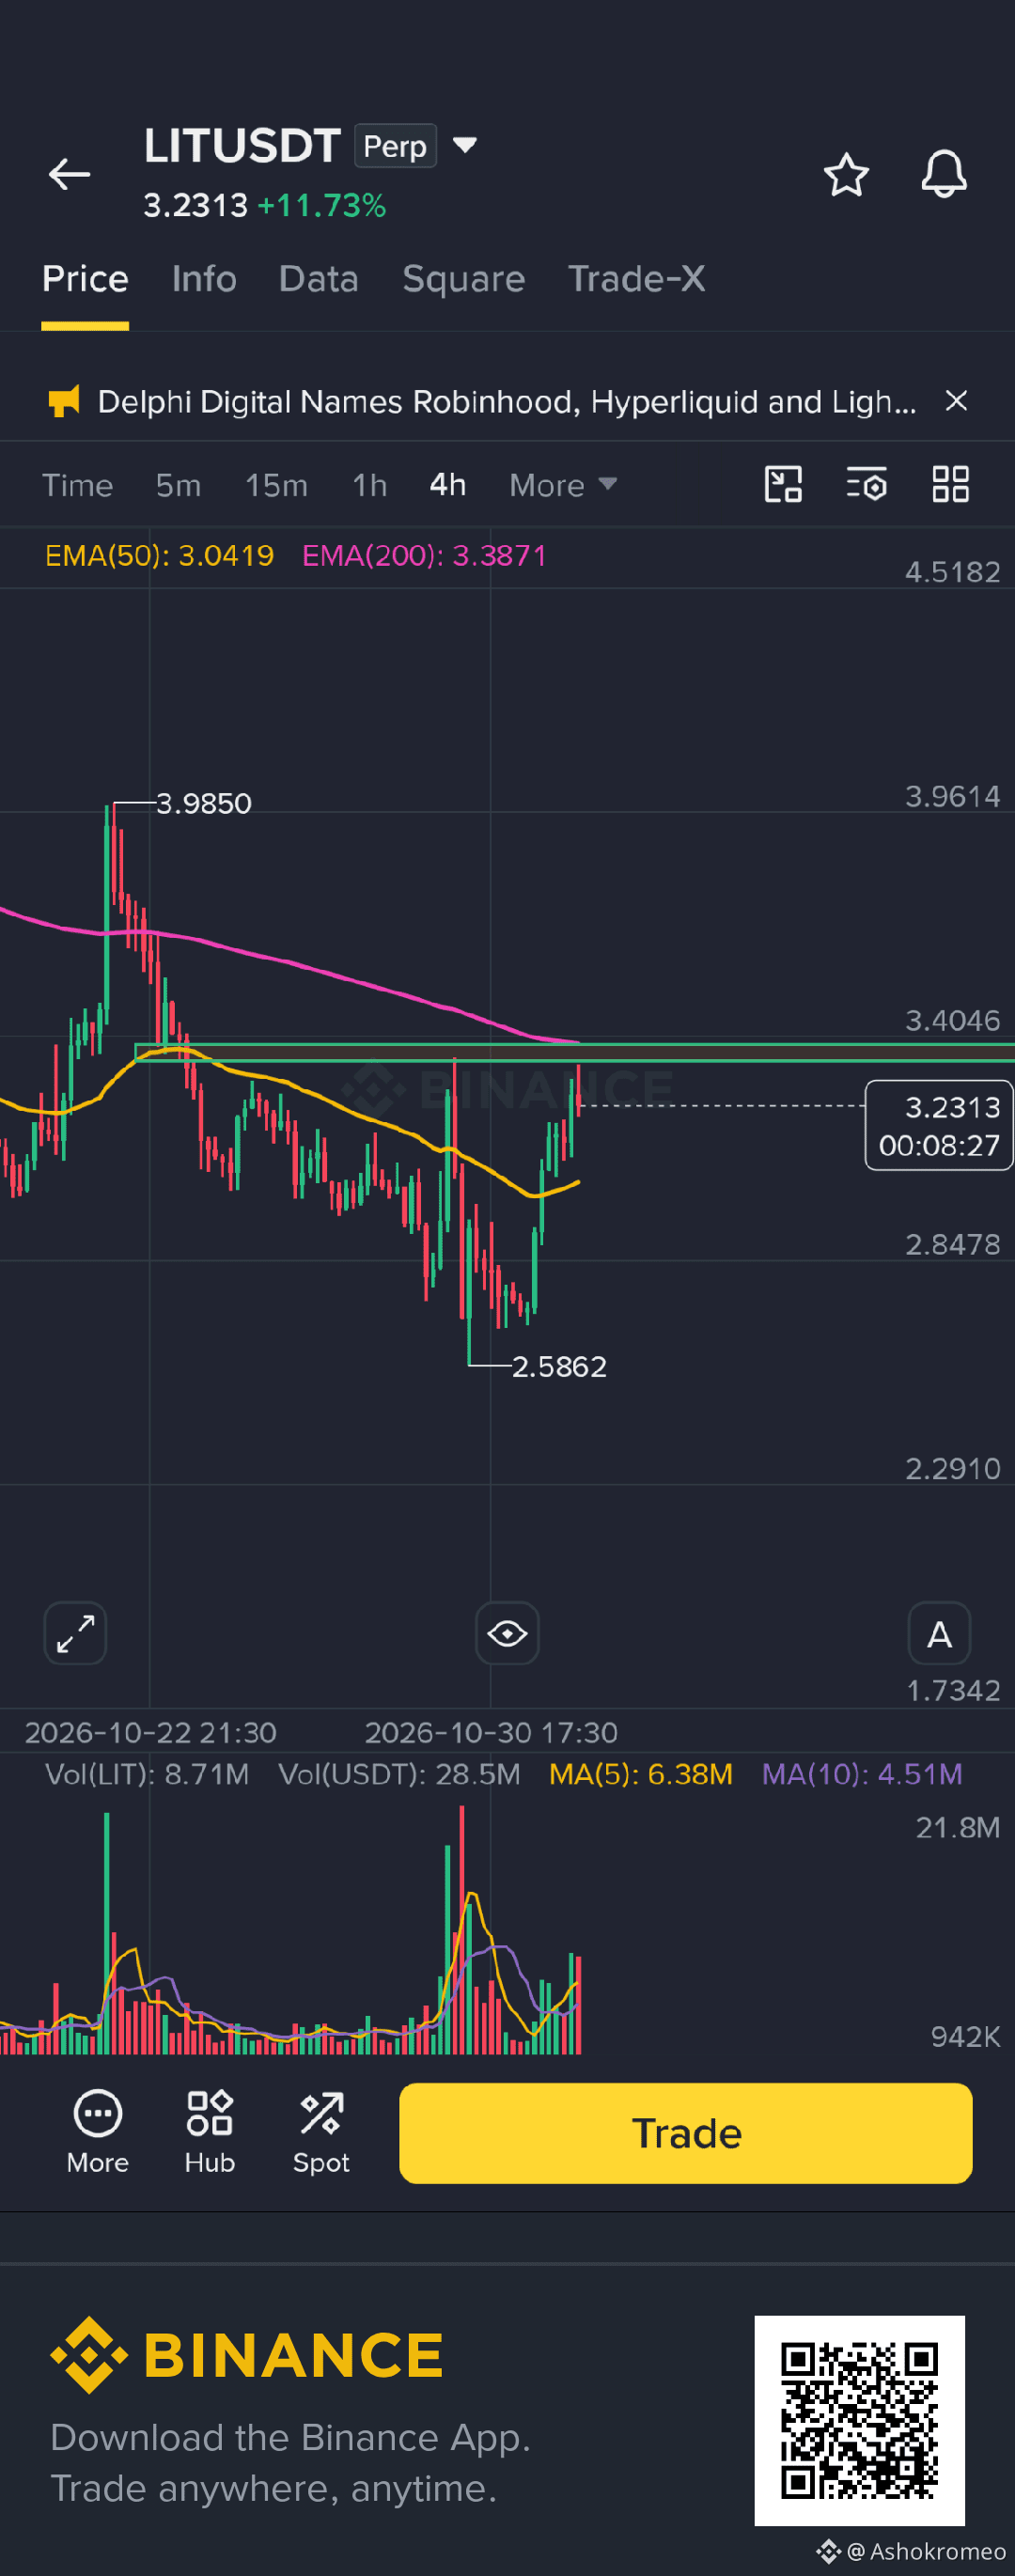
$LIT
resistance touch 2 time short time bearish
so take position on it right time
try to maintain risk reward according to you
$LIT
resistance touch 2 time short time bearish
so take position on it right time
try to maintain risk reward according to you
resistance touch 2 time short time bearish
so take position on it right time
try to maintain risk reward according to you
56
·
--
Bullisch
Übersetzung ansehen
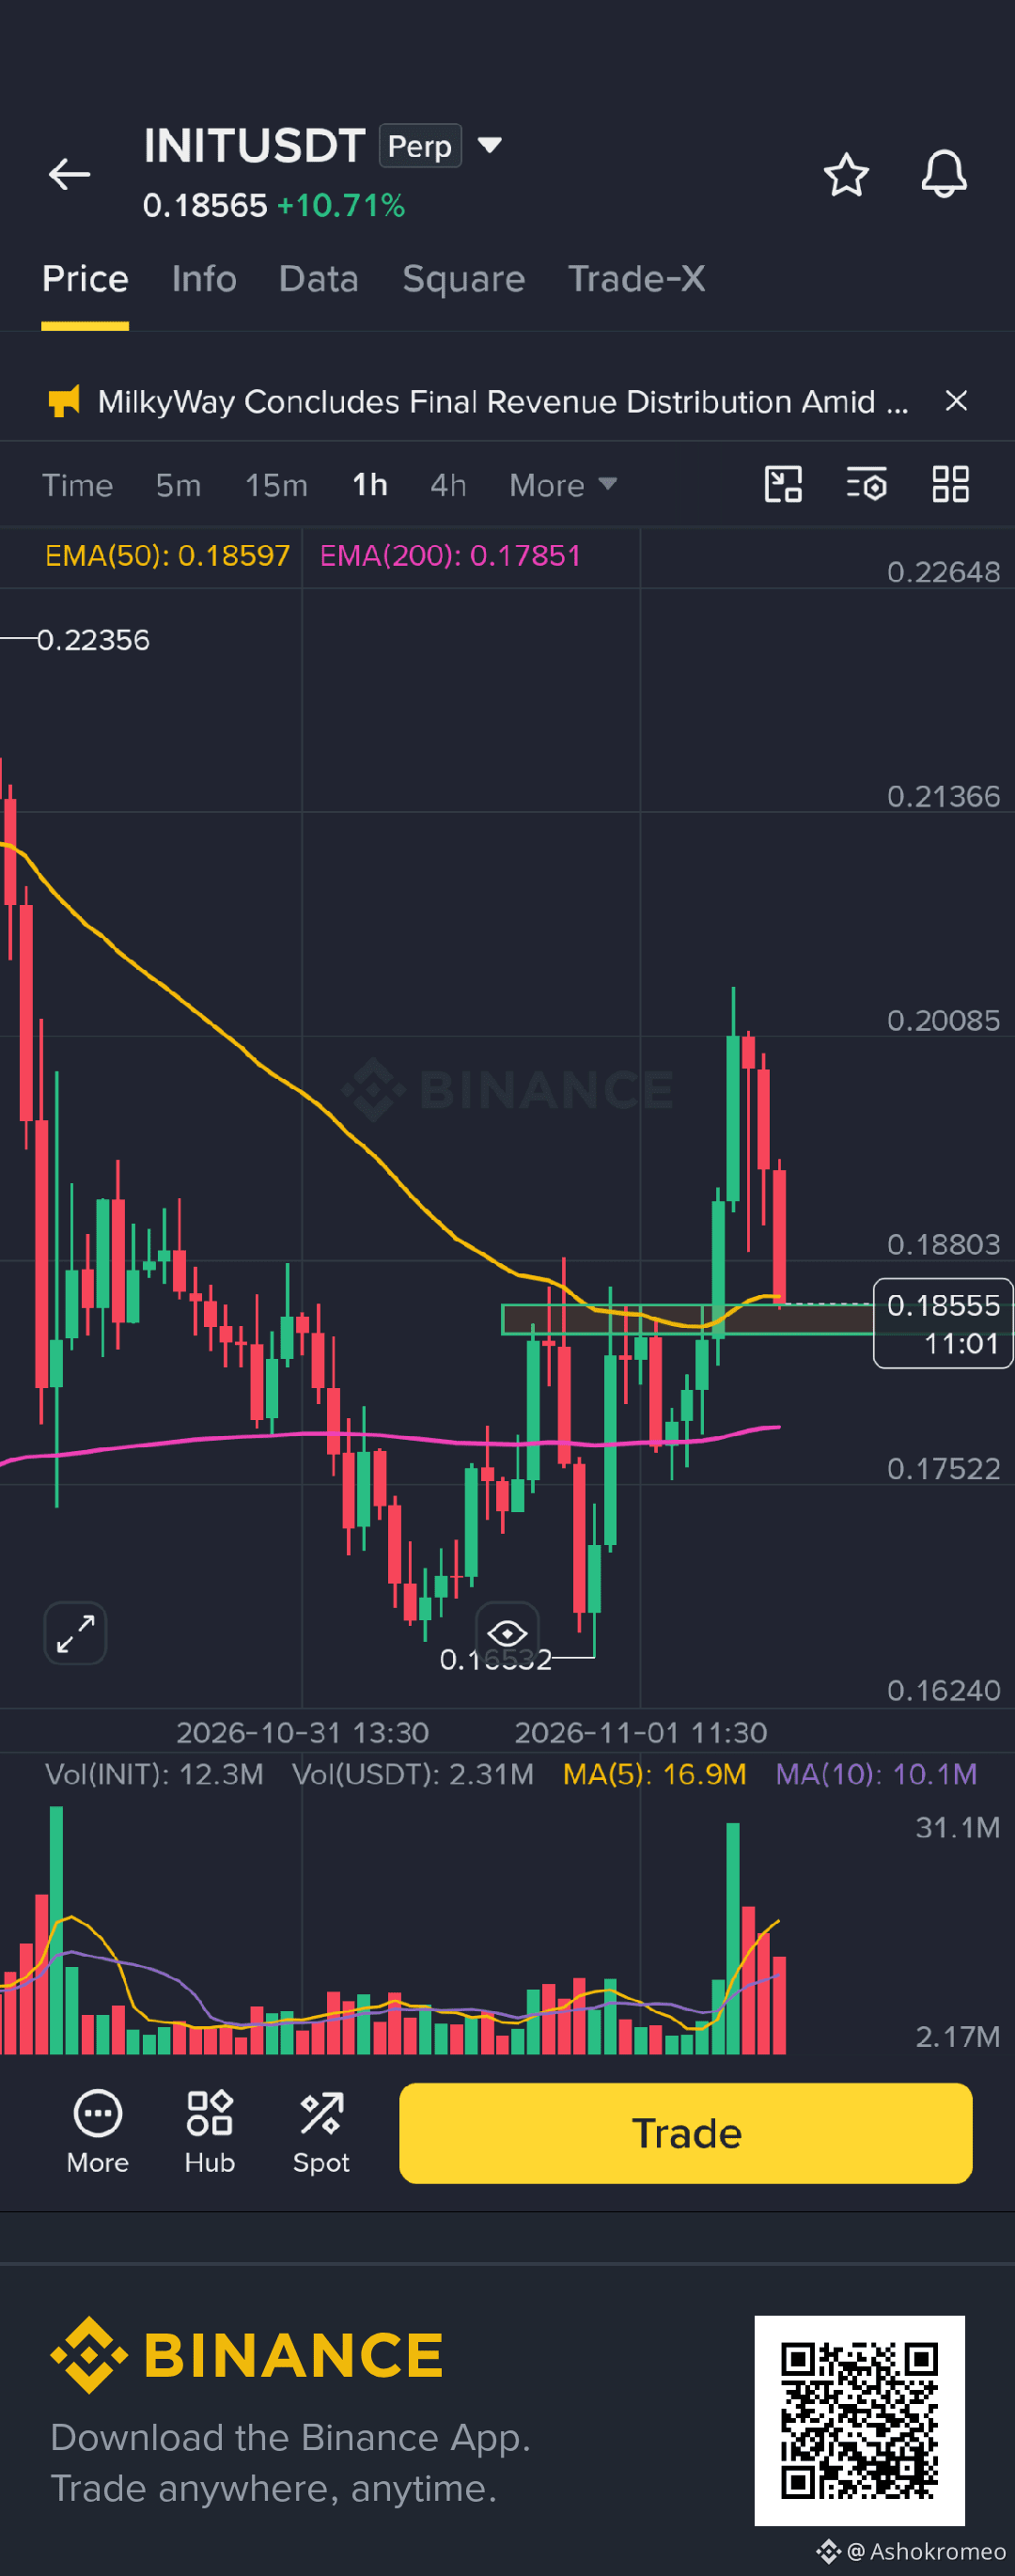
$INIT
resistance broken trying to take support then boom
stay focus
stay tune
$INIT
resistance broken trying to take support then boom
stay focus
stay tune
resistance broken trying to take support then boom
stay focus
stay tune
1
118
·
--
Bullisch
Übersetzung ansehen
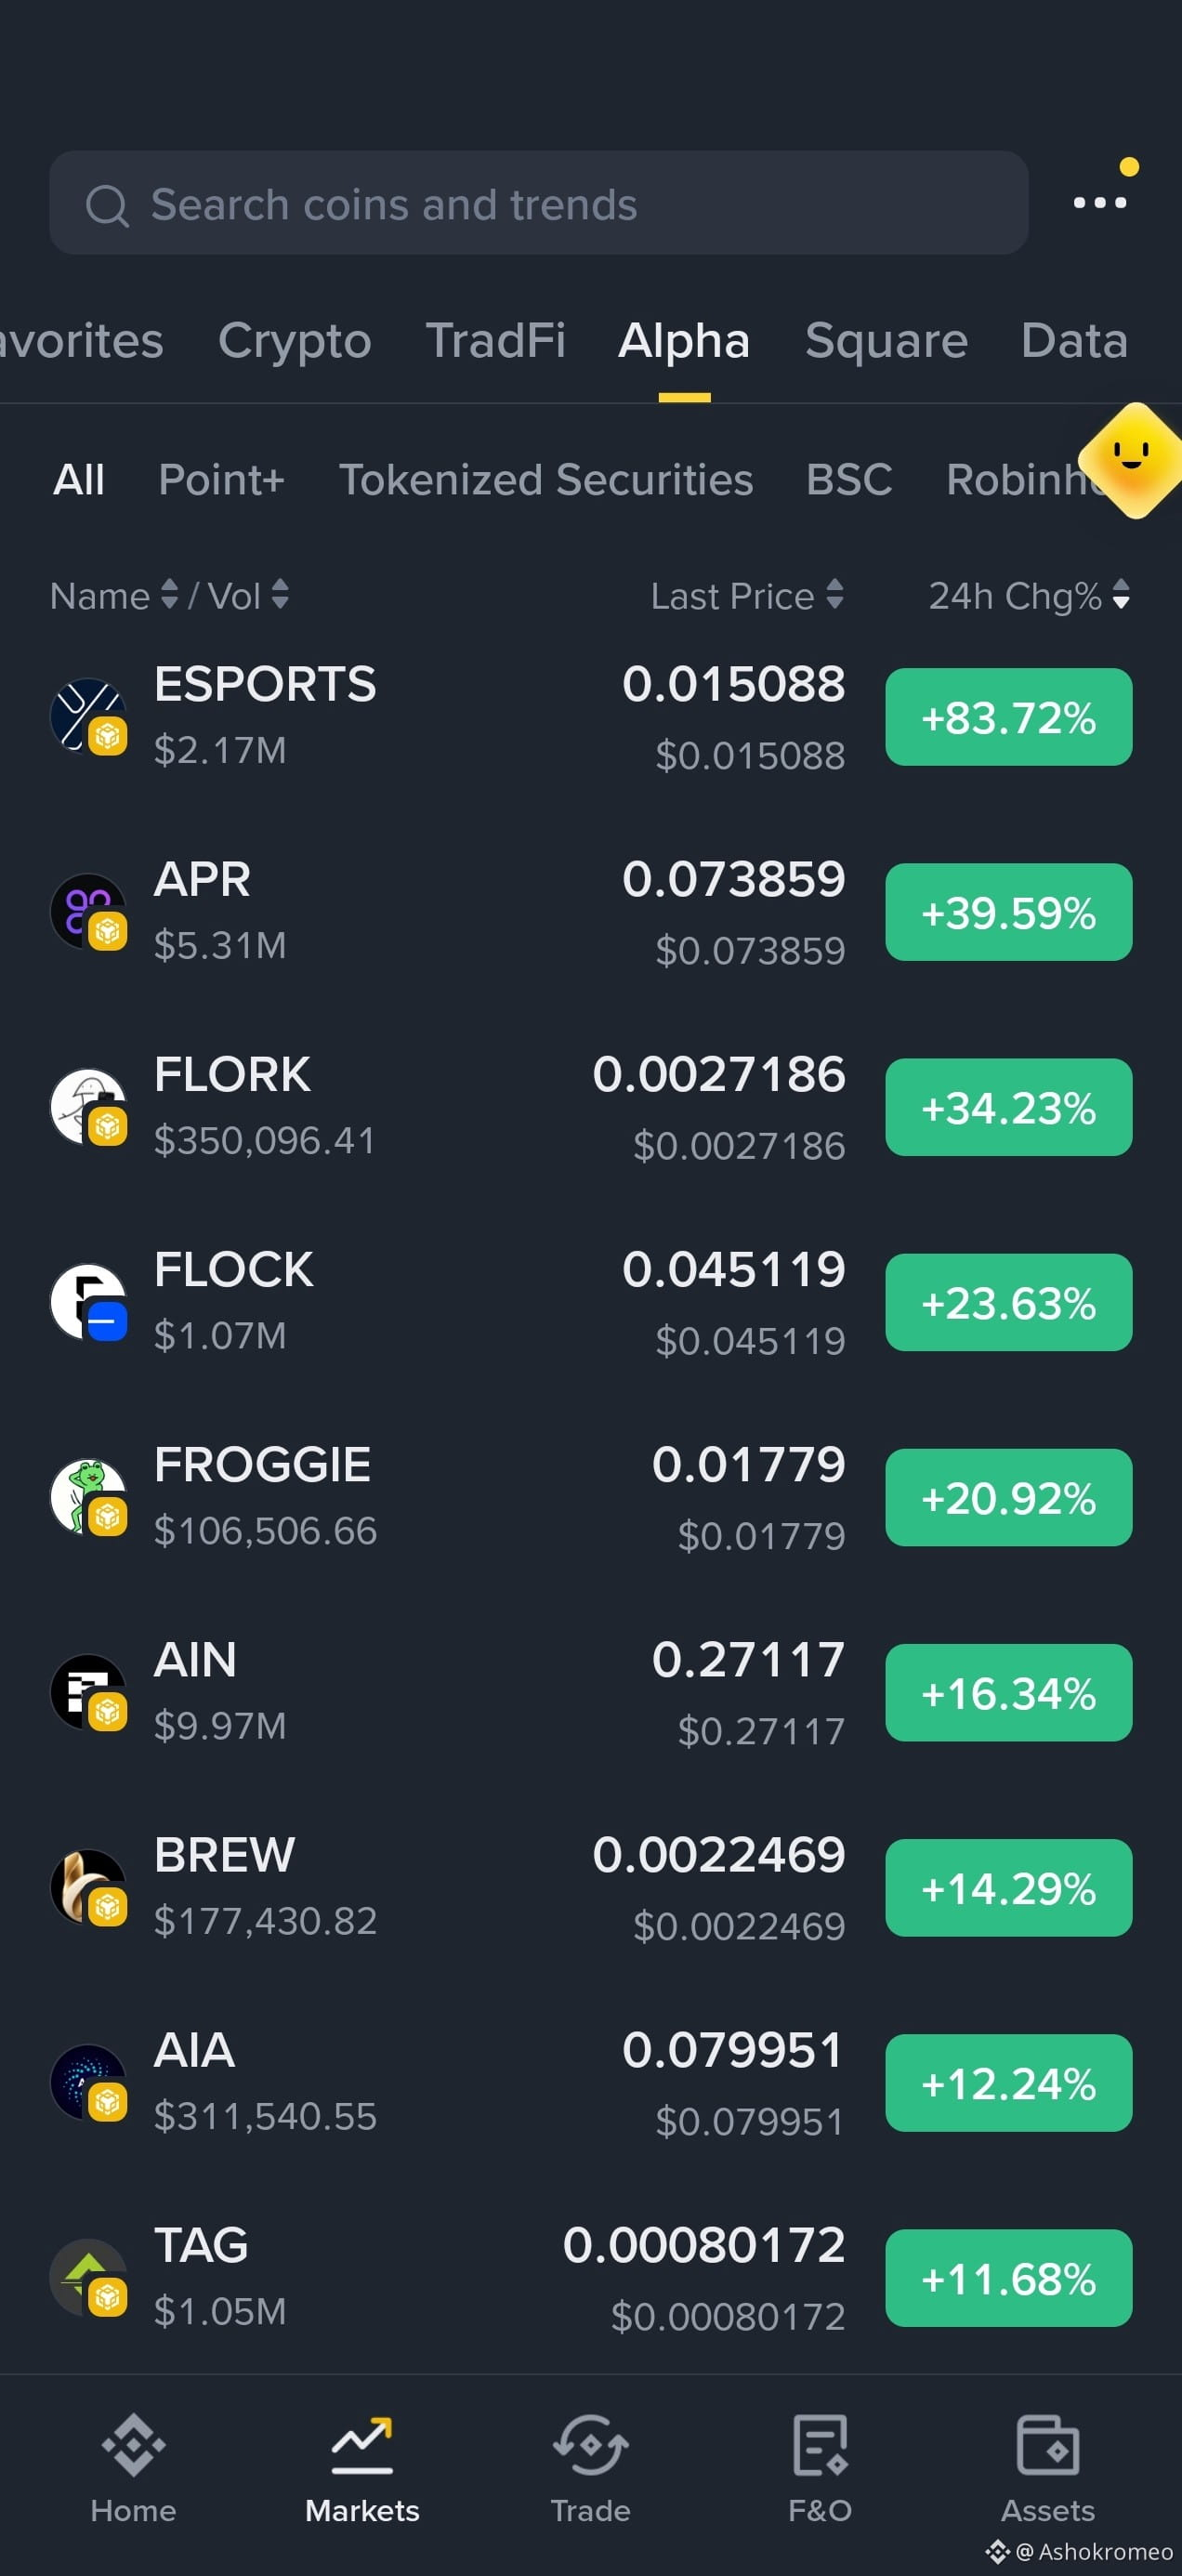
#BinanceToResumePhaseOneOfWithdrawals
alpha trading now days
focus it for long term view
I'm very bullish this time
$FLOCK
$FROGGIE
$AIN
#flock
#froggie
#AIN
#BinanceToResumePhaseOneOfWithdrawals
alpha trading now days
focus it for long term view
I'm very bullish this time
$FLOCK
$FROGGIE
$AIN
#flock
#froggie
#AIN
alpha trading now days
focus it for long term view
I'm very bullish this time
$FLOCK
$FROGGIE
$AIN
#flock
#froggie
#AIN
544
·
--
Bullisch
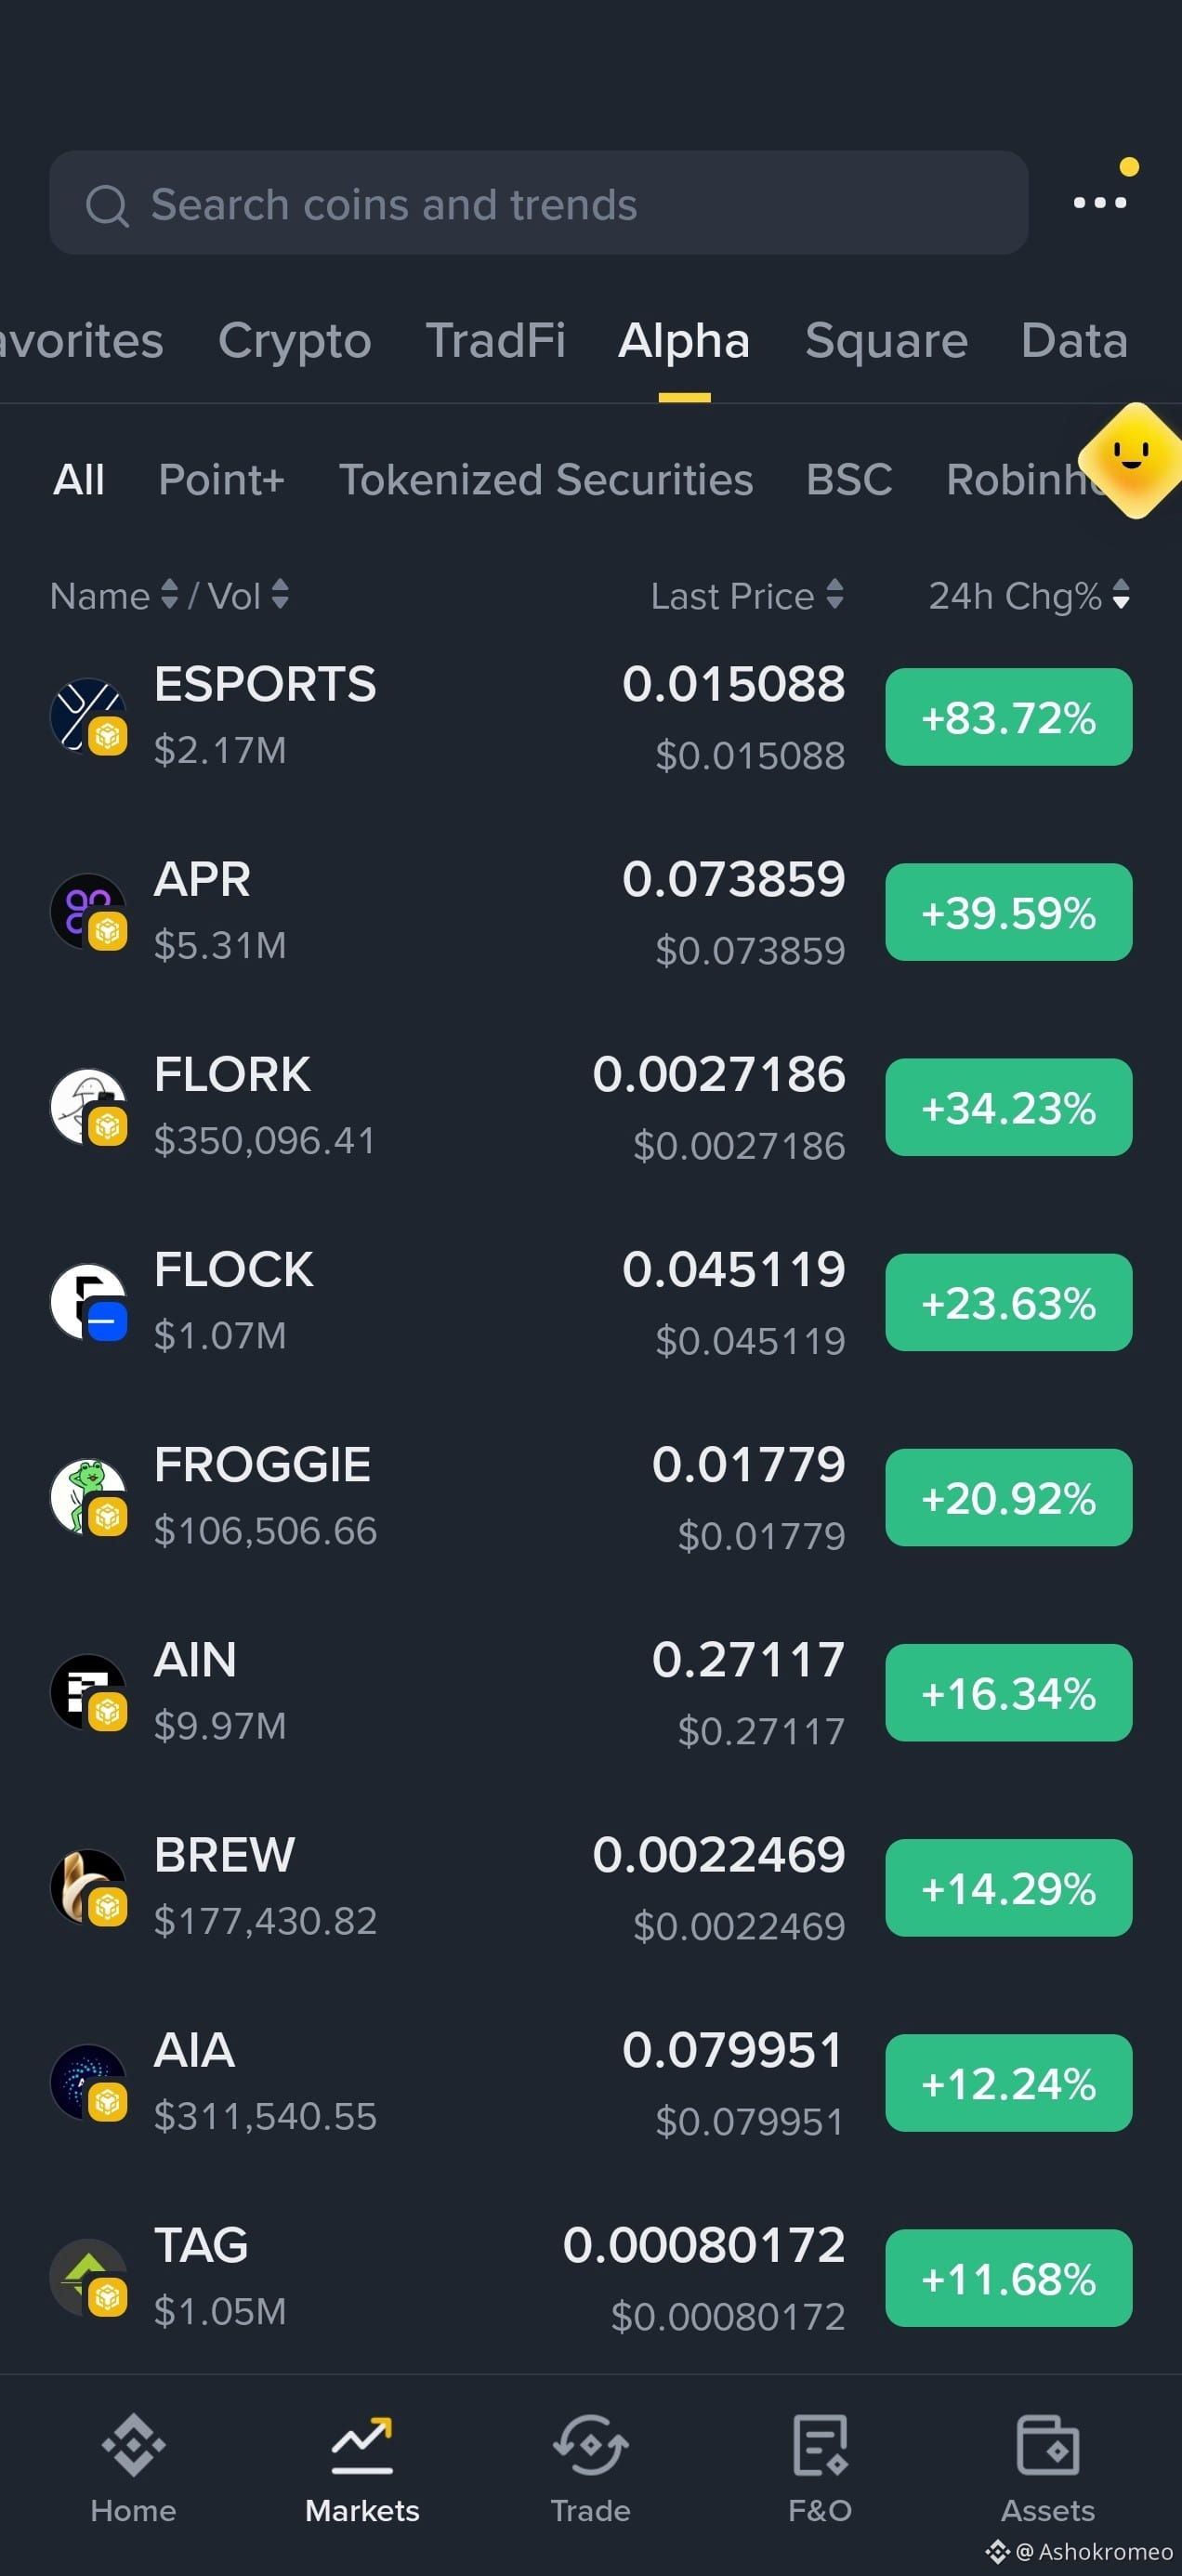
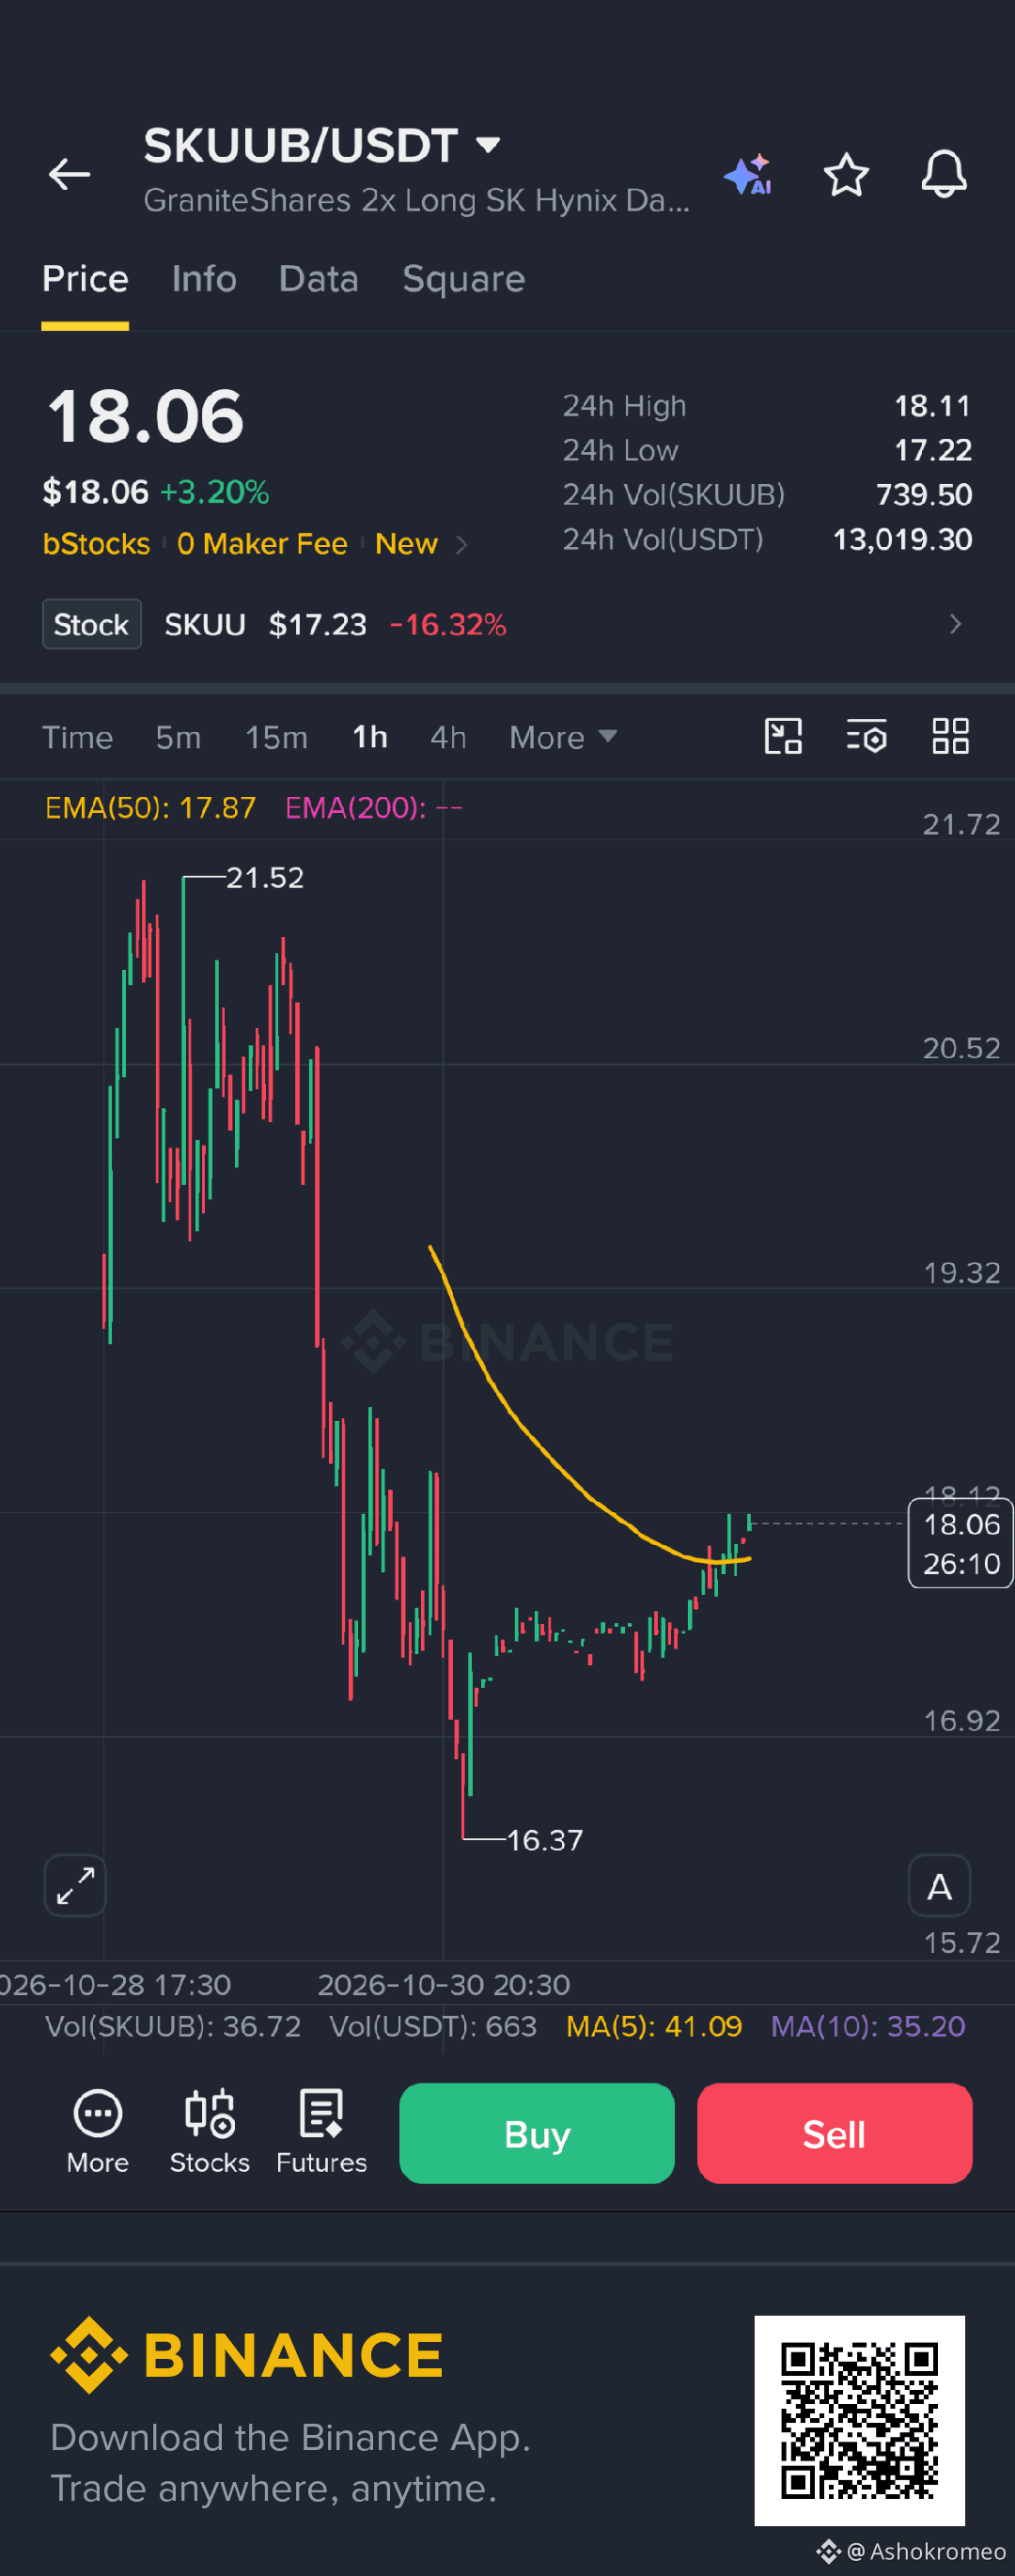
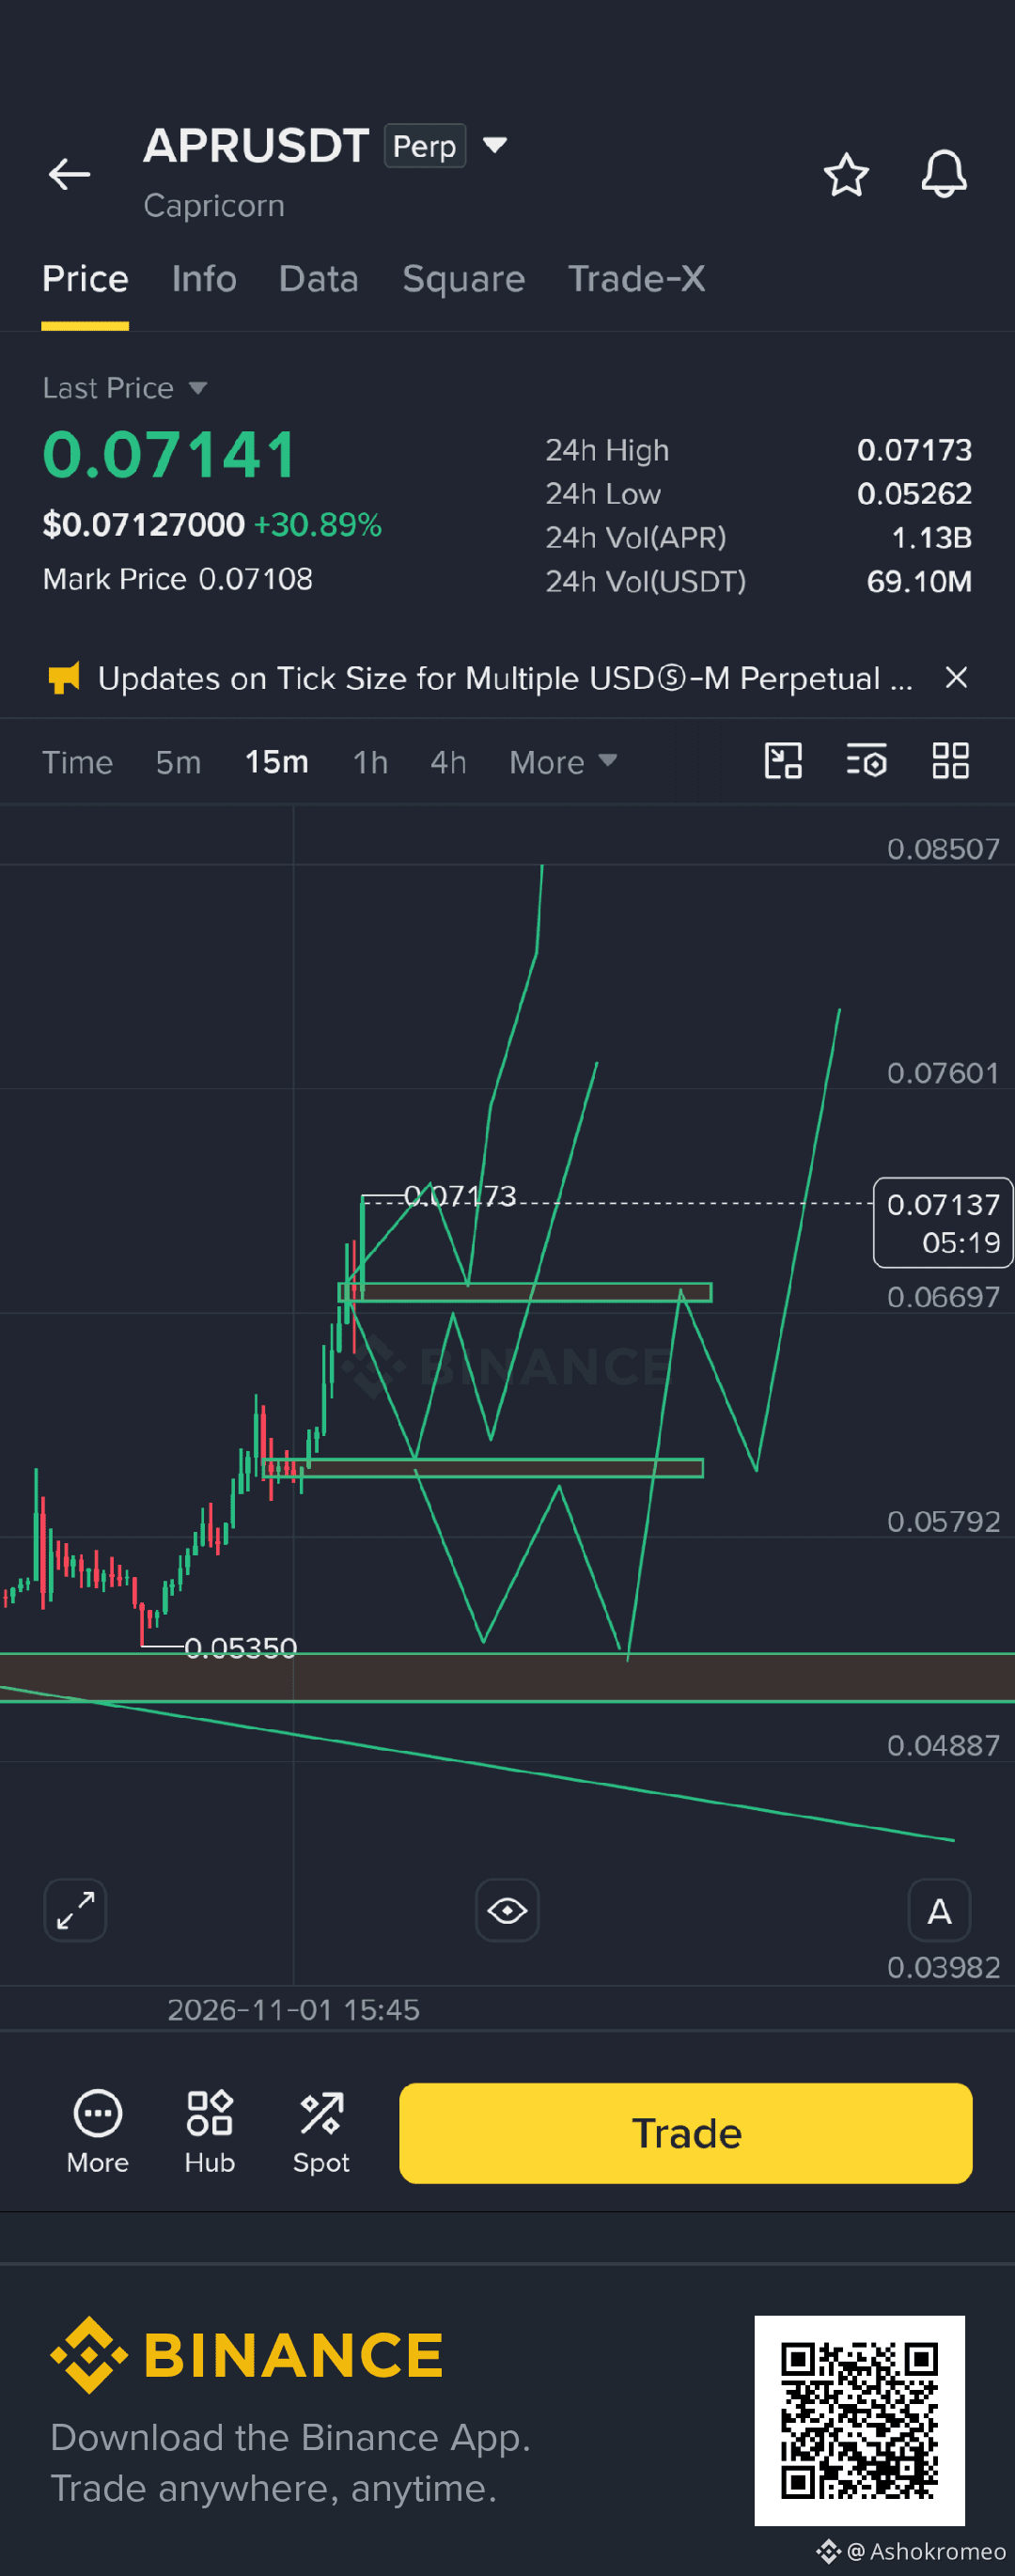
Alpha Coin bewegt sich schnell
Alpha Coins ist bullisch
$ESPORTS
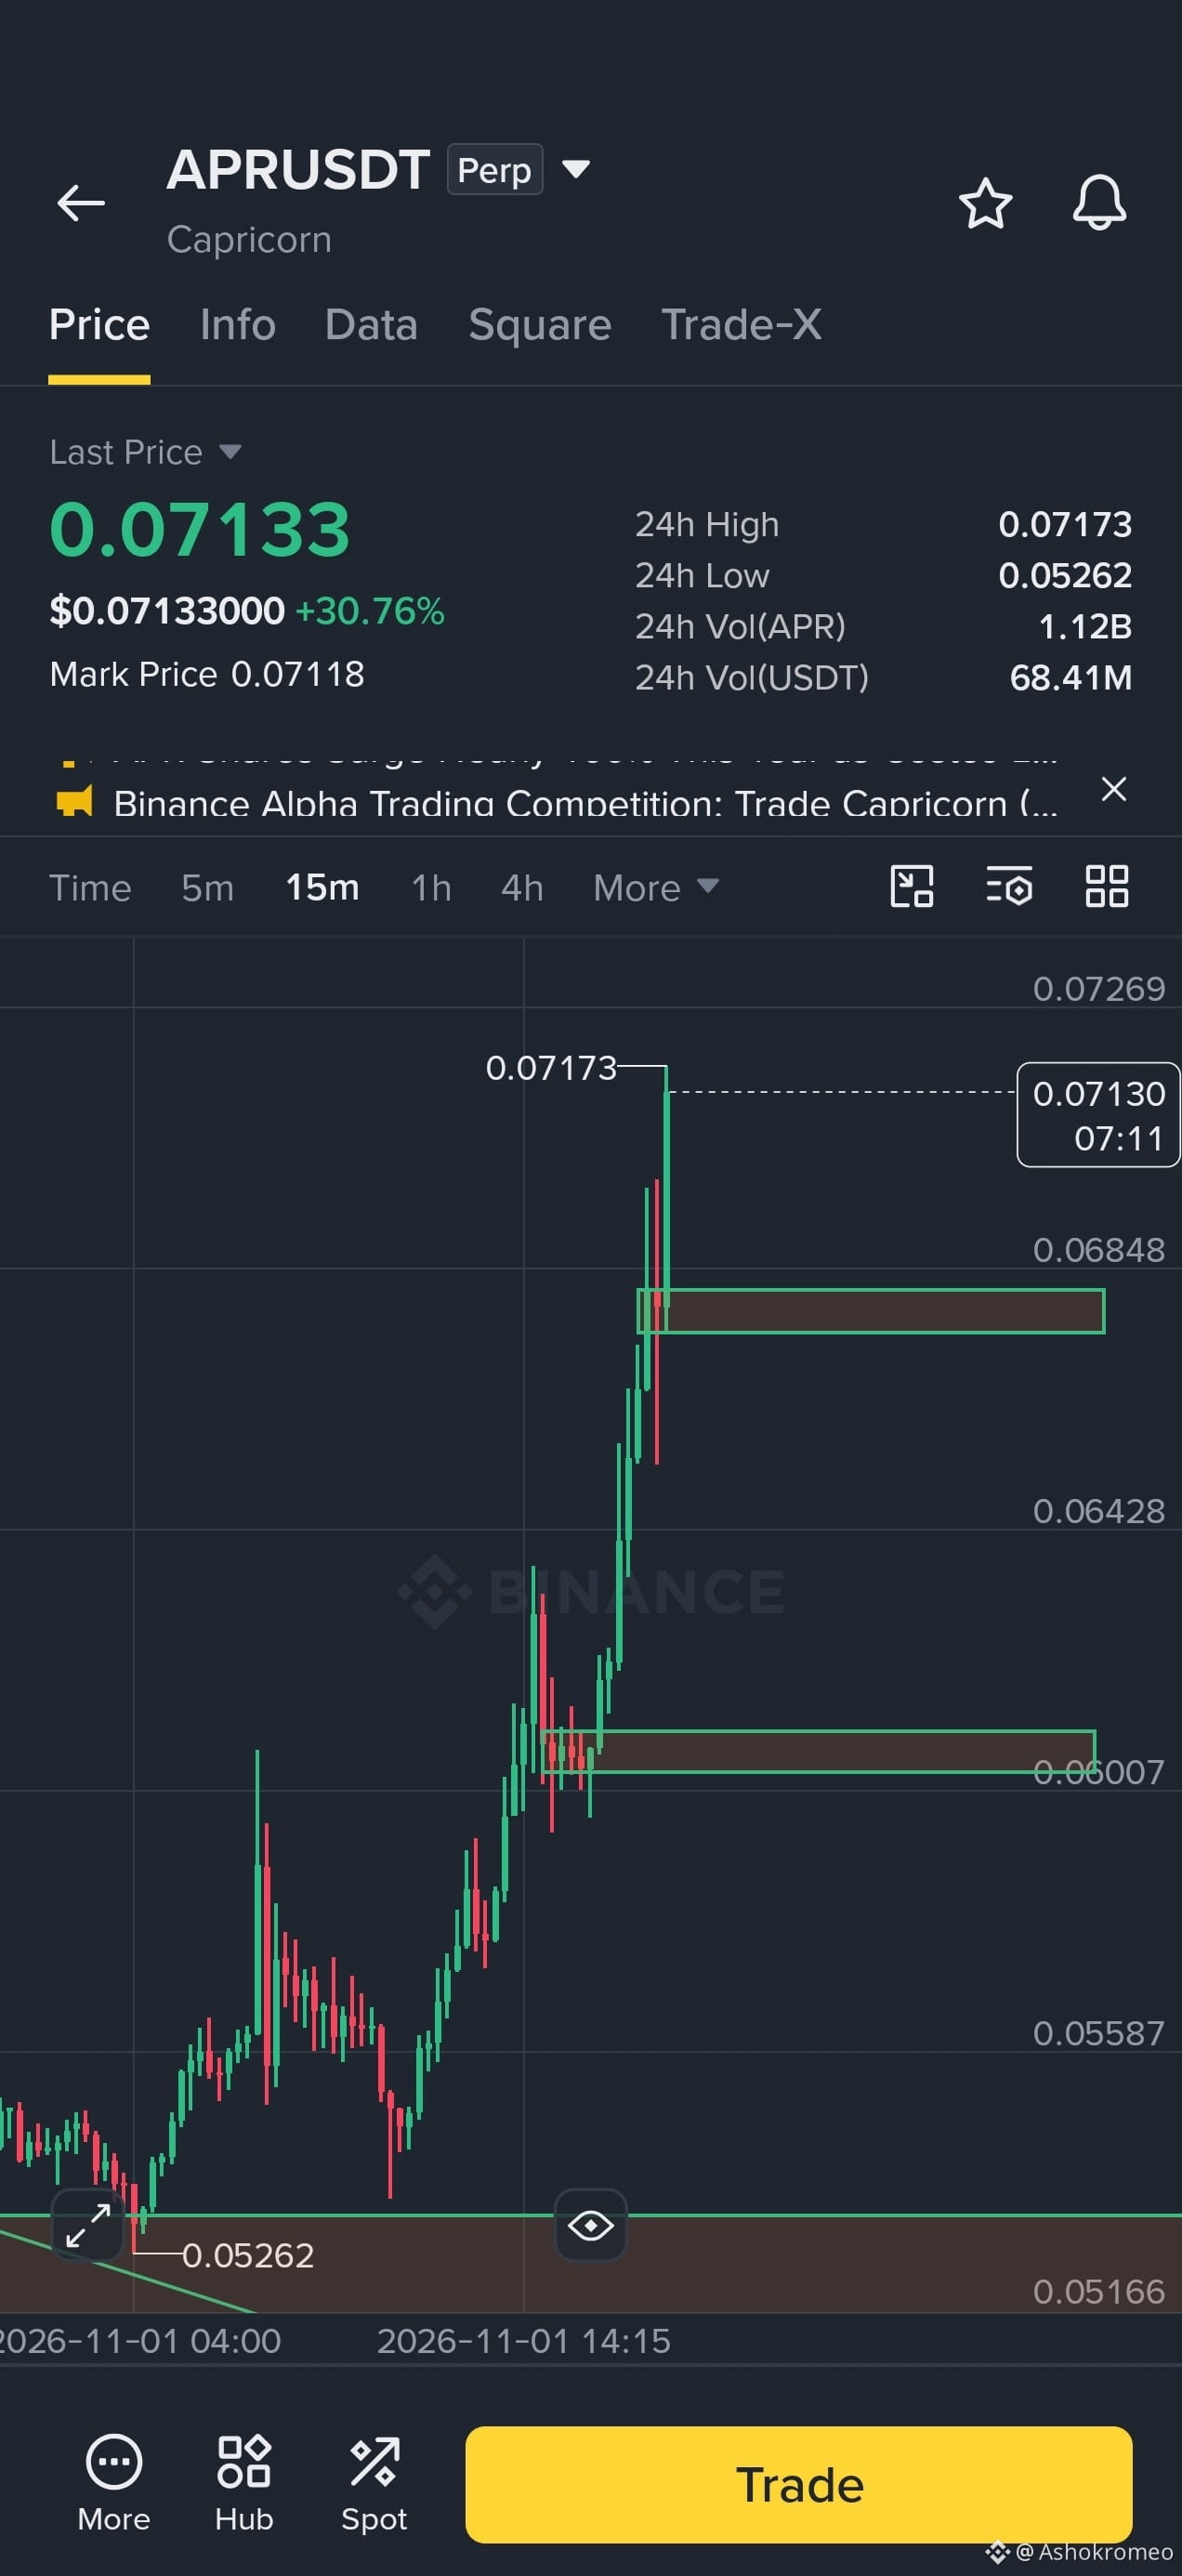
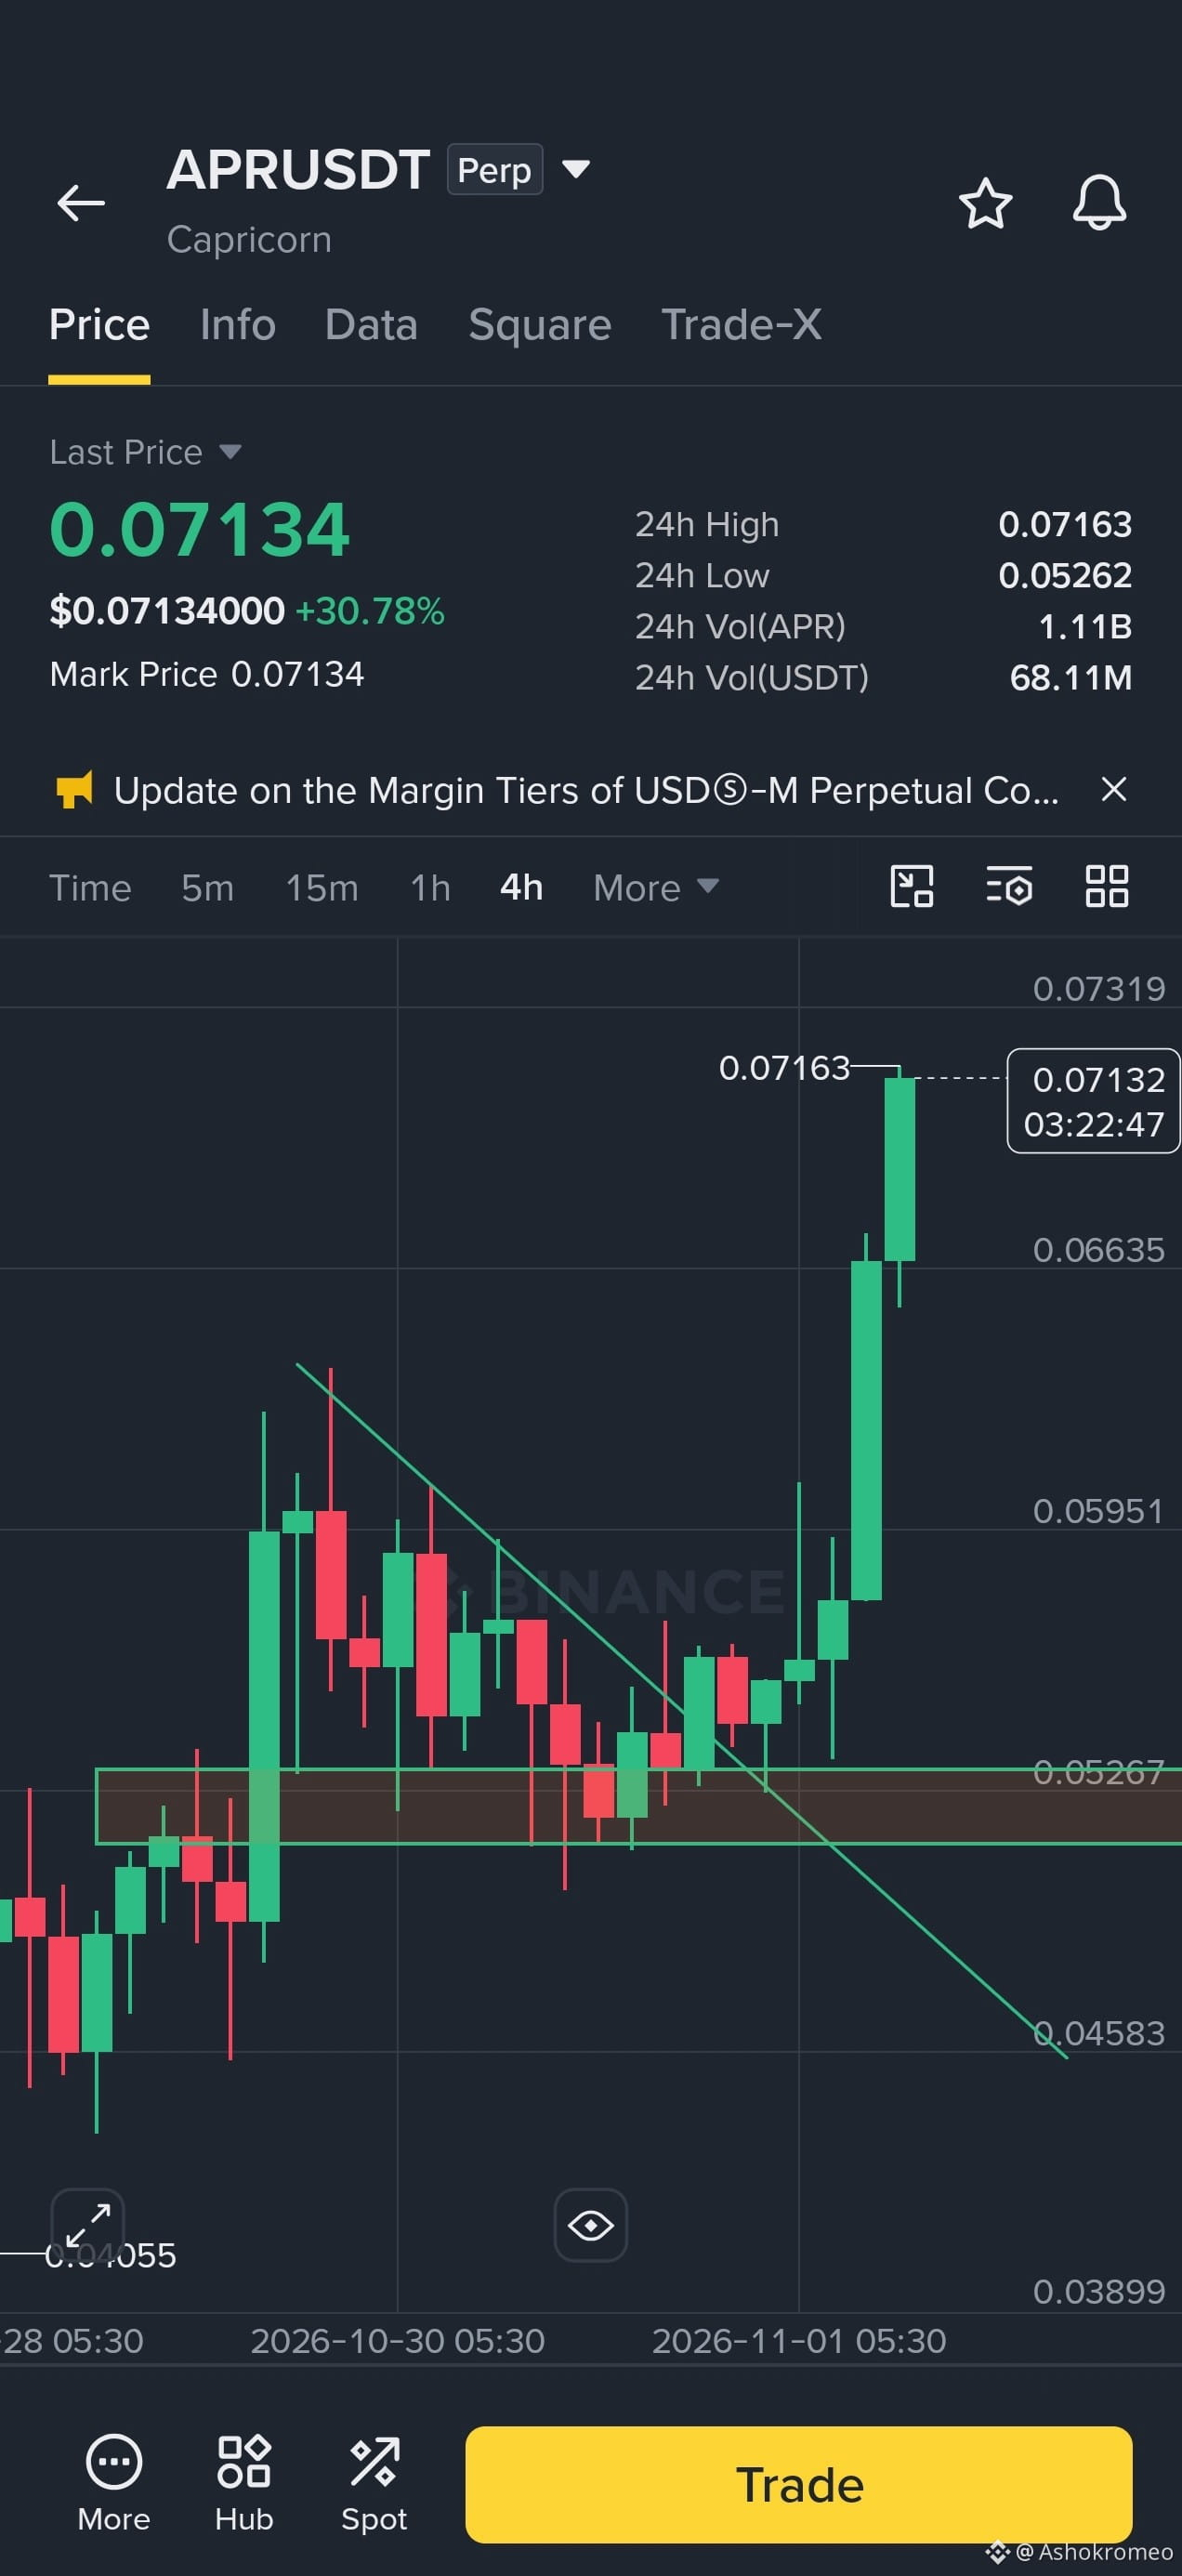
$APR
$FLORK
#ESPOPTSUSDT
#APR
#flork
#BinanceToResumePhaseOneOfWithdrawals
Alpha Coin bewegt sich schnell
Alpha Coins ist bullisch
$ESPORTS
$APR
$FLORK
#ESPOPTSUSDT
#APR
#flork
#BinanceToResumePhaseOneOfWithdrawals
Alpha Coins ist bullisch
$ESPORTS
$APR
$FLORK
#ESPOPTSUSDT
#APR
#flork
#BinanceToResumePhaseOneOfWithdrawals
563
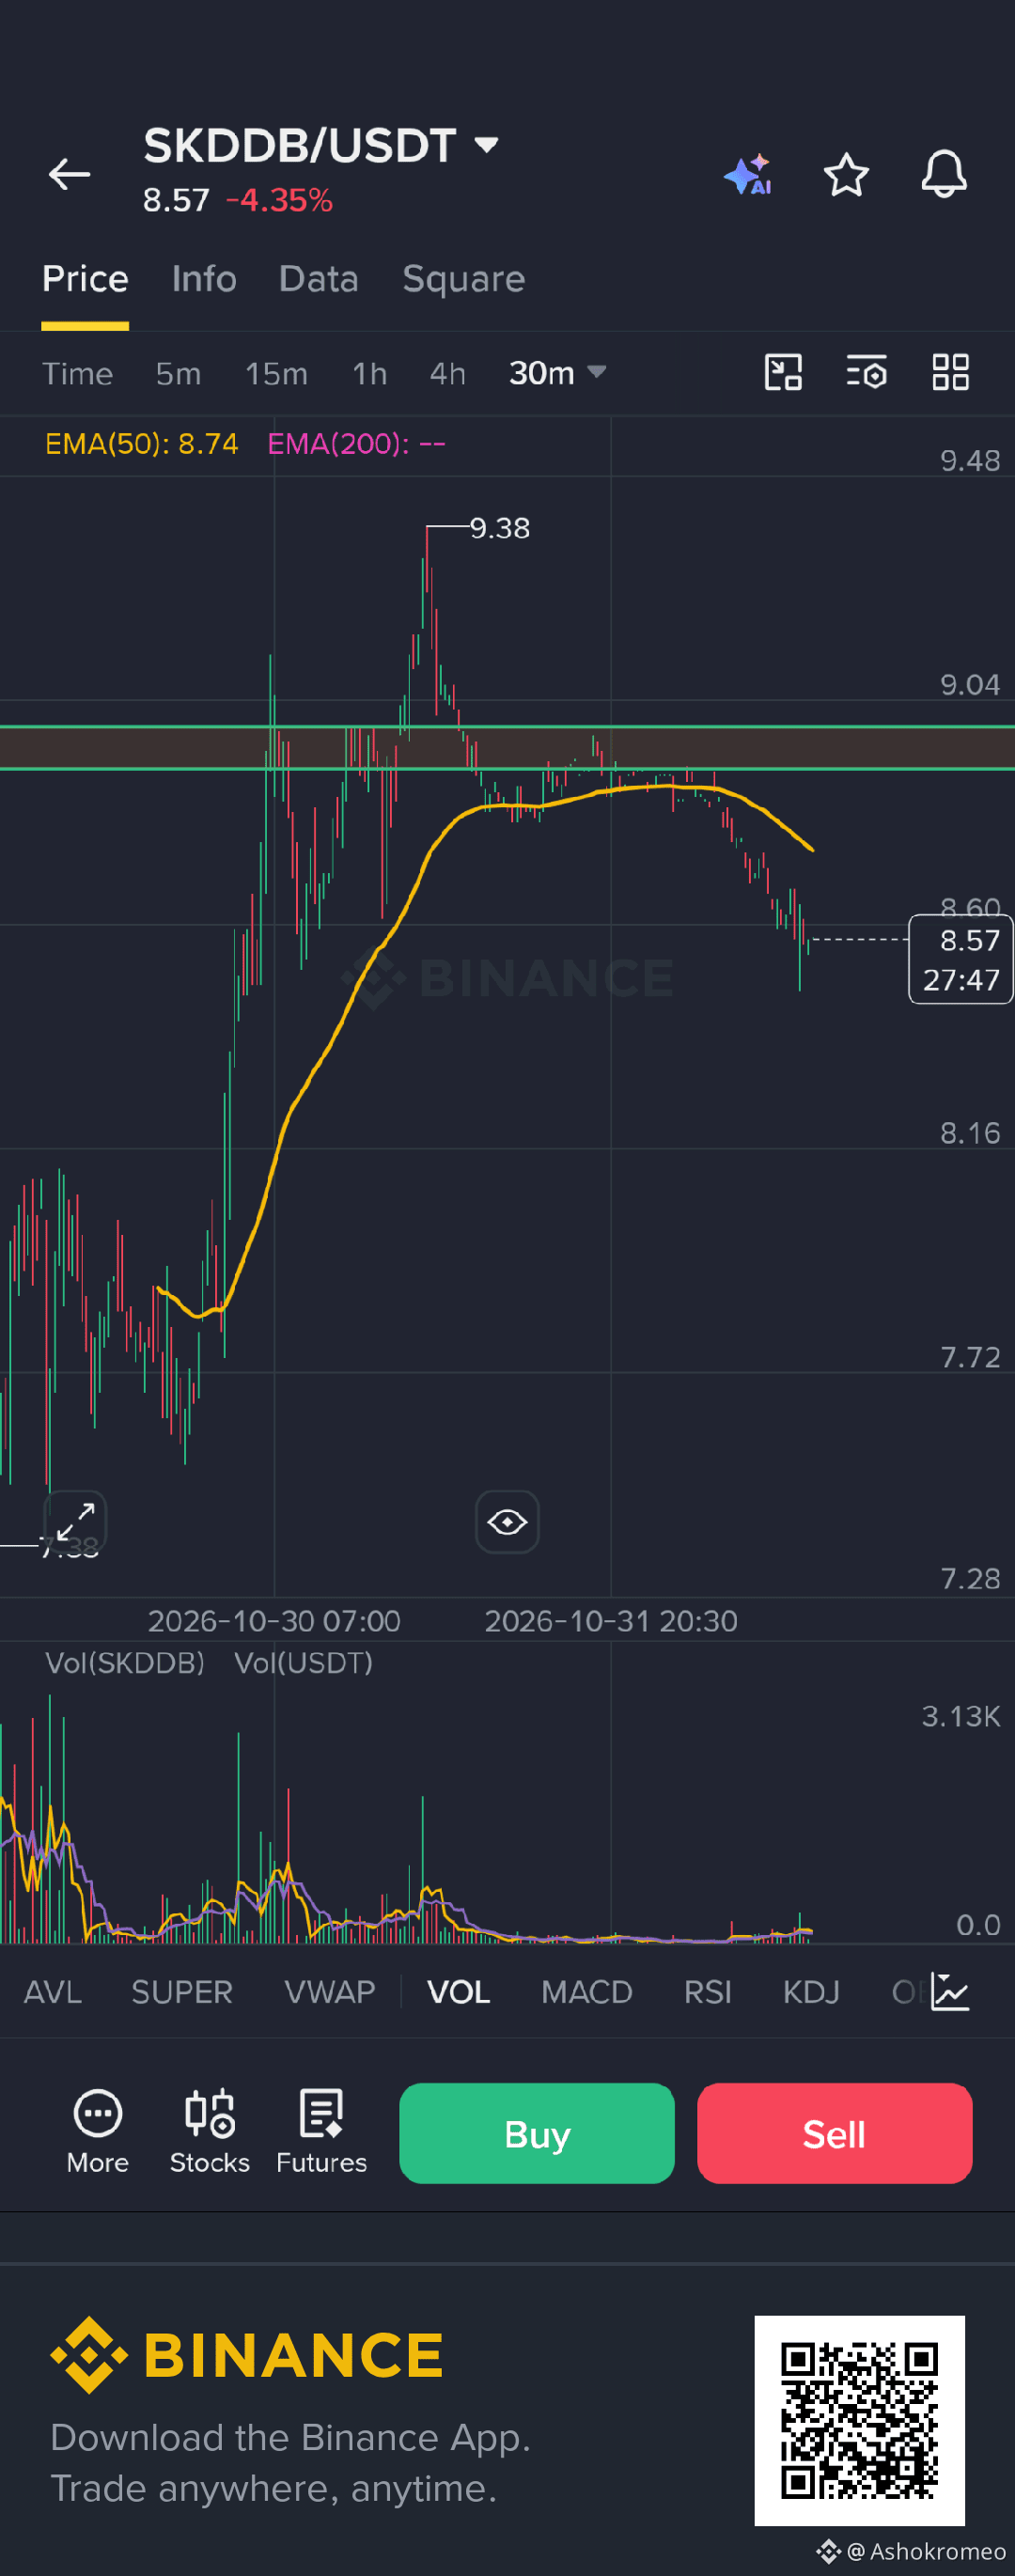
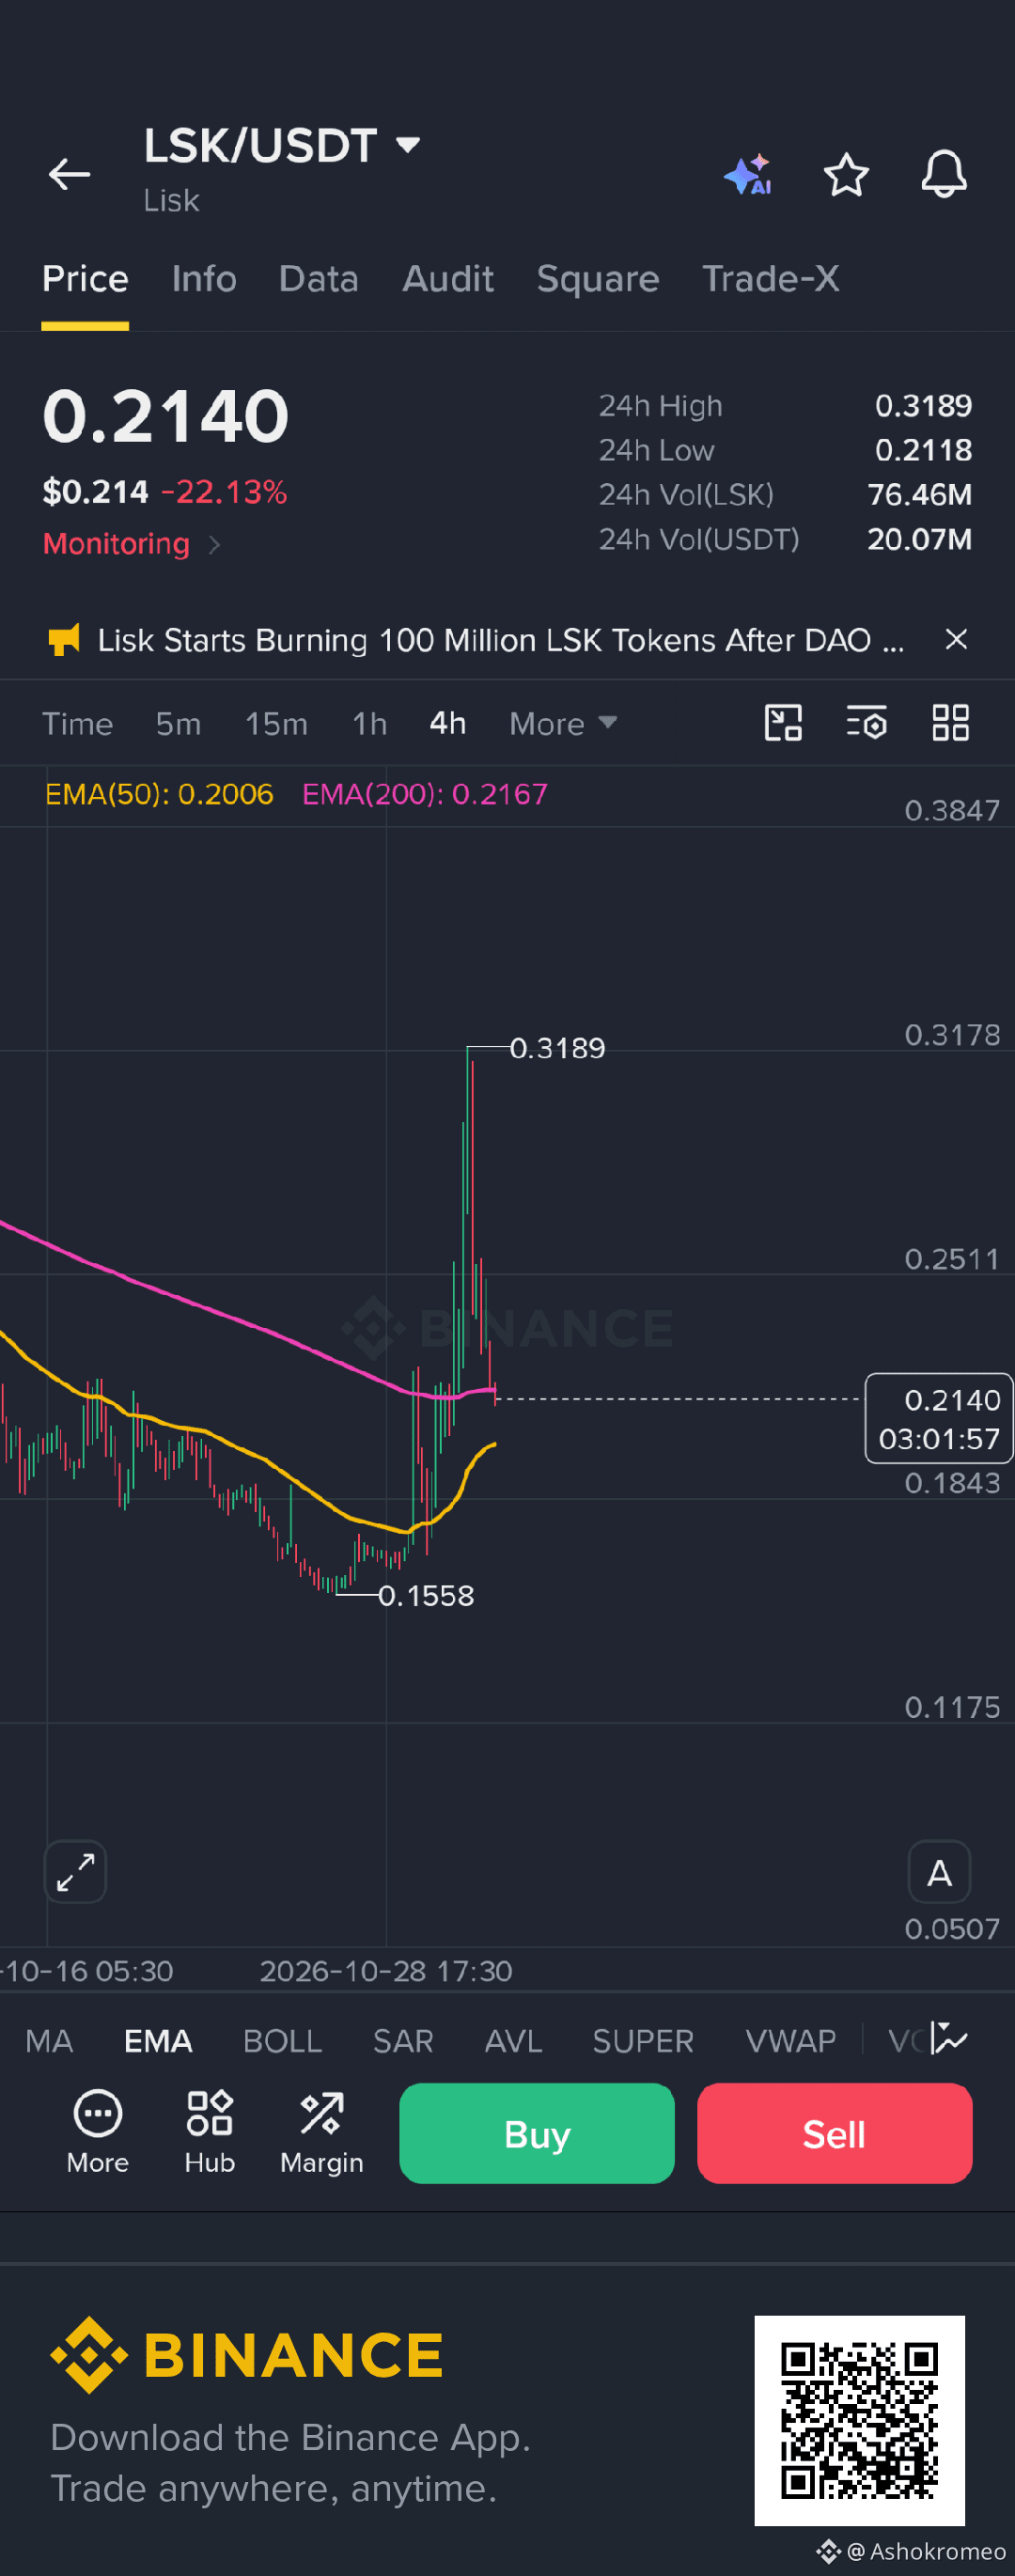
·
--
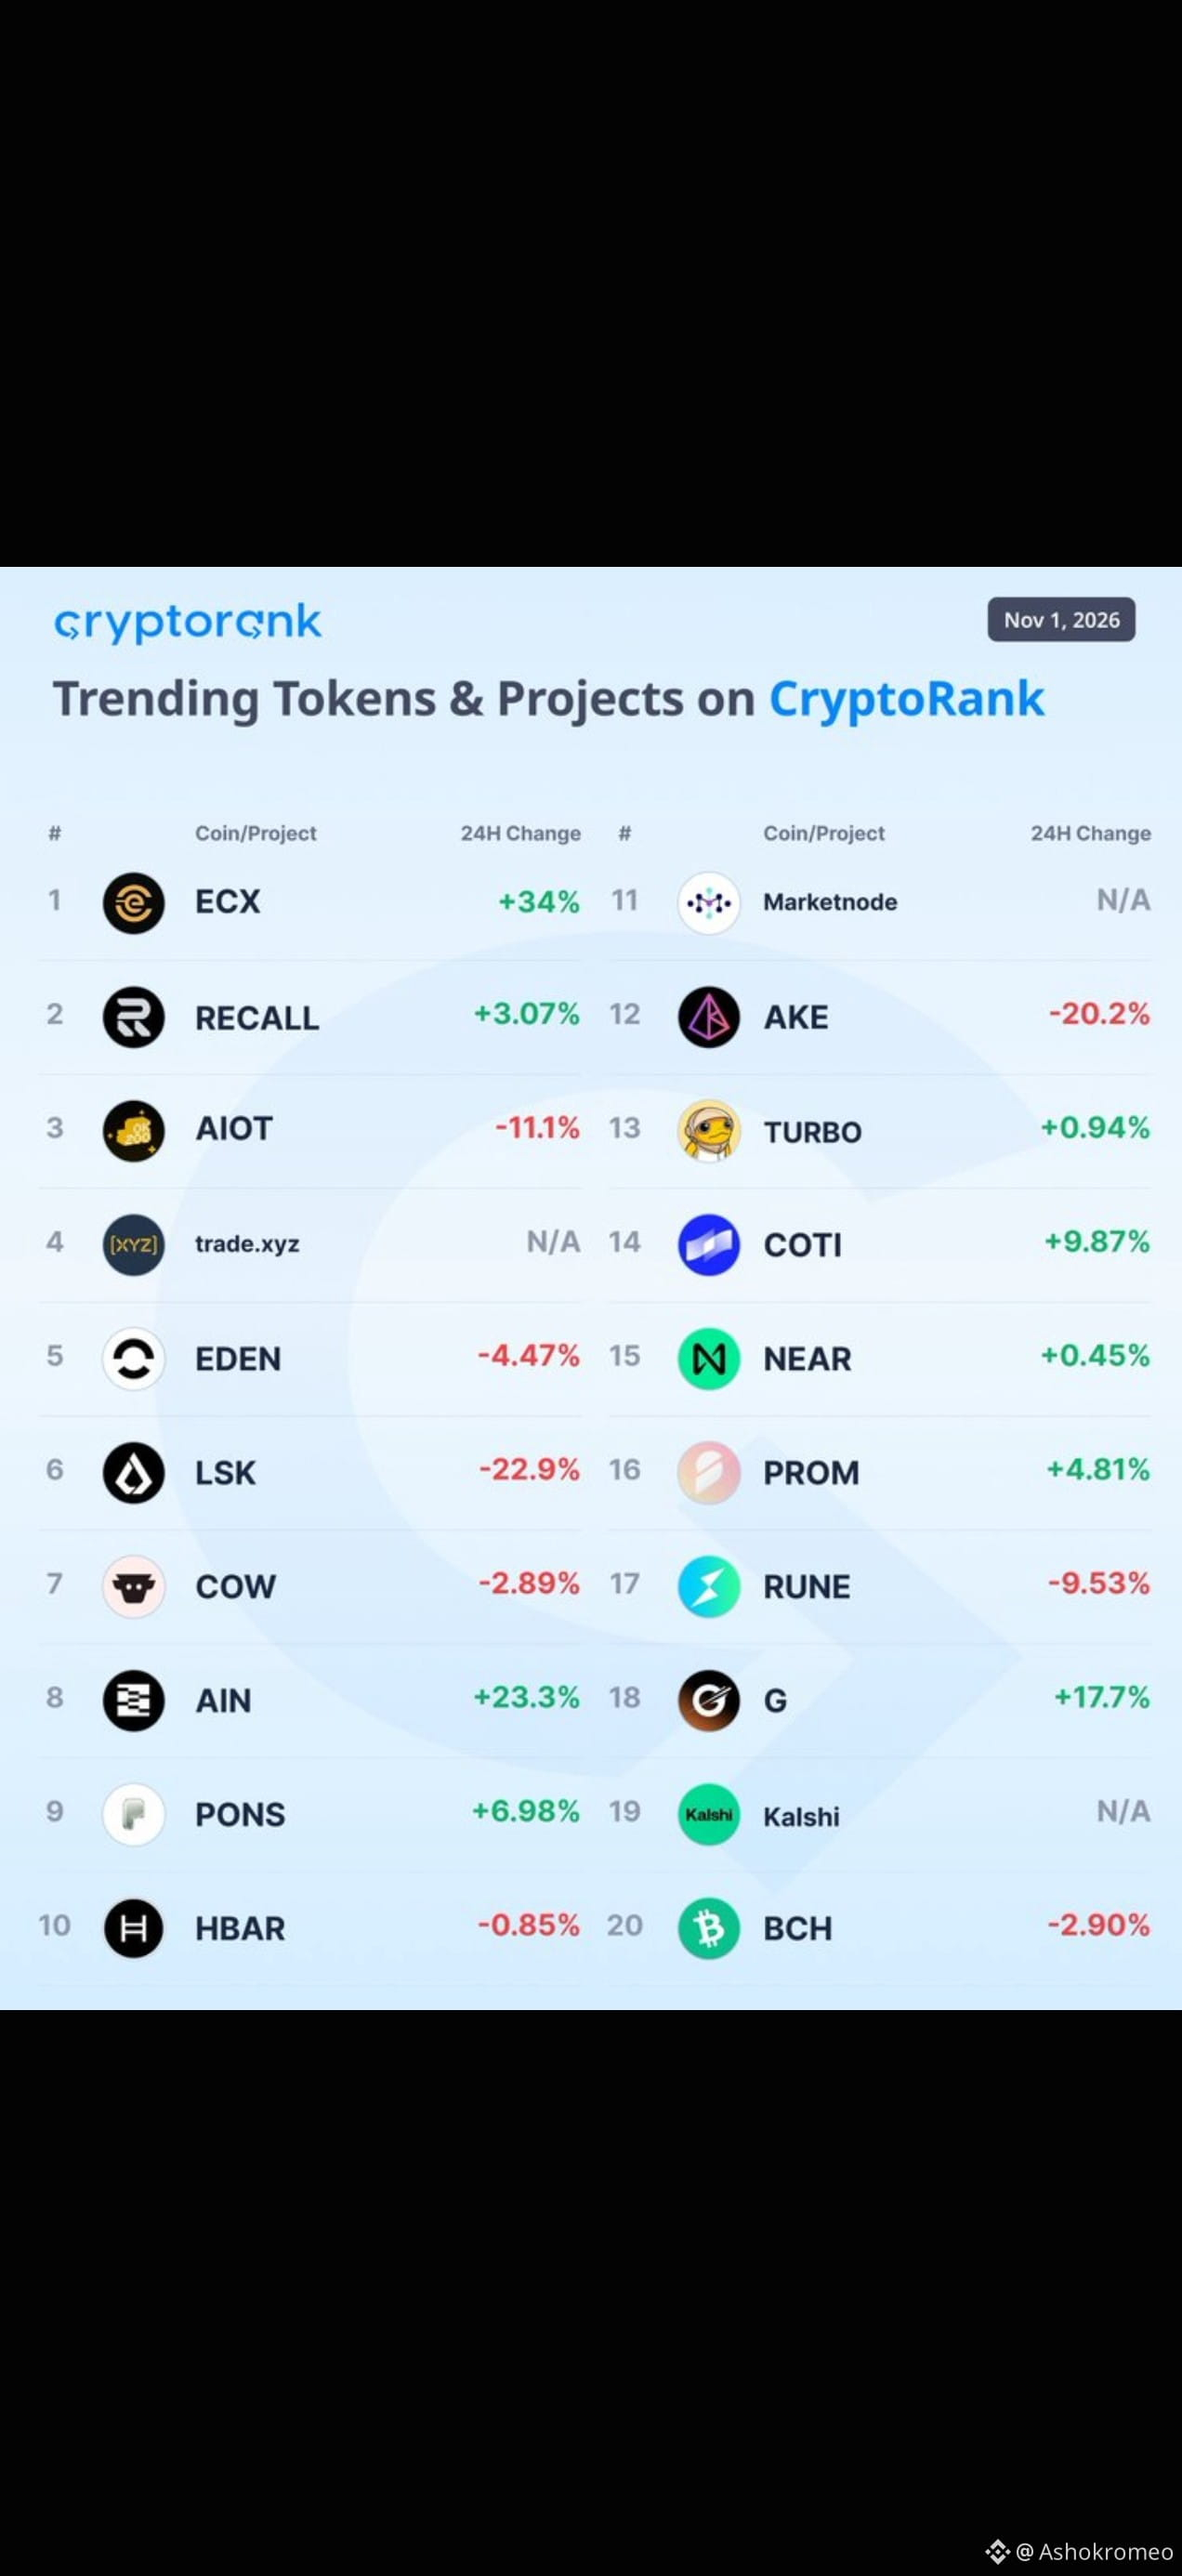
🔥 Trendende Token & Projekte auf CryptoRank
@BTCdrivechains (ECX) führt die Rangliste an, nachdem das Mainnet und der Token gestartet wurden.
Größte Kursgewinner:
@BTCdrivechains +34%
@infinityg_ai +23.3%
@GravityChain +17.7%
🔥 Trendende Token & Projekte auf CryptoRank
@BTCdrivechains (ECX) führt die Rangliste an, nachdem das Mainnet und der Token gestartet wurden.
Größte Kursgewinner:
@BTCdrivechains +34%
@infinityg_ai +23.3%
@GravityChain +17.7%
@BTCdrivechains (ECX) führt die Rangliste an, nachdem das Mainnet und der Token gestartet wurden.
Größte Kursgewinner:
@BTCdrivechains +34%
@infinityg_ai +23.3%
@GravityChain +17.7%
364
·
--
Übersetzung ansehen
binance updateLatest Withdrawal Update
Withdrawals have now been re-enabled for the following networks and assets:
New:
ZEC: ZEC
✅ TON: USDT, GRAM
✅ SUI: SUI
Already Enabled:
✅ BTC: BTC
✅ ETH: ETH, USDT, USDC
✅ BSC: BNB, USDT, USDC
✅ XRP: XRP
✅ Base: ETH, USDC
✅ DOGE: DOGE
✅ OP (Optimism): ETH, USDT, USDC
✅ ARBITRUM: ARB, ETH, USDT, USDC
✅ TRX: TRX, USDT
✅ SOL: SOL, USDT, USDC
✅ MATIC (Polygon): POL, USDT, USDC
✅ AVAXC: AVAX, USDT, USDC
We will continue to restore additional assets and networks in phases as security checks are completed. Further updates will be shared through official Binance channels.
binance update
Latest Withdrawal Update
Withdrawals have now been re-enabled for the following networks and assets:
New:
ZEC: ZEC
✅ TON: USDT, GRAM
✅ SUI: SUI
Already Enabled:
✅ BTC: BTC
✅ ETH: ETH, USDT, USDC
✅ BSC: BNB, USDT, USDC
✅ XRP: XRP
✅ Base: ETH, USDC
✅ DOGE: DOGE
✅ OP (Optimism): ETH, USDT, USDC
✅ ARBITRUM: ARB, ETH, USDT, USDC
✅ TRX: TRX, USDT
✅ SOL: SOL, USDT, USDC
✅ MATIC (Polygon): POL, USDT, USDC
✅ AVAXC: AVAX, USDT, USDC
We will continue to restore additional assets and networks in phases as security checks are completed. Further updates will be shared through official Binance channels.
1
·
--
213
Anmelden und weiter Inhalte entdecken
Krypto-Nutzer weltweit auf Binance Square kennenlernen
⚡️ Bleib in Sachen Krypto stets am Puls.
💬 Die weltgrößte Kryptobörse vertraut darauf.
👍 Erhalte verlässliche Einblicke von verifizierten Creators.
E-Mail-Adresse/Telefonnummer
Trendthemen
BinanceProcesses$4.65BWithdrawals
25,858 Aufrufe
120 Kommentare
Binance verarbeitet nach Wiederaufnahme Auszahlungen in Höhe von 4,65 Milliarden US-Dollar – Nettoabfluss von 3,64 Milliarden US-Dollar entspricht 2,1 % der Vermögenswerte im Wert von 171 Milliarden US-Dollar
Binance News
·43 Likes
·12.3k Aufrufe
WithdrawalsBack: 15 networks live
7,938 Aufrufe
129 Kommentare
BinanceUpdatesProofofReservesAddresses
128,891 Aufrufe
1,559 Kommentare