

DAYA11 1
161 Beiträge

DAYA11 1
Melden
Nutzer blockieren
Technical Analyst , Crypto-Educator . Post on crypto , Post on Bitcoin and alt coin. Read carefully the instructions given in the post , Do Your Own Research .
https://coinmarketcap.com/community/profile/DayaAkanurkar11/
0 Following
3 Follower
21 Like gegeben
Beiträge
·
--
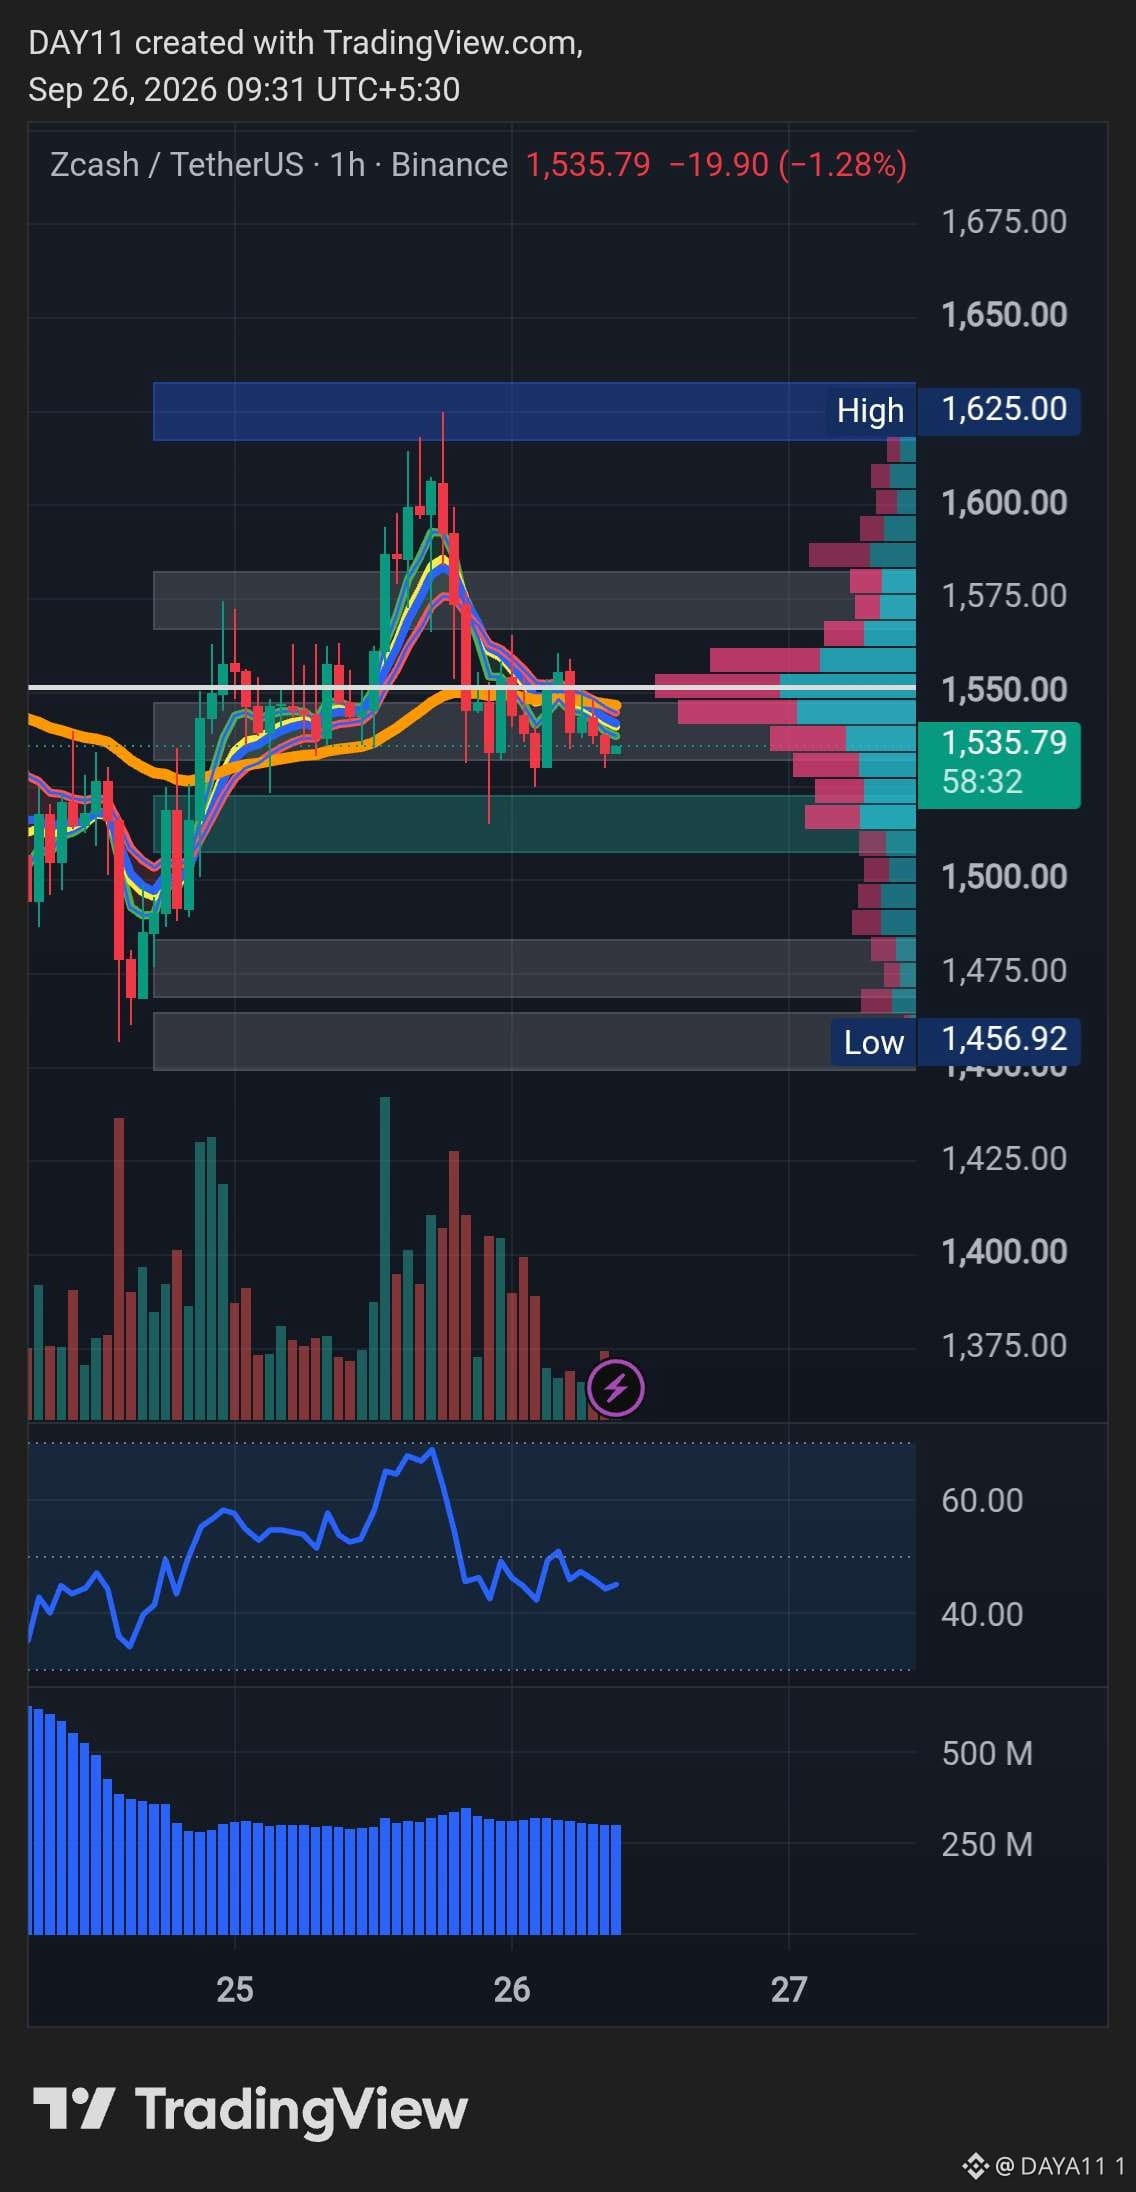
$ZEC
✅Kurz - $1534
🔴SL- $1577
🟢TP1- $1521
🟢TP2- $1500
🟢TP3- $1485
$ZEC
✅Kurz - $1534
🔴SL- $1577
🟢TP1- $1521
🟢TP2- $1500
🟢TP3- $1485
✅Kurz - $1534
🔴SL- $1577
🟢TP1- $1521
🟢TP2- $1500
🟢TP3- $1485
63
·
--
$BTC
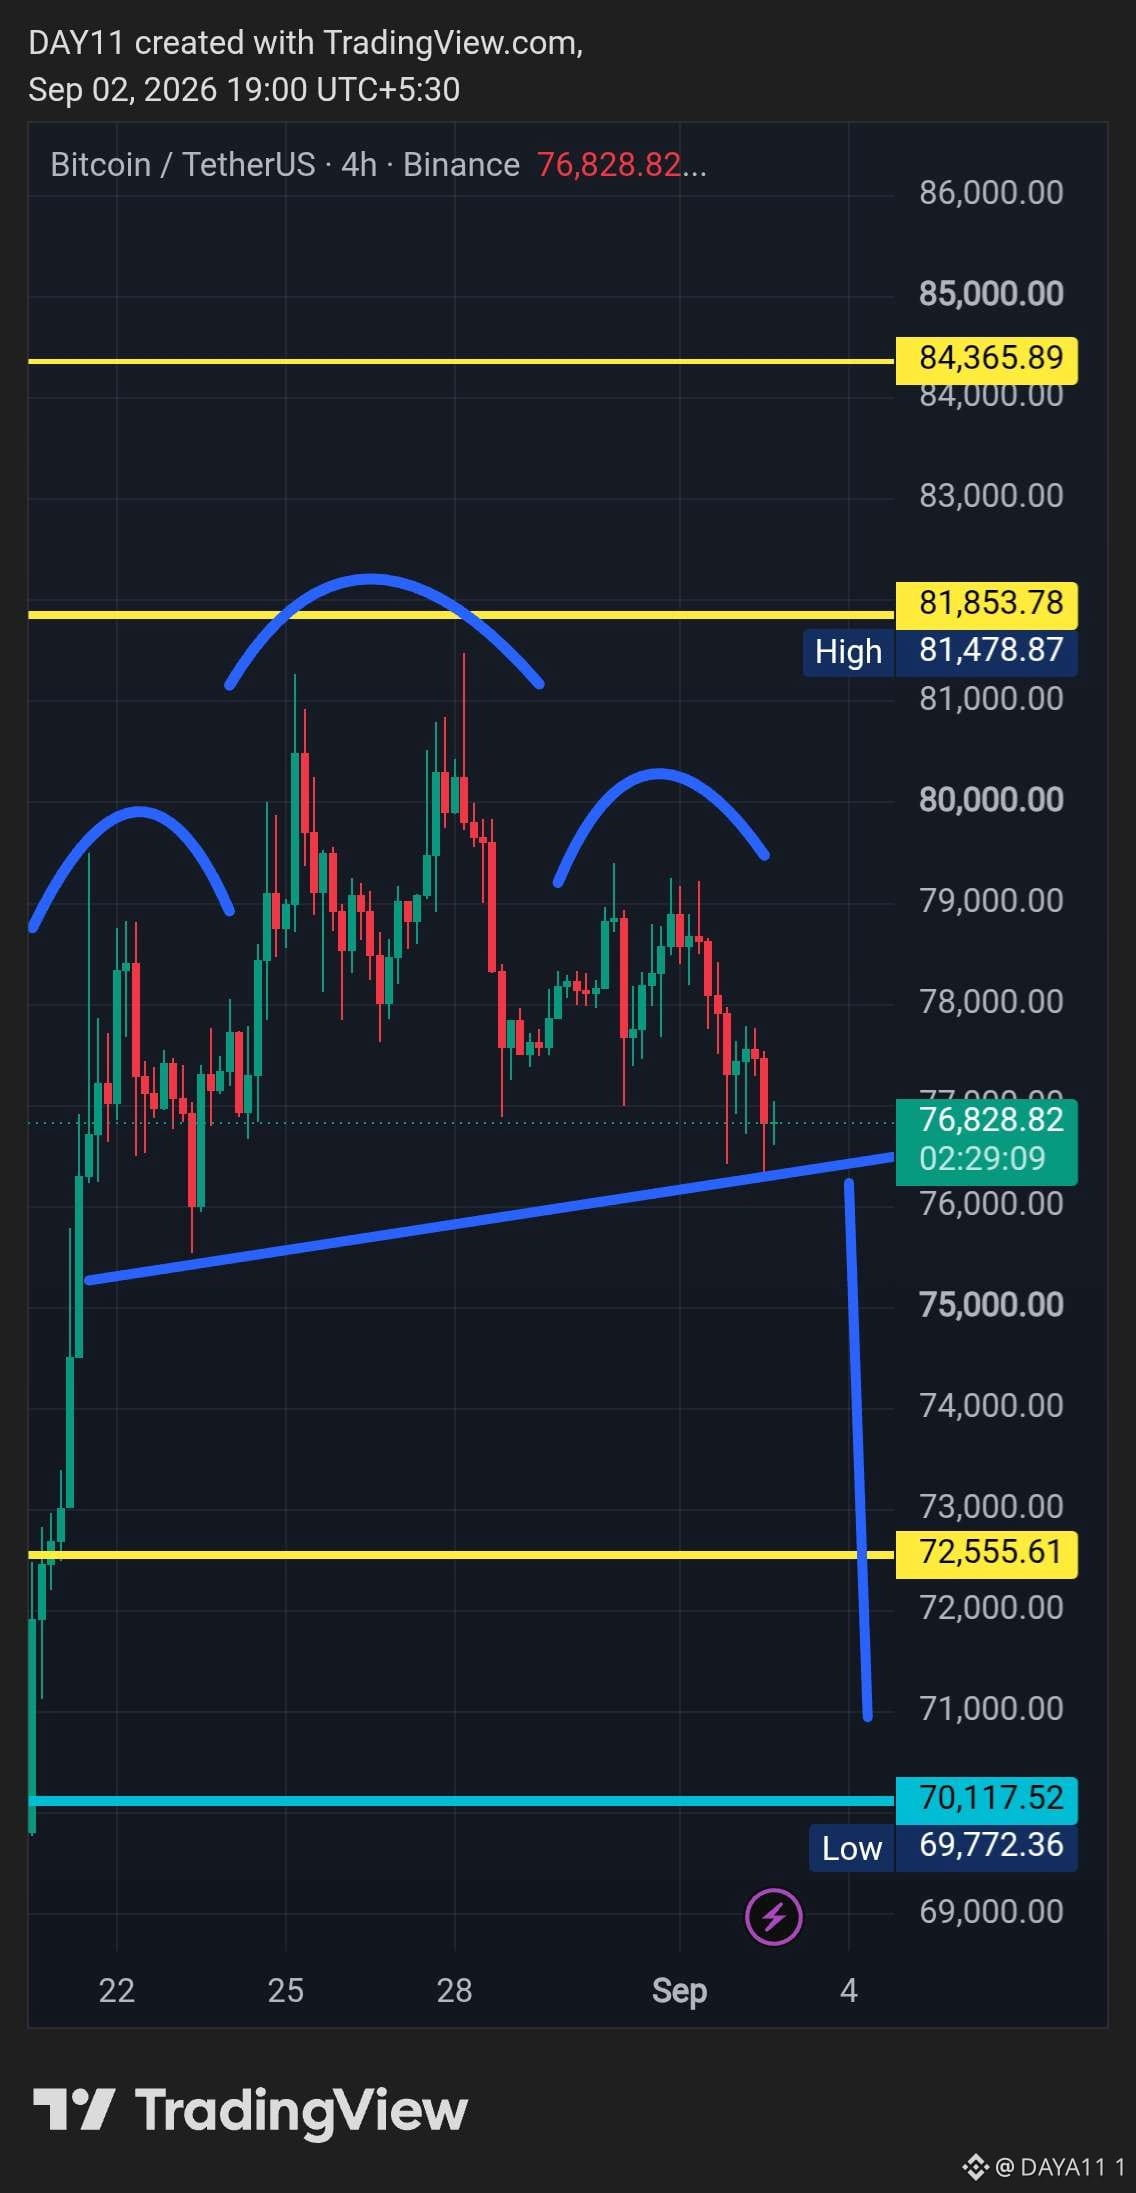
👉Die drei blauen Bögen markieren aufeinanderfolgende Hochpunkte:
Links ein hohes Hoch bei ~$79,8k, ein höherer mittlerer Peak bei $81,5k und dann ein tieferer rechter Peak bei $79,8–80k. Das ist eine Abfolge niedrigerer Hochs nach dem lokalen Top.
👉Die aufwärts geneigte blaue Linie fungiert als steigender Support und verbindet die Tiefs aus Mitte August mit dem aktuellen Bereich $76,5–77k. Der Kurs testet sie gerade.
Die steile blaue Linie nach unten Richtung ~$71k sieht nach einer gemessenen Bewegung / Breakdown-Projektion aus, falls dieser Support nicht hält.
👉Horizontale Levels:
Widerstand: $81.854 (knapp über dem jüngsten Hoch) und $84.366
Support: $72.556 und die cyanfarbene Linie bei $70.118
Diese Struktur passt zu einem möglichen Kopf-und-Schultern- oder Distribution-Muster im 4h-Chart, mit einem leicht ansteigenden Nacken. Die Distanz von Kopf zum Nacken (ca. $4,5–5k) projiziert in den Bereich $71,5–72,5k, falls der Nacken bricht — passend zur gelben $72.556-Linie und dem eingezeichneten Abwärtsschub.
Szenarien von hier aus👇
🟢Support hält (bullische Fortsetzung / Range bleibt intakt)
Ein 4h-Rebound und ein Close zurück über ~$77,5–78k würde die Post-Rally-Range am Leben halten. Die nächsten Upside-Tests wären $79–80k, dann das Hoch bei $81,5k / das $81.854-Level. Ein klarer Break und Hold über $81,5–82,5k würde den Weg Richtung $84,4k wieder öffnen.
🟢Support bricht (bearish Fortsetzung)
Ein 4h-Close unter der steigenden blauen Linie und dem $76,5k-Bereich würde die Lower-High-Struktur bestätigen und die gemessene Bewegung eröffnen. Erste Ziele: $75k, dann das gelbe $72.556-Level — mit der eingezeichneten Projektion Richtung $71k und der cyanfarbene Linie bei $70.118 als tieferer Support. Dieser Bereich deckt sich auch mit dem Late-August-Launchpad.
Volumen und die nächsten paar 4h-Closings sind wichtiger als ein einzelner Docht. Der Chart befindet sich an einer Weggabelung: Der steigende Support und der Cluster $76,5–77k sind die Levels, die entscheiden, ob das ein gesunder Pullback innerhalb der August-Rally ist oder der Start einer tieferen Korrektur.
Keine Finanzberatung — Levels können kurz durchstoßen werden, bevor es zu einem echten Break kommt. Achte auf den 4h-Close im Verhältnis zu dieser blauen Trendlinie.
$BTC
👉Die drei blauen Bögen markieren aufeinanderfolgende Hochpunkte:
Links ein hohes Hoch bei ~$79,8k, ein höherer mittlerer Peak bei $81,5k und dann ein tieferer rechter Peak bei $79,8–80k. Das ist eine Abfolge niedrigerer Hochs nach dem lokalen Top.
👉Die aufwärts geneigte blaue Linie fungiert als steigender Support und verbindet die Tiefs aus Mitte August mit dem aktuellen Bereich $76,5–77k. Der Kurs testet sie gerade.
Die steile blaue Linie nach unten Richtung ~$71k sieht nach einer gemessenen Bewegung / Breakdown-Projektion aus, falls dieser Support nicht hält.
👉Horizontale Levels:
Widerstand: $81.854 (knapp über dem jüngsten Hoch) und $84.366
Support: $72.556 und die cyanfarbene Linie bei $70.118
Diese Struktur passt zu einem möglichen Kopf-und-Schultern- oder Distribution-Muster im 4h-Chart, mit einem leicht ansteigenden Nacken. Die Distanz von Kopf zum Nacken (ca. $4,5–5k) projiziert in den Bereich $71,5–72,5k, falls der Nacken bricht — passend zur gelben $72.556-Linie und dem eingezeichneten Abwärtsschub.
Szenarien von hier aus👇
🟢Support hält (bullische Fortsetzung / Range bleibt intakt)
Ein 4h-Rebound und ein Close zurück über ~$77,5–78k würde die Post-Rally-Range am Leben halten. Die nächsten Upside-Tests wären $79–80k, dann das Hoch bei $81,5k / das $81.854-Level. Ein klarer Break und Hold über $81,5–82,5k würde den Weg Richtung $84,4k wieder öffnen.
🟢Support bricht (bearish Fortsetzung)
Ein 4h-Close unter der steigenden blauen Linie und dem $76,5k-Bereich würde die Lower-High-Struktur bestätigen und die gemessene Bewegung eröffnen. Erste Ziele: $75k, dann das gelbe $72.556-Level — mit der eingezeichneten Projektion Richtung $71k und der cyanfarbene Linie bei $70.118 als tieferer Support. Dieser Bereich deckt sich auch mit dem Late-August-Launchpad.
Volumen und die nächsten paar 4h-Closings sind wichtiger als ein einzelner Docht. Der Chart befindet sich an einer Weggabelung: Der steigende Support und der Cluster $76,5–77k sind die Levels, die entscheiden, ob das ein gesunder Pullback innerhalb der August-Rally ist oder der Start einer tieferen Korrektur.
Keine Finanzberatung — Levels können kurz durchstoßen werden, bevor es zu einem echten Break kommt. Achte auf den 4h-Close im Verhältnis zu dieser blauen Trendlinie.
👉Die drei blauen Bögen markieren aufeinanderfolgende Hochpunkte:
Links ein hohes Hoch bei ~$79,8k, ein höherer mittlerer Peak bei $81,5k und dann ein tieferer rechter Peak bei $79,8–80k. Das ist eine Abfolge niedrigerer Hochs nach dem lokalen Top.
👉Die aufwärts geneigte blaue Linie fungiert als steigender Support und verbindet die Tiefs aus Mitte August mit dem aktuellen Bereich $76,5–77k. Der Kurs testet sie gerade.
Die steile blaue Linie nach unten Richtung ~$71k sieht nach einer gemessenen Bewegung / Breakdown-Projektion aus, falls dieser Support nicht hält.
👉Horizontale Levels:
Widerstand: $81.854 (knapp über dem jüngsten Hoch) und $84.366
Support: $72.556 und die cyanfarbene Linie bei $70.118
Diese Struktur passt zu einem möglichen Kopf-und-Schultern- oder Distribution-Muster im 4h-Chart, mit einem leicht ansteigenden Nacken. Die Distanz von Kopf zum Nacken (ca. $4,5–5k) projiziert in den Bereich $71,5–72,5k, falls der Nacken bricht — passend zur gelben $72.556-Linie und dem eingezeichneten Abwärtsschub.
Szenarien von hier aus👇
🟢Support hält (bullische Fortsetzung / Range bleibt intakt)
Ein 4h-Rebound und ein Close zurück über ~$77,5–78k würde die Post-Rally-Range am Leben halten. Die nächsten Upside-Tests wären $79–80k, dann das Hoch bei $81,5k / das $81.854-Level. Ein klarer Break und Hold über $81,5–82,5k würde den Weg Richtung $84,4k wieder öffnen.
🟢Support bricht (bearish Fortsetzung)
Ein 4h-Close unter der steigenden blauen Linie und dem $76,5k-Bereich würde die Lower-High-Struktur bestätigen und die gemessene Bewegung eröffnen. Erste Ziele: $75k, dann das gelbe $72.556-Level — mit der eingezeichneten Projektion Richtung $71k und der cyanfarbene Linie bei $70.118 als tieferer Support. Dieser Bereich deckt sich auch mit dem Late-August-Launchpad.
Volumen und die nächsten paar 4h-Closings sind wichtiger als ein einzelner Docht. Der Chart befindet sich an einer Weggabelung: Der steigende Support und der Cluster $76,5–77k sind die Levels, die entscheiden, ob das ein gesunder Pullback innerhalb der August-Rally ist oder der Start einer tieferen Korrektur.
Keine Finanzberatung — Levels können kurz durchstoßen werden, bevor es zu einem echten Break kommt. Achte auf den 4h-Close im Verhältnis zu dieser blauen Trendlinie.
68
·
--
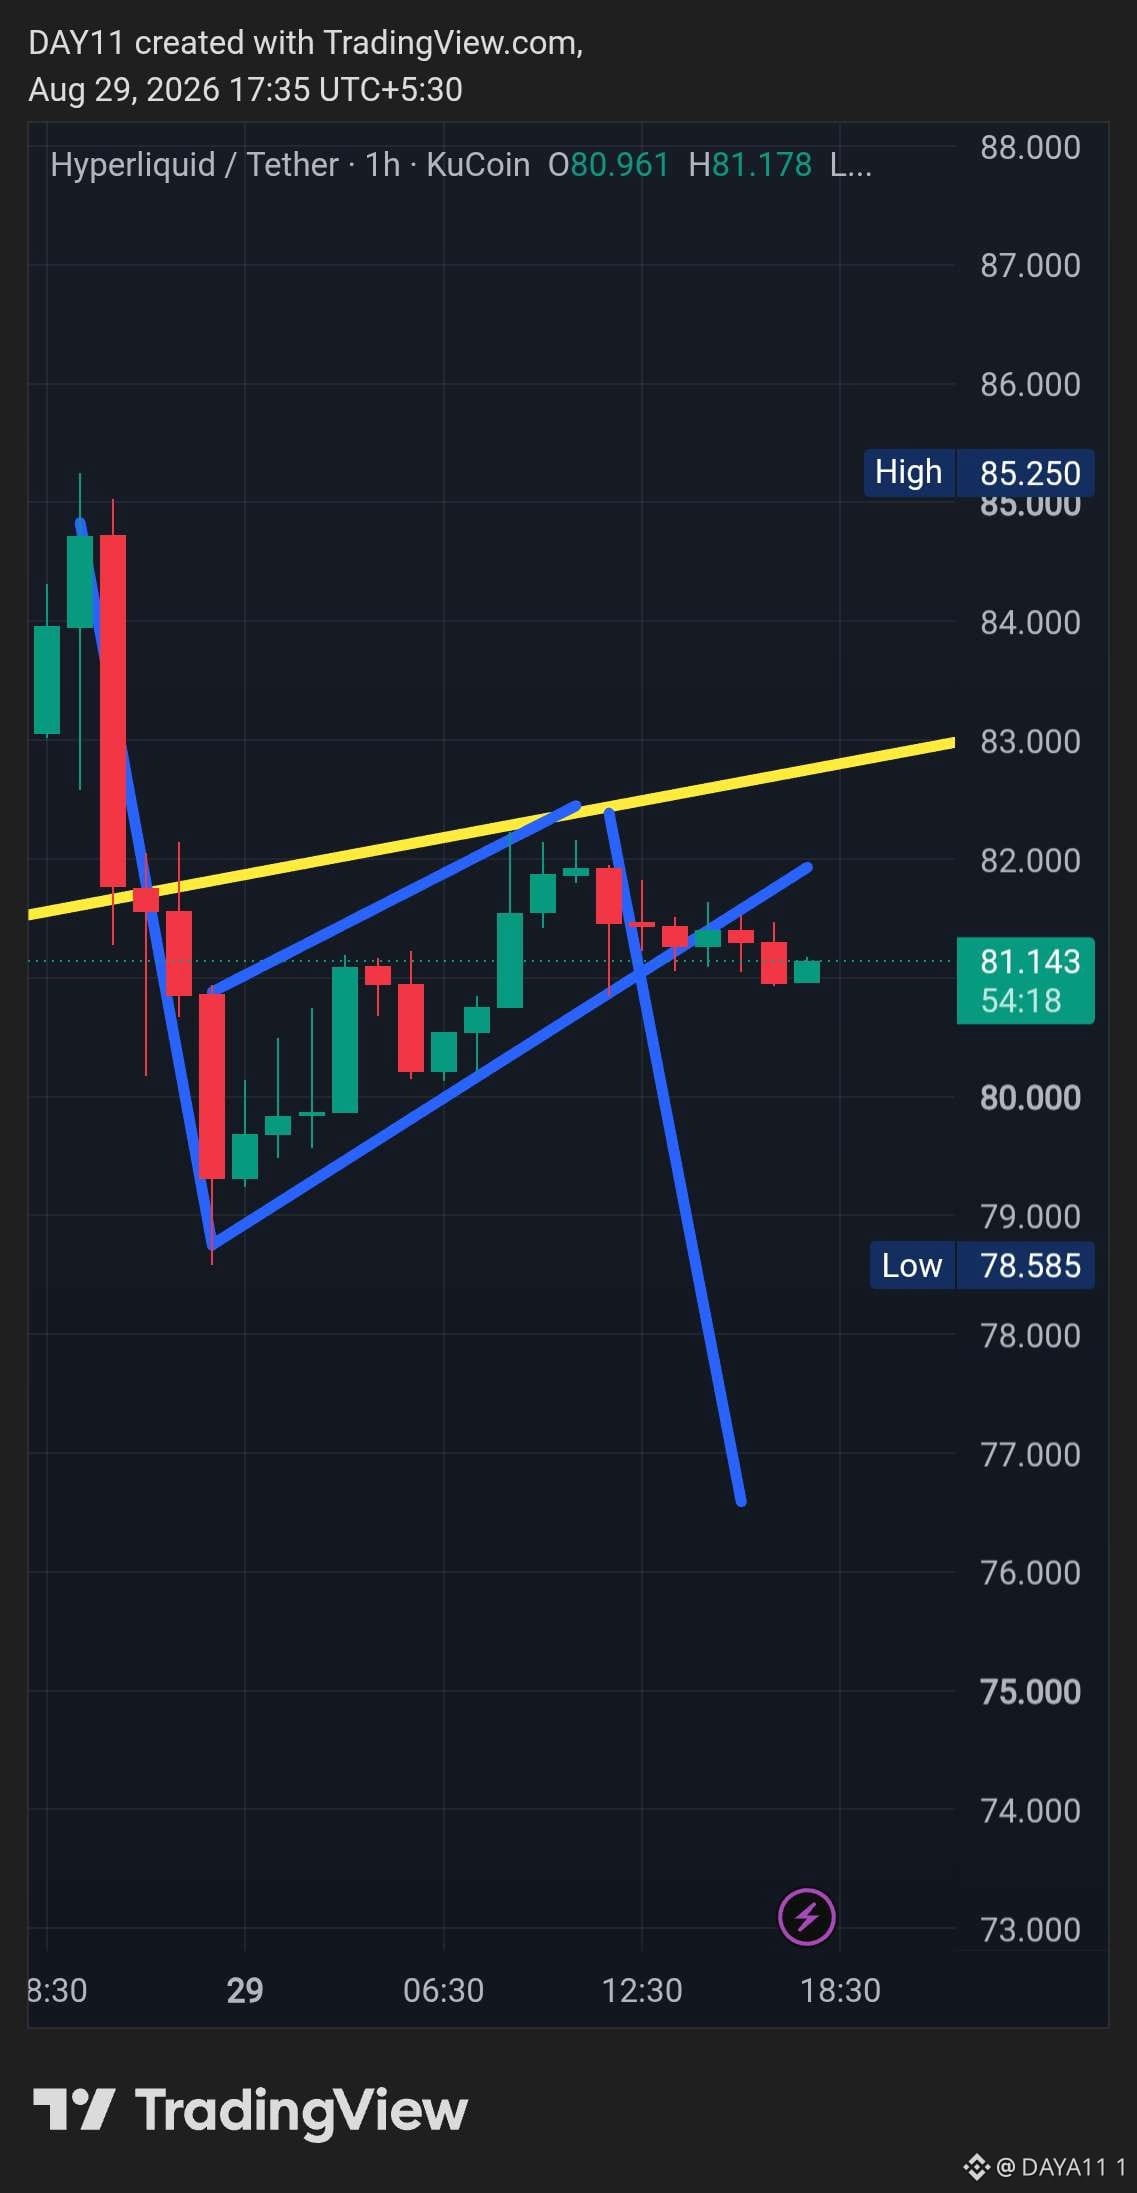
$HYPE : BEAR FLAG ?
Ich habe die 1h-Zeitebene gezeichnet $HYPE Chart .
Lasst uns verstehen -
Pole: Abverkauf von ~$85 hinunter zu ~$78.6–$79.
Blaue Linien – Beide zeigen die blauen Linien als Widerstand & Unterstützung. Wenn der Preis die Unterstützung durchbricht und eine Bestätigung erhält, wird sich diese Flagge entfalten. Aber wenn der Preis den Widerstand durchbricht, bedeutet das eine ungültige Bear-Flag. Behalte die $BTC-Bewegungen im Auge . Händler gehen nur nach dem Ausbruch mit Bestätigung rein und steigen bei $76.51 aus. Wie immer: Mach deine eigene Recherche, bevor du irgendeine Aktion ausführst .
#DYOR #NFA
$HYPE : BEAR FLAG ?
Ich habe die 1h-Zeitebene gezeichnet $HYPE Chart .
Lasst uns verstehen -
Pole: Abverkauf von ~$85 hinunter zu ~$78.6–$79.
Blaue Linien – Beide zeigen die blauen Linien als Widerstand & Unterstützung. Wenn der Preis die Unterstützung durchbricht und eine Bestätigung erhält, wird sich diese Flagge entfalten. Aber wenn der Preis den Widerstand durchbricht, bedeutet das eine ungültige Bear-Flag. Behalte die $BTC-Bewegungen im Auge . Händler gehen nur nach dem Ausbruch mit Bestätigung rein und steigen bei $76.51 aus. Wie immer: Mach deine eigene Recherche, bevor du irgendeine Aktion ausführst .
#DYOR #NFA
Ich habe die 1h-Zeitebene gezeichnet $HYPE Chart .
Lasst uns verstehen -
Pole: Abverkauf von ~$85 hinunter zu ~$78.6–$79.
Blaue Linien – Beide zeigen die blauen Linien als Widerstand & Unterstützung. Wenn der Preis die Unterstützung durchbricht und eine Bestätigung erhält, wird sich diese Flagge entfalten. Aber wenn der Preis den Widerstand durchbricht, bedeutet das eine ungültige Bear-Flag. Behalte die $BTC-Bewegungen im Auge . Händler gehen nur nach dem Ausbruch mit Bestätigung rein und steigen bei $76.51 aus. Wie immer: Mach deine eigene Recherche, bevor du irgendeine Aktion ausführst .
#DYOR #NFA
76
·
--
#HYPE $ HYPE
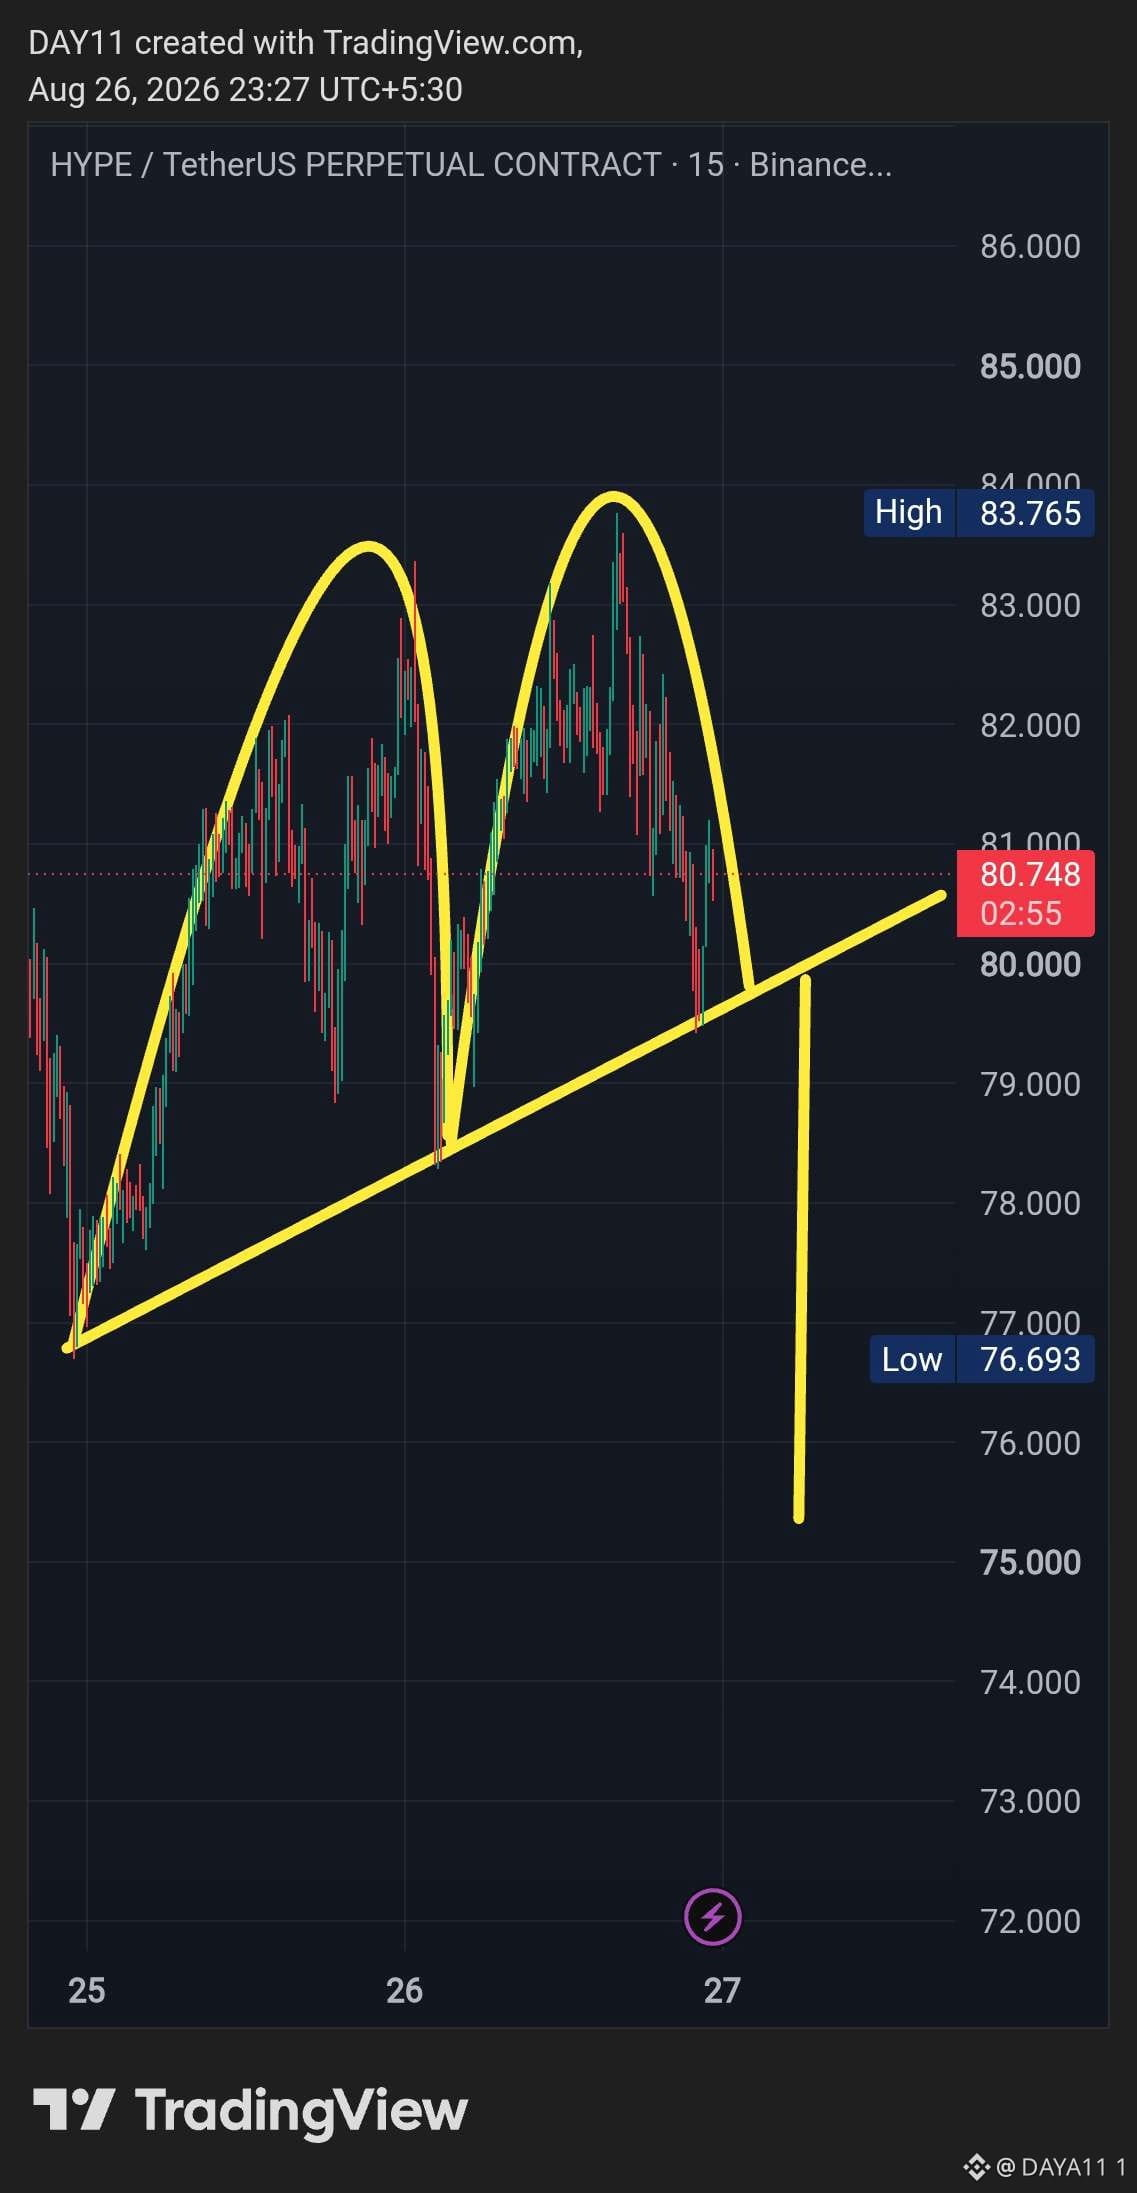
Dies ist ein Doppel-Top (M-Muster) mit gerundeten Hochs + einer ansteigenden Unterstützungs-Trendlinie.
Zwei gerundete Peaks von ähnlicher Höhe (beide nahe der Zone 83,5–84).
Der linke Peak und der rechte Peak bilden die klassische „M“-Form.
Da die Hochs gekrümmt statt spitz sind, wird dies manchmal als abgerundetes Doppel-Top bezeichnet.
Eine ansteigende gelbe Trendlinie, die die Tiefs verbindet (das Tal zwischen den beiden Peaks und das frühere Tief).
Dies wirkt als dynamische Unterstützung / Nackenlinie.
Eine vertikale gelbe Linie ganz rechts zeigt einen starken Rückgang.
Dies scheint den Ausbruch bzw. das Breakdown unter die ansteigende Unterstützung zu markieren.
Wie spielt sich das Muster typischerweise ab?
✅ Kurs bildet das erste Hoch → Rücksetzer.
✅ Kurs bildet das zweite Hoch nahe dem gleichen Niveau → scheitert erneut.
✅ Kurs bricht die Nackenlinie / ansteigende Unterstützung (die gelbe Linie, die du eingezeichnet hast).
✅ Das gemessene Move-Ziel entspricht ungefähr der Höhe des Musters, das vom Breakdown-Punkt nach unten projiziert wird.
#HYPE $ HYPE
Dies ist ein Doppel-Top (M-Muster) mit gerundeten Hochs + einer ansteigenden Unterstützungs-Trendlinie.
Zwei gerundete Peaks von ähnlicher Höhe (beide nahe der Zone 83,5–84).
Der linke Peak und der rechte Peak bilden die klassische „M“-Form.
Da die Hochs gekrümmt statt spitz sind, wird dies manchmal als abgerundetes Doppel-Top bezeichnet.
Eine ansteigende gelbe Trendlinie, die die Tiefs verbindet (das Tal zwischen den beiden Peaks und das frühere Tief).
Dies wirkt als dynamische Unterstützung / Nackenlinie.
Eine vertikale gelbe Linie ganz rechts zeigt einen starken Rückgang.
Dies scheint den Ausbruch bzw. das Breakdown unter die ansteigende Unterstützung zu markieren.
Wie spielt sich das Muster typischerweise ab?
✅ Kurs bildet das erste Hoch → Rücksetzer.
✅ Kurs bildet das zweite Hoch nahe dem gleichen Niveau → scheitert erneut.
✅ Kurs bricht die Nackenlinie / ansteigende Unterstützung (die gelbe Linie, die du eingezeichnet hast).
✅ Das gemessene Move-Ziel entspricht ungefähr der Höhe des Musters, das vom Breakdown-Punkt nach unten projiziert wird.
Dies ist ein Doppel-Top (M-Muster) mit gerundeten Hochs + einer ansteigenden Unterstützungs-Trendlinie.
Zwei gerundete Peaks von ähnlicher Höhe (beide nahe der Zone 83,5–84).
Der linke Peak und der rechte Peak bilden die klassische „M“-Form.
Da die Hochs gekrümmt statt spitz sind, wird dies manchmal als abgerundetes Doppel-Top bezeichnet.
Eine ansteigende gelbe Trendlinie, die die Tiefs verbindet (das Tal zwischen den beiden Peaks und das frühere Tief).
Dies wirkt als dynamische Unterstützung / Nackenlinie.
Eine vertikale gelbe Linie ganz rechts zeigt einen starken Rückgang.
Dies scheint den Ausbruch bzw. das Breakdown unter die ansteigende Unterstützung zu markieren.
Wie spielt sich das Muster typischerweise ab?
✅ Kurs bildet das erste Hoch → Rücksetzer.
✅ Kurs bildet das zweite Hoch nahe dem gleichen Niveau → scheitert erneut.
✅ Kurs bricht die Nackenlinie / ansteigende Unterstützung (die gelbe Linie, die du eingezeichnet hast).
✅ Das gemessene Move-Ziel entspricht ungefähr der Höhe des Musters, das vom Breakdown-Punkt nach unten projiziert wird.
79
·
--
$BTC
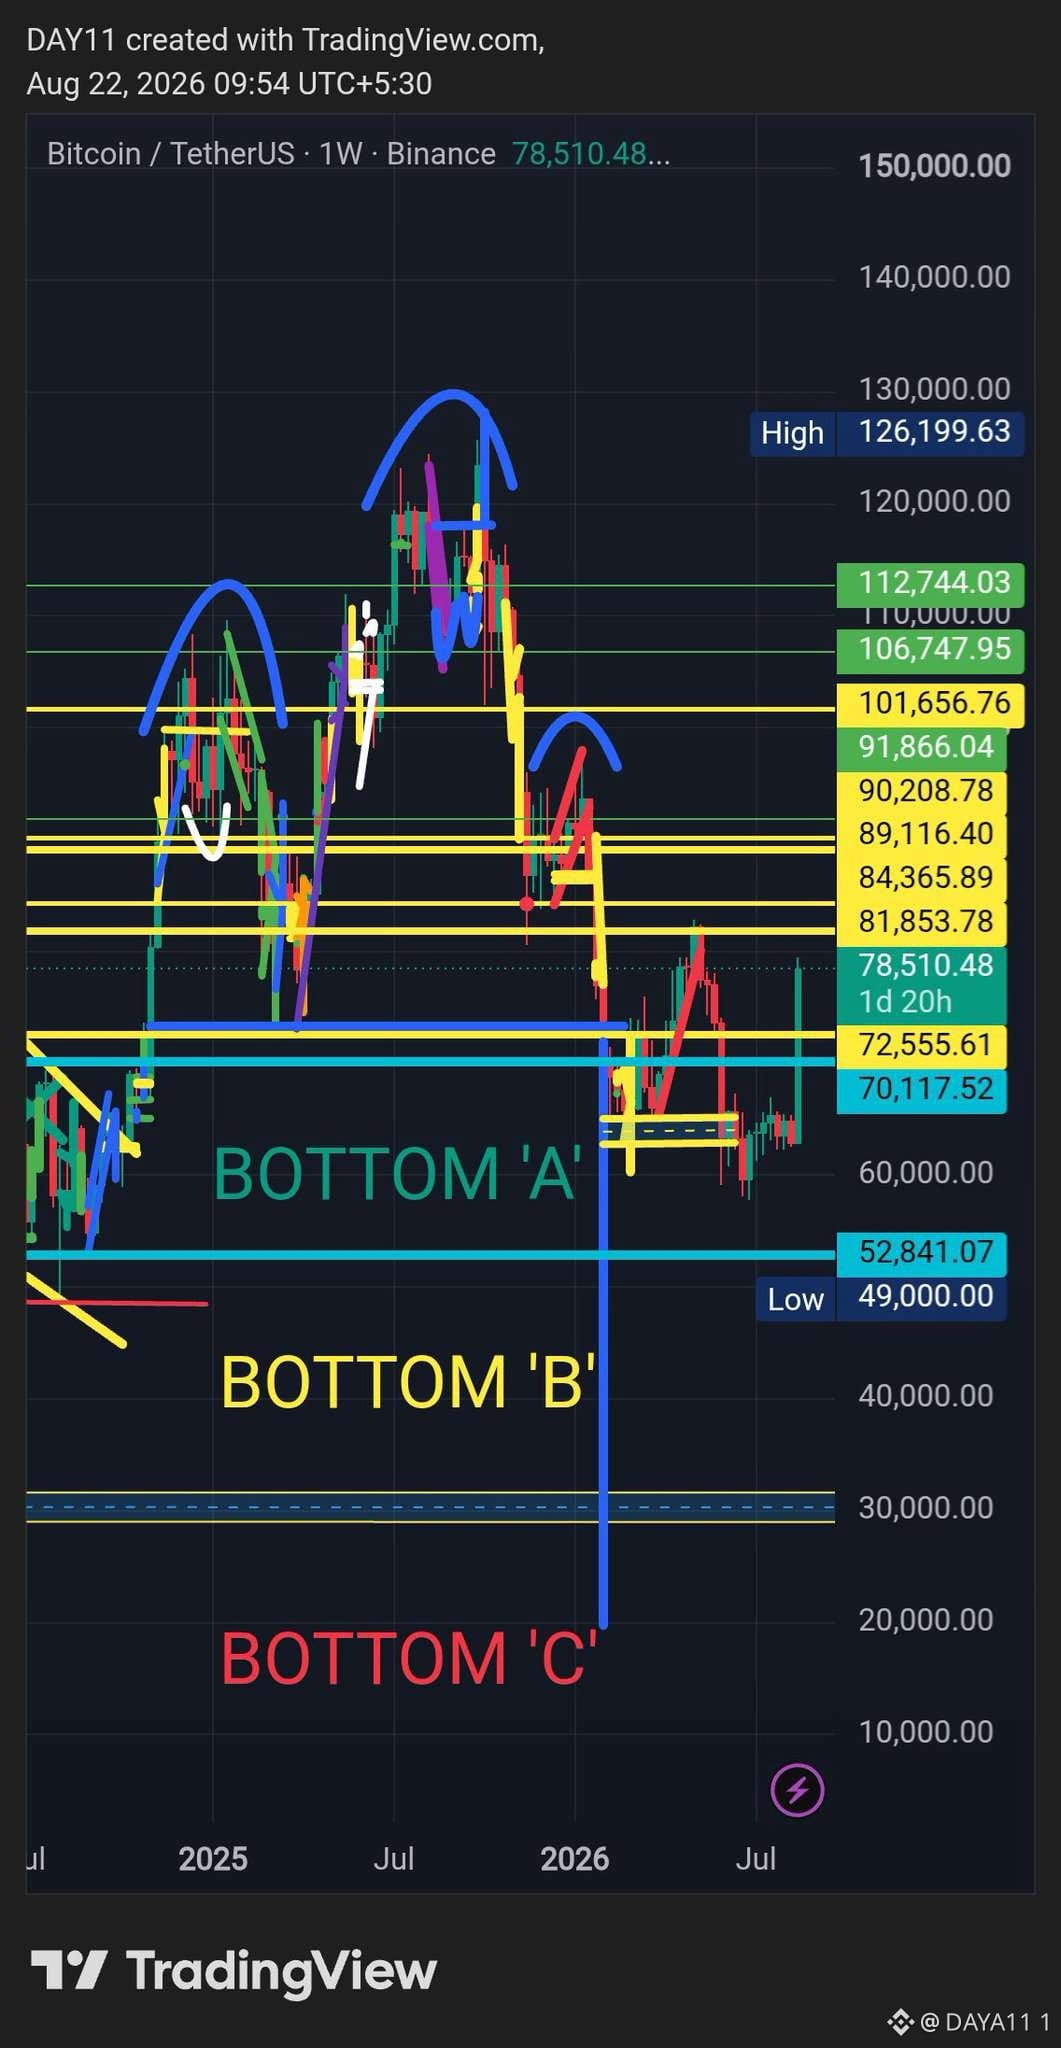
Lass uns über die aktuelle Situation von $BTC sprechen. Ich habe vorher über das untenstehende Diagramm gesprochen: das ist ein Head-&-Shoulders-Muster. Es ist weiterhin aktiv, ABER $BTC bewegt sich oberhalb von 82K nach oben und hält dieses Niveau. DANN schließt sich dieses Muster.
Natürlich ist das ein Fakeout-Pump – es bleibt noch ein Dump übrig, um den Boden zu fixieren (ich habe das in meinem vorherigen Post gesagt, der nahe bei 35k lag). Jetzt sind wir bei 63k, 64k ist die stärkste Unterstützung, die $BTC geschaffen hat. Btc wird versuchen, diese Unterstützung erneut zu testen. Wenn das gelingt, können wir sehen, wie unsere Rally weitergeht. Wenn es scheitert, wird $BTC versuchen, seinen Boden zu finden, bevor Oktober 2026. Das ist alles.
🚨 Vergiss nicht: Wir haben zwei Monate, um den 4-Jahres-$BTC-Zyklus abzuschließen.
#NFA #DYOR
$BTC
Lass uns über die aktuelle Situation von $BTC sprechen. Ich habe vorher über das untenstehende Diagramm gesprochen: das ist ein Head-&-Shoulders-Muster. Es ist weiterhin aktiv, ABER $BTC bewegt sich oberhalb von 82K nach oben und hält dieses Niveau. DANN schließt sich dieses Muster.
Natürlich ist das ein Fakeout-Pump – es bleibt noch ein Dump übrig, um den Boden zu fixieren (ich habe das in meinem vorherigen Post gesagt, der nahe bei 35k lag). Jetzt sind wir bei 63k, 64k ist die stärkste Unterstützung, die $BTC geschaffen hat. Btc wird versuchen, diese Unterstützung erneut zu testen. Wenn das gelingt, können wir sehen, wie unsere Rally weitergeht. Wenn es scheitert, wird $BTC versuchen, seinen Boden zu finden, bevor Oktober 2026. Das ist alles.
🚨 Vergiss nicht: Wir haben zwei Monate, um den 4-Jahres-$BTC-Zyklus abzuschließen.
#NFA #DYOR
Lass uns über die aktuelle Situation von $BTC sprechen. Ich habe vorher über das untenstehende Diagramm gesprochen: das ist ein Head-&-Shoulders-Muster. Es ist weiterhin aktiv, ABER $BTC bewegt sich oberhalb von 82K nach oben und hält dieses Niveau. DANN schließt sich dieses Muster.
Natürlich ist das ein Fakeout-Pump – es bleibt noch ein Dump übrig, um den Boden zu fixieren (ich habe das in meinem vorherigen Post gesagt, der nahe bei 35k lag). Jetzt sind wir bei 63k, 64k ist die stärkste Unterstützung, die $BTC geschaffen hat. Btc wird versuchen, diese Unterstützung erneut zu testen. Wenn das gelingt, können wir sehen, wie unsere Rally weitergeht. Wenn es scheitert, wird $BTC versuchen, seinen Boden zu finden, bevor Oktober 2026. Das ist alles.
🚨 Vergiss nicht: Wir haben zwei Monate, um den 4-Jahres-$BTC-Zyklus abzuschließen.
#NFA #DYOR
72
·
--
#ETH
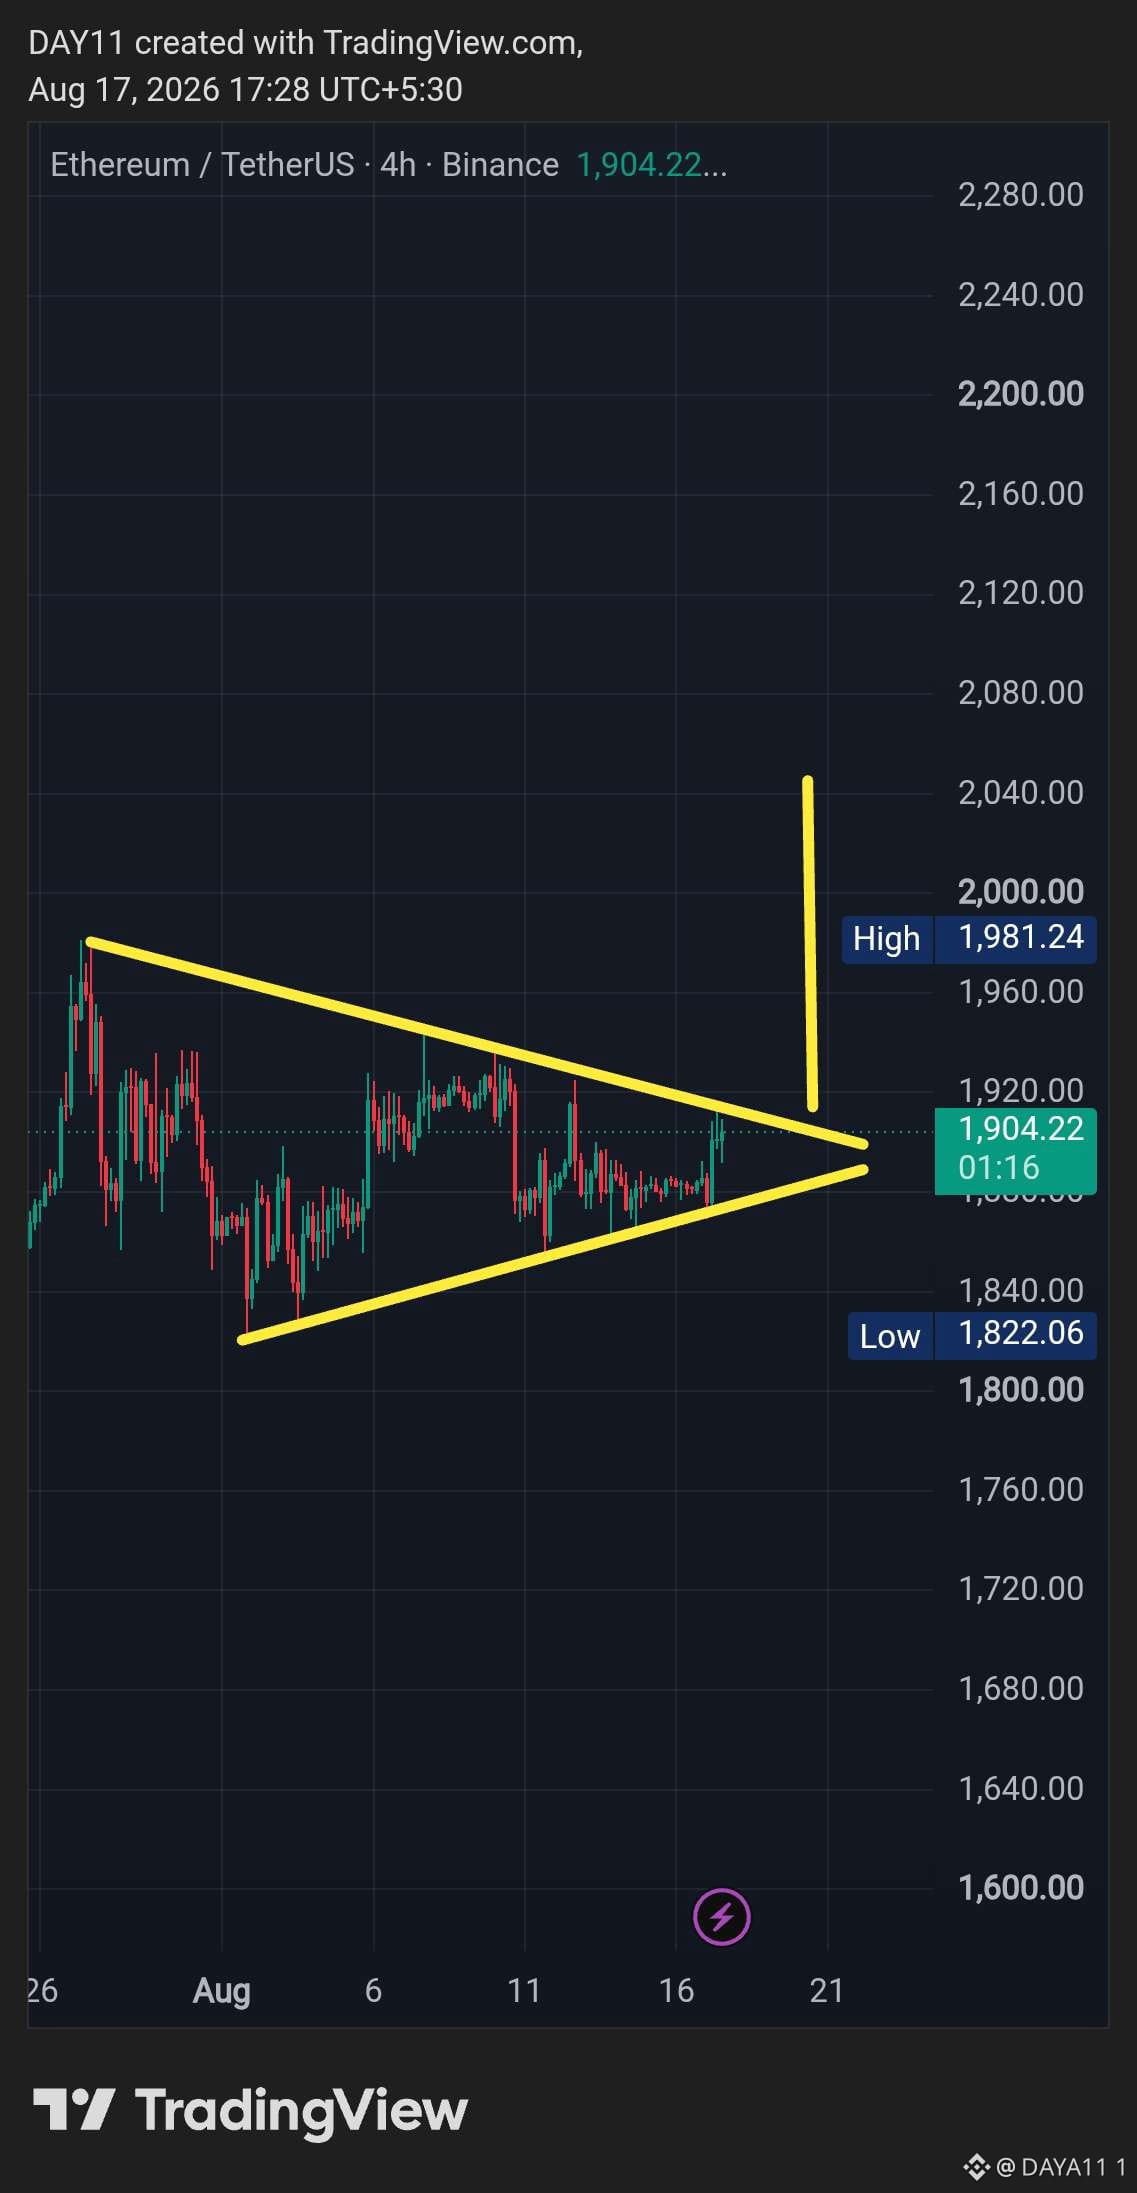
Dies ist ein symmetrisches Dreieck (sich annähernde Trendlinien)–Muster im 4h-Zeitrahmen.
Obere Trendlinie:
Absteigender Widerstand, der die niedrigeren Hochs verbindet.
Untere Trendlinie:
Aufsteigende Unterstützung, die die höheren Tiefs verbindet.
Die beiden Linien laufen rechts im Chart zusammen (Scheitelpunkt nahe dem aktuellen Kursbereich).
Ein vertikaler gelber Pfeil zeigt von nahe dem Scheitelpunkt nach oben und deutet einen erwarteten bullischen Ausbruch an.
Dies ist ein klassisches Konsolidierungsmuster, das typischerweise nach einer vorherigen Bewegung entsteht und oft mit einem starken richtungsweisenden Ausbruch aufgelöst wird (Fortsetzung oder Umkehr – je nach größerem Trendkontext).
Bullischer Ausbruch
Am häufigsten erwartetes Szenario mit dem nach oben zeigenden Pfeil
Sauberer Schlusskurs oberhalb der oberen absteigenden Trendlinie bei steigenden Umsätzen/Volumen.
Möglicher Kursziel-„Measured Move“-Target ≈ Höhe des Dreiecks, das vom Ausbruchspunkt nach oben projiziert wird → ungefähr in die Zone 1.980–2.040 (oder höher, je nach genauer Messung).
Bärischer Ausbruch:
Schlusskurs unter der aufsteigenden unteren Trendlinie.
Könnte das jüngste Tief bei etwa 1.822 oder tiefer ansteuern.
Volumen & Bestätigung:
Dreiecke brechen oft mit einem Volumen-Spike aus. Achte auf eine Ausweitung bei der Ausbruchskerze.
Falsche Ausbrüche sind nahe dem Scheitelpunkt häufig – warte auf einen eindeutigen 4H-Schlusskurs jenseits der Trendlinie.
#ETH
Dies ist ein symmetrisches Dreieck (sich annähernde Trendlinien)–Muster im 4h-Zeitrahmen.
Obere Trendlinie:
Absteigender Widerstand, der die niedrigeren Hochs verbindet.
Untere Trendlinie:
Aufsteigende Unterstützung, die die höheren Tiefs verbindet.
Die beiden Linien laufen rechts im Chart zusammen (Scheitelpunkt nahe dem aktuellen Kursbereich).
Ein vertikaler gelber Pfeil zeigt von nahe dem Scheitelpunkt nach oben und deutet einen erwarteten bullischen Ausbruch an.
Dies ist ein klassisches Konsolidierungsmuster, das typischerweise nach einer vorherigen Bewegung entsteht und oft mit einem starken richtungsweisenden Ausbruch aufgelöst wird (Fortsetzung oder Umkehr – je nach größerem Trendkontext).
Bullischer Ausbruch
Am häufigsten erwartetes Szenario mit dem nach oben zeigenden Pfeil
Sauberer Schlusskurs oberhalb der oberen absteigenden Trendlinie bei steigenden Umsätzen/Volumen.
Möglicher Kursziel-„Measured Move“-Target ≈ Höhe des Dreiecks, das vom Ausbruchspunkt nach oben projiziert wird → ungefähr in die Zone 1.980–2.040 (oder höher, je nach genauer Messung).
Bärischer Ausbruch:
Schlusskurs unter der aufsteigenden unteren Trendlinie.
Könnte das jüngste Tief bei etwa 1.822 oder tiefer ansteuern.
Volumen & Bestätigung:
Dreiecke brechen oft mit einem Volumen-Spike aus. Achte auf eine Ausweitung bei der Ausbruchskerze.
Falsche Ausbrüche sind nahe dem Scheitelpunkt häufig – warte auf einen eindeutigen 4H-Schlusskurs jenseits der Trendlinie.
Dies ist ein symmetrisches Dreieck (sich annähernde Trendlinien)–Muster im 4h-Zeitrahmen.
Obere Trendlinie:
Absteigender Widerstand, der die niedrigeren Hochs verbindet.
Untere Trendlinie:
Aufsteigende Unterstützung, die die höheren Tiefs verbindet.
Die beiden Linien laufen rechts im Chart zusammen (Scheitelpunkt nahe dem aktuellen Kursbereich).
Ein vertikaler gelber Pfeil zeigt von nahe dem Scheitelpunkt nach oben und deutet einen erwarteten bullischen Ausbruch an.
Dies ist ein klassisches Konsolidierungsmuster, das typischerweise nach einer vorherigen Bewegung entsteht und oft mit einem starken richtungsweisenden Ausbruch aufgelöst wird (Fortsetzung oder Umkehr – je nach größerem Trendkontext).
Bullischer Ausbruch
Am häufigsten erwartetes Szenario mit dem nach oben zeigenden Pfeil
Sauberer Schlusskurs oberhalb der oberen absteigenden Trendlinie bei steigenden Umsätzen/Volumen.
Möglicher Kursziel-„Measured Move“-Target ≈ Höhe des Dreiecks, das vom Ausbruchspunkt nach oben projiziert wird → ungefähr in die Zone 1.980–2.040 (oder höher, je nach genauer Messung).
Bärischer Ausbruch:
Schlusskurs unter der aufsteigenden unteren Trendlinie.
Könnte das jüngste Tief bei etwa 1.822 oder tiefer ansteuern.
Volumen & Bestätigung:
Dreiecke brechen oft mit einem Volumen-Spike aus. Achte auf eine Ausweitung bei der Ausbruchskerze.
Falsche Ausbrüche sind nahe dem Scheitelpunkt häufig – warte auf einen eindeutigen 4H-Schlusskurs jenseits der Trendlinie.
55
·
--
$asve
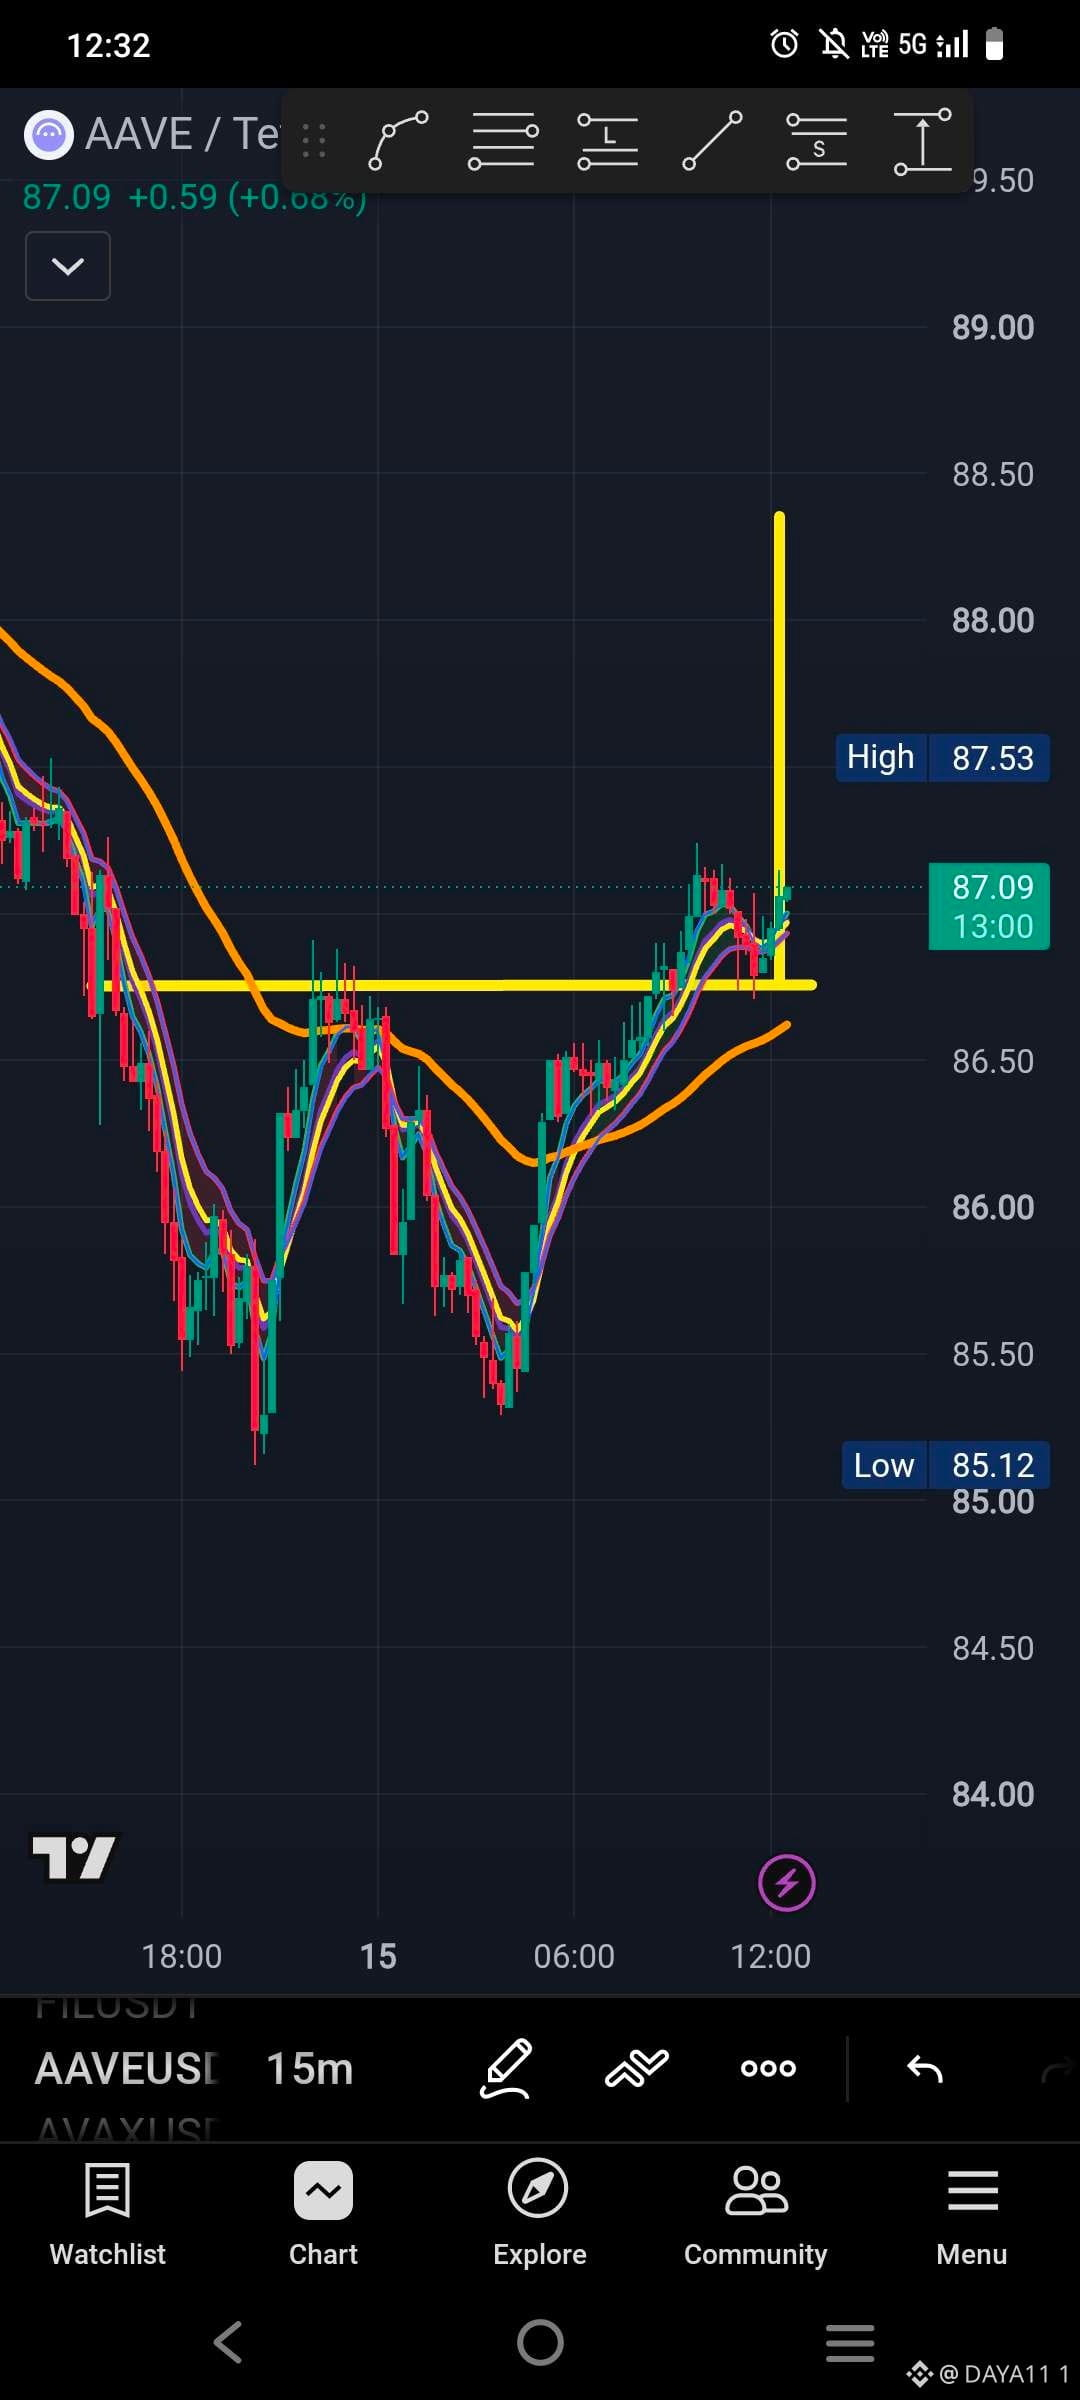
Dies ist ein 15-minütiger Zeitrahmen-Trade
Long - $87
Stop-Loss - $86.32
TP1- $87.25
TP2- $87.75
TP3- $88.33
Mach deine eigene Recherche, bevor du eintauchst
Keine Finanzberatung
$asve
Dies ist ein 15-minütiger Zeitrahmen-Trade
Long - $87
Stop-Loss - $86.32
TP1- $87.25
TP2- $87.75
TP3- $88.33
Mach deine eigene Recherche, bevor du eintauchst
Keine Finanzberatung
Dies ist ein 15-minütiger Zeitrahmen-Trade
Long - $87
Stop-Loss - $86.32
TP1- $87.25
TP2- $87.75
TP3- $88.33
Mach deine eigene Recherche, bevor du eintauchst
Keine Finanzberatung
67
·
--
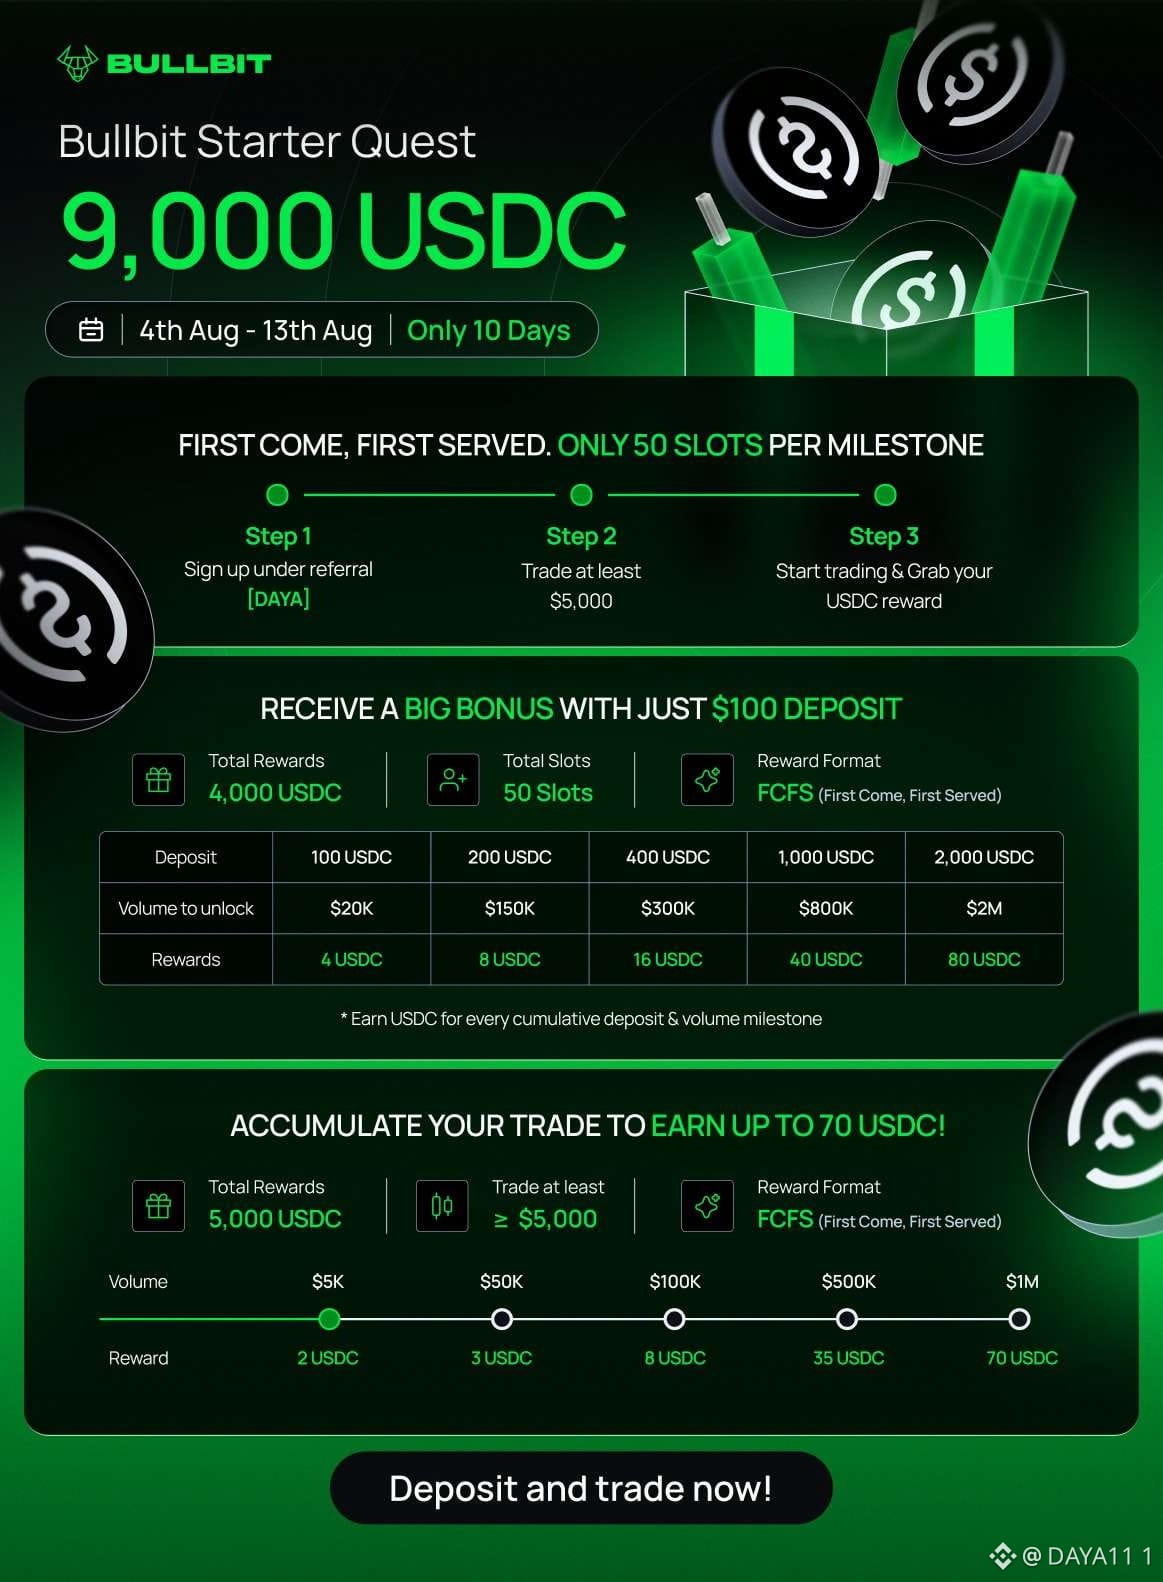
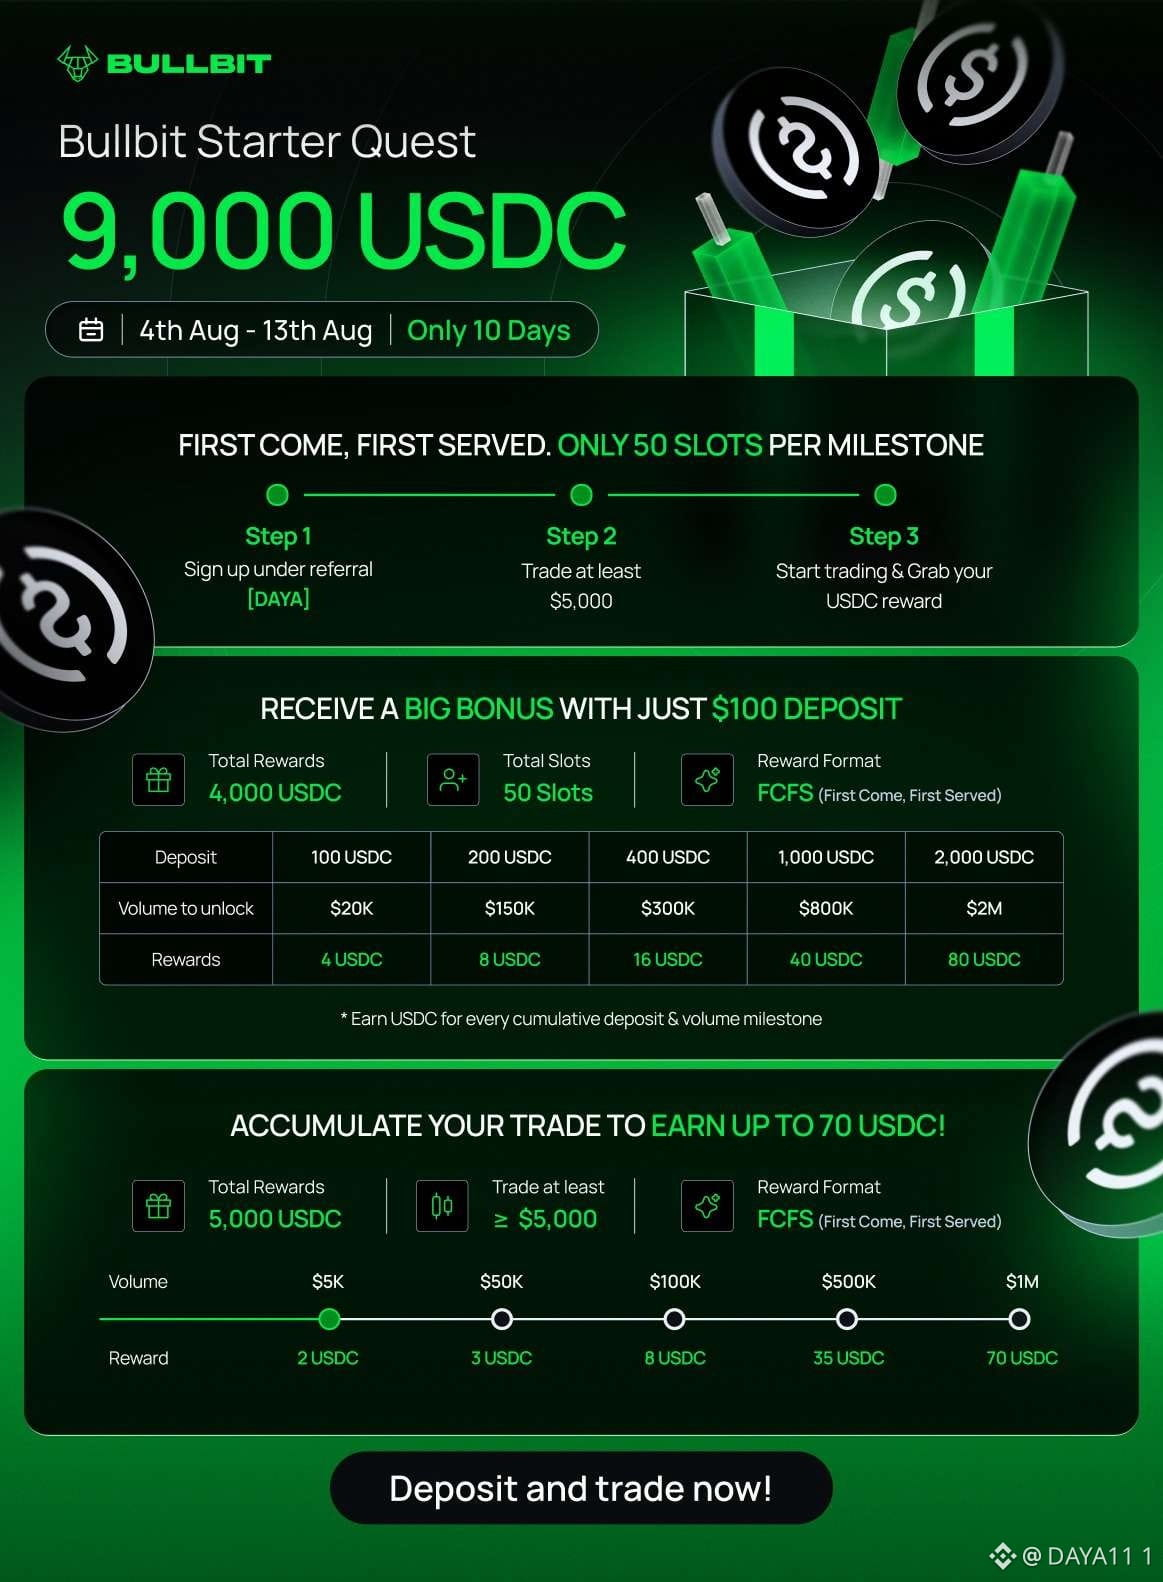
🚀 Bullbit Starter Quest ist JETZT LIVE!
Sichere dir deinen Anteil an 9.000 USDC Belohnungen
+ 20% Cashback-Angebot 💰
✅ Melde dich über meinen Referral an
✅ Folge meinen Trades 100% KOSTENLOS
✅ Trade & starte mit dem Verdienen
📅 Nur bis zum 13. August | Begrenzte Plätze
👉 Jetzt beitreten: https://app.bullbit.ai/sign-up?ref=DAYA
#Bullbit #Krypto #Trading
🚀 Bullbit Starter Quest ist JETZT LIVE!
Sichere dir deinen Anteil an 9.000 USDC Belohnungen
+ 20% Cashback-Angebot 💰
✅ Melde dich über meinen Referral an
✅ Folge meinen Trades 100% KOSTENLOS
✅ Trade & starte mit dem Verdienen
📅 Nur bis zum 13. August | Begrenzte Plätze
👉 Jetzt beitreten: https://app.bullbit.ai/sign-up?ref=DAYA
#Bullbit #Krypto #Trading
Sichere dir deinen Anteil an 9.000 USDC Belohnungen
+ 20% Cashback-Angebot 💰
✅ Melde dich über meinen Referral an
✅ Folge meinen Trades 100% KOSTENLOS
✅ Trade & starte mit dem Verdienen
📅 Nur bis zum 13. August | Begrenzte Plätze
👉 Jetzt beitreten: https://app.bullbit.ai/sign-up?ref=DAYA
#Bullbit #Krypto #Trading
·
--
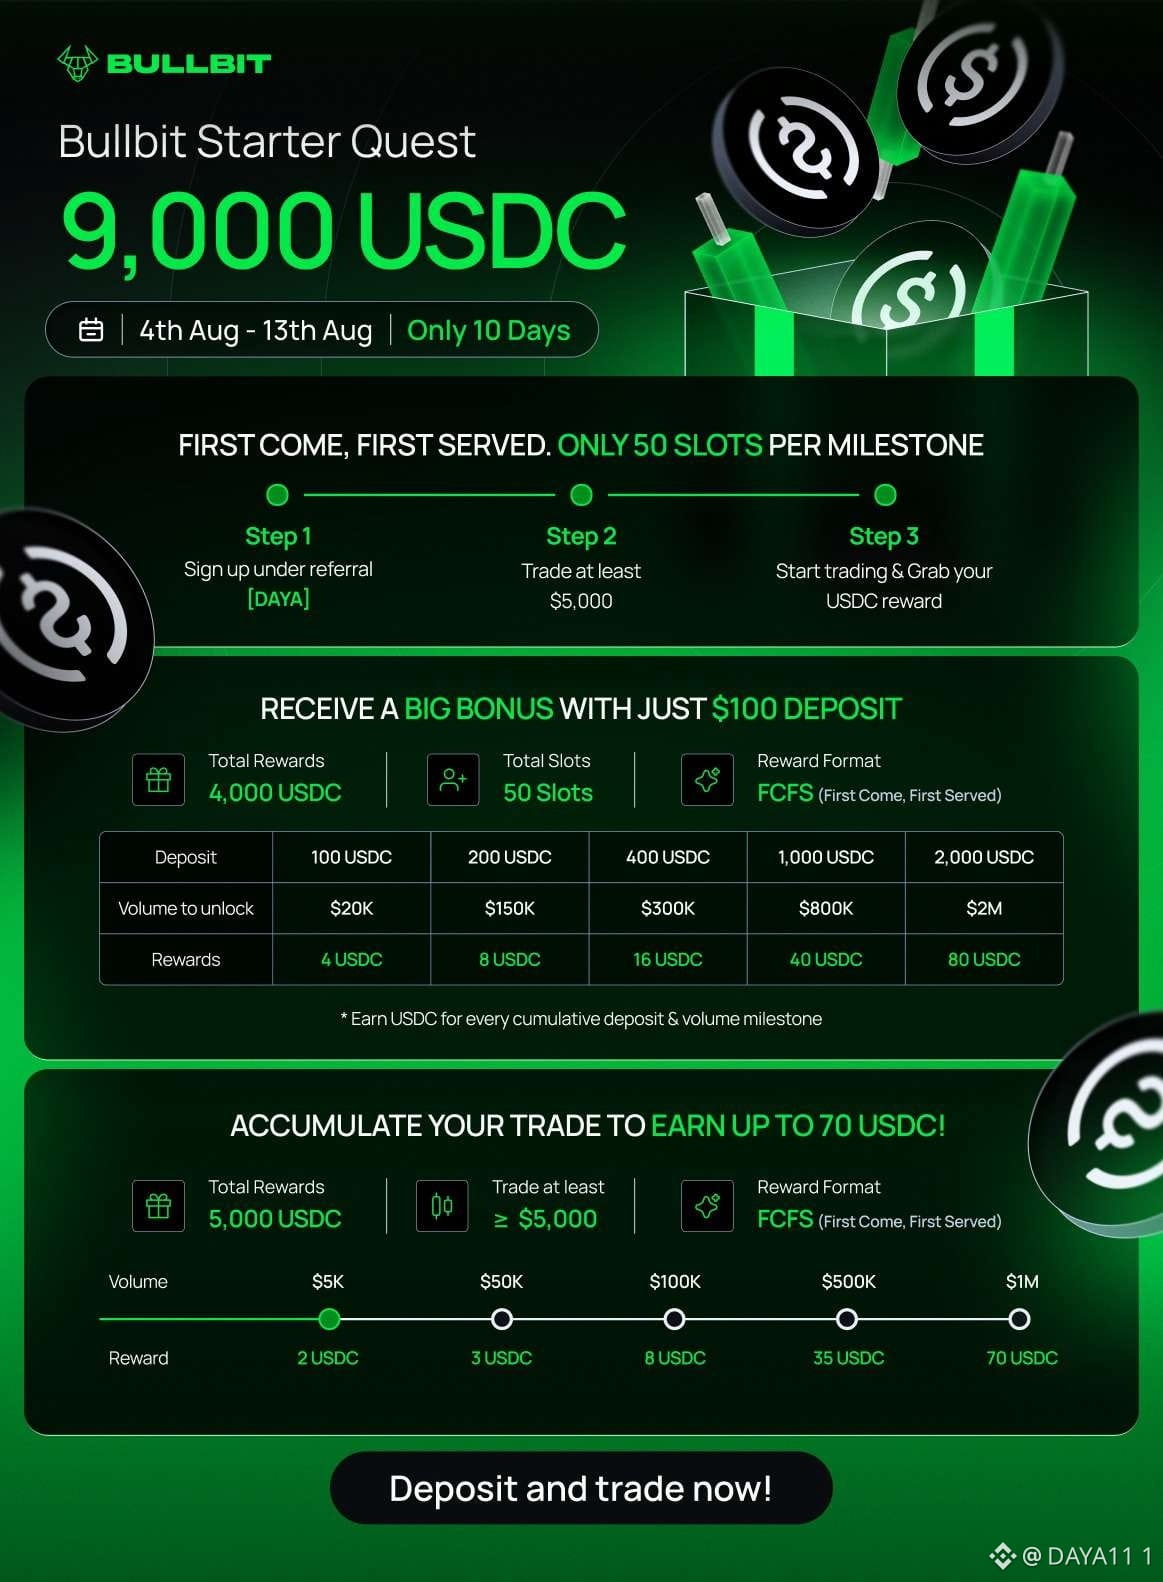
🚀 Bullbit Starter Quest ist LIVE!
Sichere dir deinen Anteil an 9.000 USDC Belohnungen
+20% Cashback-Angebot 💰
✅ Melde dich mit meinem Referral an
✅ Folge meinen Trades 100% KOSTENLOS
✅ Trade & starte mit dem Verdienen
📅 Nur bis zum 13. August | Begrenzte Plätze
👉 Jetzt beitreten:
https://app.bullbit.ai/sign-up?ref=DAYA
#Bullbit #Krypto #Trading
🚀 Bullbit Starter Quest ist LIVE!
Sichere dir deinen Anteil an 9.000 USDC Belohnungen
+20% Cashback-Angebot 💰
✅ Melde dich mit meinem Referral an
✅ Folge meinen Trades 100% KOSTENLOS
✅ Trade & starte mit dem Verdienen
📅 Nur bis zum 13. August | Begrenzte Plätze
👉 Jetzt beitreten:
https://app.bullbit.ai/sign-up?ref=DAYA
#Bullbit #Krypto #Trading
Sichere dir deinen Anteil an 9.000 USDC Belohnungen
+20% Cashback-Angebot 💰
✅ Melde dich mit meinem Referral an
✅ Folge meinen Trades 100% KOSTENLOS
✅ Trade & starte mit dem Verdienen
📅 Nur bis zum 13. August | Begrenzte Plätze
👉 Jetzt beitreten:
https://app.bullbit.ai/sign-up?ref=DAYA
#Bullbit #Krypto #Trading
3
·
--
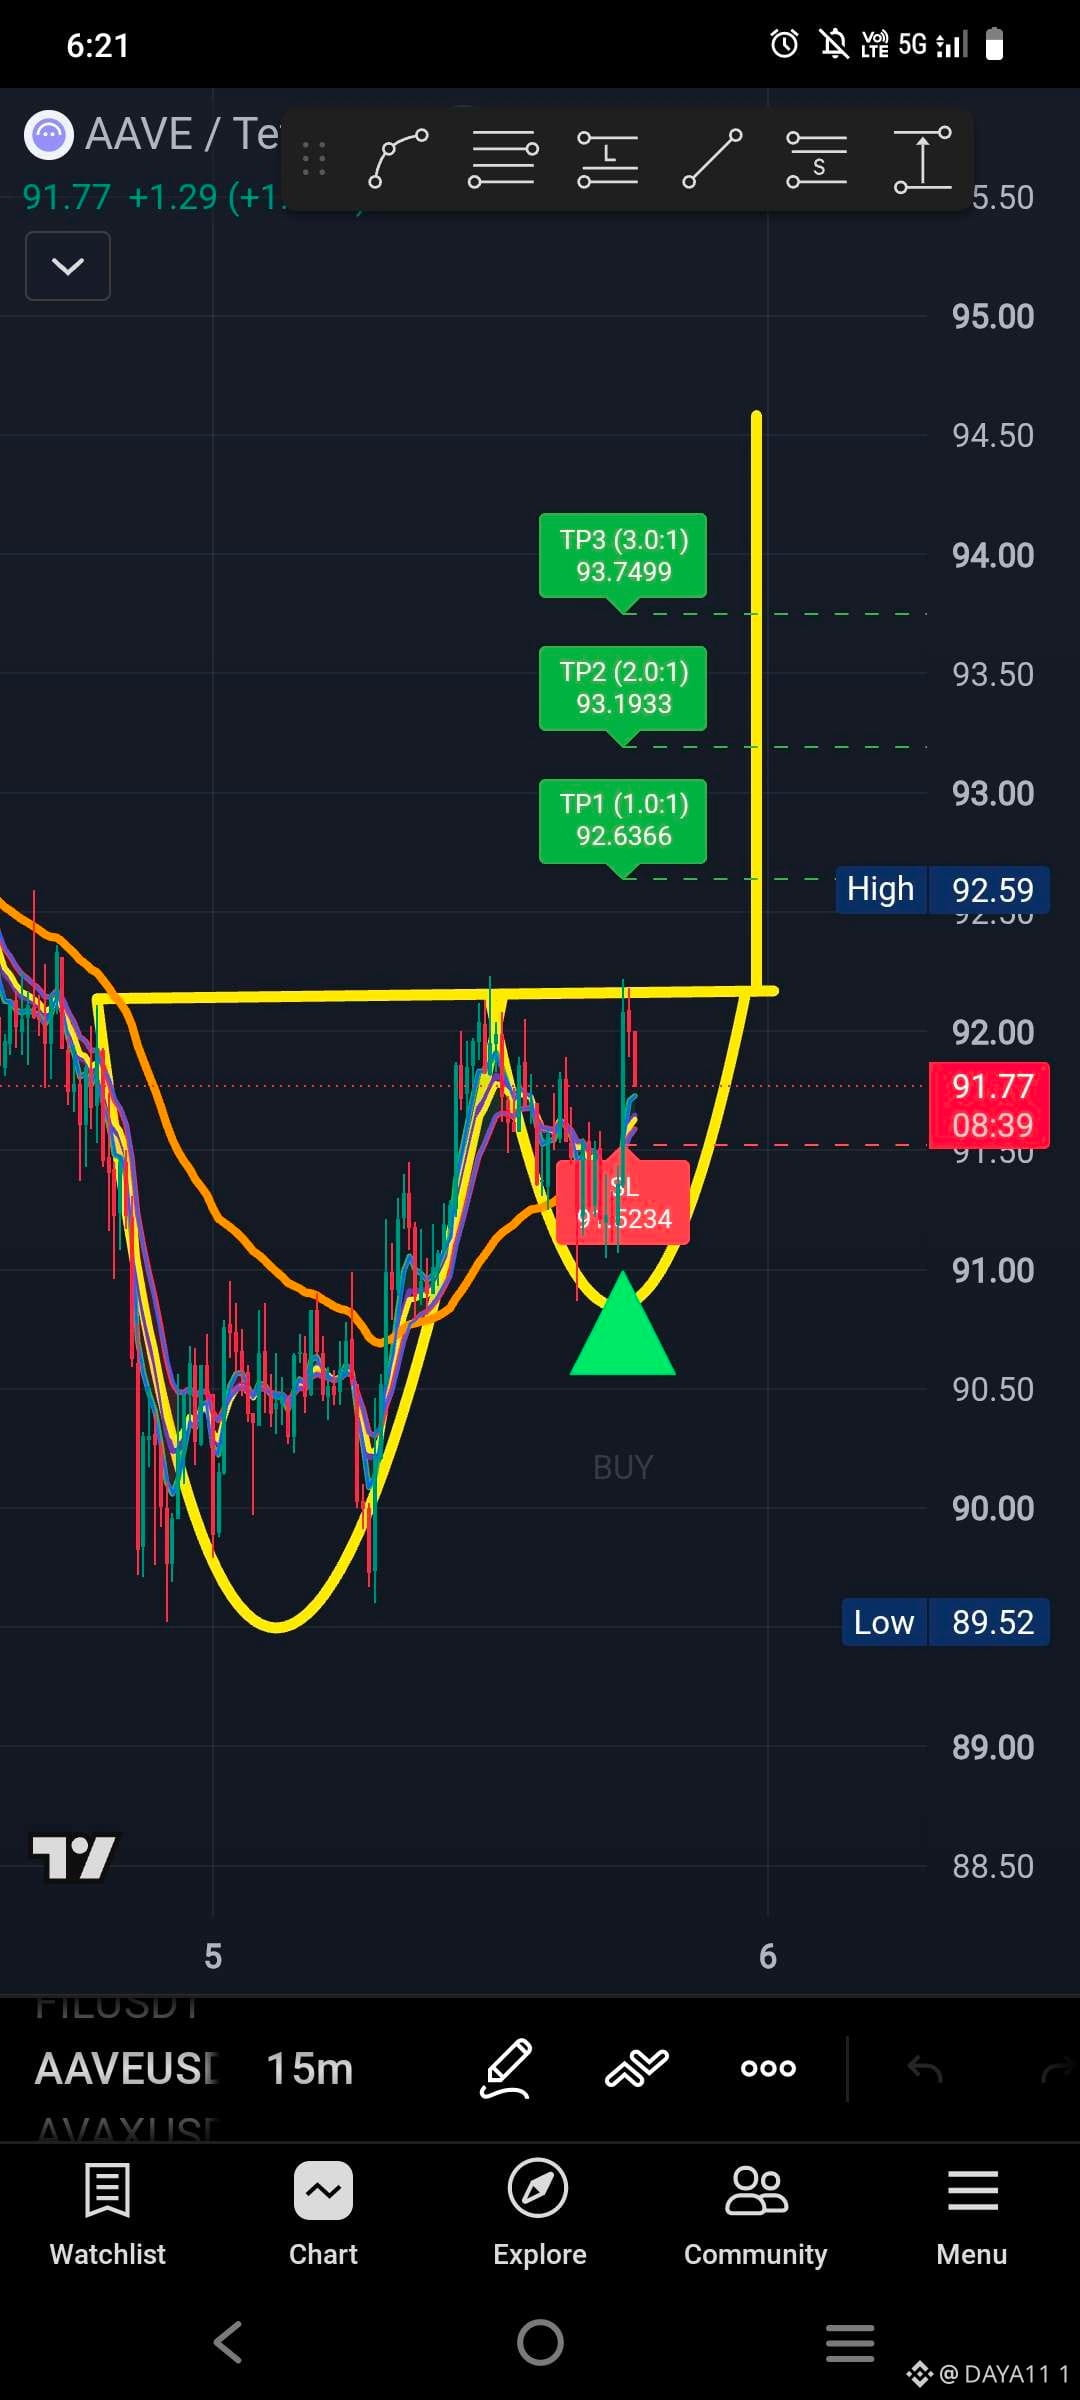
$AAVE
✅Einstiegszone:
Umgibt den aktuellen Kurs ~91.85
🔴SL: 91 (eng, unter der jüngsten Struktur + dem zweiten Tiefpunkt des W)
Ziele:
🎯TP1 (1R) → 92.38
🎯TP2 (2R) → 92.92
🎯TP3 (3R) → 93.45
Das passt ziemlich gut zu dem Muster, das wir vorher gesehen haben. Der gemessene Move vom doppelten Boden zeigte in Richtung der mittleren 94er, daher ist TP3 immer noch konservativ im Vergleich dazu.
Was mir gefällt:
SL ist logisch (unter dem jüngsten Tief + der Nackenlinien-Unterstützung)
Chance/Risiko ist sauber
Indikator + Chartmuster stimmen überein
Worauf du achten solltest:
Der Kurs schwebt immer noch knapp über dem Breakout-Level. Ein schneller Retest von ~91.40–91.50 und ein Halten wäre ideal.
Wenn er die SL-Zone sauber verliert, ist das Setup ungültig und das W-Muster scheitert.
Insgesamt sieht das nach einem soliden kurzfristigen Long-Setup auf dem 15m aus. Die Kombination aus W-Struktur + Indikator-Signal macht es wahrscheinlicher als jeweils allein.
#NFA #DYOR
$AAVE
✅Einstiegszone:
Umgibt den aktuellen Kurs ~91.85
🔴SL: 91 (eng, unter der jüngsten Struktur + dem zweiten Tiefpunkt des W)
Ziele:
🎯TP1 (1R) → 92.38
🎯TP2 (2R) → 92.92
🎯TP3 (3R) → 93.45
Das passt ziemlich gut zu dem Muster, das wir vorher gesehen haben. Der gemessene Move vom doppelten Boden zeigte in Richtung der mittleren 94er, daher ist TP3 immer noch konservativ im Vergleich dazu.
Was mir gefällt:
SL ist logisch (unter dem jüngsten Tief + der Nackenlinien-Unterstützung)
Chance/Risiko ist sauber
Indikator + Chartmuster stimmen überein
Worauf du achten solltest:
Der Kurs schwebt immer noch knapp über dem Breakout-Level. Ein schneller Retest von ~91.40–91.50 und ein Halten wäre ideal.
Wenn er die SL-Zone sauber verliert, ist das Setup ungültig und das W-Muster scheitert.
Insgesamt sieht das nach einem soliden kurzfristigen Long-Setup auf dem 15m aus. Die Kombination aus W-Struktur + Indikator-Signal macht es wahrscheinlicher als jeweils allein.
#NFA #DYOR
✅Einstiegszone:
Umgibt den aktuellen Kurs ~91.85
🔴SL: 91 (eng, unter der jüngsten Struktur + dem zweiten Tiefpunkt des W)
Ziele:
🎯TP1 (1R) → 92.38
🎯TP2 (2R) → 92.92
🎯TP3 (3R) → 93.45
Das passt ziemlich gut zu dem Muster, das wir vorher gesehen haben. Der gemessene Move vom doppelten Boden zeigte in Richtung der mittleren 94er, daher ist TP3 immer noch konservativ im Vergleich dazu.
Was mir gefällt:
SL ist logisch (unter dem jüngsten Tief + der Nackenlinien-Unterstützung)
Chance/Risiko ist sauber
Indikator + Chartmuster stimmen überein
Worauf du achten solltest:
Der Kurs schwebt immer noch knapp über dem Breakout-Level. Ein schneller Retest von ~91.40–91.50 und ein Halten wäre ideal.
Wenn er die SL-Zone sauber verliert, ist das Setup ungültig und das W-Muster scheitert.
Insgesamt sieht das nach einem soliden kurzfristigen Long-Setup auf dem 15m aus. Die Kombination aus W-Struktur + Indikator-Signal macht es wahrscheinlicher als jeweils allein.
#NFA #DYOR
75
·
--
Wenn du meinen vorherigen Beitrag gelesen hast, dann lies hier weiter
Die Schwachstelle war bereits im Saatgut angelegt, in dem Moment, in dem es damals vor Jahren erzeugt wurde.
🔴Warum das nicht bedeutet, dass das Unternehmen „die Seeds kannte“
Coinkite hat keine individuellen Seed-Phrasen gespeichert oder gewusst.
Das Problem war ein seit langem bestehender Codierungsfehler bei der Art, wie die Zufallszahlen erzeugt wurden. Da die Firmware quelloffen ist, konnte jeder, der den alten Code sorgfältig studierte (und Coinkite selbst sagt, KI-Tools hätten wahrscheinlich geholfen), herausfinden, dass die Zufälligkeit fehlerhaft war, und dann die möglichen schwachen Seeds offline berechnen.
Es ist ein schwerwiegender Unternehmensfehler — ein kritischer Bug, der jahrelang existierte —, aber es ist kein Beleg dafür, dass Coinkite kompromittiert war und heimlich eine Liste von Benutzers Seeds führte. Wenn das passiert wäre, würde das Angriffsmuster sehr anders aussehen.
Zusammenfassung in einfachen Worten.
✅Normale Seeds → nicht erratbar (zu viele Möglichkeiten).
✅Diese fehlerhaften Seeds → viel weniger Möglichkeiten wegen des Firmware-Bugs → für einen gut ausgestatteten Angreifer offline berechenbar.
Die Hardware-Wallets blieben offline und unberührt. Der Schaden war bereits in dem Moment angerichtet, als das schwache Seed erzeugt wurde.
Darum hat dieser Vorfall so viele Menschen schockiert. Er hat die zentrale Annahme gebrochen, dass „wenn das Gerät offline ist und das Seed niemals das Gerät verlassen hat, das Geld sicher ist“. Wenn die Zufälligkeit selbst kaputt ist, schlägt diese Annahme fehl.
Wenn du in dem betroffenen Zeitraum auf einer Coldcard ein Seed erzeugt hast, ist der einzige sichere Weg weiterhin der offizielle: auf die korrigierte Firmware aktualisieren, ein vollständig neues Seed erstellen und die Gelder sorgfältig umschichten. Normale, korrekt erzeugte Seeds in anderen Wallets (oder auf korrigierter Coldcard-Firmware) bleiben sicher.
Wenn du meinen vorherigen Beitrag gelesen hast, dann lies hier weiter
Die Schwachstelle war bereits im Saatgut angelegt, in dem Moment, in dem es damals vor Jahren erzeugt wurde.
🔴Warum das nicht bedeutet, dass das Unternehmen „die Seeds kannte“
Coinkite hat keine individuellen Seed-Phrasen gespeichert oder gewusst.
Das Problem war ein seit langem bestehender Codierungsfehler bei der Art, wie die Zufallszahlen erzeugt wurden. Da die Firmware quelloffen ist, konnte jeder, der den alten Code sorgfältig studierte (und Coinkite selbst sagt, KI-Tools hätten wahrscheinlich geholfen), herausfinden, dass die Zufälligkeit fehlerhaft war, und dann die möglichen schwachen Seeds offline berechnen.
Es ist ein schwerwiegender Unternehmensfehler — ein kritischer Bug, der jahrelang existierte —, aber es ist kein Beleg dafür, dass Coinkite kompromittiert war und heimlich eine Liste von Benutzers Seeds führte. Wenn das passiert wäre, würde das Angriffsmuster sehr anders aussehen.
Zusammenfassung in einfachen Worten.
✅Normale Seeds → nicht erratbar (zu viele Möglichkeiten).
✅Diese fehlerhaften Seeds → viel weniger Möglichkeiten wegen des Firmware-Bugs → für einen gut ausgestatteten Angreifer offline berechenbar.
Die Hardware-Wallets blieben offline und unberührt. Der Schaden war bereits in dem Moment angerichtet, als das schwache Seed erzeugt wurde.
Darum hat dieser Vorfall so viele Menschen schockiert. Er hat die zentrale Annahme gebrochen, dass „wenn das Gerät offline ist und das Seed niemals das Gerät verlassen hat, das Geld sicher ist“. Wenn die Zufälligkeit selbst kaputt ist, schlägt diese Annahme fehl.
Wenn du in dem betroffenen Zeitraum auf einer Coldcard ein Seed erzeugt hast, ist der einzige sichere Weg weiterhin der offizielle: auf die korrigierte Firmware aktualisieren, ein vollständig neues Seed erstellen und die Gelder sorgfältig umschichten. Normale, korrekt erzeugte Seeds in anderen Wallets (oder auf korrigierter Coldcard-Firmware) bleiben sicher.
Die Schwachstelle war bereits im Saatgut angelegt, in dem Moment, in dem es damals vor Jahren erzeugt wurde.
🔴Warum das nicht bedeutet, dass das Unternehmen „die Seeds kannte“
Coinkite hat keine individuellen Seed-Phrasen gespeichert oder gewusst.
Das Problem war ein seit langem bestehender Codierungsfehler bei der Art, wie die Zufallszahlen erzeugt wurden. Da die Firmware quelloffen ist, konnte jeder, der den alten Code sorgfältig studierte (und Coinkite selbst sagt, KI-Tools hätten wahrscheinlich geholfen), herausfinden, dass die Zufälligkeit fehlerhaft war, und dann die möglichen schwachen Seeds offline berechnen.
Es ist ein schwerwiegender Unternehmensfehler — ein kritischer Bug, der jahrelang existierte —, aber es ist kein Beleg dafür, dass Coinkite kompromittiert war und heimlich eine Liste von Benutzers Seeds führte. Wenn das passiert wäre, würde das Angriffsmuster sehr anders aussehen.
Zusammenfassung in einfachen Worten.
✅Normale Seeds → nicht erratbar (zu viele Möglichkeiten).
✅Diese fehlerhaften Seeds → viel weniger Möglichkeiten wegen des Firmware-Bugs → für einen gut ausgestatteten Angreifer offline berechenbar.
Die Hardware-Wallets blieben offline und unberührt. Der Schaden war bereits in dem Moment angerichtet, als das schwache Seed erzeugt wurde.
Darum hat dieser Vorfall so viele Menschen schockiert. Er hat die zentrale Annahme gebrochen, dass „wenn das Gerät offline ist und das Seed niemals das Gerät verlassen hat, das Geld sicher ist“. Wenn die Zufälligkeit selbst kaputt ist, schlägt diese Annahme fehl.
Wenn du in dem betroffenen Zeitraum auf einer Coldcard ein Seed erzeugt hast, ist der einzige sichere Weg weiterhin der offizielle: auf die korrigierte Firmware aktualisieren, ein vollständig neues Seed erstellen und die Gelder sorgfältig umschichten. Normale, korrekt erzeugte Seeds in anderen Wallets (oder auf korrigierter Coldcard-Firmware) bleiben sicher.

71
·
--
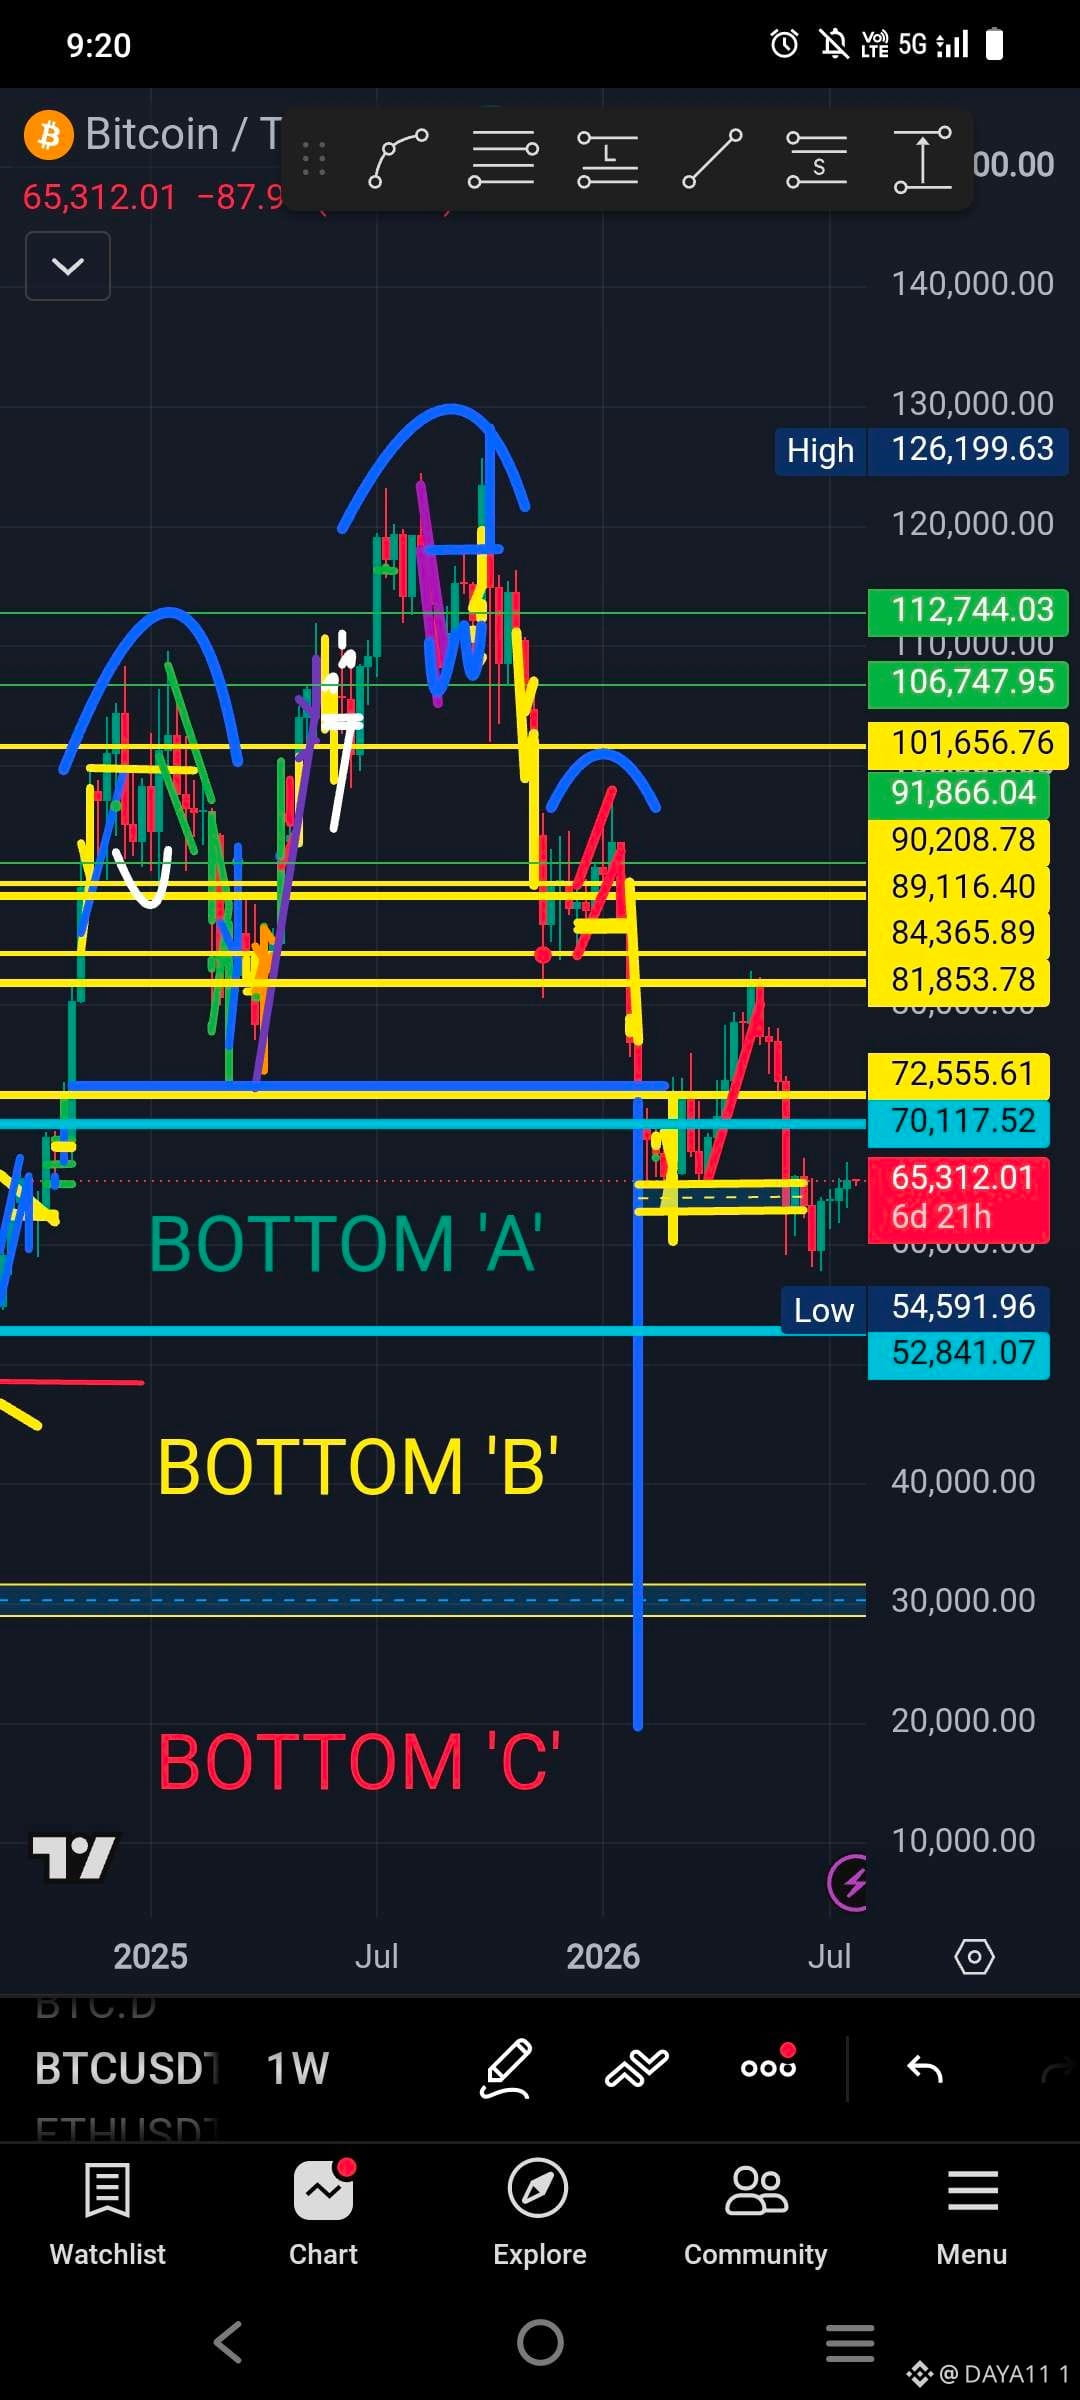
$BTC
Wo ist der Boden? Hier oder abwarten? 👇
Der Boden ist im Juli?
Der Boden ist im Oktober? ( Im Oktober wurde der 4-Jahres-Zyklus abgeschlossen.) Lies meinen vorherigen Beitrag dazu.
Mein 1w Kopf-&-Schulter-Muster 👇
🚨#AscendEX (früher BitMax): ZachXBT hat verzögerte/steckengebliebene Abhebungen und nahezu leere Hot Wallets (fehlende große liquide Assets wie ETH, USDT, USDC, SOL) für Ende Juni 2026 gemeldet. Die Börse stellte dann den Betrieb vollständig ein – mit Wirkung zum 1. Juli – und nannte MiCA (keine Genehmigung), einen gescheiterten strategischen Liquiditätsdeal sowie allgemeinen finanziellen/betrieblichen Druck. Automatisierte Abhebungen wurden gestoppt; alles wurde in die manuelle Prüfung überführt – ohne Zusicherungen zu Zeitplan oder vollen Beträgen.
🚨#BitMEX: Nach 11 Jahren (dem Pionier des Perpetual-Swaps) angekündigtes Auslaufen. Schließung am 23. September 2026. Neue Registrierungen werden gestoppt; Positionen werden schrittweise zwangsliquidiert. Gleichzeitig gab es eine Klage, die eine „Insider-Trading Desk“-Anlaufstelle behauptet, sowie ein konstruiertes Server-Freeze, um Liquidationen auszulösen.
🚨#BitMart: Soeben angekündigt (26. Juli 2026) ein geordnetes Auslaufen nach neun Jahren. Neue Registrierungen/Einzahlungen/neue Orders werden sofort ausgesetzt; der Handel endet am 26. August; der Plattformbetrieb wird am 31. Januar 2027 eingestellt. Abhebungen bleiben (vorerst) offen – mit zusätzlichen Compliance-Überprüfungen. Das BMX-Token ist um ~58–60% abgestürzt. Der globale CEO sagte, er sei entlassen worden und nicht in die Entscheidung einbezogen worden.
Letzter Zyklus war es #FTX (plus eine Reihe weiterer). Diesen Zyklus ist es ein Cluster aus mittelklassigen und Legacy-Plattformen, die still (oder nicht ganz so still) unter Liquiditäts-, Regulierungs- (insbesondere MiCA-) und „Marktumfeld“-Druck aussteigen.
✅Ob genau dieser Moment der Boden ist, ist das klassische Glücksspiel des Bottom-Callers. Diese Ausfälle sind typische Spät-Bär / Früh-Erholung-Signale (Kapitulation am Rand + erzwungene Enthebelung). Sie entfernen Leverage und schwache Hände – so heilen Märkte.
✅Aber die Preisbestätigung braucht weiterhin die üblichen Verdächtigen: anhaltende ETF-Zuflüsse, die positiv werden, ein Wandel im Verhalten langfristiger Inhaber und dass das Makroumfeld nicht noch eine weitere Abwärtsbewegung liefert.
$BTC
Wo ist der Boden? Hier oder abwarten? 👇
Der Boden ist im Juli?
Der Boden ist im Oktober? ( Im Oktober wurde der 4-Jahres-Zyklus abgeschlossen.) Lies meinen vorherigen Beitrag dazu.
Mein 1w Kopf-&-Schulter-Muster 👇
🚨#AscendEX (früher BitMax): ZachXBT hat verzögerte/steckengebliebene Abhebungen und nahezu leere Hot Wallets (fehlende große liquide Assets wie ETH, USDT, USDC, SOL) für Ende Juni 2026 gemeldet. Die Börse stellte dann den Betrieb vollständig ein – mit Wirkung zum 1. Juli – und nannte MiCA (keine Genehmigung), einen gescheiterten strategischen Liquiditätsdeal sowie allgemeinen finanziellen/betrieblichen Druck. Automatisierte Abhebungen wurden gestoppt; alles wurde in die manuelle Prüfung überführt – ohne Zusicherungen zu Zeitplan oder vollen Beträgen.
🚨#BitMEX: Nach 11 Jahren (dem Pionier des Perpetual-Swaps) angekündigtes Auslaufen. Schließung am 23. September 2026. Neue Registrierungen werden gestoppt; Positionen werden schrittweise zwangsliquidiert. Gleichzeitig gab es eine Klage, die eine „Insider-Trading Desk“-Anlaufstelle behauptet, sowie ein konstruiertes Server-Freeze, um Liquidationen auszulösen.
🚨#BitMart: Soeben angekündigt (26. Juli 2026) ein geordnetes Auslaufen nach neun Jahren. Neue Registrierungen/Einzahlungen/neue Orders werden sofort ausgesetzt; der Handel endet am 26. August; der Plattformbetrieb wird am 31. Januar 2027 eingestellt. Abhebungen bleiben (vorerst) offen – mit zusätzlichen Compliance-Überprüfungen. Das BMX-Token ist um ~58–60% abgestürzt. Der globale CEO sagte, er sei entlassen worden und nicht in die Entscheidung einbezogen worden.
Letzter Zyklus war es #FTX (plus eine Reihe weiterer). Diesen Zyklus ist es ein Cluster aus mittelklassigen und Legacy-Plattformen, die still (oder nicht ganz so still) unter Liquiditäts-, Regulierungs- (insbesondere MiCA-) und „Marktumfeld“-Druck aussteigen.
✅Ob genau dieser Moment der Boden ist, ist das klassische Glücksspiel des Bottom-Callers. Diese Ausfälle sind typische Spät-Bär / Früh-Erholung-Signale (Kapitulation am Rand + erzwungene Enthebelung). Sie entfernen Leverage und schwache Hände – so heilen Märkte.
✅Aber die Preisbestätigung braucht weiterhin die üblichen Verdächtigen: anhaltende ETF-Zuflüsse, die positiv werden, ein Wandel im Verhalten langfristiger Inhaber und dass das Makroumfeld nicht noch eine weitere Abwärtsbewegung liefert.
Wo ist der Boden? Hier oder abwarten? 👇
Der Boden ist im Juli?
Der Boden ist im Oktober? ( Im Oktober wurde der 4-Jahres-Zyklus abgeschlossen.) Lies meinen vorherigen Beitrag dazu.
Mein 1w Kopf-&-Schulter-Muster 👇
🚨#AscendEX (früher BitMax): ZachXBT hat verzögerte/steckengebliebene Abhebungen und nahezu leere Hot Wallets (fehlende große liquide Assets wie ETH, USDT, USDC, SOL) für Ende Juni 2026 gemeldet. Die Börse stellte dann den Betrieb vollständig ein – mit Wirkung zum 1. Juli – und nannte MiCA (keine Genehmigung), einen gescheiterten strategischen Liquiditätsdeal sowie allgemeinen finanziellen/betrieblichen Druck. Automatisierte Abhebungen wurden gestoppt; alles wurde in die manuelle Prüfung überführt – ohne Zusicherungen zu Zeitplan oder vollen Beträgen.
🚨#BitMEX: Nach 11 Jahren (dem Pionier des Perpetual-Swaps) angekündigtes Auslaufen. Schließung am 23. September 2026. Neue Registrierungen werden gestoppt; Positionen werden schrittweise zwangsliquidiert. Gleichzeitig gab es eine Klage, die eine „Insider-Trading Desk“-Anlaufstelle behauptet, sowie ein konstruiertes Server-Freeze, um Liquidationen auszulösen.
🚨#BitMart: Soeben angekündigt (26. Juli 2026) ein geordnetes Auslaufen nach neun Jahren. Neue Registrierungen/Einzahlungen/neue Orders werden sofort ausgesetzt; der Handel endet am 26. August; der Plattformbetrieb wird am 31. Januar 2027 eingestellt. Abhebungen bleiben (vorerst) offen – mit zusätzlichen Compliance-Überprüfungen. Das BMX-Token ist um ~58–60% abgestürzt. Der globale CEO sagte, er sei entlassen worden und nicht in die Entscheidung einbezogen worden.
Letzter Zyklus war es #FTX (plus eine Reihe weiterer). Diesen Zyklus ist es ein Cluster aus mittelklassigen und Legacy-Plattformen, die still (oder nicht ganz so still) unter Liquiditäts-, Regulierungs- (insbesondere MiCA-) und „Marktumfeld“-Druck aussteigen.
✅Ob genau dieser Moment der Boden ist, ist das klassische Glücksspiel des Bottom-Callers. Diese Ausfälle sind typische Spät-Bär / Früh-Erholung-Signale (Kapitulation am Rand + erzwungene Enthebelung). Sie entfernen Leverage und schwache Hände – so heilen Märkte.
✅Aber die Preisbestätigung braucht weiterhin die üblichen Verdächtigen: anhaltende ETF-Zuflüsse, die positiv werden, ein Wandel im Verhalten langfristiger Inhaber und dass das Makroumfeld nicht noch eine weitere Abwärtsbewegung liefert.
73
·
--
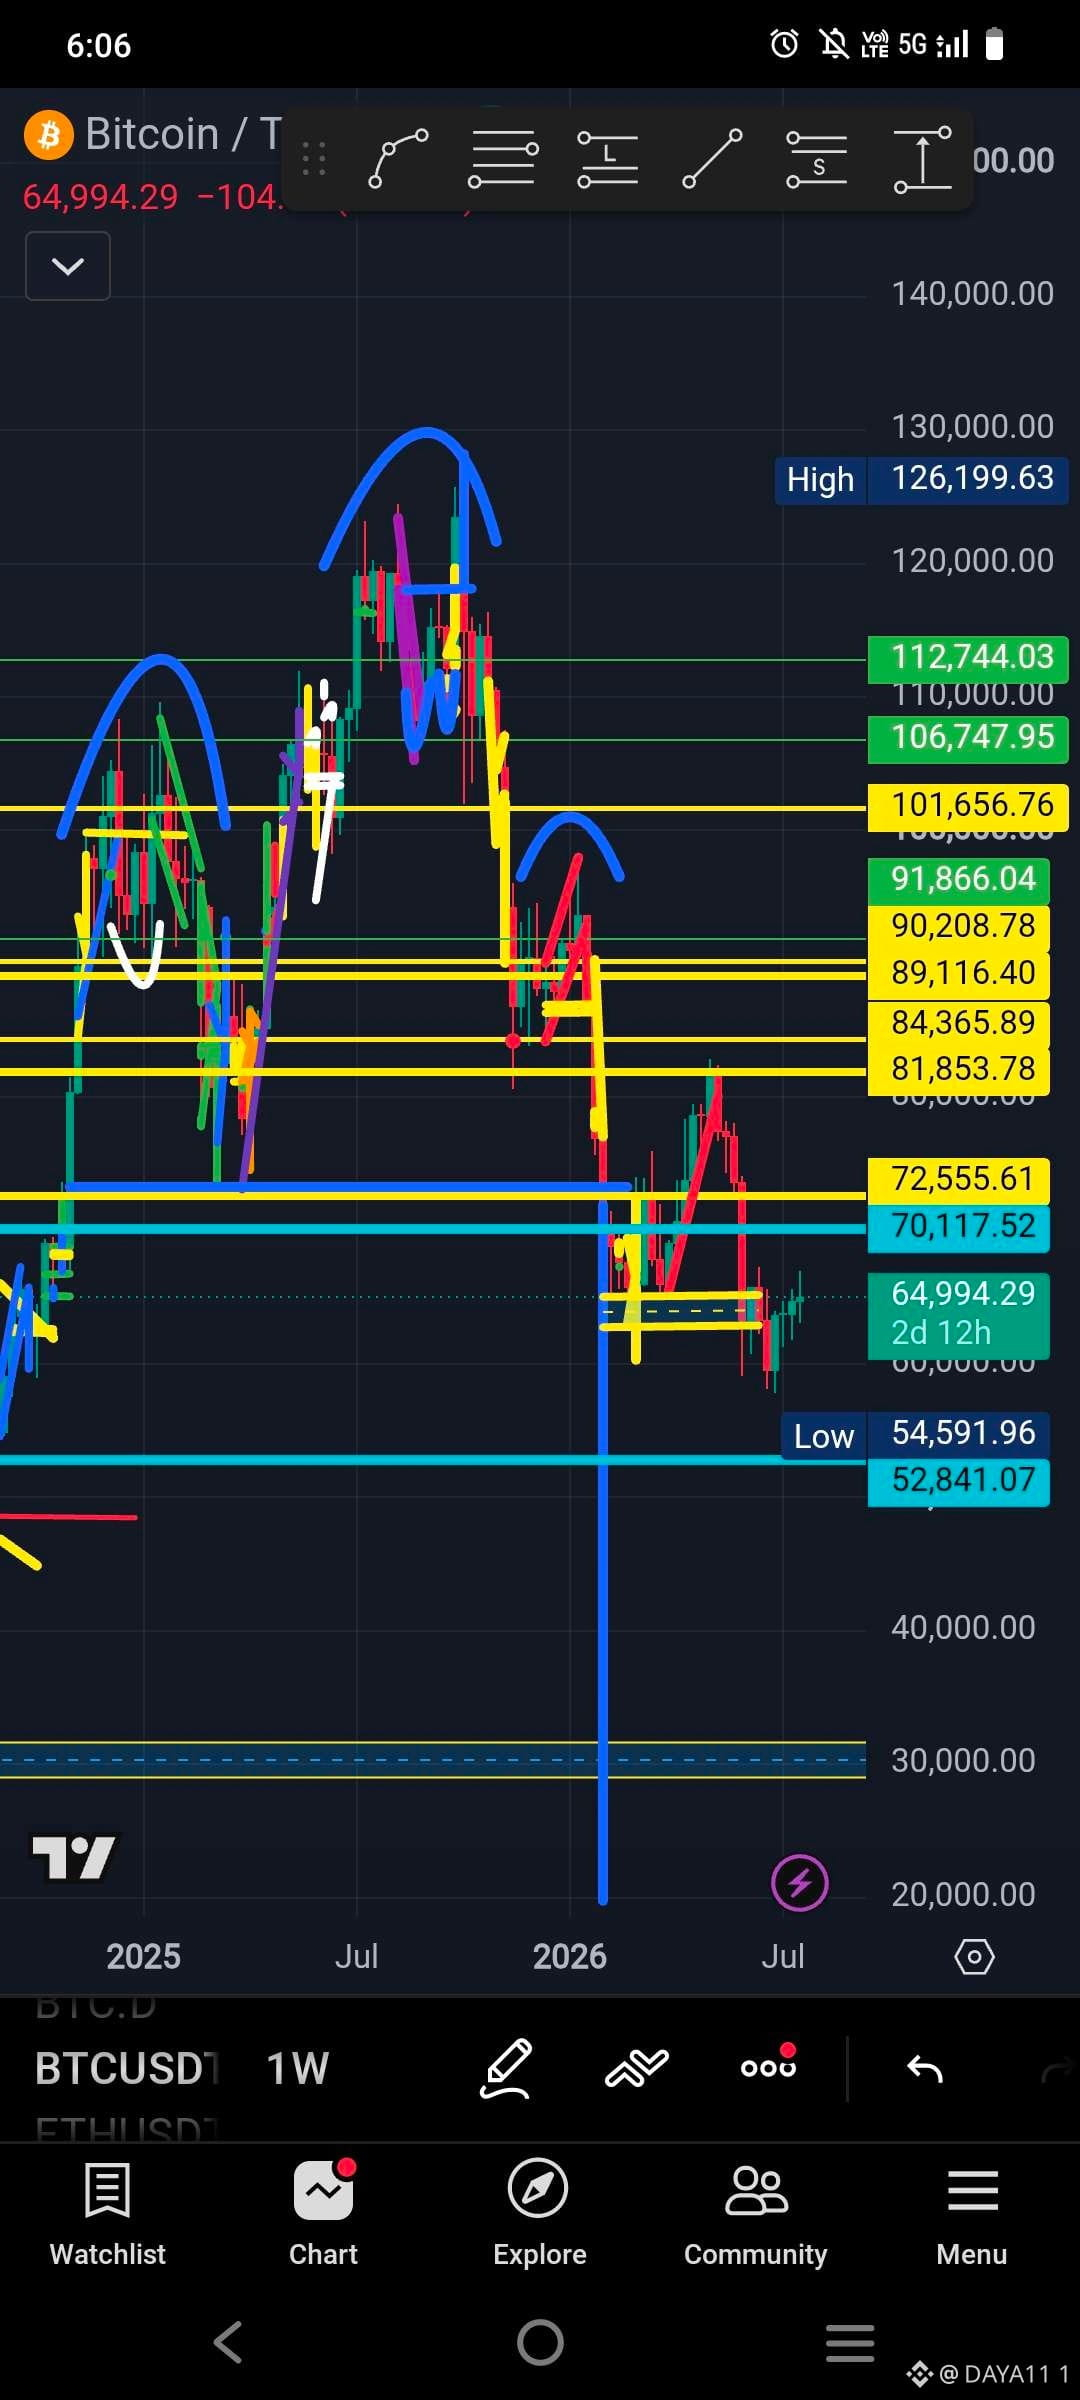
👉AKTUELLER STATUS – $BTC handelt derzeit um die Marke von etwa $62.000–$63.000, nachdem es nach den jüngsten Tiefs bei $59k eine ordentliche Erholungsbewegung gegeben hat. Es konsolidiert in einer volatilen, unruhigen Spanne und hat noch keinen überzeugenden Ausbruch geschafft.
👉65k ALS LOKALER WIDERSTAND – ja, das ist im Moment eine entscheidende Marke. Es liegt in der Nähe kurzfristiger gleitender Durchschnitte, früherer Swing-Highs und einer Zone, die Verkäufer in den letzten Tagen mehrfach verteidigt haben. Ein sauberer Daily-/Weekly-Close darüber würde die Tür zu den von mir genannten Zielen bei 70k–81k öffnen (und potenziell einen Teil der kurzfristigen bärischen Struktur ungültig machen).
👉MEIN SZENARIO V/S WAS PASSIEREN KÖNNTE – Meine Einschätzung ergibt taktisch im bärischen Kontext Sinn: Liquiditätsabgriff bei 65k–66k → Häufig in Seitwärtsphasen. Der Kurs fegt oft die Hochs ab, um Stops/Liquidität mitzunehmen, bevor eine Umkehr erfolgt.
Ablehnung und Abverkauf in Richtung 52k (diesen Monat), dann 45k–40k im nächsten Monat → Das würde das zuvor besprochene H&S-Downside-Szenario verlängern (siehe meinen vorherigen Post $BTC Kopf & Schulter-Pattern) und zu meiner größeren Zyklus-Bottom-These passen.
✅KURZFRISTIGE MÖGLICHKEITEN – (die nächsten Tage/diesen Monat):
🔴MEIN BÄR-SZENARIO (Ablehnung bei 65k–66k): Sehr wahrscheinlich, falls das Volumen auf der Oberseite schwach bleibt und wir Verkaufsmomentum nahe diesem Widerstand sehen. Ein Scheitern dort könnte tatsächlich wieder die Beschleunigung in Richtung $58k–$55k auslösen, wobei 52k als messbares Ziel gilt, falls sich das Abwärtsmomentum aufbaut.
🟢 BULLISCHES SZENARIO: Starke ETF-Zuflüsse, positive Makro-News oder Short-Covering könnten dazu führen, dass 65k durchbrochen wird und Ziele bei 68k–70k+ angesteuert werden. Juli zeigte in der Vergangenheit häufig grüne Tendenzen, nachdem in einigen Zyklen die vorherigen Monate schwach waren.
✅Mein Fazit –
Der Markt befindet sich weiterhin im Modus „Beweise es“. Meine Gesamtansicht: weiter bärischer Druck, mit einem Liquidity-Sweep nach oben, bevor die nächste Abwärtswelle startet – das ist ein klassisches Bear-Trap-/Distribution-Setup und passt zur gesamten Phase der Korrektur nach dem ATH.
👉AKTUELLER STATUS – $BTC handelt derzeit um die Marke von etwa $62.000–$63.000, nachdem es nach den jüngsten Tiefs bei $59k eine ordentliche Erholungsbewegung gegeben hat. Es konsolidiert in einer volatilen, unruhigen Spanne und hat noch keinen überzeugenden Ausbruch geschafft.
👉65k ALS LOKALER WIDERSTAND – ja, das ist im Moment eine entscheidende Marke. Es liegt in der Nähe kurzfristiger gleitender Durchschnitte, früherer Swing-Highs und einer Zone, die Verkäufer in den letzten Tagen mehrfach verteidigt haben. Ein sauberer Daily-/Weekly-Close darüber würde die Tür zu den von mir genannten Zielen bei 70k–81k öffnen (und potenziell einen Teil der kurzfristigen bärischen Struktur ungültig machen).
👉MEIN SZENARIO V/S WAS PASSIEREN KÖNNTE – Meine Einschätzung ergibt taktisch im bärischen Kontext Sinn: Liquiditätsabgriff bei 65k–66k → Häufig in Seitwärtsphasen. Der Kurs fegt oft die Hochs ab, um Stops/Liquidität mitzunehmen, bevor eine Umkehr erfolgt.
Ablehnung und Abverkauf in Richtung 52k (diesen Monat), dann 45k–40k im nächsten Monat → Das würde das zuvor besprochene H&S-Downside-Szenario verlängern (siehe meinen vorherigen Post $BTC Kopf & Schulter-Pattern) und zu meiner größeren Zyklus-Bottom-These passen.
✅KURZFRISTIGE MÖGLICHKEITEN – (die nächsten Tage/diesen Monat):
🔴MEIN BÄR-SZENARIO (Ablehnung bei 65k–66k): Sehr wahrscheinlich, falls das Volumen auf der Oberseite schwach bleibt und wir Verkaufsmomentum nahe diesem Widerstand sehen. Ein Scheitern dort könnte tatsächlich wieder die Beschleunigung in Richtung $58k–$55k auslösen, wobei 52k als messbares Ziel gilt, falls sich das Abwärtsmomentum aufbaut.
🟢 BULLISCHES SZENARIO: Starke ETF-Zuflüsse, positive Makro-News oder Short-Covering könnten dazu führen, dass 65k durchbrochen wird und Ziele bei 68k–70k+ angesteuert werden. Juli zeigte in der Vergangenheit häufig grüne Tendenzen, nachdem in einigen Zyklen die vorherigen Monate schwach waren.
✅Mein Fazit –
Der Markt befindet sich weiterhin im Modus „Beweise es“. Meine Gesamtansicht: weiter bärischer Druck, mit einem Liquidity-Sweep nach oben, bevor die nächste Abwärtswelle startet – das ist ein klassisches Bear-Trap-/Distribution-Setup und passt zur gesamten Phase der Korrektur nach dem ATH.
👉65k ALS LOKALER WIDERSTAND – ja, das ist im Moment eine entscheidende Marke. Es liegt in der Nähe kurzfristiger gleitender Durchschnitte, früherer Swing-Highs und einer Zone, die Verkäufer in den letzten Tagen mehrfach verteidigt haben. Ein sauberer Daily-/Weekly-Close darüber würde die Tür zu den von mir genannten Zielen bei 70k–81k öffnen (und potenziell einen Teil der kurzfristigen bärischen Struktur ungültig machen).
👉MEIN SZENARIO V/S WAS PASSIEREN KÖNNTE – Meine Einschätzung ergibt taktisch im bärischen Kontext Sinn: Liquiditätsabgriff bei 65k–66k → Häufig in Seitwärtsphasen. Der Kurs fegt oft die Hochs ab, um Stops/Liquidität mitzunehmen, bevor eine Umkehr erfolgt.
Ablehnung und Abverkauf in Richtung 52k (diesen Monat), dann 45k–40k im nächsten Monat → Das würde das zuvor besprochene H&S-Downside-Szenario verlängern (siehe meinen vorherigen Post $BTC Kopf & Schulter-Pattern) und zu meiner größeren Zyklus-Bottom-These passen.
✅KURZFRISTIGE MÖGLICHKEITEN – (die nächsten Tage/diesen Monat):
🔴MEIN BÄR-SZENARIO (Ablehnung bei 65k–66k): Sehr wahrscheinlich, falls das Volumen auf der Oberseite schwach bleibt und wir Verkaufsmomentum nahe diesem Widerstand sehen. Ein Scheitern dort könnte tatsächlich wieder die Beschleunigung in Richtung $58k–$55k auslösen, wobei 52k als messbares Ziel gilt, falls sich das Abwärtsmomentum aufbaut.
🟢 BULLISCHES SZENARIO: Starke ETF-Zuflüsse, positive Makro-News oder Short-Covering könnten dazu führen, dass 65k durchbrochen wird und Ziele bei 68k–70k+ angesteuert werden. Juli zeigte in der Vergangenheit häufig grüne Tendenzen, nachdem in einigen Zyklen die vorherigen Monate schwach waren.
✅Mein Fazit –
Der Markt befindet sich weiterhin im Modus „Beweise es“. Meine Gesamtansicht: weiter bärischer Druck, mit einem Liquidity-Sweep nach oben, bevor die nächste Abwärtswelle startet – das ist ein klassisches Bear-Trap-/Distribution-Setup und passt zur gesamten Phase der Korrektur nach dem ATH.
74
·
--
#BITCOIN $BTC #INDIEN
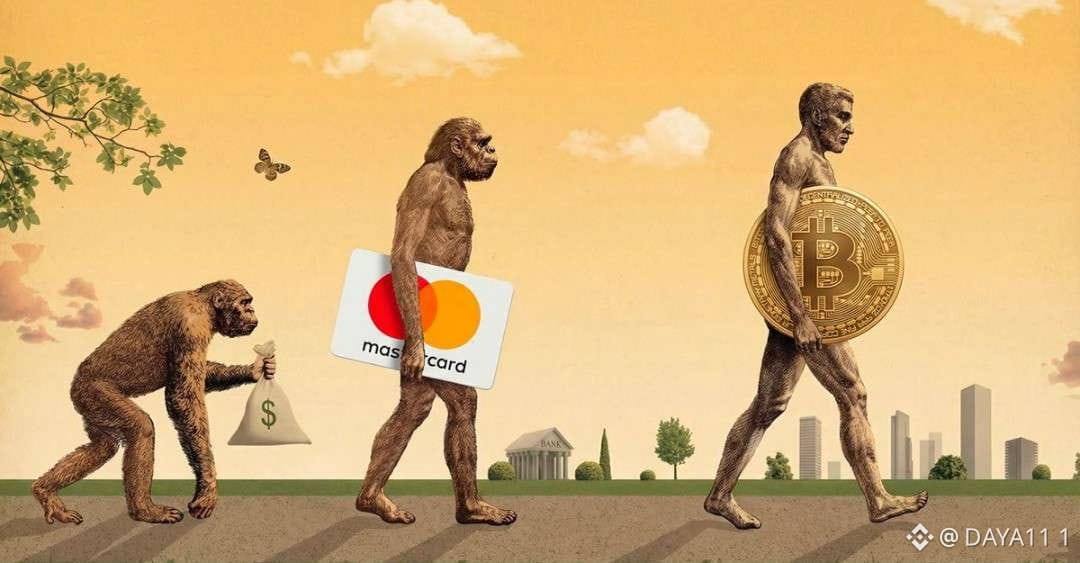
Kürzlich kursiert ein Bericht über ein #Krypto-Verbot (?) in Indien. Aber ich habe schon vorher gesagt: „Krypto ist in Indien derzeit weder vollständig reguliert noch verboten.“
👉Es wird besteuert und unterliegt einigen AML-Regeln. ) Keine Sorge: Wir hatten 2017 bereits eine Erfahrung. Damals wurde die RBI von Krypto ausgeschlossen. In dieser Zeit hat #Wazirx P2P gestartet – und es läuft immer noch.
😡Ich bin gegen das Wort „BAN“, das viele Influencer sagen. Das erzeugt unnötige FUD, wenn es heute kein solches Gesetz gibt. Gleichzeitig ist der Einfluss der RBI real, der parlamentarische Ausschuss ist aktiv, und die politische Richtung könnte sich in Zukunft verschärfen (insbesondere in Bezug auf Bankzugang und Stablecoins).
„Während die RBI Krypto konsequent abgelehnt hat und zuletzt erneut betonte, dass sie es lieber außerhalb des formellen Finanzsystems halten möchte, wurde kein Verbot von der Regierung oder dem Parlament erlassen.“ Wir haben keine offiziellen & authentischen Quellen wie die indische Regierung oder die RBI usw. und auch kein Gesetz, das im Parlament verabschiedet wurde.
Das indische Parlament hat einen Ausschuss eingesetzt – und die Arbeit läuft. Das ist alles. Die RBI lehnt Krypto immer ab – niemals niemals positiv.
✅Dies ist die Empfehlung/Eingabe der RBI an die Regierung bzw. den parlamentarischen Ausschuss, nicht eine Regierungsentscheidung oder ein erlassenes Gesetz.
✅Indien besteuert Krypto-Gewinne weiterhin mit 30 % + 1 % TDS und hat VASPs seit 2023 unter die PMLA (AML-Regeln) gebracht.
✅Also ist das alles ein Graubereich – besteuert und teilweise überwacht, aber nicht vollständig reguliert oder verboten.
✅Es wurde keine neue Gesetzgebung verabschiedet. Frühere Entwürfe für Verbotsgesetze (2019/2021) wurden nie eingebracht oder verabschiedet.
#BITCOIN $BTC #INDIEN
Kürzlich kursiert ein Bericht über ein #Krypto-Verbot (?) in Indien. Aber ich habe schon vorher gesagt: „Krypto ist in Indien derzeit weder vollständig reguliert noch verboten.“
👉Es wird besteuert und unterliegt einigen AML-Regeln. ) Keine Sorge: Wir hatten 2017 bereits eine Erfahrung. Damals wurde die RBI von Krypto ausgeschlossen. In dieser Zeit hat #Wazirx P2P gestartet – und es läuft immer noch.
😡Ich bin gegen das Wort „BAN“, das viele Influencer sagen. Das erzeugt unnötige FUD, wenn es heute kein solches Gesetz gibt. Gleichzeitig ist der Einfluss der RBI real, der parlamentarische Ausschuss ist aktiv, und die politische Richtung könnte sich in Zukunft verschärfen (insbesondere in Bezug auf Bankzugang und Stablecoins).
„Während die RBI Krypto konsequent abgelehnt hat und zuletzt erneut betonte, dass sie es lieber außerhalb des formellen Finanzsystems halten möchte, wurde kein Verbot von der Regierung oder dem Parlament erlassen.“ Wir haben keine offiziellen & authentischen Quellen wie die indische Regierung oder die RBI usw. und auch kein Gesetz, das im Parlament verabschiedet wurde.
Das indische Parlament hat einen Ausschuss eingesetzt – und die Arbeit läuft. Das ist alles. Die RBI lehnt Krypto immer ab – niemals niemals positiv.
✅Dies ist die Empfehlung/Eingabe der RBI an die Regierung bzw. den parlamentarischen Ausschuss, nicht eine Regierungsentscheidung oder ein erlassenes Gesetz.
✅Indien besteuert Krypto-Gewinne weiterhin mit 30 % + 1 % TDS und hat VASPs seit 2023 unter die PMLA (AML-Regeln) gebracht.
✅Also ist das alles ein Graubereich – besteuert und teilweise überwacht, aber nicht vollständig reguliert oder verboten.
✅Es wurde keine neue Gesetzgebung verabschiedet. Frühere Entwürfe für Verbotsgesetze (2019/2021) wurden nie eingebracht oder verabschiedet.
Kürzlich kursiert ein Bericht über ein #Krypto-Verbot (?) in Indien. Aber ich habe schon vorher gesagt: „Krypto ist in Indien derzeit weder vollständig reguliert noch verboten.“
👉Es wird besteuert und unterliegt einigen AML-Regeln. ) Keine Sorge: Wir hatten 2017 bereits eine Erfahrung. Damals wurde die RBI von Krypto ausgeschlossen. In dieser Zeit hat #Wazirx P2P gestartet – und es läuft immer noch.
😡Ich bin gegen das Wort „BAN“, das viele Influencer sagen. Das erzeugt unnötige FUD, wenn es heute kein solches Gesetz gibt. Gleichzeitig ist der Einfluss der RBI real, der parlamentarische Ausschuss ist aktiv, und die politische Richtung könnte sich in Zukunft verschärfen (insbesondere in Bezug auf Bankzugang und Stablecoins).
„Während die RBI Krypto konsequent abgelehnt hat und zuletzt erneut betonte, dass sie es lieber außerhalb des formellen Finanzsystems halten möchte, wurde kein Verbot von der Regierung oder dem Parlament erlassen.“ Wir haben keine offiziellen & authentischen Quellen wie die indische Regierung oder die RBI usw. und auch kein Gesetz, das im Parlament verabschiedet wurde.
Das indische Parlament hat einen Ausschuss eingesetzt – und die Arbeit läuft. Das ist alles. Die RBI lehnt Krypto immer ab – niemals niemals positiv.
✅Dies ist die Empfehlung/Eingabe der RBI an die Regierung bzw. den parlamentarischen Ausschuss, nicht eine Regierungsentscheidung oder ein erlassenes Gesetz.
✅Indien besteuert Krypto-Gewinne weiterhin mit 30 % + 1 % TDS und hat VASPs seit 2023 unter die PMLA (AML-Regeln) gebracht.
✅Also ist das alles ein Graubereich – besteuert und teilweise überwacht, aber nicht vollständig reguliert oder verboten.
✅Es wurde keine neue Gesetzgebung verabschiedet. Frühere Entwürfe für Verbotsgesetze (2019/2021) wurden nie eingebracht oder verabschiedet.
85
·
--
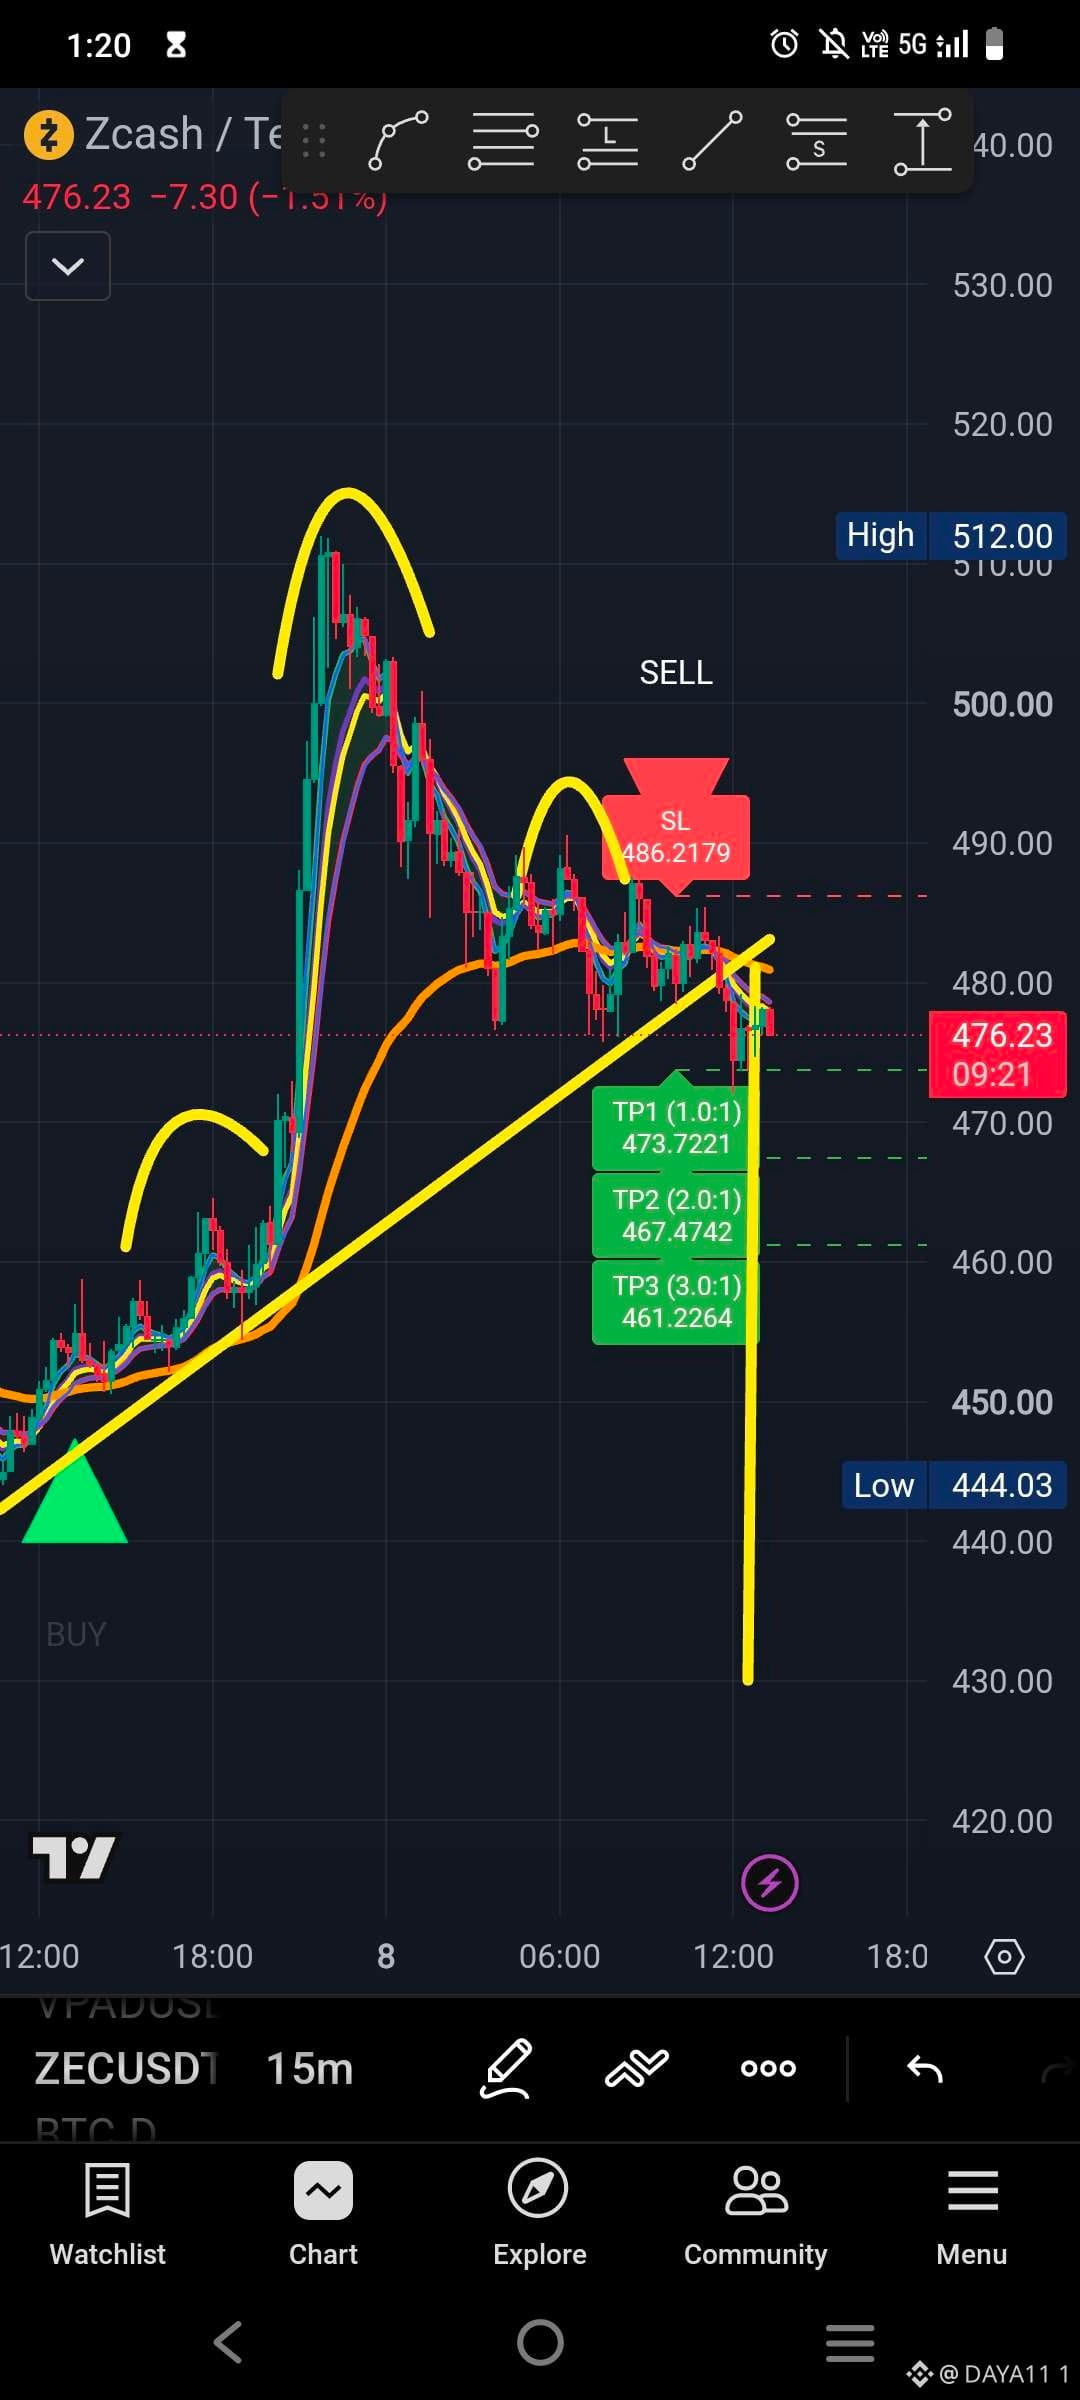
Kurze Zusammenfassung für den Trade-Setup
Kopf & Schultern — Das Muster sieht nach dem Move auf 512 Höhe gültig aus, mit Neckline-Bruch. ✅
Aufwärtstrend ausgebrochen (abwärts) — Der Preis durchbricht die wichtige, steigende gelbe Trendlinie aus der unteren linken Ecke. Klarer bärischer Strukturbruch. ✅
Indikator verkauft-Signal — Ergänzt starkes Konfluenzbild mit deinem benutzerdefinierten Setup. ✅
( Folge mir auf X für den Indikator – @DayaAkanurkar11)
Das Short-Setup ist mit dieser Klarstellung sogar noch sauberer. Die Kombination aus H&S + Bruch der steigenden Trendlinie + Indikator ist solide für einen bärischen Trade auf 15m.
Kurze Zusammenfassung für den Trade-Setup
Kopf & Schultern — Das Muster sieht nach dem Move auf 512 Höhe gültig aus, mit Neckline-Bruch. ✅
Aufwärtstrend ausgebrochen (abwärts) — Der Preis durchbricht die wichtige, steigende gelbe Trendlinie aus der unteren linken Ecke. Klarer bärischer Strukturbruch. ✅
Indikator verkauft-Signal — Ergänzt starkes Konfluenzbild mit deinem benutzerdefinierten Setup. ✅
( Folge mir auf X für den Indikator – @DayaAkanurkar11)
Das Short-Setup ist mit dieser Klarstellung sogar noch sauberer. Die Kombination aus H&S + Bruch der steigenden Trendlinie + Indikator ist solide für einen bärischen Trade auf 15m.
Kopf & Schultern — Das Muster sieht nach dem Move auf 512 Höhe gültig aus, mit Neckline-Bruch. ✅
Aufwärtstrend ausgebrochen (abwärts) — Der Preis durchbricht die wichtige, steigende gelbe Trendlinie aus der unteren linken Ecke. Klarer bärischer Strukturbruch. ✅
Indikator verkauft-Signal — Ergänzt starkes Konfluenzbild mit deinem benutzerdefinierten Setup. ✅
( Folge mir auf X für den Indikator – @DayaAkanurkar11)
Das Short-Setup ist mit dieser Klarstellung sogar noch sauberer. Die Kombination aus H&S + Bruch der steigenden Trendlinie + Indikator ist solide für einen bärischen Trade auf 15m.
·
--
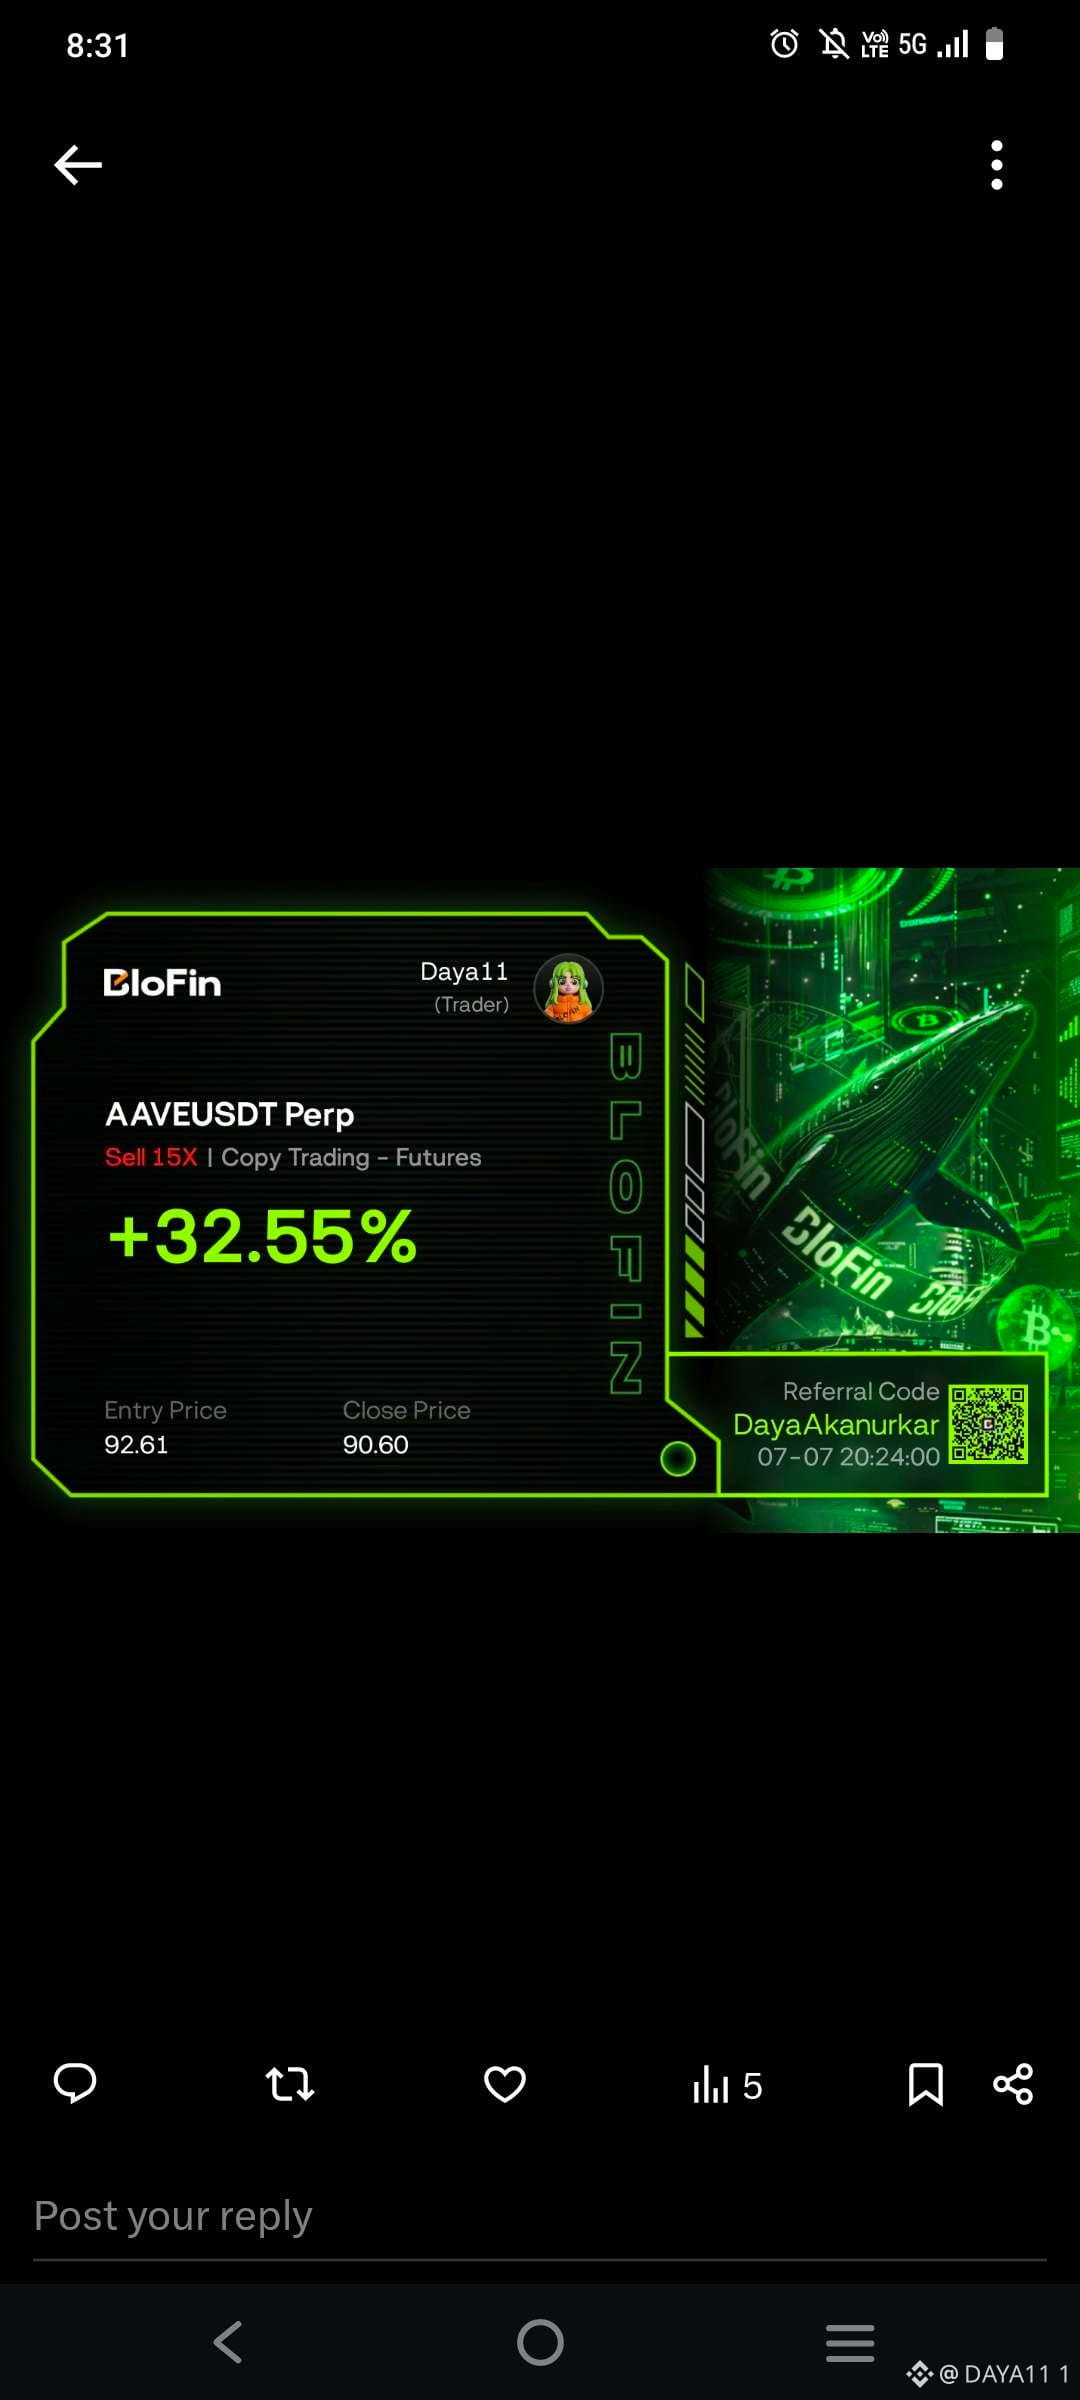
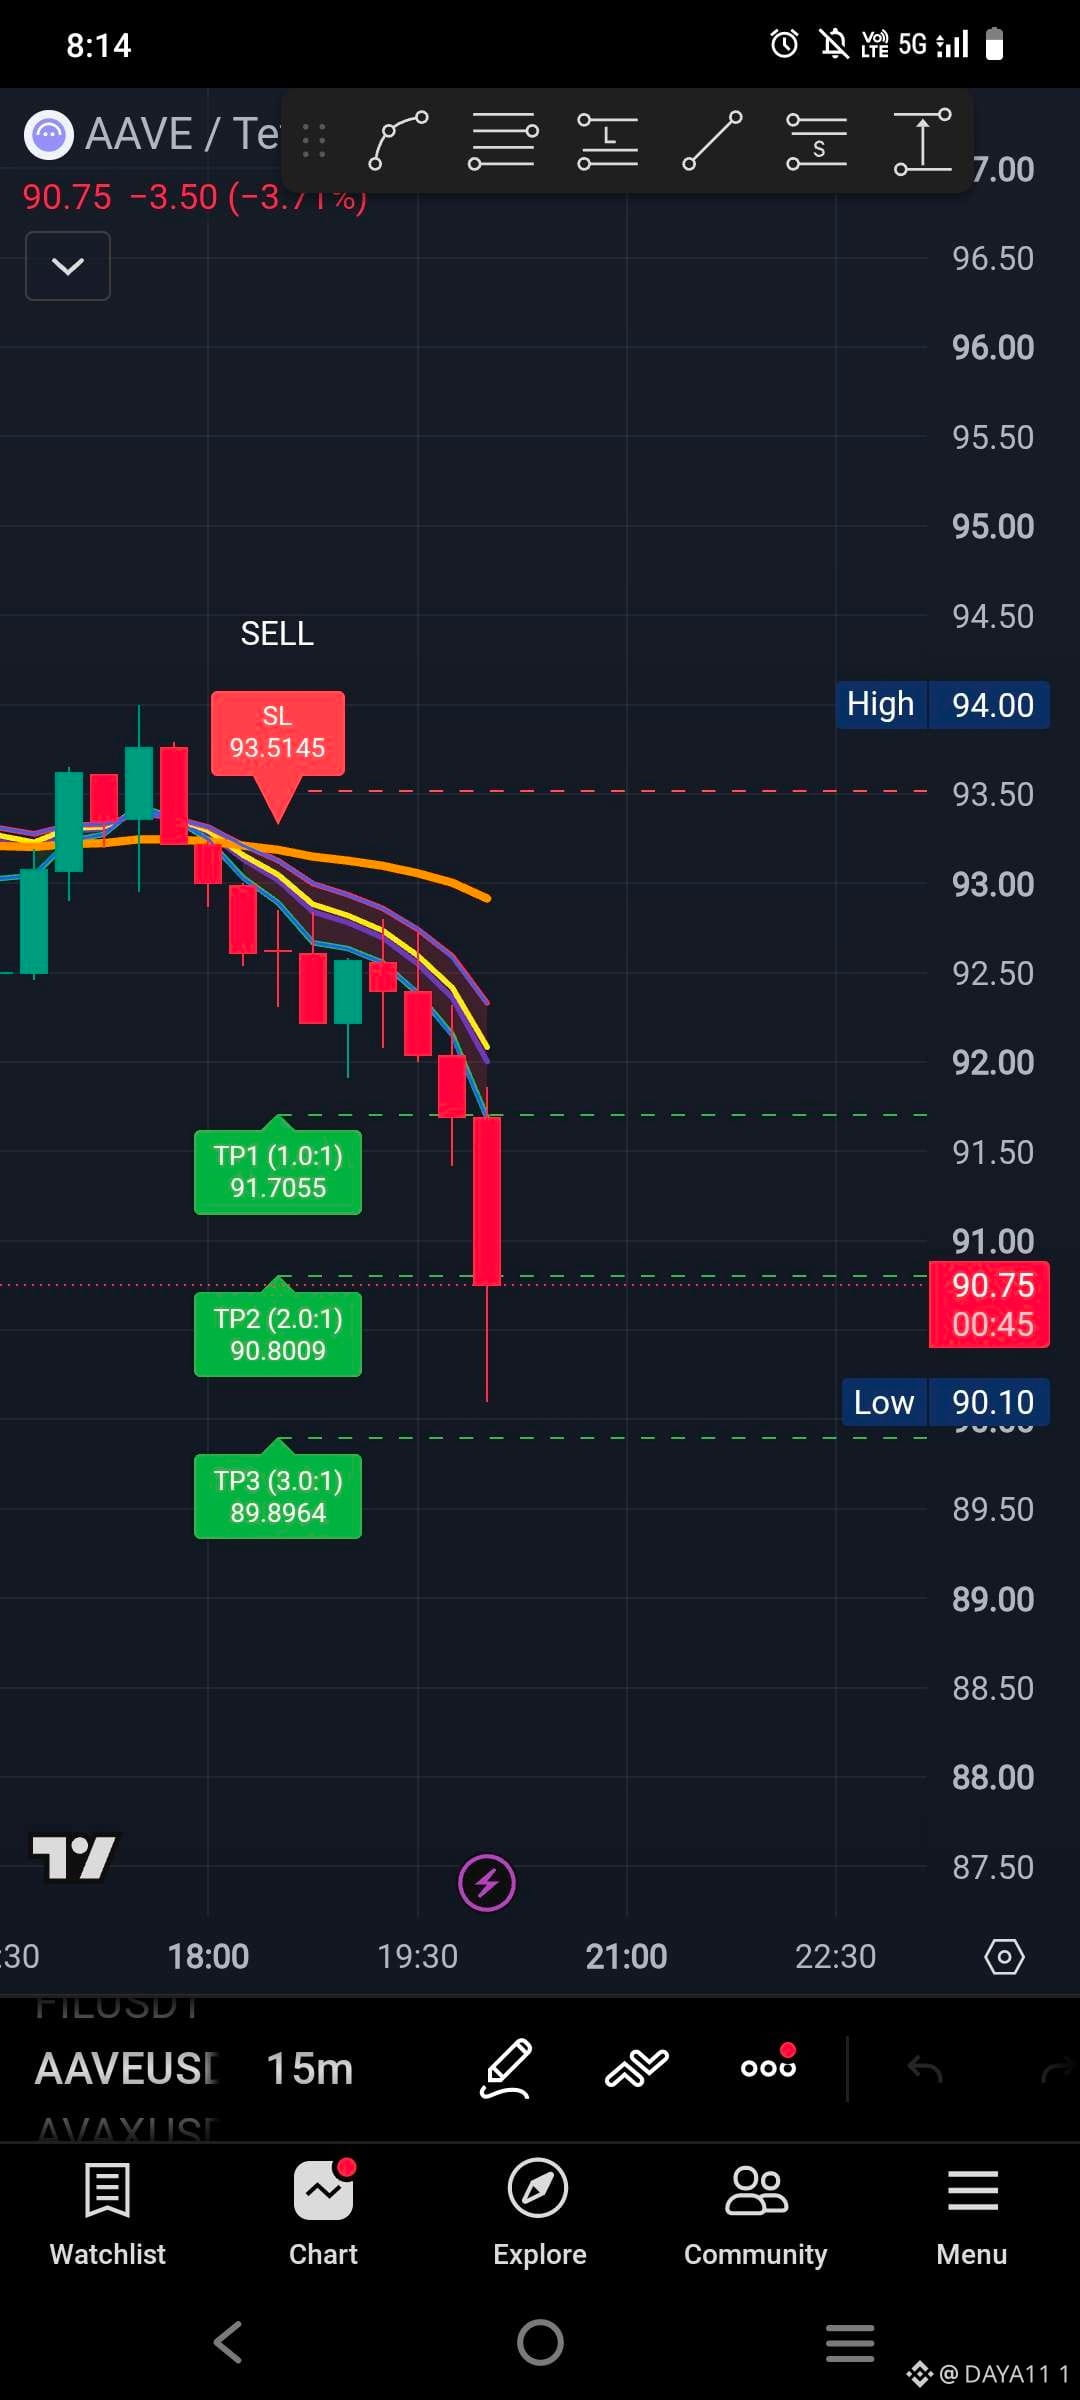
$AAVE Signal-Update
TP1 ✅
TP2 ✅
Beide Ziele wurden erfolgreich erreicht. Wir haben mit dieser Bewegung gute Gewinne eingefahren 🤑
Wichtige Lektion: Bewege deine TPs oder nimm Teilgewinne, sobald der Preis anfängt, sich zu drehen.
Glückwunsch an alle, die dem Signal gefolgt sind und Gewinne gemacht haben 🎉
Möchtest du saubere Signale mit richtigem SL & mehreren TPs in deinen Charts?
Kommentiere INDICATOR
#CryptoSignals #Bitcoin #$Aave #Trading #Altcoins
Keine finanzielle Beratung. Handel verantwortungsvoll.
$AAVE Signal-Update
TP1 ✅
TP2 ✅
Beide Ziele wurden erfolgreich erreicht. Wir haben mit dieser Bewegung gute Gewinne eingefahren 🤑
Wichtige Lektion: Bewege deine TPs oder nimm Teilgewinne, sobald der Preis anfängt, sich zu drehen.
Glückwunsch an alle, die dem Signal gefolgt sind und Gewinne gemacht haben 🎉
Möchtest du saubere Signale mit richtigem SL & mehreren TPs in deinen Charts?
Kommentiere INDICATOR
#CryptoSignals #Bitcoin #$Aave #Trading #Altcoins
Keine finanzielle Beratung. Handel verantwortungsvoll.
TP1 ✅
TP2 ✅
Beide Ziele wurden erfolgreich erreicht. Wir haben mit dieser Bewegung gute Gewinne eingefahren 🤑
Wichtige Lektion: Bewege deine TPs oder nimm Teilgewinne, sobald der Preis anfängt, sich zu drehen.
Glückwunsch an alle, die dem Signal gefolgt sind und Gewinne gemacht haben 🎉
Möchtest du saubere Signale mit richtigem SL & mehreren TPs in deinen Charts?
Kommentiere INDICATOR
#CryptoSignals #Bitcoin #$Aave #Trading #Altcoins
Keine finanzielle Beratung. Handel verantwortungsvoll.
61
·
--
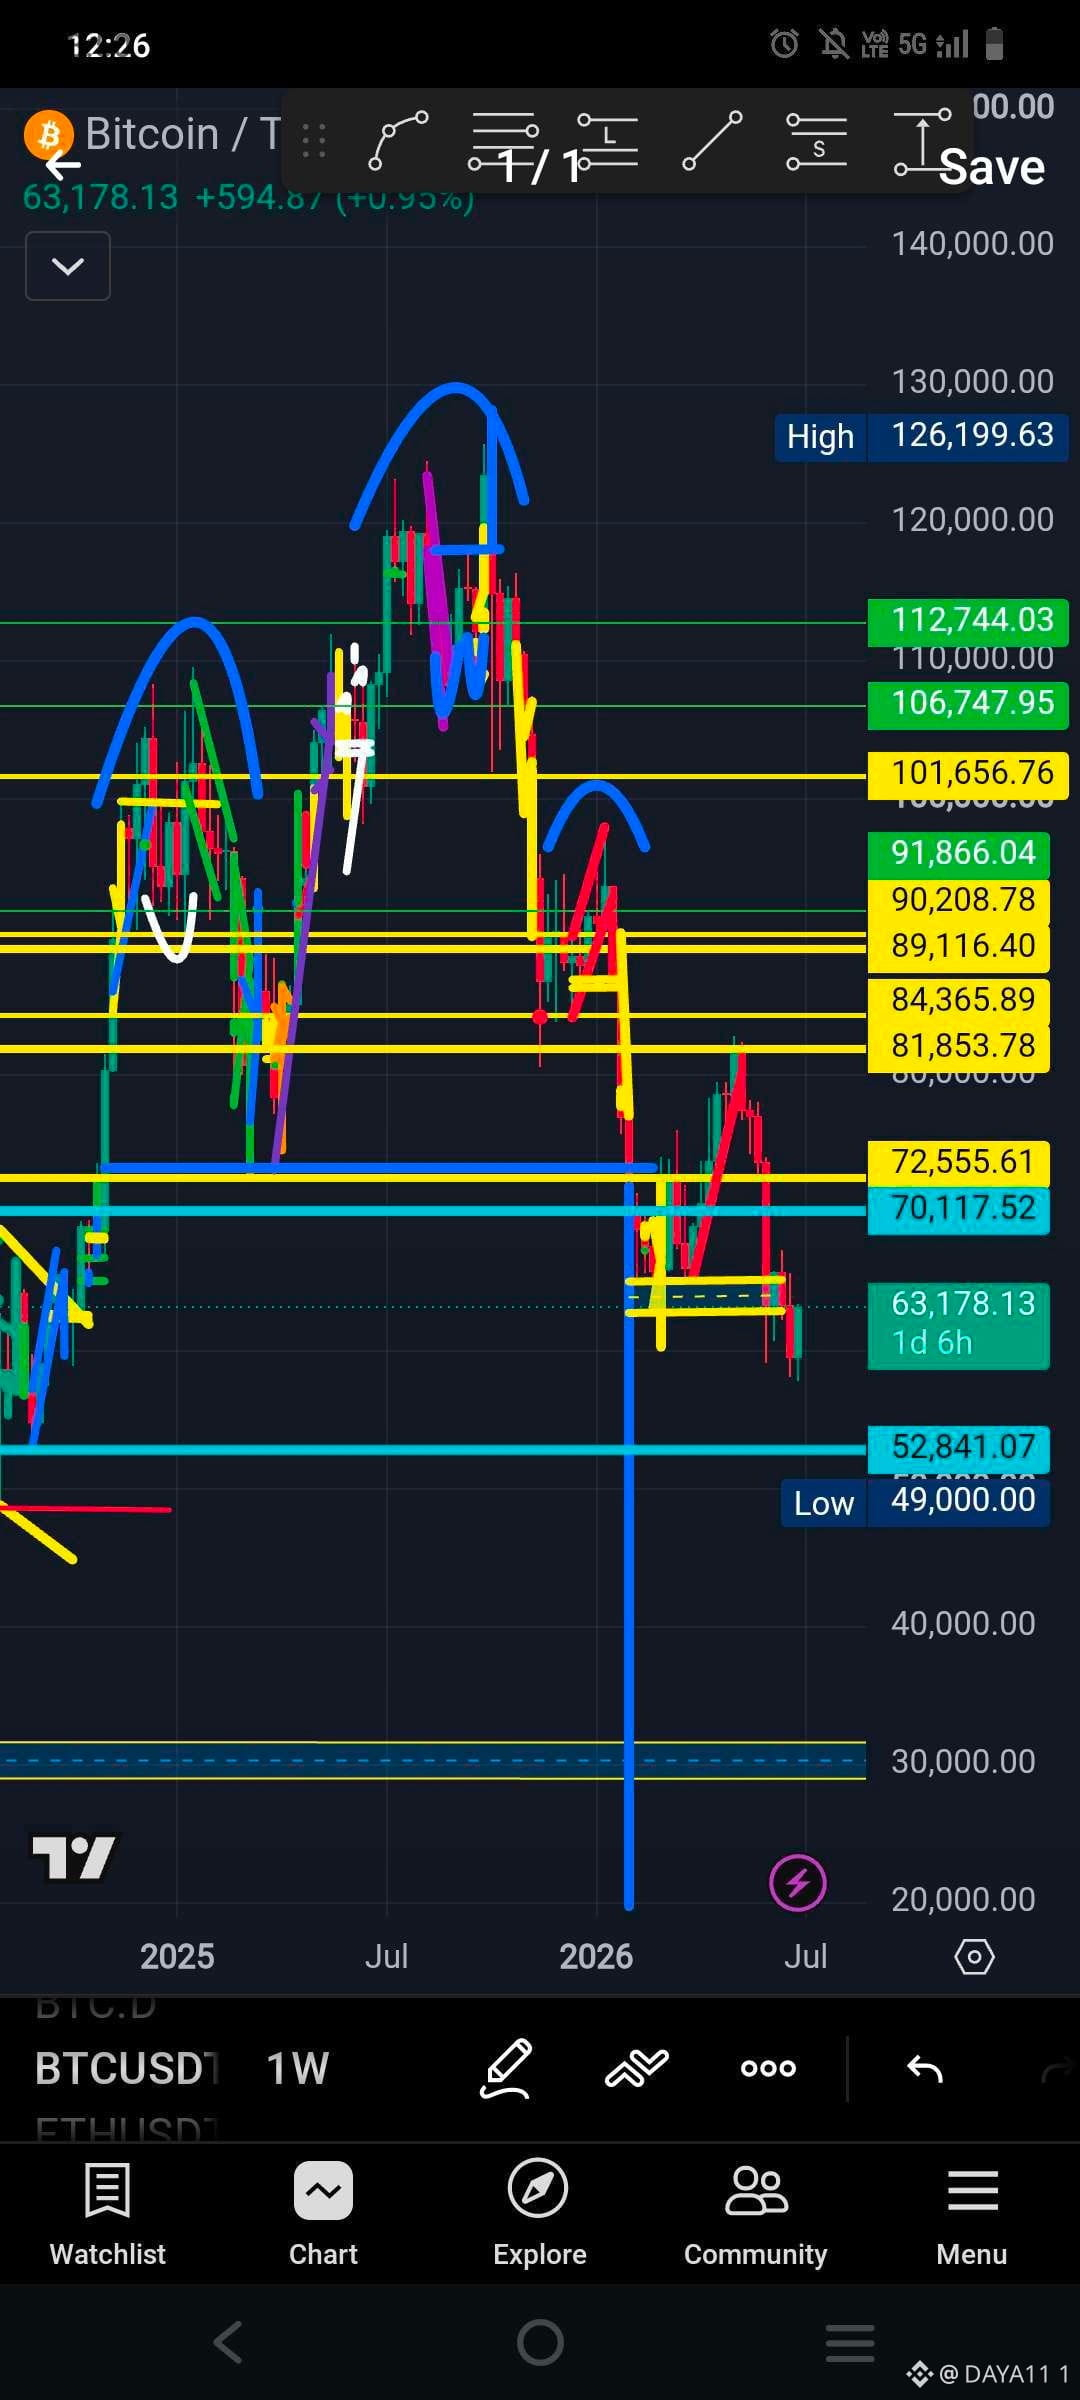
👉DERZEITIGE SITUATION – $BTC handelt derzeit rund um $62.000–$63.000, nachdem es von den jüngsten $59k-Tiefs eine ordentliche Erholungsbewegung gegeben hat. Es konsolidiert in einer volatilen, zähen Spanne und ist bisher nicht überzeugend ausgebrochen.
👉65k ALS LOKALER WIDERSTAND – ja, das ist derzeit ein entscheidendes Niveau. Es liegt nahe an kurzfristigen gleitenden Durchschnitten, früheren Swing-Highs und in einer Zone, die Verkäufer in den letzten Tagen mehrfach erfolgreich verteidigt haben. Ein sauberer Tages-/Wochenabschluss darüber würde den Weg öffnen zu den von mir genannten Zielen im Bereich 70k–81k (und könnte potenziell einen Teil der kurzfristigen bärischen Struktur entkräften).
👉MEIN SZENARIO VS. WAS PASSIEREN KÖNNTE – Meine Einschätzung macht taktisch in einem bärischen Kontext Sinn: Liquiditäts-„Grab“ bei 65k–66k → typisch in Seitwärtsmärkten. Der Kurs wischt oft die Hochs ab, um Stops/Liquidität mitzunehmen, bevor er sich umkehrt.
Abweisung und Abverkauf Richtung 52k (diesen Monat), dann 45k–40k im nächsten Monat → Das würde das H&S-Downside fortsetzen, das wir zuvor besprochen haben ( Siehe meinen vorherigen Post $BTC Kopf & Schulter-Muster) und zu meiner größeren Bottom-These für den Zyklus passen.
✅KURZFRISTIGE MÖGLICHKEITEN – (die nächsten Tage/diesen Monat):
🔴MEIN BÄR-SZENARIO (Abweisung bei 65k–66k): Sehr wahrscheinlich, wenn das Volumen bei Kursanstiegen schwach bleibt und in der Nähe dieses Widerstands Verkaufsdruck zu sehen ist. Ein Scheitern dort könnte tatsächlich dazu führen, dass es wieder schnell Richtung $58k–$55k geht – zunächst. 52k wäre dann ein messbares Ziel, falls sich der Abwärtsimpuls aufbaut.
🟢 BULLISCHES SZENARIO: Starke ETF-Zuflüsse, positive Makro-News oder Short-Covering könnten dazu führen, dass 65k durchbrochen wird und dann Ziele bei 68k–70k+ anvisiert werden. Der Juli zeigte historisch oft grüne Tendenzen, nachdem es in manchen Zyklen in den Vormonaten schwach war.
✅Mein Fazit –
Der Markt ist weiterhin im „erst beweisen“-Modus unter 65k. Meine Gesamtansicht: weiter bärischer Druck, mit einem Liquiditätswipe nach oben, bevor der nächste Abwärts-Impuls kommt – das ist ein klassisches Bear-Trap-/Distribution-Setup, das zur gesamten Post-ATH-Korrekturphase passt.
👉DERZEITIGE SITUATION – $BTC handelt derzeit rund um $62.000–$63.000, nachdem es von den jüngsten $59k-Tiefs eine ordentliche Erholungsbewegung gegeben hat. Es konsolidiert in einer volatilen, zähen Spanne und ist bisher nicht überzeugend ausgebrochen.
👉65k ALS LOKALER WIDERSTAND – ja, das ist derzeit ein entscheidendes Niveau. Es liegt nahe an kurzfristigen gleitenden Durchschnitten, früheren Swing-Highs und in einer Zone, die Verkäufer in den letzten Tagen mehrfach erfolgreich verteidigt haben. Ein sauberer Tages-/Wochenabschluss darüber würde den Weg öffnen zu den von mir genannten Zielen im Bereich 70k–81k (und könnte potenziell einen Teil der kurzfristigen bärischen Struktur entkräften).
👉MEIN SZENARIO VS. WAS PASSIEREN KÖNNTE – Meine Einschätzung macht taktisch in einem bärischen Kontext Sinn: Liquiditäts-„Grab“ bei 65k–66k → typisch in Seitwärtsmärkten. Der Kurs wischt oft die Hochs ab, um Stops/Liquidität mitzunehmen, bevor er sich umkehrt.
Abweisung und Abverkauf Richtung 52k (diesen Monat), dann 45k–40k im nächsten Monat → Das würde das H&S-Downside fortsetzen, das wir zuvor besprochen haben ( Siehe meinen vorherigen Post $BTC Kopf & Schulter-Muster) und zu meiner größeren Bottom-These für den Zyklus passen.
✅KURZFRISTIGE MÖGLICHKEITEN – (die nächsten Tage/diesen Monat):
🔴MEIN BÄR-SZENARIO (Abweisung bei 65k–66k): Sehr wahrscheinlich, wenn das Volumen bei Kursanstiegen schwach bleibt und in der Nähe dieses Widerstands Verkaufsdruck zu sehen ist. Ein Scheitern dort könnte tatsächlich dazu führen, dass es wieder schnell Richtung $58k–$55k geht – zunächst. 52k wäre dann ein messbares Ziel, falls sich der Abwärtsimpuls aufbaut.
🟢 BULLISCHES SZENARIO: Starke ETF-Zuflüsse, positive Makro-News oder Short-Covering könnten dazu führen, dass 65k durchbrochen wird und dann Ziele bei 68k–70k+ anvisiert werden. Der Juli zeigte historisch oft grüne Tendenzen, nachdem es in manchen Zyklen in den Vormonaten schwach war.
✅Mein Fazit –
Der Markt ist weiterhin im „erst beweisen“-Modus unter 65k. Meine Gesamtansicht: weiter bärischer Druck, mit einem Liquiditätswipe nach oben, bevor der nächste Abwärts-Impuls kommt – das ist ein klassisches Bear-Trap-/Distribution-Setup, das zur gesamten Post-ATH-Korrekturphase passt.
👉65k ALS LOKALER WIDERSTAND – ja, das ist derzeit ein entscheidendes Niveau. Es liegt nahe an kurzfristigen gleitenden Durchschnitten, früheren Swing-Highs und in einer Zone, die Verkäufer in den letzten Tagen mehrfach erfolgreich verteidigt haben. Ein sauberer Tages-/Wochenabschluss darüber würde den Weg öffnen zu den von mir genannten Zielen im Bereich 70k–81k (und könnte potenziell einen Teil der kurzfristigen bärischen Struktur entkräften).
👉MEIN SZENARIO VS. WAS PASSIEREN KÖNNTE – Meine Einschätzung macht taktisch in einem bärischen Kontext Sinn: Liquiditäts-„Grab“ bei 65k–66k → typisch in Seitwärtsmärkten. Der Kurs wischt oft die Hochs ab, um Stops/Liquidität mitzunehmen, bevor er sich umkehrt.
Abweisung und Abverkauf Richtung 52k (diesen Monat), dann 45k–40k im nächsten Monat → Das würde das H&S-Downside fortsetzen, das wir zuvor besprochen haben ( Siehe meinen vorherigen Post $BTC Kopf & Schulter-Muster) und zu meiner größeren Bottom-These für den Zyklus passen.
✅KURZFRISTIGE MÖGLICHKEITEN – (die nächsten Tage/diesen Monat):
🔴MEIN BÄR-SZENARIO (Abweisung bei 65k–66k): Sehr wahrscheinlich, wenn das Volumen bei Kursanstiegen schwach bleibt und in der Nähe dieses Widerstands Verkaufsdruck zu sehen ist. Ein Scheitern dort könnte tatsächlich dazu führen, dass es wieder schnell Richtung $58k–$55k geht – zunächst. 52k wäre dann ein messbares Ziel, falls sich der Abwärtsimpuls aufbaut.
🟢 BULLISCHES SZENARIO: Starke ETF-Zuflüsse, positive Makro-News oder Short-Covering könnten dazu führen, dass 65k durchbrochen wird und dann Ziele bei 68k–70k+ anvisiert werden. Der Juli zeigte historisch oft grüne Tendenzen, nachdem es in manchen Zyklen in den Vormonaten schwach war.
✅Mein Fazit –
Der Markt ist weiterhin im „erst beweisen“-Modus unter 65k. Meine Gesamtansicht: weiter bärischer Druck, mit einem Liquiditätswipe nach oben, bevor der nächste Abwärts-Impuls kommt – das ist ein klassisches Bear-Trap-/Distribution-Setup, das zur gesamten Post-ATH-Korrekturphase passt.
83
·
--
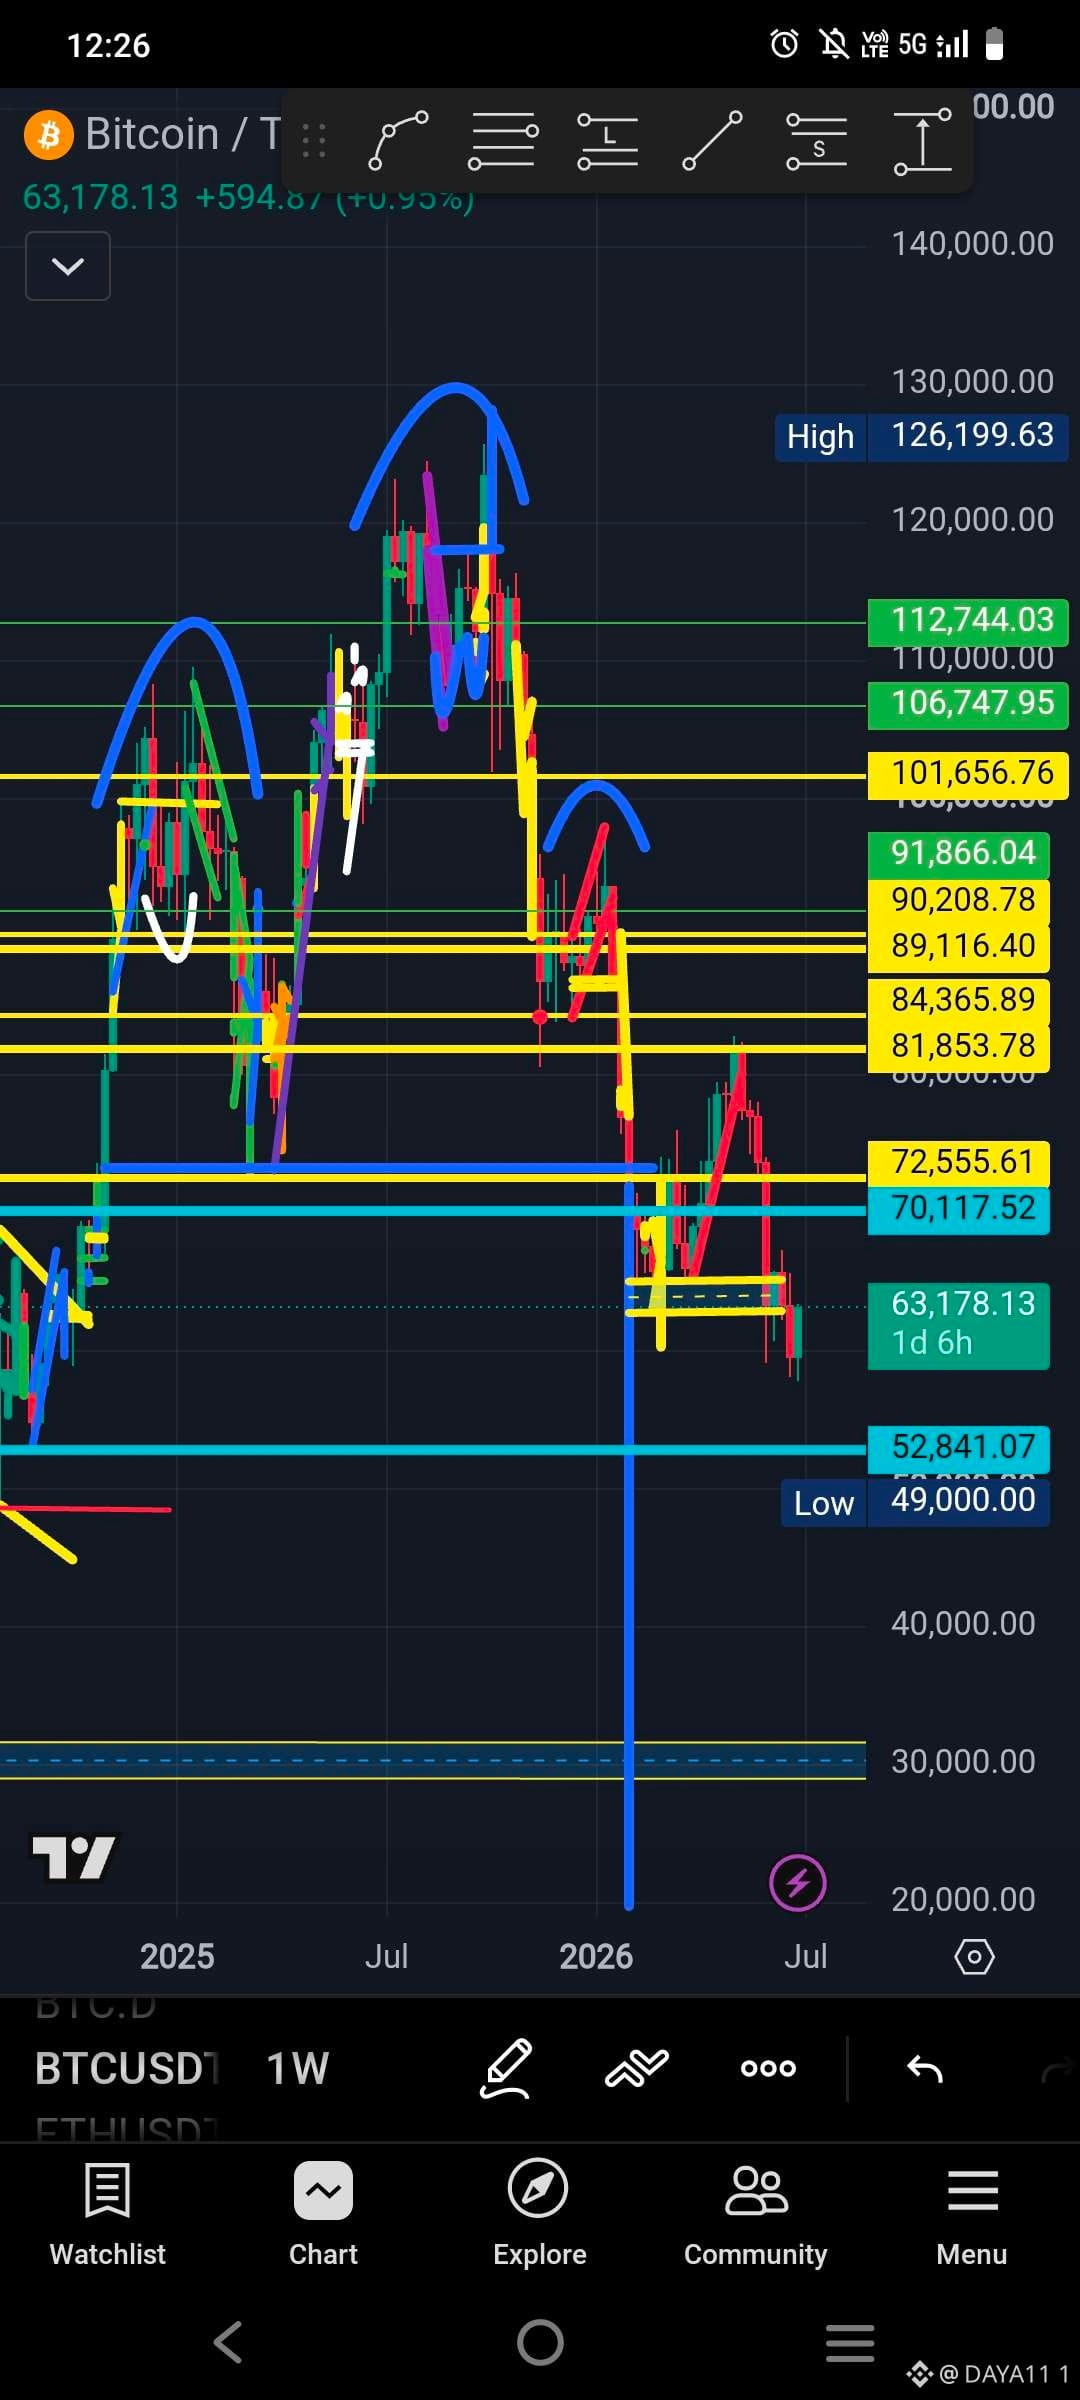
👉AKTUELLER STATUS – $BTC handelt derzeit rund um $62.000–$63.000 nach einer ordentlichen Erholung von den jüngsten $59k-Tiefs. Es konsolidiert in einer unruhigen Spanne und ist bisher nicht überzeugend ausgebrochen.
👉65K ALS LOKALER WIDERSTAND – ja, das ist aktuell eine entscheidende Zone. Dort liegt es nahe kurzfristigen gleitenden Durchschnitten, früheren Swing-Highs und in einem Bereich, den Verkäufer in den letzten Wochen mehrfach verteidigt haben. Ein sauberer Tages-/Wochenabschluss darüber würde die Tür öffnen zu den von mir erwähnten Zielen im Bereich 70k–81k (und könnte möglicherweise einen Teil der kurzfristigen bärischen Struktur entkräften).
👉MEIN SZENARIO V/S WAS PASSIEREN KÖNNTE – Meine Einschätzung ergibt taktisch in einem bärischen Kontext Sinn: Liquidity-Grab bei 65k–66k → Häufig in Seitwärtsmärkten. Der Kurs sweep’t oft die Hochs, um Stopps/Liquidität mitzunehmen, bevor er wieder dreht.
Ablehnung und Abverkauf Richtung 52k (diesen Monat), dann 45k–40k im nächsten Monat → Das würde das H&S-Downside-Szenario erweitern, das wir zuvor besprochen haben ( Siehe meinen vorherigen Post $BTC Kopf & Schulter-Pattern) und zu meiner größeren These für den Cycle-Boden passen.
✅KURZFRISTIGE MÖGLICHKEITEN – (die nächsten Tage/diesen Monat):
🔴MEIN BÄR-FALL (Ablehnung bei 65k–66k): Sehr wahrscheinlich, wenn das Volumen auf der Oberseite schwach bleibt und wir Verkaufsdruck nahe diesem Widerstand sehen. Ein Scheitern dort könnte den Kurs tatsächlich schnell zurück Richtung $58k–$55k treiben; 52k wäre dann ein gemessenes Ziel, falls sich der Abwärtsimpuls verstärkt.
🟢 BULLISCHER FALL: Starke ETF-Zuflüsse, positive Makro-Nachrichten oder Short-Covering könnten den Kurs über 65k drücken und auf 68k–70k+ zielen. Der Juli zeigte historisch in manchen Zyklen grüne Tendenzen, nachdem die vorherigen Monate schwach waren.
✅Mein Fazit –
Der Markt ist weiterhin im Modus „erst beweisen“. Meine Gesamtansicht: anhaltender bärischer Druck – mit einem Liquidity-Sweep nach oben, bevor es zur nächsten Abwärtsbewegung kommt, ist ein klassisches Bärentrap-/Distribution-Setup und passt zur gesamten Phase der Korrektur nach dem ATH.
👉AKTUELLER STATUS – $BTC handelt derzeit rund um $62.000–$63.000 nach einer ordentlichen Erholung von den jüngsten $59k-Tiefs. Es konsolidiert in einer unruhigen Spanne und ist bisher nicht überzeugend ausgebrochen.
👉65K ALS LOKALER WIDERSTAND – ja, das ist aktuell eine entscheidende Zone. Dort liegt es nahe kurzfristigen gleitenden Durchschnitten, früheren Swing-Highs und in einem Bereich, den Verkäufer in den letzten Wochen mehrfach verteidigt haben. Ein sauberer Tages-/Wochenabschluss darüber würde die Tür öffnen zu den von mir erwähnten Zielen im Bereich 70k–81k (und könnte möglicherweise einen Teil der kurzfristigen bärischen Struktur entkräften).
👉MEIN SZENARIO V/S WAS PASSIEREN KÖNNTE – Meine Einschätzung ergibt taktisch in einem bärischen Kontext Sinn: Liquidity-Grab bei 65k–66k → Häufig in Seitwärtsmärkten. Der Kurs sweep’t oft die Hochs, um Stopps/Liquidität mitzunehmen, bevor er wieder dreht.
Ablehnung und Abverkauf Richtung 52k (diesen Monat), dann 45k–40k im nächsten Monat → Das würde das H&S-Downside-Szenario erweitern, das wir zuvor besprochen haben ( Siehe meinen vorherigen Post $BTC Kopf & Schulter-Pattern) und zu meiner größeren These für den Cycle-Boden passen.
✅KURZFRISTIGE MÖGLICHKEITEN – (die nächsten Tage/diesen Monat):
🔴MEIN BÄR-FALL (Ablehnung bei 65k–66k): Sehr wahrscheinlich, wenn das Volumen auf der Oberseite schwach bleibt und wir Verkaufsdruck nahe diesem Widerstand sehen. Ein Scheitern dort könnte den Kurs tatsächlich schnell zurück Richtung $58k–$55k treiben; 52k wäre dann ein gemessenes Ziel, falls sich der Abwärtsimpuls verstärkt.
🟢 BULLISCHER FALL: Starke ETF-Zuflüsse, positive Makro-Nachrichten oder Short-Covering könnten den Kurs über 65k drücken und auf 68k–70k+ zielen. Der Juli zeigte historisch in manchen Zyklen grüne Tendenzen, nachdem die vorherigen Monate schwach waren.
✅Mein Fazit –
Der Markt ist weiterhin im Modus „erst beweisen“. Meine Gesamtansicht: anhaltender bärischer Druck – mit einem Liquidity-Sweep nach oben, bevor es zur nächsten Abwärtsbewegung kommt, ist ein klassisches Bärentrap-/Distribution-Setup und passt zur gesamten Phase der Korrektur nach dem ATH.
👉65K ALS LOKALER WIDERSTAND – ja, das ist aktuell eine entscheidende Zone. Dort liegt es nahe kurzfristigen gleitenden Durchschnitten, früheren Swing-Highs und in einem Bereich, den Verkäufer in den letzten Wochen mehrfach verteidigt haben. Ein sauberer Tages-/Wochenabschluss darüber würde die Tür öffnen zu den von mir erwähnten Zielen im Bereich 70k–81k (und könnte möglicherweise einen Teil der kurzfristigen bärischen Struktur entkräften).
👉MEIN SZENARIO V/S WAS PASSIEREN KÖNNTE – Meine Einschätzung ergibt taktisch in einem bärischen Kontext Sinn: Liquidity-Grab bei 65k–66k → Häufig in Seitwärtsmärkten. Der Kurs sweep’t oft die Hochs, um Stopps/Liquidität mitzunehmen, bevor er wieder dreht.
Ablehnung und Abverkauf Richtung 52k (diesen Monat), dann 45k–40k im nächsten Monat → Das würde das H&S-Downside-Szenario erweitern, das wir zuvor besprochen haben ( Siehe meinen vorherigen Post $BTC Kopf & Schulter-Pattern) und zu meiner größeren These für den Cycle-Boden passen.
✅KURZFRISTIGE MÖGLICHKEITEN – (die nächsten Tage/diesen Monat):
🔴MEIN BÄR-FALL (Ablehnung bei 65k–66k): Sehr wahrscheinlich, wenn das Volumen auf der Oberseite schwach bleibt und wir Verkaufsdruck nahe diesem Widerstand sehen. Ein Scheitern dort könnte den Kurs tatsächlich schnell zurück Richtung $58k–$55k treiben; 52k wäre dann ein gemessenes Ziel, falls sich der Abwärtsimpuls verstärkt.
🟢 BULLISCHER FALL: Starke ETF-Zuflüsse, positive Makro-Nachrichten oder Short-Covering könnten den Kurs über 65k drücken und auf 68k–70k+ zielen. Der Juli zeigte historisch in manchen Zyklen grüne Tendenzen, nachdem die vorherigen Monate schwach waren.
✅Mein Fazit –
Der Markt ist weiterhin im Modus „erst beweisen“. Meine Gesamtansicht: anhaltender bärischer Druck – mit einem Liquidity-Sweep nach oben, bevor es zur nächsten Abwärtsbewegung kommt, ist ein klassisches Bärentrap-/Distribution-Setup und passt zur gesamten Phase der Korrektur nach dem ATH.
65
·
--
👉DERZEITIGER STAND – $BTC handelt derzeit um $62.000–$63.000 herum, nachdem es von den jüngsten $59k-Tiefs einen anständigen Erholungsimpuls gab. Es konsolidiert in einer unruhigen Spanne und ist noch nicht überzeugend ausgebrochen.
👉65k ALS LOKALER WIDERSTAND – ja, das ist im Moment ein entscheidendes Niveau. Es liegt nahe an kurzfristigen gleitenden Durchschnitten, früheren Swing-Highs und in einer Zone, die Verkäufer zuletzt mehrfach verteidigt haben. Ein sauberer Tages-/Wochenschluss darüber würde den Weg für die von mir genannten Ziele bei 70k–81k öffnen (und potenziell einen Teil der kurzfristigen bärischen Struktur widerlegen).
👉MEIN SZENARIO VS. WAS PASSIEREN KÖNNTE – Mein Call ergibt taktisch Sinn in einem bärischen Kontext: Liquidity Grab bei 65k–66k → typisch in Seitwärtsmärkten. Der Kurs wischt oft die Hochs, um Stops/Liquidität mitzunehmen, bevor es wieder dreht.
Ablehnung und Abverkauf Richtung 52k (diesen Monat), dann 45k–40k im nächsten Monat → Das würde das H&S-Downside-Szenario, das wir zuvor besprochen haben, erweitern (siehe meinen vorherigen Post $BTC Head & Shoulder Pattern) und zu meiner größeren These zum Zyklus-Tief passen.
✅KURZFRISTIGE MÖGLICHKEITEN – (die nächsten Tage/diesen Monat):
🔴MEIN BÄR-FALL (Ablehnung bei 65k–66k): Sehr realistisch, wenn das Volumen im Aufwärtsbereich schwach bleibt und wir Verkaufsdruck nahe diesem Widerstand sehen. Ein Fehlschlag dort könnte tatsächlich dazu führen, dass es zuerst wieder Richtung $58k–$55k beschleunigt, wobei 52k das gemessene Ziel wäre, falls sich der Downside-Impuls aufbaut.
🟢 BULLISCHER FALL: Starke ETF-Zuflüsse, positive Makro-News oder Short-Covering könnten 65k durchbrechen und Kursziele bei 68k–70k+ ansteuern. Juli zeigt historisch in manchen Zyklen häufig grüne Tendenzen, nachdem vorherige Monate schwach waren.
✅Mein Fazit –
Der Markt ist weiterhin im Modus „erst beweisen“. Meine Gesamtansicht: Fortgesetzter bärischer Druck – mit einem Liquiditäts-„Sweep“ nach oben, bevor es zur nächsten Abwärtswelle kommt, ist ein klassisches Bear-Trap-/Distribution-Setup, das zur gesamten Post-ATH-Korrekturphase passt.
👉DERZEITIGER STAND – $BTC handelt derzeit um $62.000–$63.000 herum, nachdem es von den jüngsten $59k-Tiefs einen anständigen Erholungsimpuls gab. Es konsolidiert in einer unruhigen Spanne und ist noch nicht überzeugend ausgebrochen.
👉65k ALS LOKALER WIDERSTAND – ja, das ist im Moment ein entscheidendes Niveau. Es liegt nahe an kurzfristigen gleitenden Durchschnitten, früheren Swing-Highs und in einer Zone, die Verkäufer zuletzt mehrfach verteidigt haben. Ein sauberer Tages-/Wochenschluss darüber würde den Weg für die von mir genannten Ziele bei 70k–81k öffnen (und potenziell einen Teil der kurzfristigen bärischen Struktur widerlegen).
👉MEIN SZENARIO VS. WAS PASSIEREN KÖNNTE – Mein Call ergibt taktisch Sinn in einem bärischen Kontext: Liquidity Grab bei 65k–66k → typisch in Seitwärtsmärkten. Der Kurs wischt oft die Hochs, um Stops/Liquidität mitzunehmen, bevor es wieder dreht.
Ablehnung und Abverkauf Richtung 52k (diesen Monat), dann 45k–40k im nächsten Monat → Das würde das H&S-Downside-Szenario, das wir zuvor besprochen haben, erweitern (siehe meinen vorherigen Post $BTC Head & Shoulder Pattern) und zu meiner größeren These zum Zyklus-Tief passen.
✅KURZFRISTIGE MÖGLICHKEITEN – (die nächsten Tage/diesen Monat):
🔴MEIN BÄR-FALL (Ablehnung bei 65k–66k): Sehr realistisch, wenn das Volumen im Aufwärtsbereich schwach bleibt und wir Verkaufsdruck nahe diesem Widerstand sehen. Ein Fehlschlag dort könnte tatsächlich dazu führen, dass es zuerst wieder Richtung $58k–$55k beschleunigt, wobei 52k das gemessene Ziel wäre, falls sich der Downside-Impuls aufbaut.
🟢 BULLISCHER FALL: Starke ETF-Zuflüsse, positive Makro-News oder Short-Covering könnten 65k durchbrechen und Kursziele bei 68k–70k+ ansteuern. Juli zeigt historisch in manchen Zyklen häufig grüne Tendenzen, nachdem vorherige Monate schwach waren.
✅Mein Fazit –
Der Markt ist weiterhin im Modus „erst beweisen“. Meine Gesamtansicht: Fortgesetzter bärischer Druck – mit einem Liquiditäts-„Sweep“ nach oben, bevor es zur nächsten Abwärtswelle kommt, ist ein klassisches Bear-Trap-/Distribution-Setup, das zur gesamten Post-ATH-Korrekturphase passt.
👉65k ALS LOKALER WIDERSTAND – ja, das ist im Moment ein entscheidendes Niveau. Es liegt nahe an kurzfristigen gleitenden Durchschnitten, früheren Swing-Highs und in einer Zone, die Verkäufer zuletzt mehrfach verteidigt haben. Ein sauberer Tages-/Wochenschluss darüber würde den Weg für die von mir genannten Ziele bei 70k–81k öffnen (und potenziell einen Teil der kurzfristigen bärischen Struktur widerlegen).
👉MEIN SZENARIO VS. WAS PASSIEREN KÖNNTE – Mein Call ergibt taktisch Sinn in einem bärischen Kontext: Liquidity Grab bei 65k–66k → typisch in Seitwärtsmärkten. Der Kurs wischt oft die Hochs, um Stops/Liquidität mitzunehmen, bevor es wieder dreht.
Ablehnung und Abverkauf Richtung 52k (diesen Monat), dann 45k–40k im nächsten Monat → Das würde das H&S-Downside-Szenario, das wir zuvor besprochen haben, erweitern (siehe meinen vorherigen Post $BTC Head & Shoulder Pattern) und zu meiner größeren These zum Zyklus-Tief passen.
✅KURZFRISTIGE MÖGLICHKEITEN – (die nächsten Tage/diesen Monat):
🔴MEIN BÄR-FALL (Ablehnung bei 65k–66k): Sehr realistisch, wenn das Volumen im Aufwärtsbereich schwach bleibt und wir Verkaufsdruck nahe diesem Widerstand sehen. Ein Fehlschlag dort könnte tatsächlich dazu führen, dass es zuerst wieder Richtung $58k–$55k beschleunigt, wobei 52k das gemessene Ziel wäre, falls sich der Downside-Impuls aufbaut.
🟢 BULLISCHER FALL: Starke ETF-Zuflüsse, positive Makro-News oder Short-Covering könnten 65k durchbrechen und Kursziele bei 68k–70k+ ansteuern. Juli zeigt historisch in manchen Zyklen häufig grüne Tendenzen, nachdem vorherige Monate schwach waren.
✅Mein Fazit –
Der Markt ist weiterhin im Modus „erst beweisen“. Meine Gesamtansicht: Fortgesetzter bärischer Druck – mit einem Liquiditäts-„Sweep“ nach oben, bevor es zur nächsten Abwärtswelle kommt, ist ein klassisches Bear-Trap-/Distribution-Setup, das zur gesamten Post-ATH-Korrekturphase passt.
59
·
--
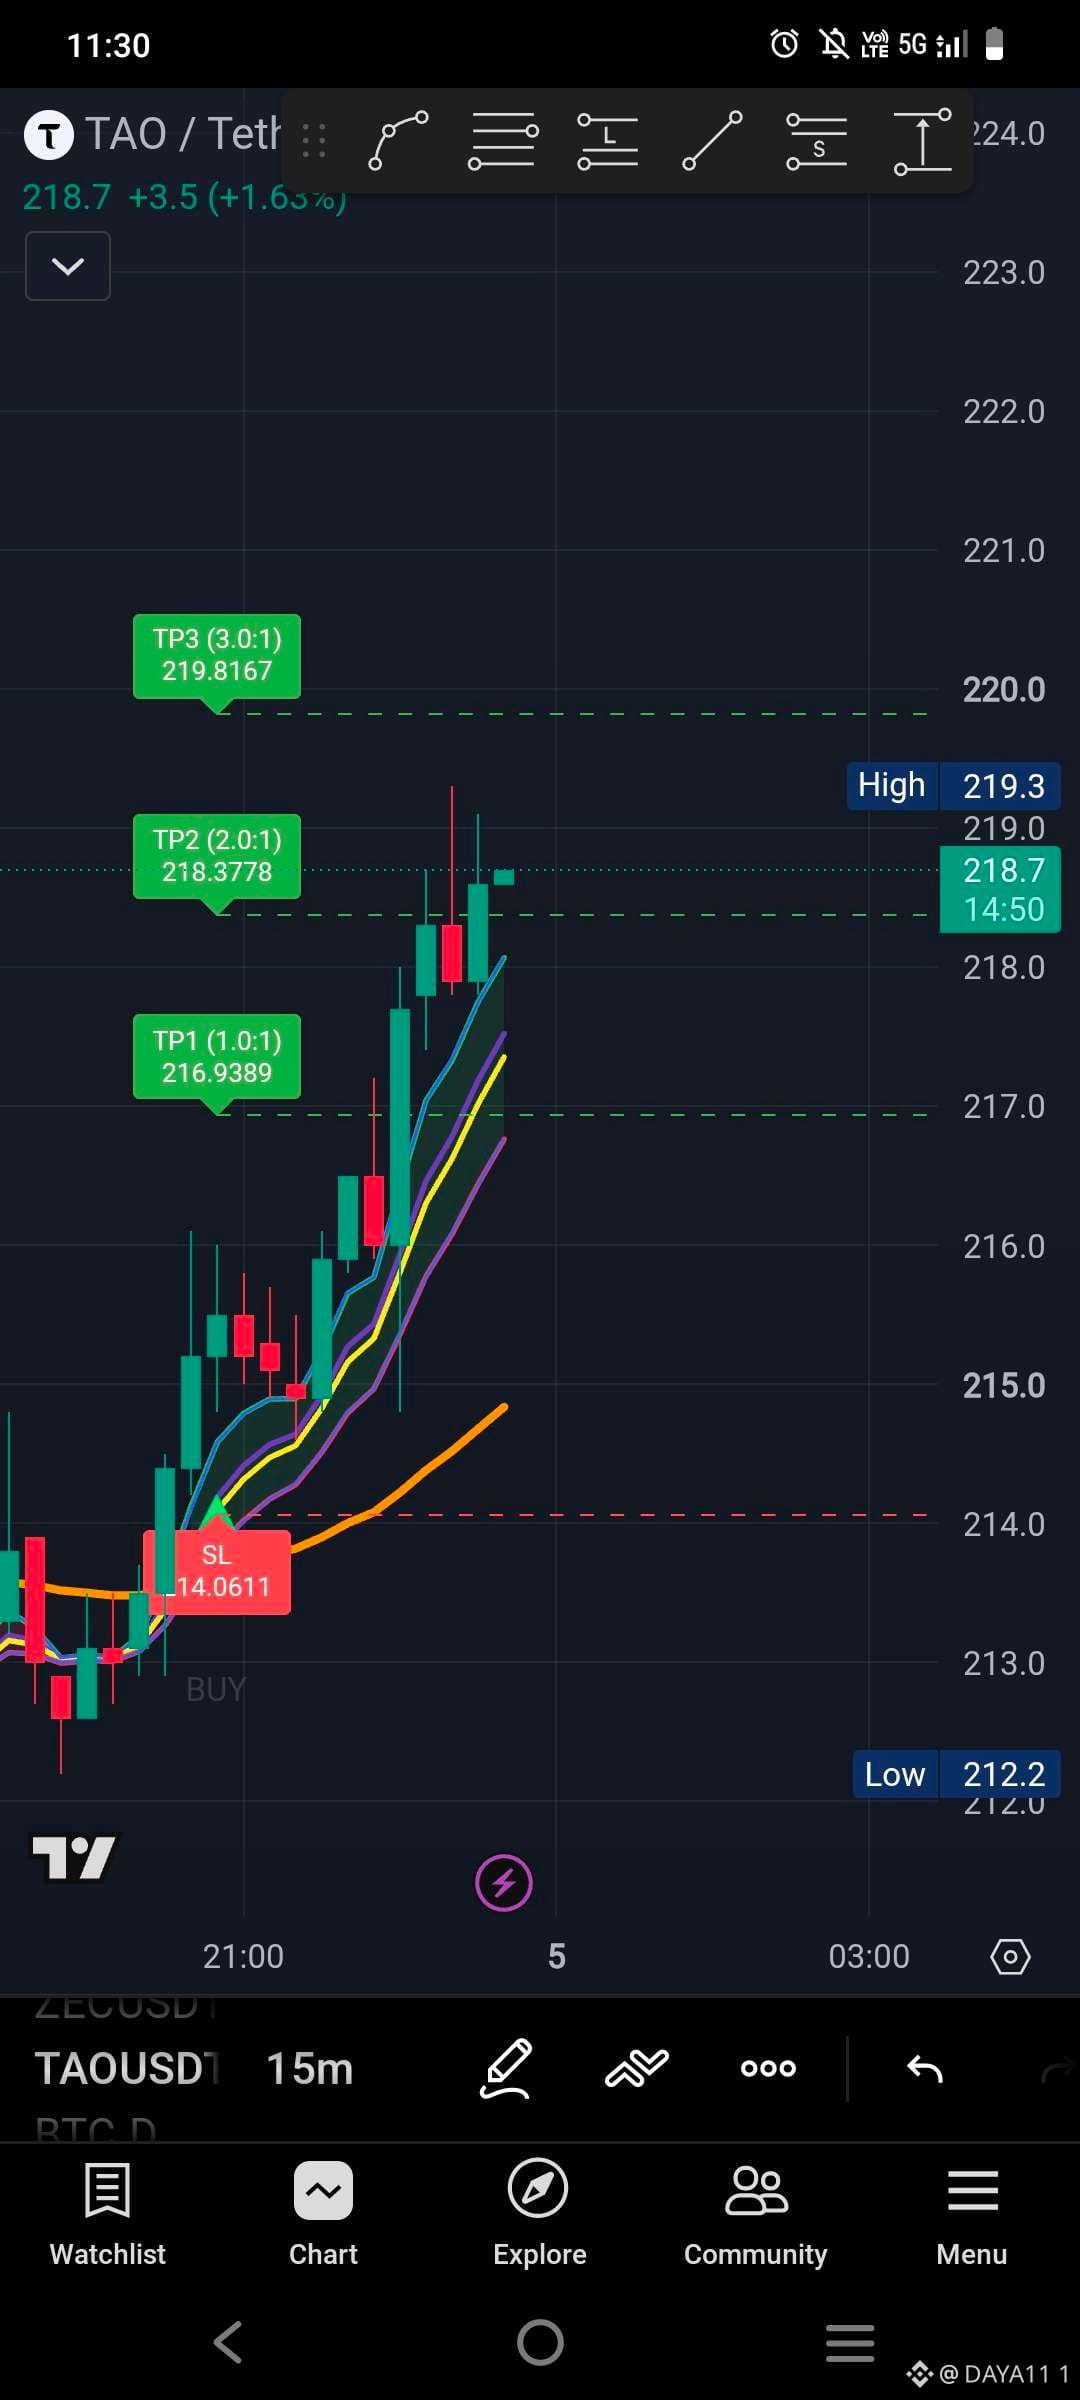
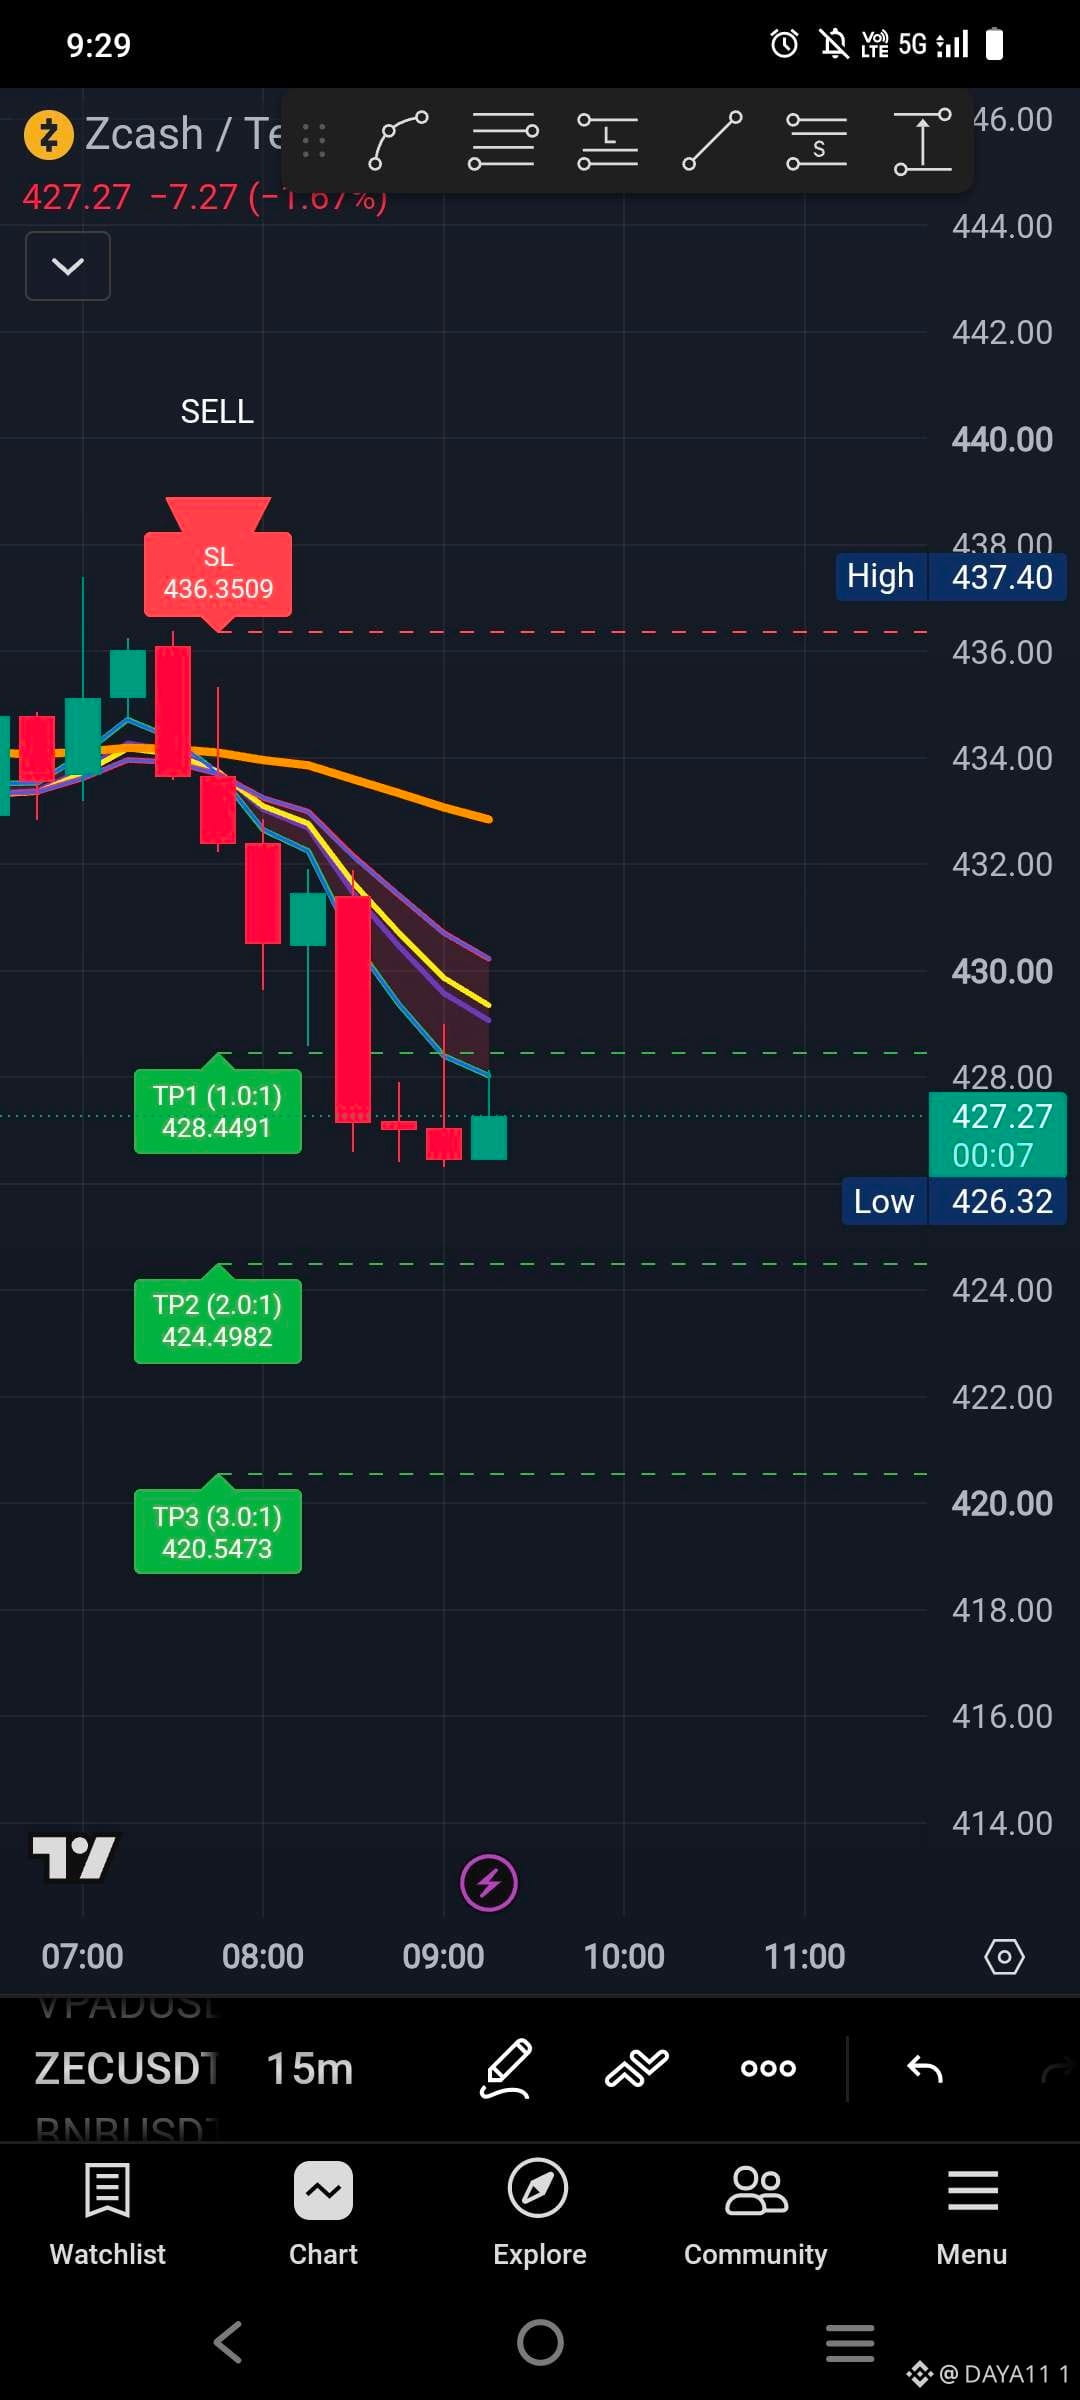
„ $ZEC hat gerade ein sauberes Short-Signal auf dem 15m-Chart gesendet 📈“
$ZEC trifft TP1 ✅ erfolgreich , jetzt bewegt sich der Kurs Richtung TP2 & TP3, währenddessen sollten alle neuen Einsteiger ihren TP nachziehen . Hier wird der beste Einstieg und Ausstieg erklärt 👇
✅„Willst du diesen Indikator für dein eigenes Trading?
Schreib mir per DM oder kommentiere „INDICATOR““
FROHES TRADING 🤑 VIEL SPASS BEIM VERDIENEN!
#Bitcoin #CryptoSignals #Trading #Altcoins
„ $ZEC hat gerade ein sauberes Short-Signal auf dem 15m-Chart gesendet 📈“
$ZEC trifft TP1 ✅ erfolgreich , jetzt bewegt sich der Kurs Richtung TP2 & TP3, währenddessen sollten alle neuen Einsteiger ihren TP nachziehen . Hier wird der beste Einstieg und Ausstieg erklärt 👇
✅„Willst du diesen Indikator für dein eigenes Trading?
Schreib mir per DM oder kommentiere „INDICATOR““
FROHES TRADING 🤑 VIEL SPASS BEIM VERDIENEN!
#Bitcoin #CryptoSignals #Trading #Altcoins
$ZEC trifft TP1 ✅ erfolgreich , jetzt bewegt sich der Kurs Richtung TP2 & TP3, währenddessen sollten alle neuen Einsteiger ihren TP nachziehen . Hier wird der beste Einstieg und Ausstieg erklärt 👇
✅„Willst du diesen Indikator für dein eigenes Trading?
Schreib mir per DM oder kommentiere „INDICATOR““
FROHES TRADING 🤑 VIEL SPASS BEIM VERDIENEN!
#Bitcoin #CryptoSignals #Trading #Altcoins
5
Anmelden und weiter Inhalte entdecken
Krypto-Nutzer weltweit auf Binance Square kennenlernen
⚡️ Bleib in Sachen Krypto stets am Puls.
💬 Die weltgrößte Kryptobörse vertraut darauf.
👍 Erhalte verlässliche Einblicke von verifizierten Creators.
E-Mail-Adresse/Telefonnummer
Trendthemen
SECHaltsCryptoETFReviewsAmidFundingLapse
57,104 Aufrufe
669 Kommentare
#sechaltscryptoetfreviewsamidfundinglapse
INVESTOREN IN KRYPTOS: SETZEN SIE SIE AUF IHRE BEOBACHTUNGSLISTE
Die SEC hätte die Analysen neuer Anträge für Krypto-ETFs vorübergehend während der Finanzierungspause ausgesetzt.
Das bedeutet: Zukünftige Entscheidungen können verschoben werden — aber die Produktionslinie der ETFs ist nicht verschwunden.
Verfolgen Sie:
- Entwicklungen bei der Finanzierung der SEC
- Zeitpläne der ETFs
- Reaktion von BT C und ET H
- Neue ETF-Anträge für Altcoins
Das nächste regulatorische Update kann wichtig sein.
$BTC $ETH $SOL #XRP
#sechaltscryptoetfreviewsamidfundinglapse
Green Rock Sinal
·5 Likes
·2.9k Aufrufe
ZcashETFPostsFirstWeeklyOutflow$93.6M
65,131 Aufrufe
200 Kommentare
GreekPoliceBustCryptoScamRingArrest17
217,350 Aufrufe
1,535 Kommentare