
CryptoTraders.com
259 Beiträge

CryptoTraders.com
Melden
Nutzer blockieren
Home of Top Analysts, Elite Trade Alerts, Cutting-Edge Algorithms, and Powerful Scanners — all built to give you the edge in any market. Join & Activate your 14-day free trial now to see the results yourself!
0 Following
3 Follower
3 Like gegeben
Beiträge
Übersetzung ansehen
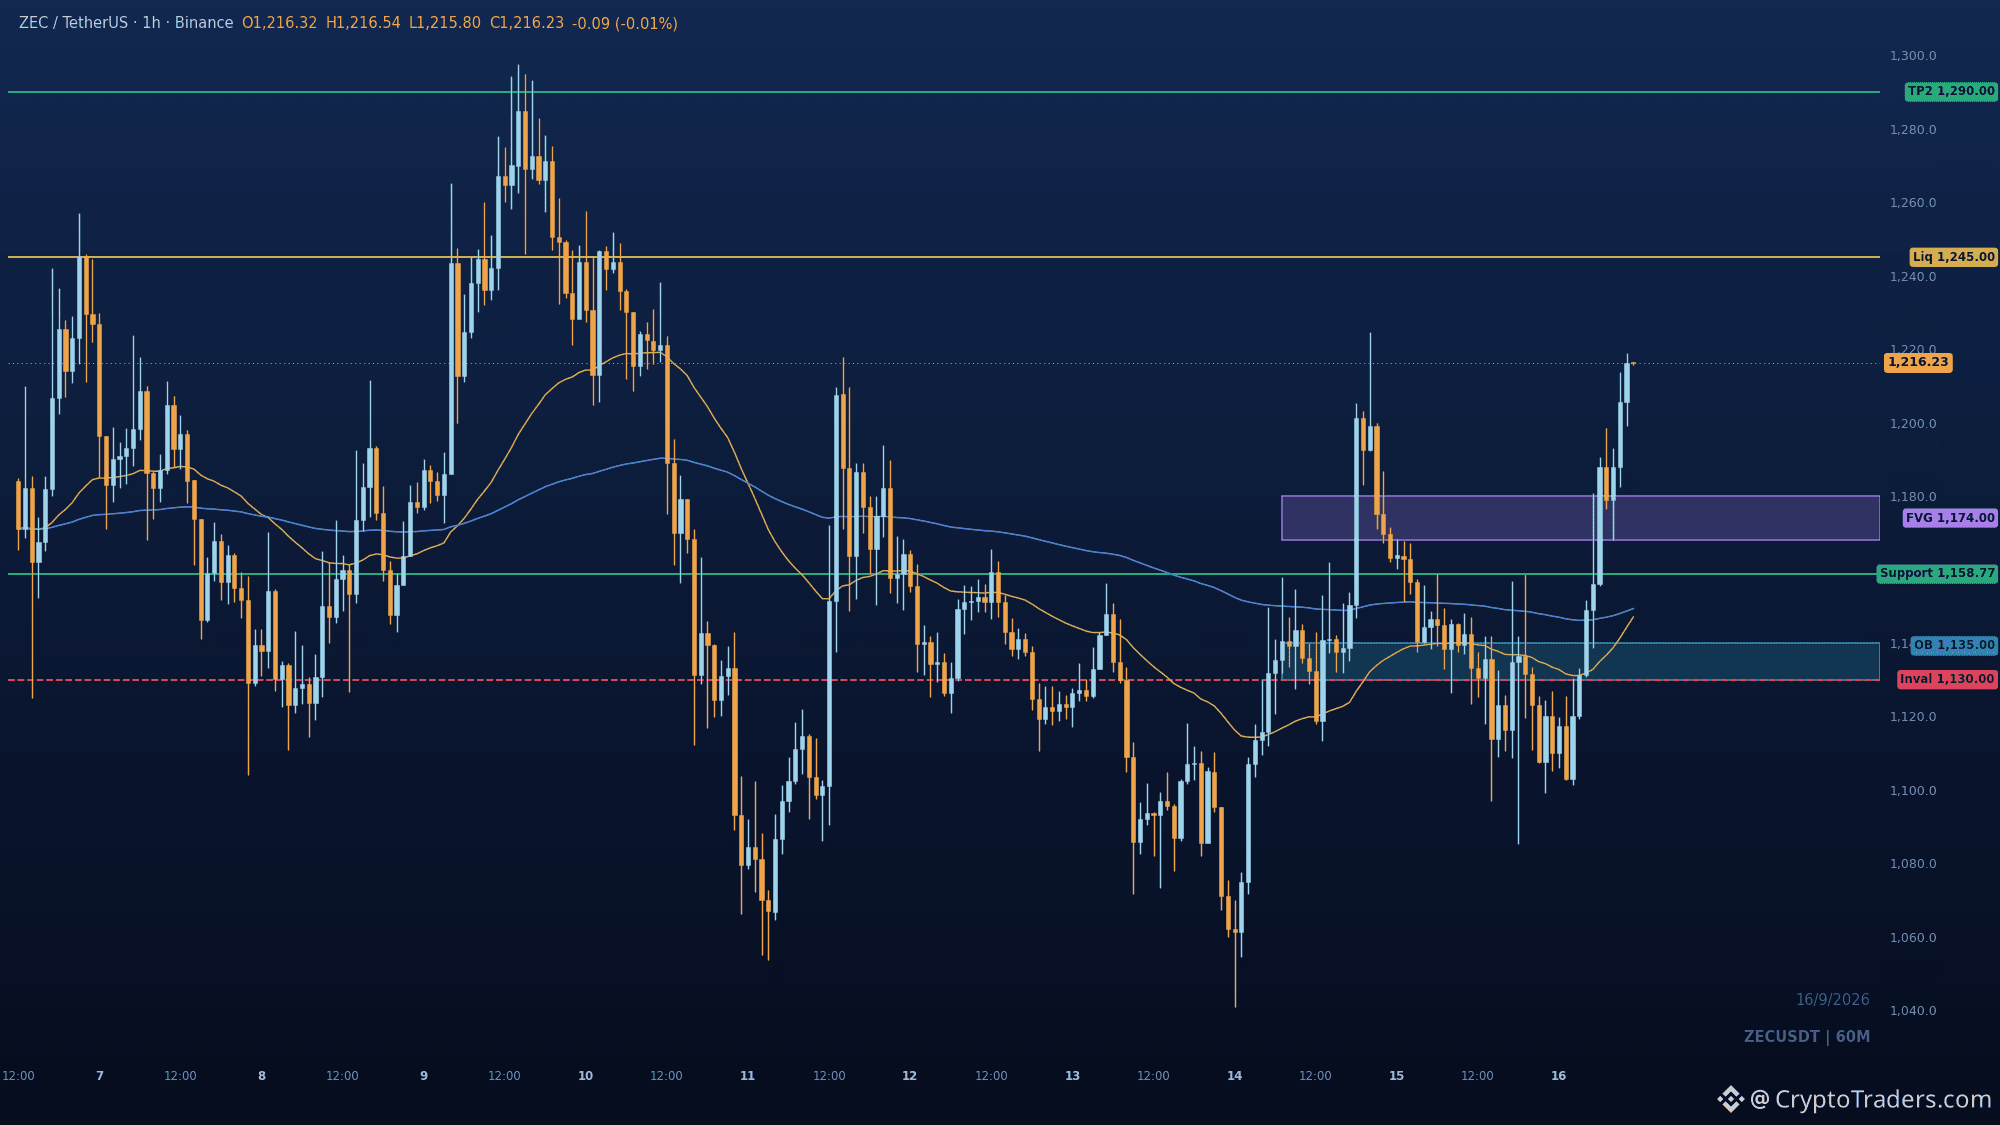
$ZEC takes the watchlist spot because 1158.77 flipped from the ceiling into the floor, and price is holding above it at 1,216. Smart money swept 1101.36, loaded below that swing high, then displaced through structure with a BOS. Pullbacks into 1180-1158.77 are where the broken level and the bullish imbalance overlap, with the order block at 1130-1140 as the deeper shelf. Upside objective is the buy-side liquidity at 1245, and 1290 if that gives way. Lose 1130 and the question changes from who gets paid to who is still paying. Is 1245 the next stop, or does ZEC need one more dip into the imbalance first? More reads like this land daily in the group, my bio has the way in. #Altcoin Season#
$ZEC takes the watchlist spot because 1158.77 flipped from the ceiling into the floor, and price is holding above it at 1,216. Smart money swept 1101.36, loaded below that swing high, then displaced through structure with a BOS. Pullbacks into 1180-1158.77 are where the broken level and the bullish imbalance overlap, with the order block at 1130-1140 as the deeper shelf. Upside objective is the buy-side liquidity at 1245, and 1290 if that gives way. Lose 1130 and the question changes from who gets paid to who is still paying. Is 1245 the next stop, or does ZEC need one more dip into the imbalance first? More reads like this land daily in the group, my bio has the way in. #Altcoin Season#
26
Übersetzung ansehen
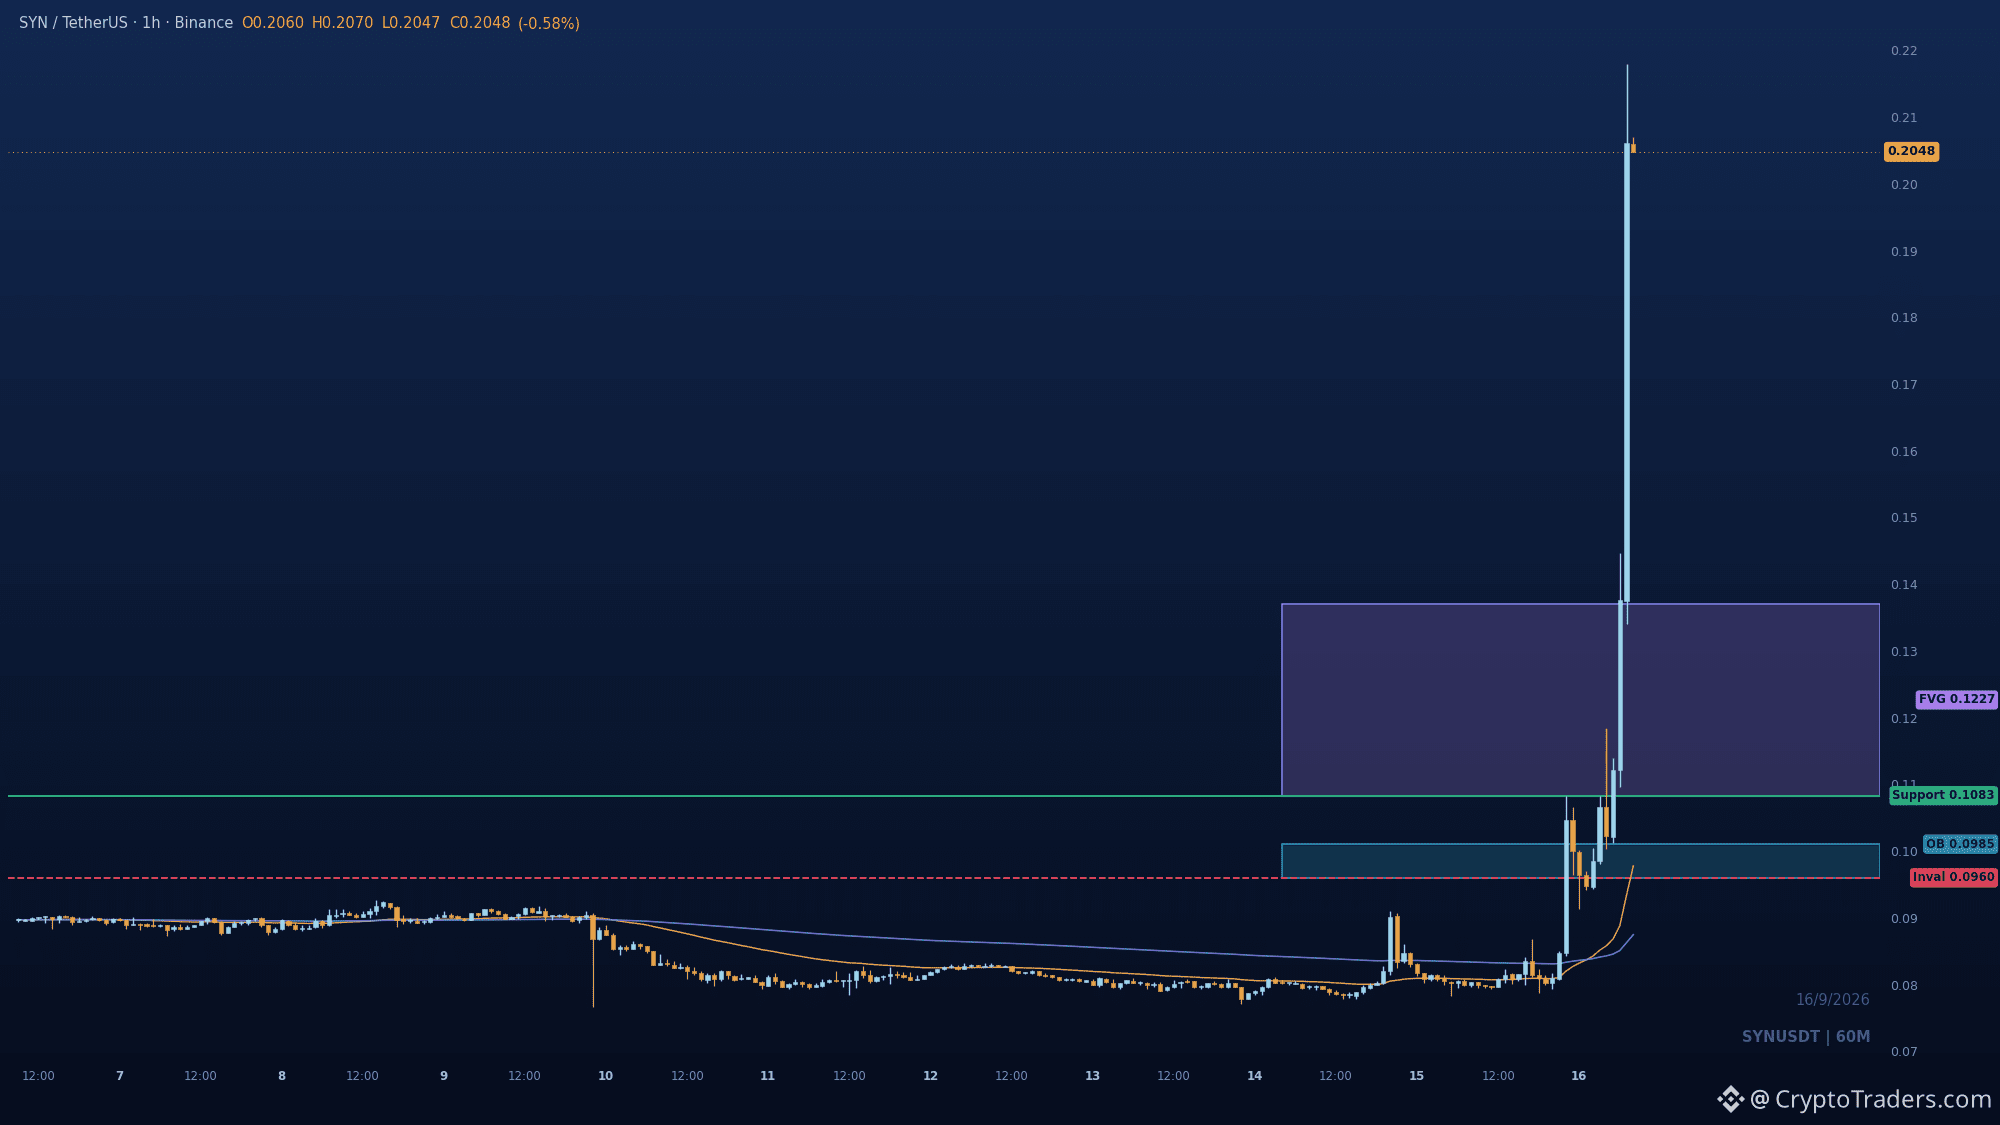
$SYN went up 155% in 24h and the 1h structure still hasn't given back a single level. BOS above 0.1083 confirmed the expansion, and price is now sitting in premium at 0.2048, far from the base it launched from. That gap between 0.1083 and 0.137 is the imbalance left behind, and it's the first place a real pullback would look for bids. If buyers defend 0.096 to 0.101, the breakout origin holds and continuation stays live. Lose 0.096 and the whole repricing is just a wick. Given how vertical this is, how many hours do you give it before the first real retrace? More setups like this land in the group every day, my bio has the way in. #Altcoin Season#
$SYN went up 155% in 24h and the 1h structure still hasn't given back a single level. BOS above 0.1083 confirmed the expansion, and price is now sitting in premium at 0.2048, far from the base it launched from. That gap between 0.1083 and 0.137 is the imbalance left behind, and it's the first place a real pullback would look for bids. If buyers defend 0.096 to 0.101, the breakout origin holds and continuation stays live. Lose 0.096 and the whole repricing is just a wick. Given how vertical this is, how many hours do you give it before the first real retrace? More setups like this land in the group every day, my bio has the way in. #Altcoin Season#
27
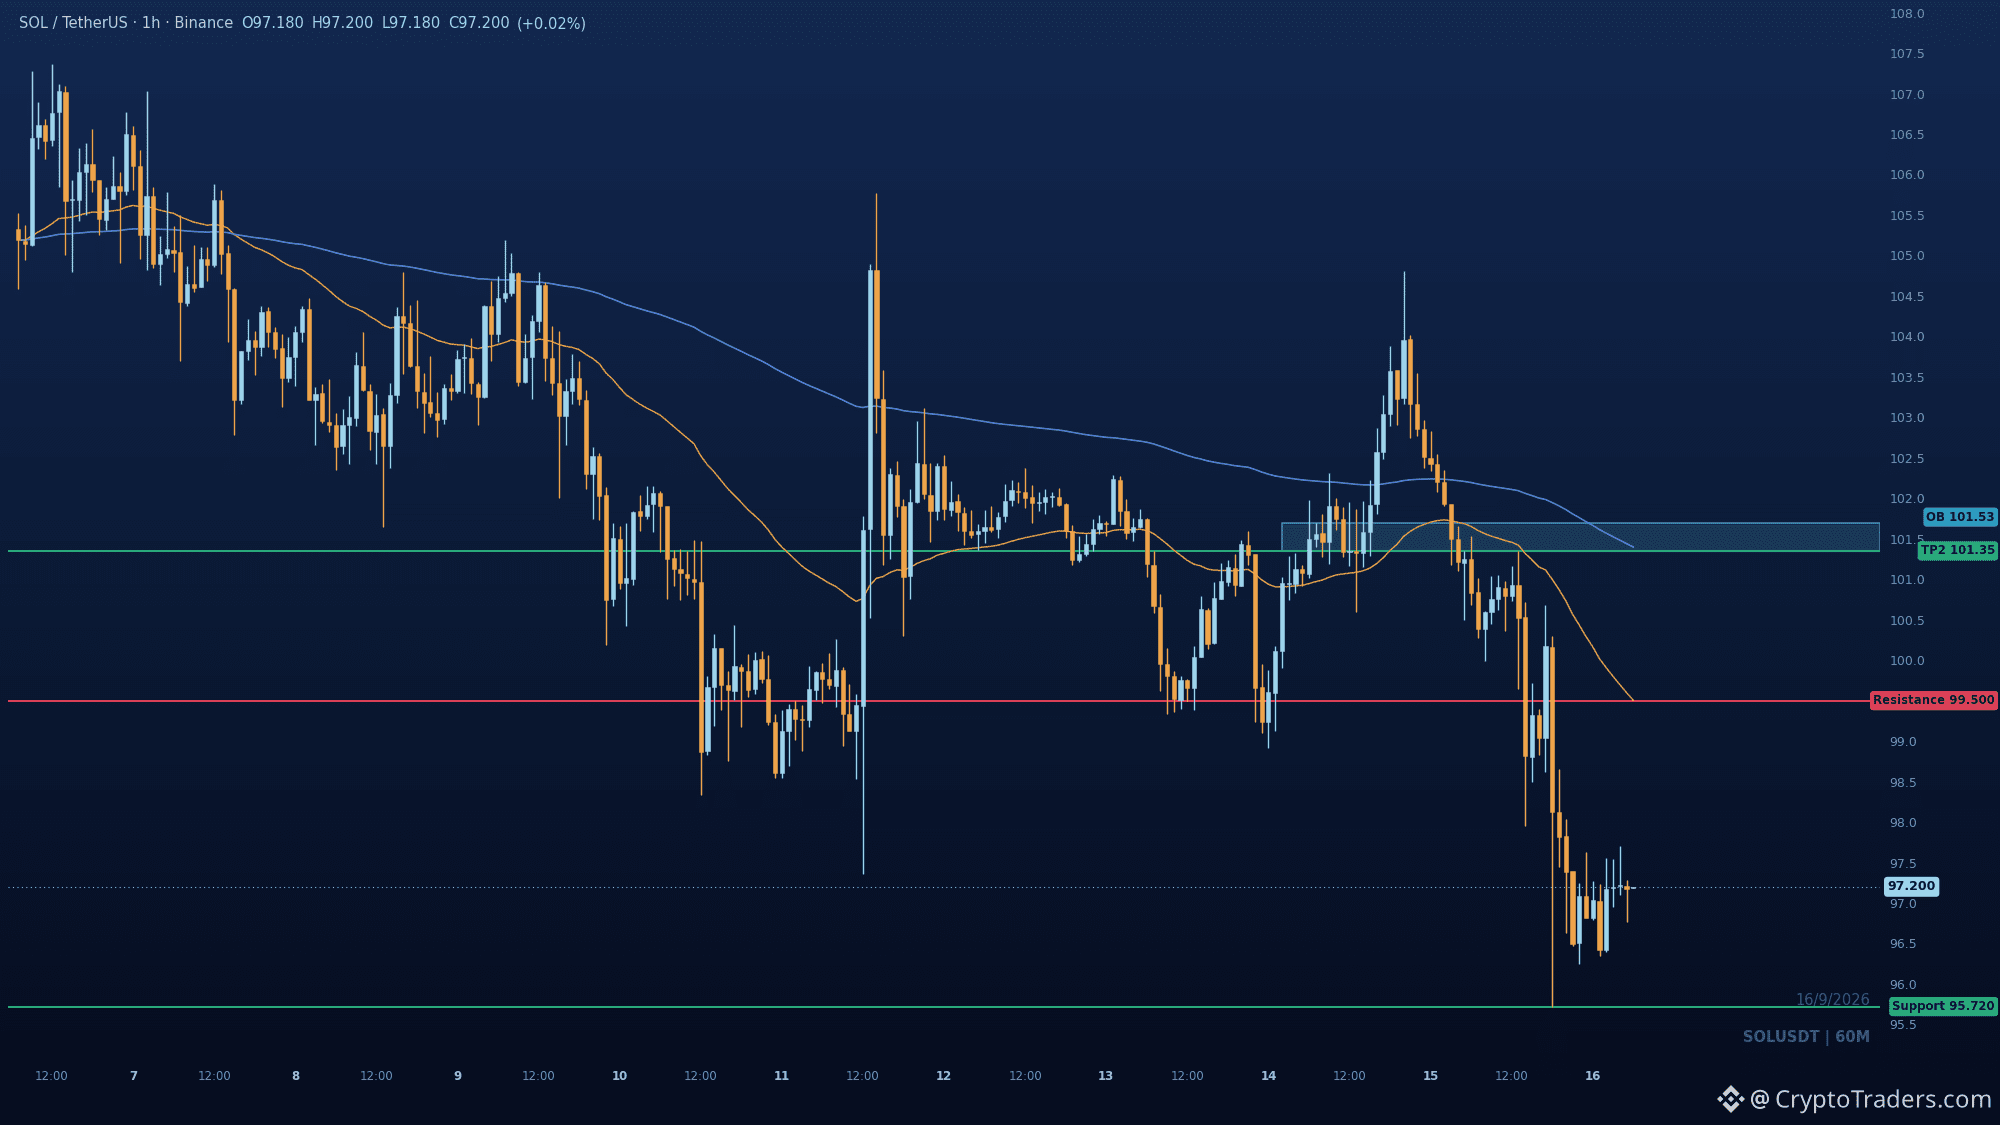
Der Seltsame auf diesem Chart: $SOL hat die Spanne von 95,72 nach unten abgefegt, und die 1h hat immer noch keinen einzigen höheren Tiefpunkt ausgedruckt. Die Struktur ist unter 96,25 gebrochen, der Kurs sitzt tief im Discount, und der Bounce ist der Trade, den niemand eingehen will. Ich erwarte zunächst den Relief-Retracement bis 99,50, dort wo die EMA und das Rebalance liegen. Rückeroberung bei 101,35 und der Supply-Block bei 101,7 kommt ins Spiel. Abweisung unter 99,50 hält das Downside am Leben, und wenn 95,72 verloren geht, wird der Bounce komplett abgesagt. Glaubst du, dieser Bounce erreicht 99,50 oder wird dort in ihn hinein verkauft? Liest sich so, als ob dieses Land jeden Tag in der Gruppe ankommt, die Bio hat den Weg drin. #Altcoin Season#
Der Seltsame auf diesem Chart: $SOL hat die Spanne von 95,72 nach unten abgefegt, und die 1h hat immer noch keinen einzigen höheren Tiefpunkt ausgedruckt. Die Struktur ist unter 96,25 gebrochen, der Kurs sitzt tief im Discount, und der Bounce ist der Trade, den niemand eingehen will. Ich erwarte zunächst den Relief-Retracement bis 99,50, dort wo die EMA und das Rebalance liegen. Rückeroberung bei 101,35 und der Supply-Block bei 101,7 kommt ins Spiel. Abweisung unter 99,50 hält das Downside am Leben, und wenn 95,72 verloren geht, wird der Bounce komplett abgesagt. Glaubst du, dieser Bounce erreicht 99,50 oder wird dort in ihn hinein verkauft? Liest sich so, als ob dieses Land jeden Tag in der Gruppe ankommt, die Bio hat den Weg drin. #Altcoin Season#
40
Übersetzung ansehen
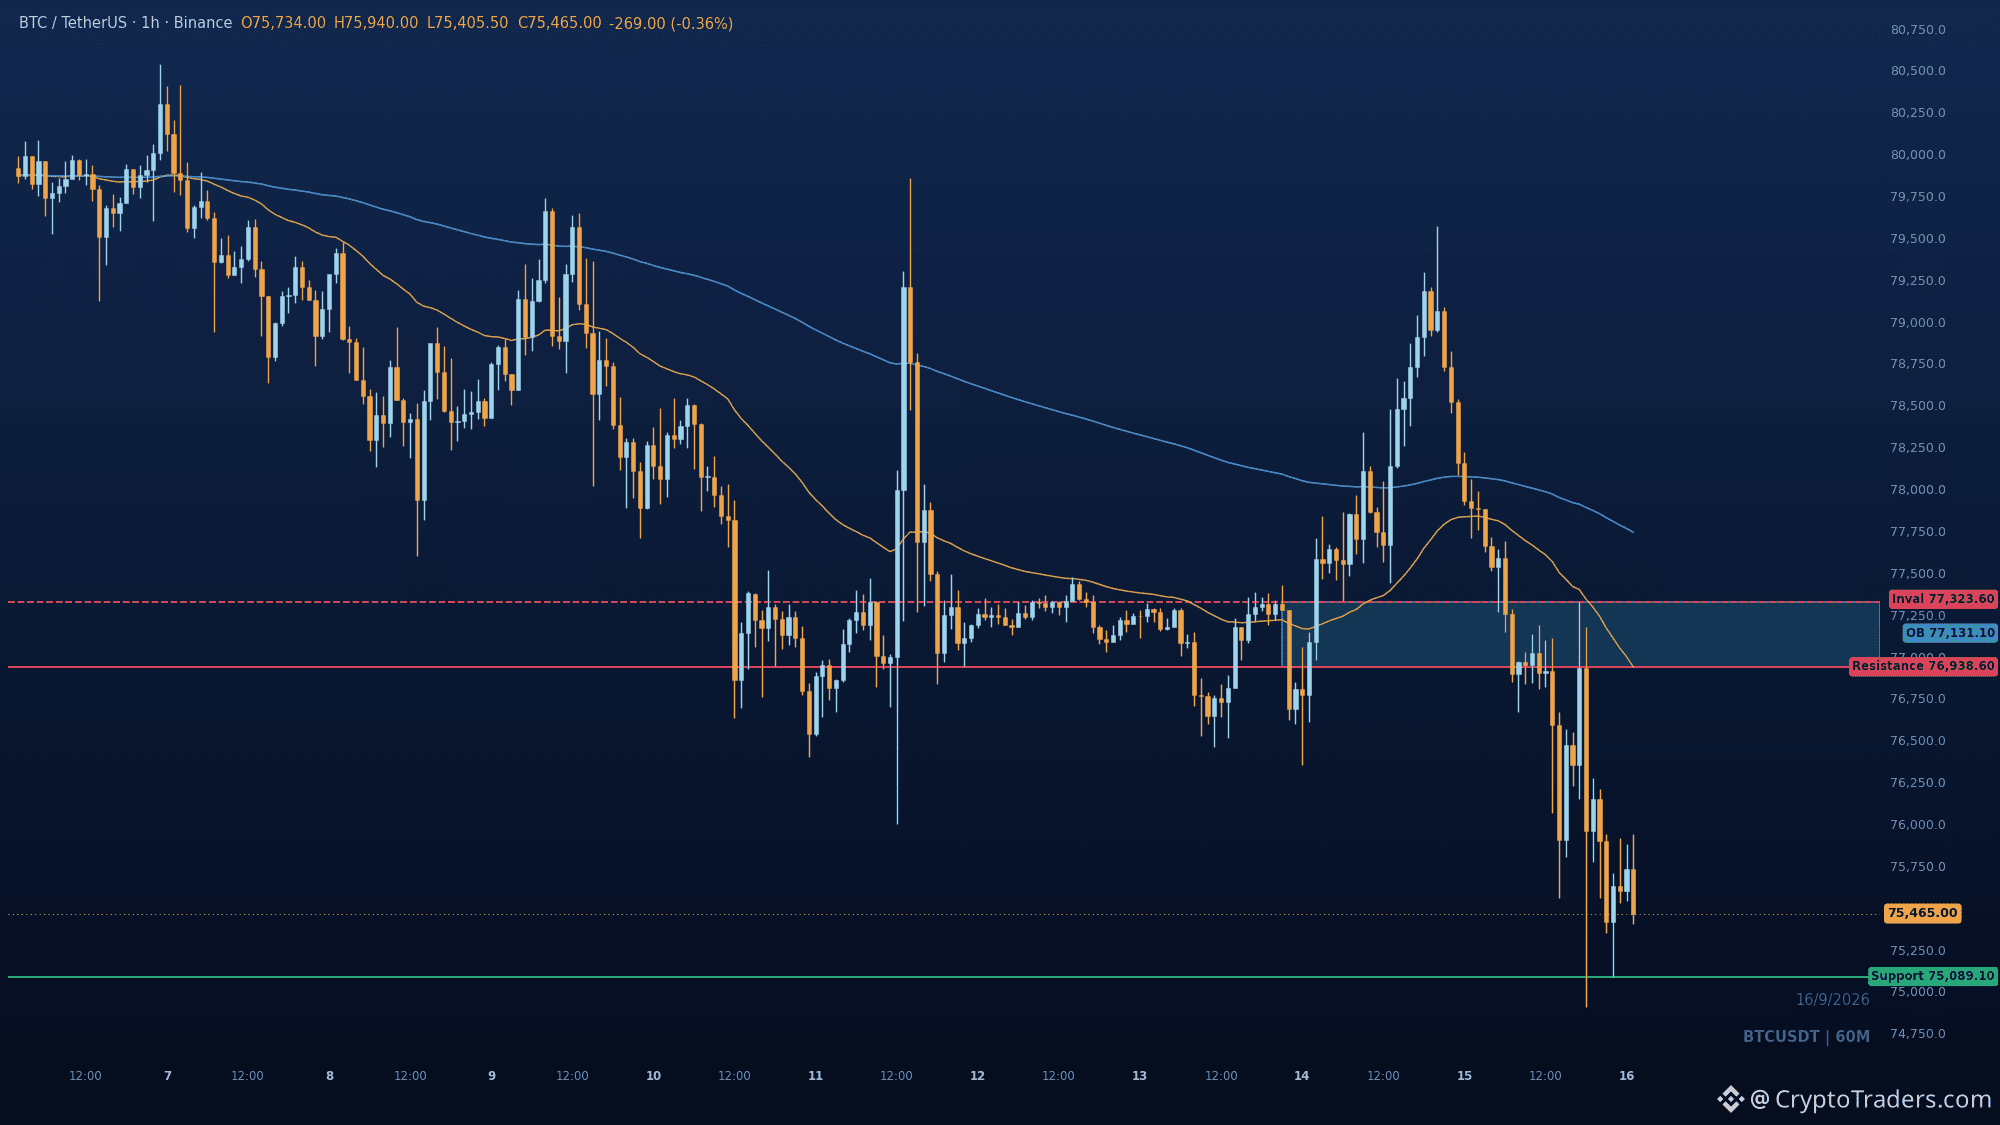
Bitcoin ETF flows flipped from 986.7 million of buying to 462.7 million of selling as $BTC slips 3.1% to 75,513 📉 1⃣ Rate odds are the real driver: Fed-funds futures now imply 86 to 87 percent odds of a 25 bp hike on September 16, and rising real yields plus energy-driven inflation are squeezing risk assets. Neither BTC nor ETH has held its rebound. 2⃣ The flow split is telling: Bitcoin ETFs swung to 462.7 million in net selling, while spot ETH ETFs pulled 216.4 million in a single session and took most of the recent five-session inflows. Capital is rotating inside crypto rather than leaving it. 3⃣ Alt tape is mixed, not broken: ARB gained 11.2% on 48 million in quote volume and VTHO added 21.3%, while ASTR fell 14.7% and INJ dropped 12.9%. Selective bids are still showing up under a hawkish macro lid. Macro is setting the price, flows are only choosing the lane. Which matters more for the next leg, the September Fed odds or the ETF flow reversal? More breakdowns like this land in the group every day, the bio shows the way in. #BTC Price Analysis# #Bitcoin Price Prediction: What is Bitcoins next move?# #Macro Insights#
Bitcoin ETF flows flipped from 986.7 million of buying to 462.7 million of selling as $BTC slips 3.1% to 75,513 📉 1⃣ Rate odds are the real driver: Fed-funds futures now imply 86 to 87 percent odds of a 25 bp hike on September 16, and rising real yields plus energy-driven inflation are squeezing risk assets. Neither BTC nor ETH has held its rebound. 2⃣ The flow split is telling: Bitcoin ETFs swung to 462.7 million in net selling, while spot ETH ETFs pulled 216.4 million in a single session and took most of the recent five-session inflows. Capital is rotating inside crypto rather than leaving it. 3⃣ Alt tape is mixed, not broken: ARB gained 11.2% on 48 million in quote volume and VTHO added 21.3%, while ASTR fell 14.7% and INJ dropped 12.9%. Selective bids are still showing up under a hawkish macro lid. Macro is setting the price, flows are only choosing the lane. Which matters more for the next leg, the September Fed odds or the ETF flow reversal? More breakdowns like this land in the group every day, the bio shows the way in. #BTC Price Analysis# #Bitcoin Price Prediction: What is Bitcoins next move?# #Macro Insights#
60
Übersetzung ansehen
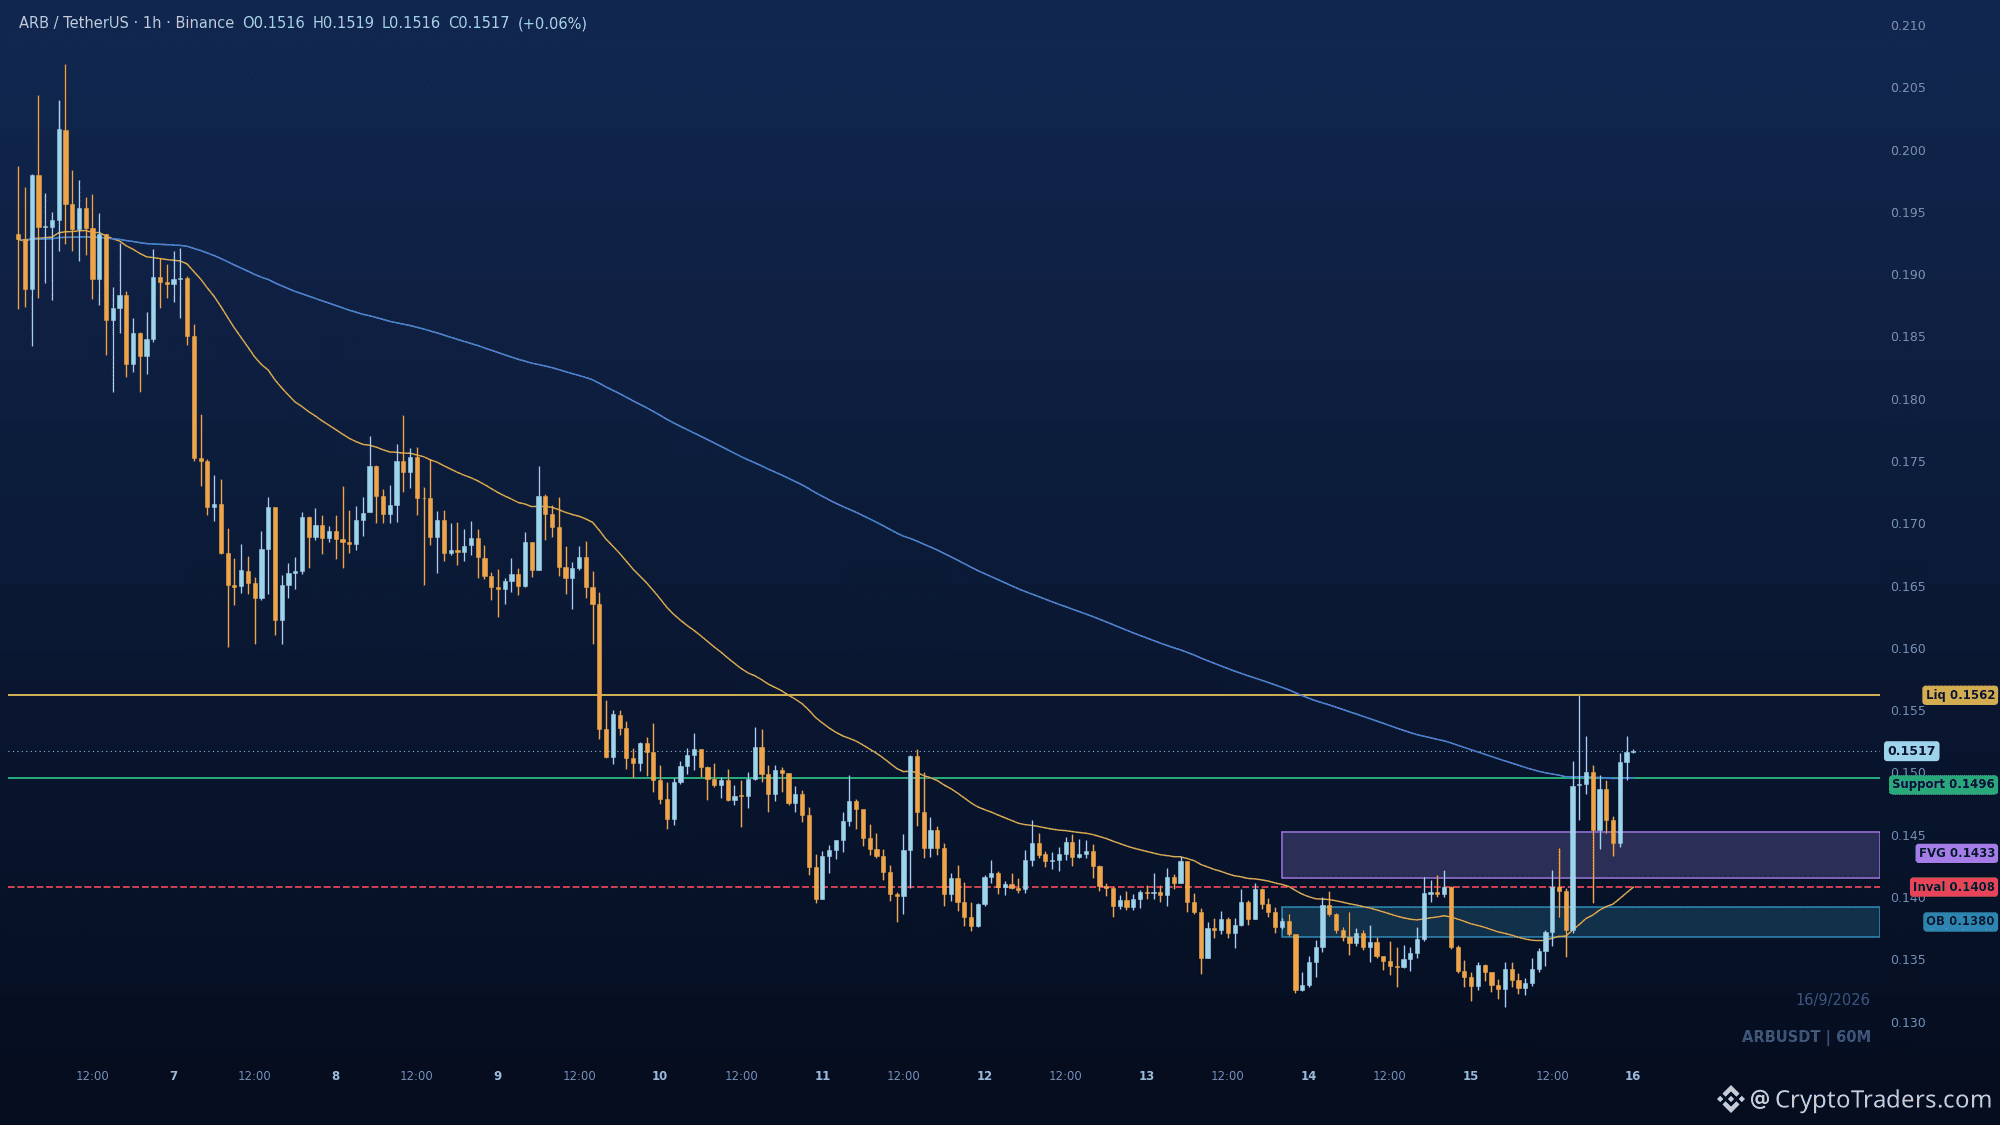
$ARB just printed a bullish CHoCH above 0.14957, the kind of shift that tends to follow accumulation rather than end it. Structure is still bearish on the broader frame, but price displaced above the 200 EMA and sits in discount of the visible range. The re-entry zone is 0.14957 to 0.14520, with an FVG at 0.1415 to 0.1452 and the order block at 0.1368 to 0.1392 underneath. Buyers defending that shelf keeps 0.15620 in play; losing 0.1408 flips the whole read back to the old downtrend. Do you want the pullback first, or does 0.15620 get tagged without one? More setups like this land daily in the group, bio has the way in. #Altcoin Season#
$ARB just printed a bullish CHoCH above 0.14957, the kind of shift that tends to follow accumulation rather than end it. Structure is still bearish on the broader frame, but price displaced above the 200 EMA and sits in discount of the visible range. The re-entry zone is 0.14957 to 0.14520, with an FVG at 0.1415 to 0.1452 and the order block at 0.1368 to 0.1392 underneath. Buyers defending that shelf keeps 0.15620 in play; losing 0.1408 flips the whole read back to the old downtrend. Do you want the pullback first, or does 0.15620 get tagged without one? More setups like this land daily in the group, bio has the way in. #Altcoin Season#
79
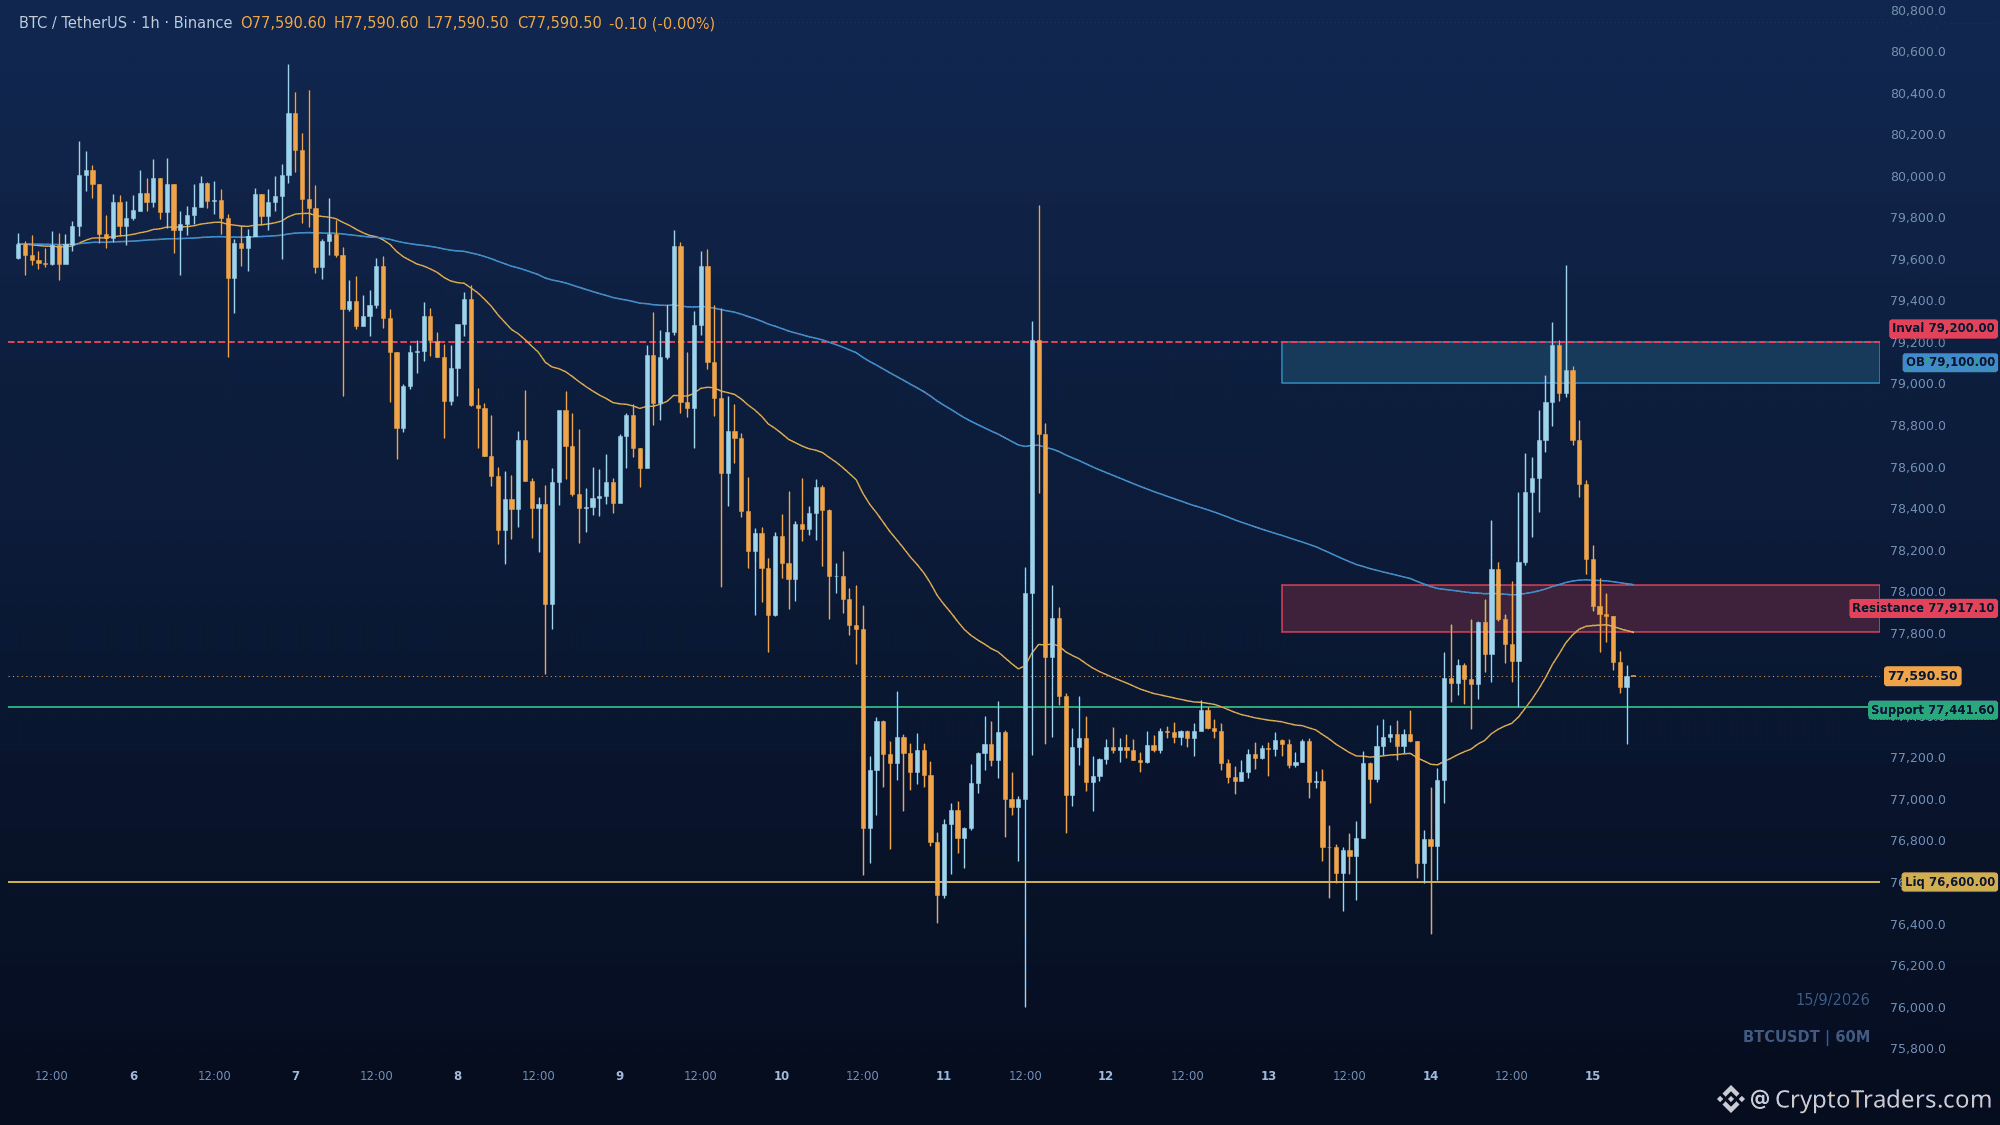
$BTC wurde bei 79570,9 abgewiesen und die 1h hat bereits einen bärischen Break of Structure unterhalb des EMA-Clusters gedruckt. Der Anstieg in dieses Hoch sieht nach Distribution aus: Smart Money nutzte die überschüssige Liquidität, und verdrängte dann den Preis nach unten. Der Preis handelt nun im Discount—dort wird die Fortsetzung normalerweise entschieden, nicht dort, wo Bottoms ausgerufen werden. Der Overhead-Supply liegt bei 77802,2 bis 78032,0, dem EMA-Cluster und der wahrscheinlichen Mitigationszone. Ein Re-Run in dieses Niveau, der scheitert, ist das Setup. Eine Akzeptanz oberhalb von 79200,0 zerstört das gesamte Read. Nach unten liegende Liquidität: 77441,6 ist das jüngste Swing-Low, und 76600,0 ist der vorherige strukturelle Floor darunter. Was gibt zuerst nach: die 77441,6-Schwelle oder das Re-Test bei 78032,0? Klingt so, als würde das diese Woche im Gruppen-Chat täglich gepostet—Bio hat die Details. #BTC Price Analysis# #Bitcoin Price Prediction: What is Bitcoins next move?#
$BTC wurde bei 79570,9 abgewiesen und die 1h hat bereits einen bärischen Break of Structure unterhalb des EMA-Clusters gedruckt. Der Anstieg in dieses Hoch sieht nach Distribution aus: Smart Money nutzte die überschüssige Liquidität, und verdrängte dann den Preis nach unten. Der Preis handelt nun im Discount—dort wird die Fortsetzung normalerweise entschieden, nicht dort, wo Bottoms ausgerufen werden. Der Overhead-Supply liegt bei 77802,2 bis 78032,0, dem EMA-Cluster und der wahrscheinlichen Mitigationszone. Ein Re-Run in dieses Niveau, der scheitert, ist das Setup. Eine Akzeptanz oberhalb von 79200,0 zerstört das gesamte Read. Nach unten liegende Liquidität: 77441,6 ist das jüngste Swing-Low, und 76600,0 ist der vorherige strukturelle Floor darunter. Was gibt zuerst nach: die 77441,6-Schwelle oder das Re-Test bei 78032,0? Klingt so, als würde das diese Woche im Gruppen-Chat täglich gepostet—Bio hat die Details. #BTC Price Analysis# #Bitcoin Price Prediction: What is Bitcoins next move?#
32
Übersetzung ansehen
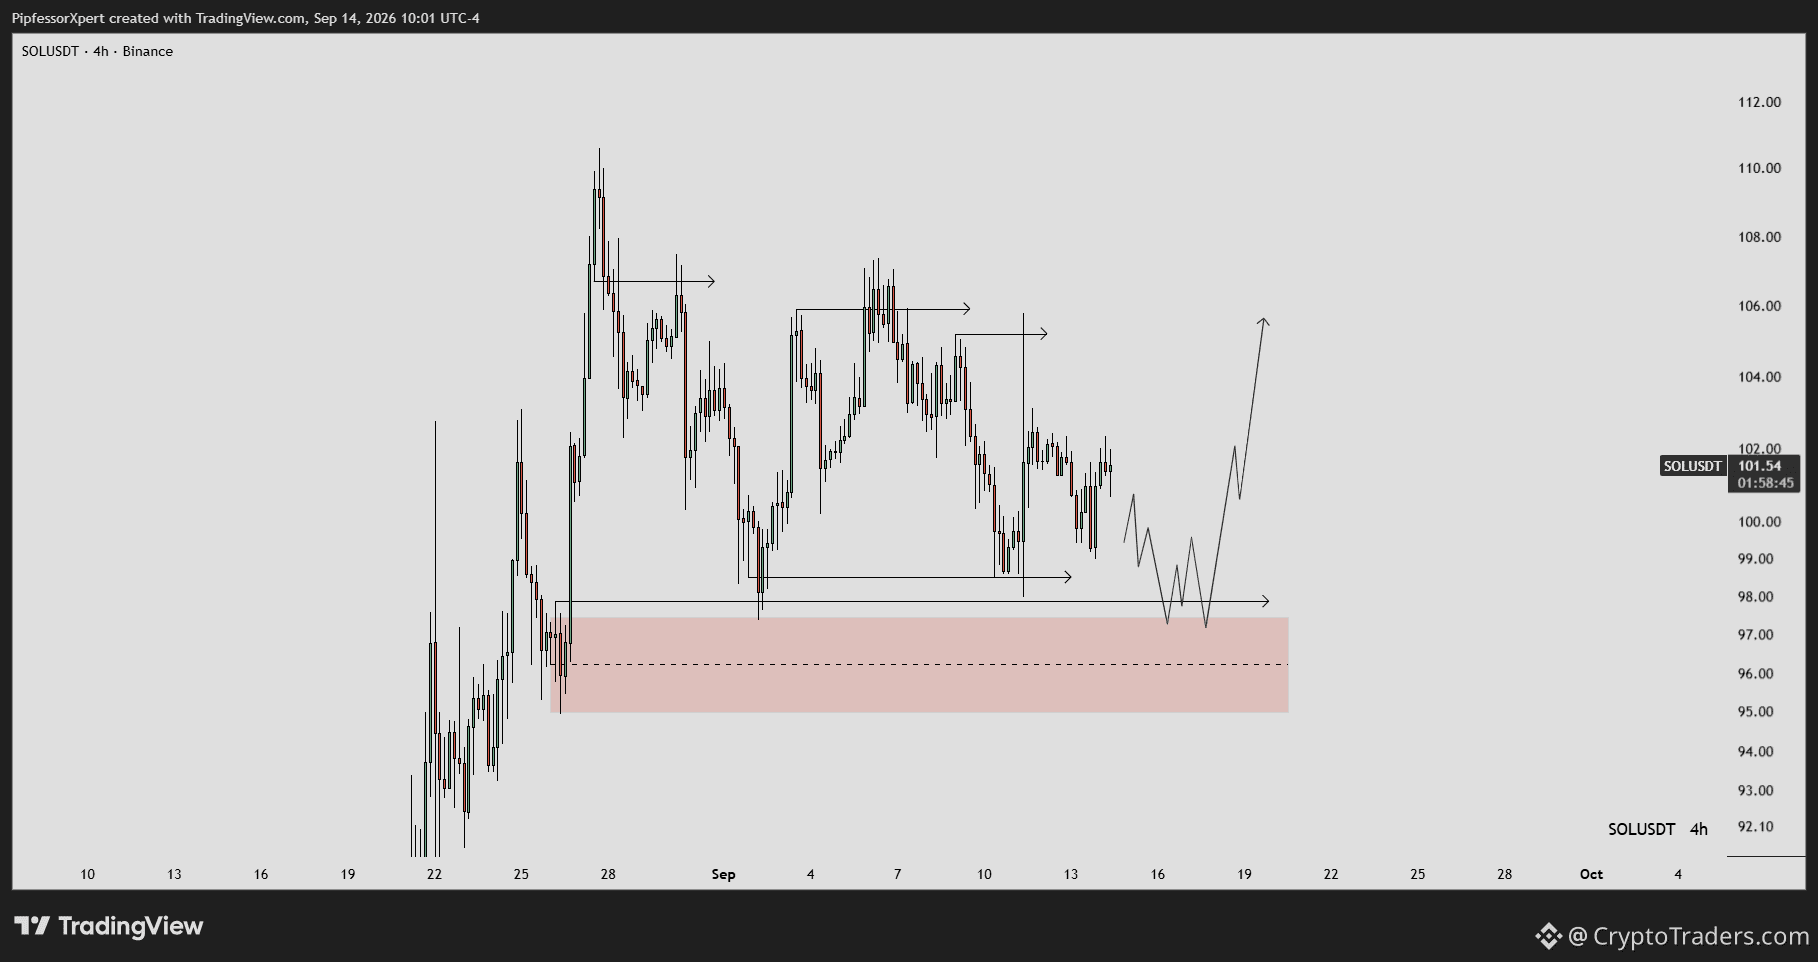
$SOL just bounced off the 98.5 demand shelf, and buyers are already leaning on it a second time. The 4H is coiling in a range above the 95 to 97.5 demand zone, with 98.5 and 97.9 as the first line of defense. Upside targets sit at 105.3, 105.9 and 106.8, with the measured move pointing toward 109 to 110 if the range breaks. A clean hold above 98.5 keeps the bullish structure intact, but losing 96.2 would put the whole demand base back in play. Are you watching for the retest before the breakout, or already positioned for the continuation? More reads like this land daily in the group, bio has the way in. #Altcoin Season#
$SOL just bounced off the 98.5 demand shelf, and buyers are already leaning on it a second time. The 4H is coiling in a range above the 95 to 97.5 demand zone, with 98.5 and 97.9 as the first line of defense. Upside targets sit at 105.3, 105.9 and 106.8, with the measured move pointing toward 109 to 110 if the range breaks. A clean hold above 98.5 keeps the bullish structure intact, but losing 96.2 would put the whole demand base back in play. Are you watching for the retest before the breakout, or already positioned for the continuation? More reads like this land daily in the group, bio has the way in. #Altcoin Season#
78
Übersetzung ansehen
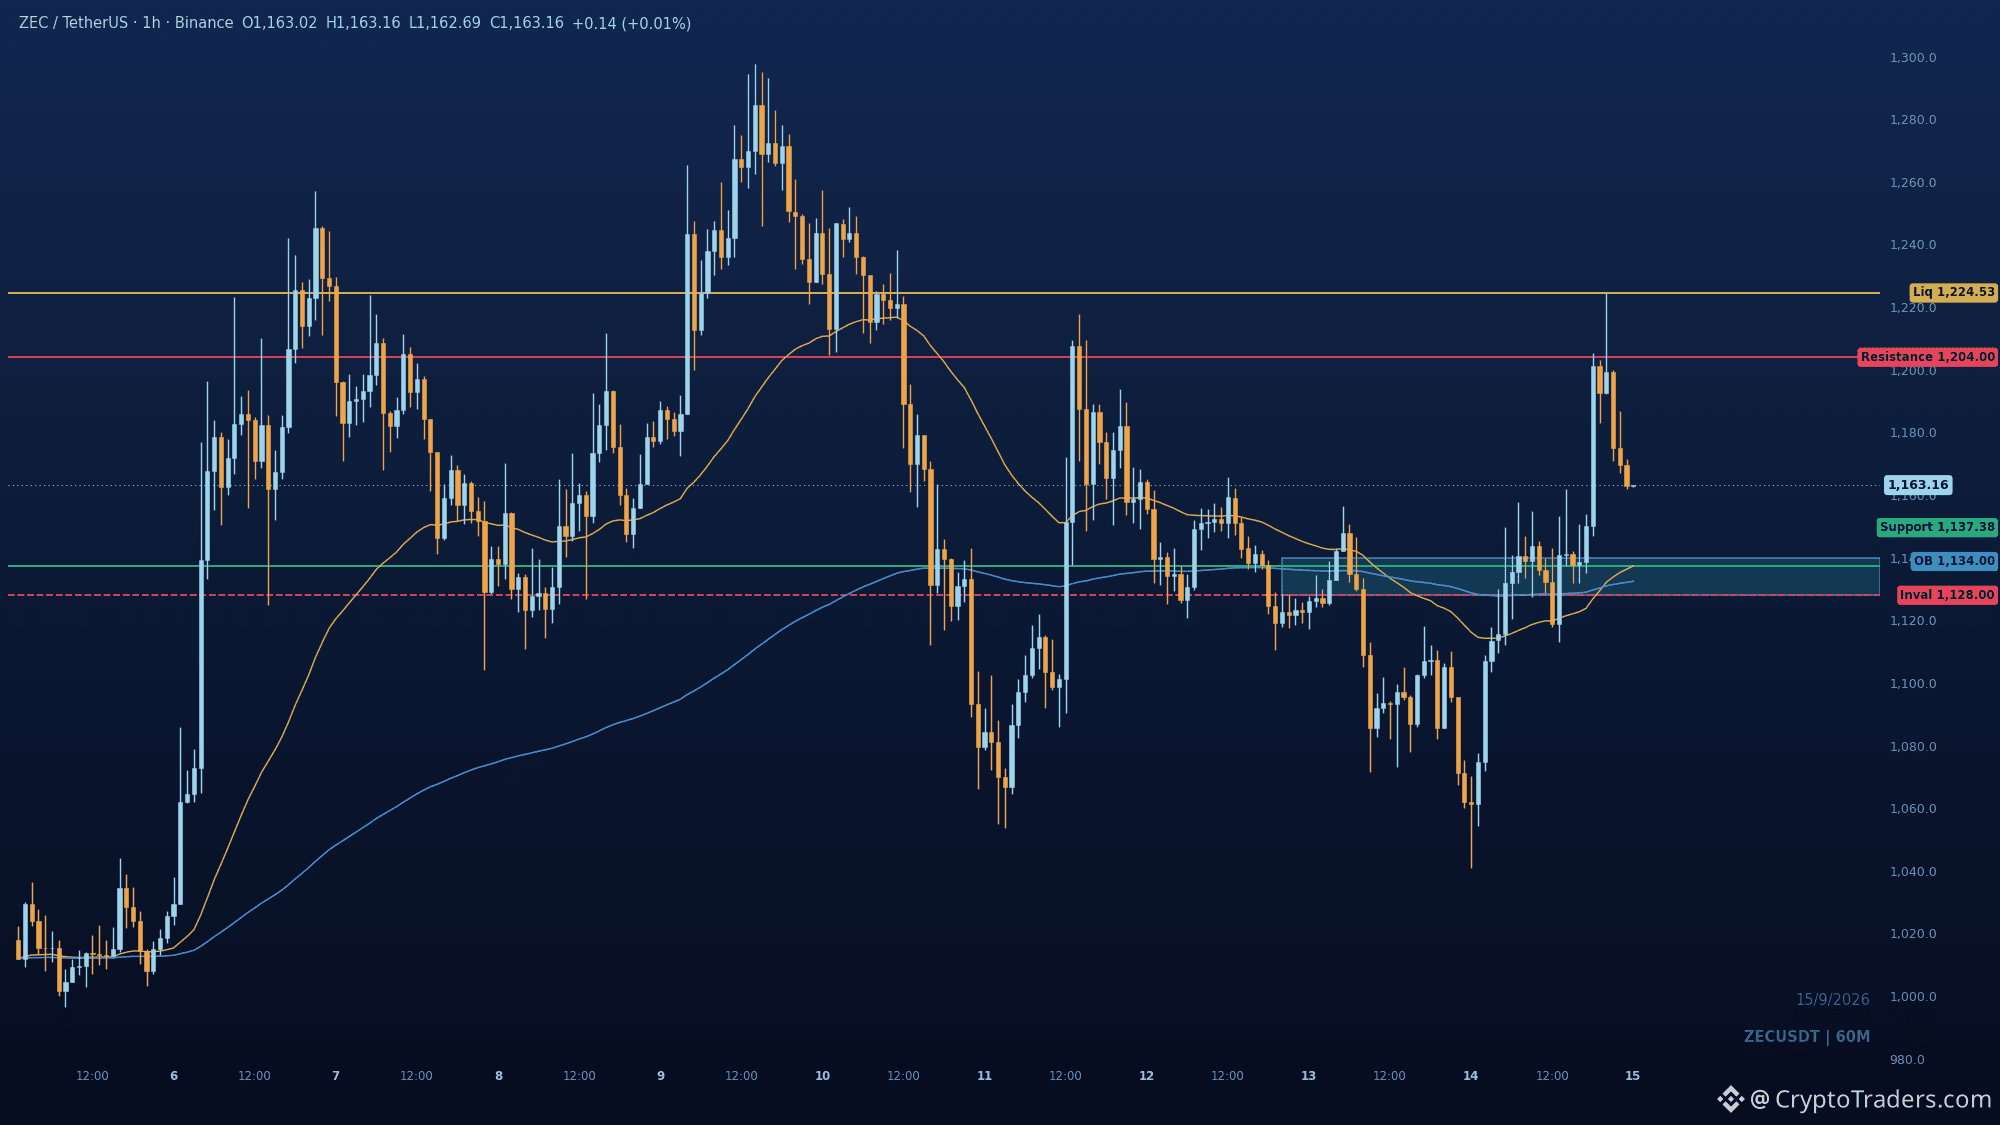
1,137. That is the line that decides whether $ZEC's 9.3% day turns into a trend or just a wick. Price broke structure above 1145, tagged 1200, and smart money is now taking partial profit. The retrace is hunting re-entry liquidity, not distribution. The 1140 to 1137 shelf is where the fast EMA and the broken structure sit together. That is the tell. Defend it and the next legs are 1204, then 1224.53 where buy-side liquidity is parked. Lose 1128 and the bullish read is dead. Would you rather see ZEC hold 1137 on this dip, or flush it and reset lower? Reads like this land daily in the community, bio has the way in. #Altcoin Season#
1,137. That is the line that decides whether $ZEC's 9.3% day turns into a trend or just a wick. Price broke structure above 1145, tagged 1200, and smart money is now taking partial profit. The retrace is hunting re-entry liquidity, not distribution. The 1140 to 1137 shelf is where the fast EMA and the broken structure sit together. That is the tell. Defend it and the next legs are 1204, then 1224.53 where buy-side liquidity is parked. Lose 1128 and the bullish read is dead. Would you rather see ZEC hold 1137 on this dip, or flush it and reset lower? Reads like this land daily in the community, bio has the way in. #Altcoin Season#
57
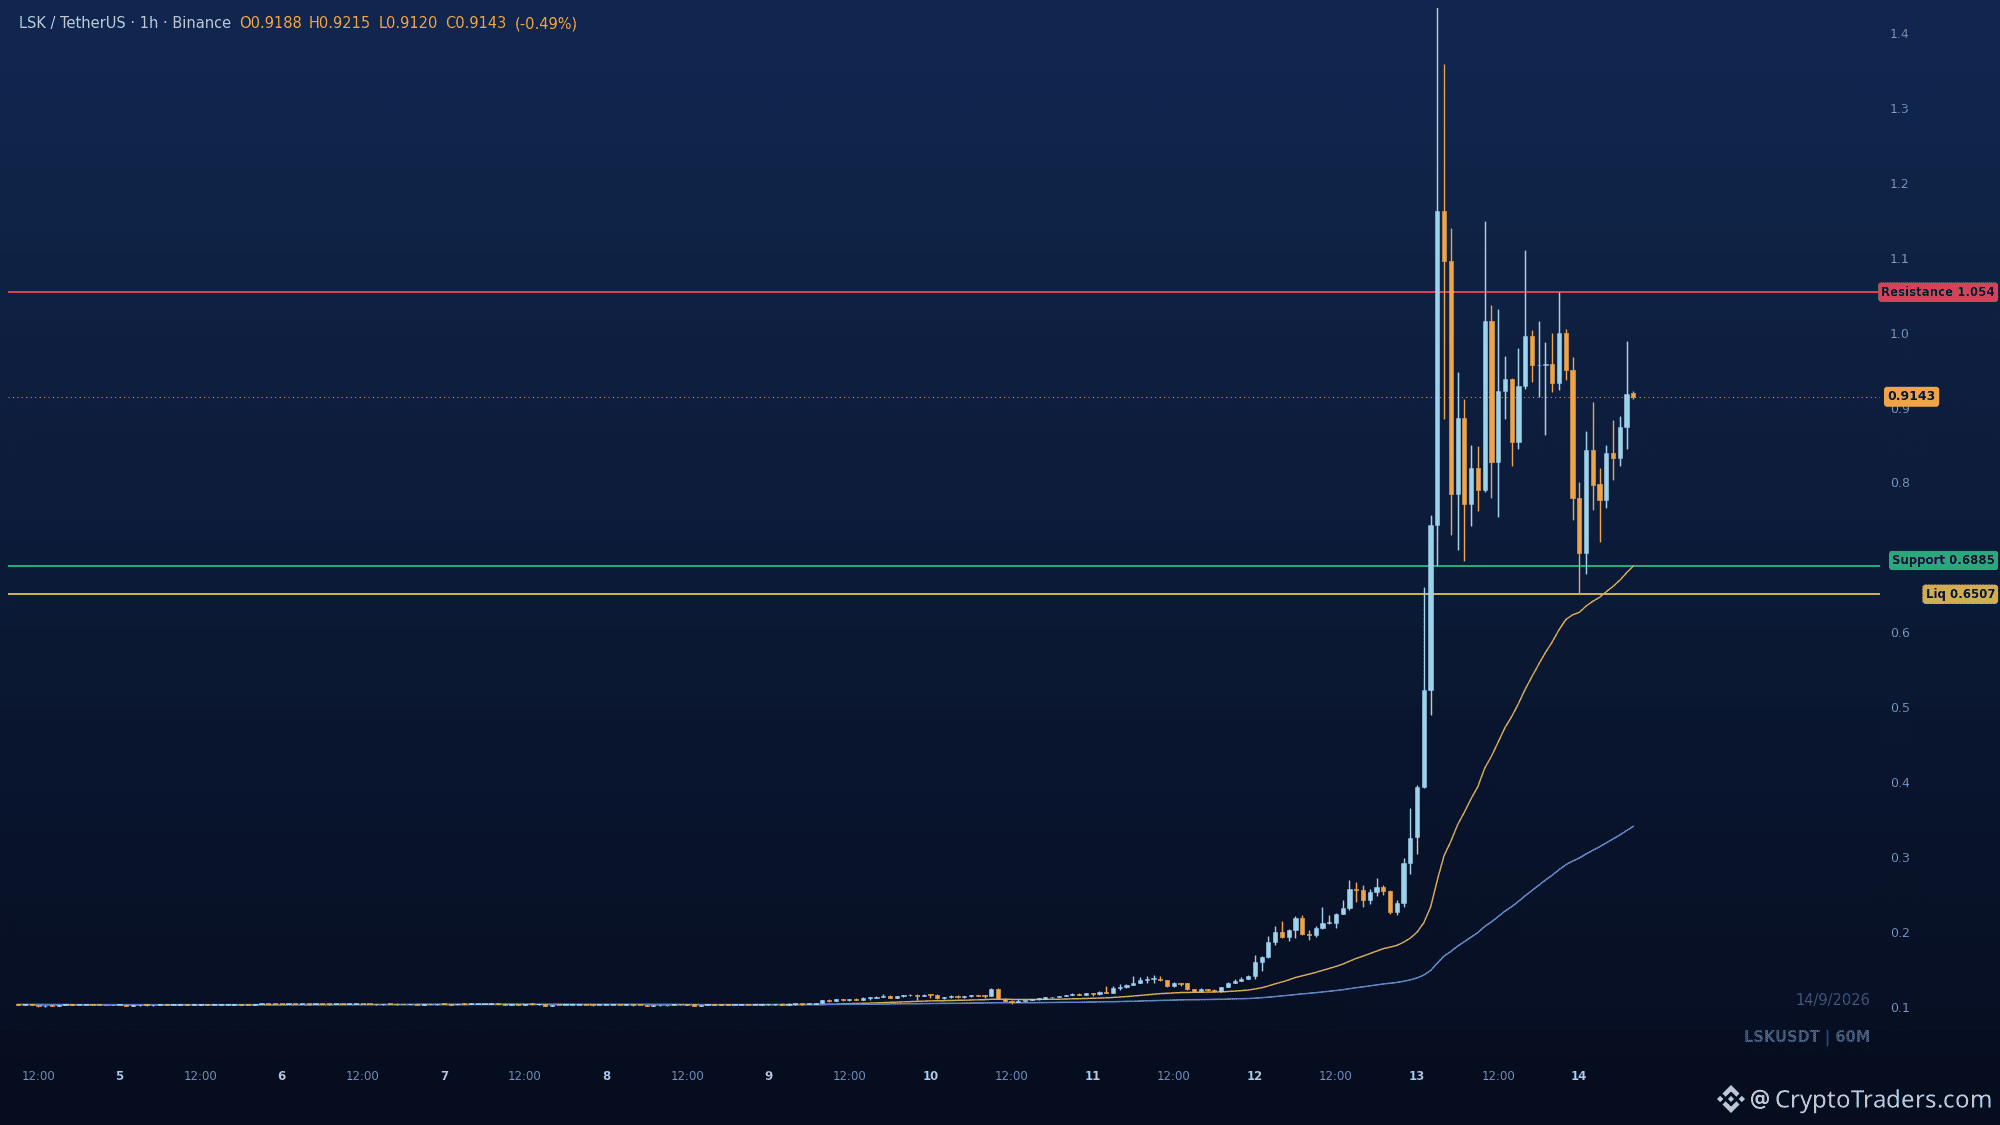
$LSK hat sich die zuvor verlorene Spanne gerade zurückgeholt, und Käufer verteidigen sie nun gegen Abschläge – nicht gegen die Hochs. Smart Money führte einen aggressiven Aufwärtsimpuls aus und ließ dann den Sweep die Sell-Side-Liquidität nahe dem jüngsten Tief mitnehmen. Diese Rückeroberung ist der Hinweis. Der nächste strukturelle Draw liegt bei 1.054, der Liquiditätssockel des vorherigen Swing-Highs. Zwischen hier und dort ist ein kontrollierter Pullback in 0.78 bis 0.69 der Basisszenario-Fall für die nächsten ein bis zwei Tage, wobei die 0.6884 EMA50 als Nachfragereferenz darunter dient. Verliere 0.65073, und die gesamte Rückeroberung ist hinfällig. Willst du den Pullback zuerst – oder läuft es bei 1.054 ohne dich weiter? Mehr davon liest sich so täglich in der Gruppe, Bio hat die Details. #Altcoin Season#
$LSK hat sich die zuvor verlorene Spanne gerade zurückgeholt, und Käufer verteidigen sie nun gegen Abschläge – nicht gegen die Hochs. Smart Money führte einen aggressiven Aufwärtsimpuls aus und ließ dann den Sweep die Sell-Side-Liquidität nahe dem jüngsten Tief mitnehmen. Diese Rückeroberung ist der Hinweis. Der nächste strukturelle Draw liegt bei 1.054, der Liquiditätssockel des vorherigen Swing-Highs. Zwischen hier und dort ist ein kontrollierter Pullback in 0.78 bis 0.69 der Basisszenario-Fall für die nächsten ein bis zwei Tage, wobei die 0.6884 EMA50 als Nachfragereferenz darunter dient. Verliere 0.65073, und die gesamte Rückeroberung ist hinfällig. Willst du den Pullback zuerst – oder läuft es bei 1.054 ohne dich weiter? Mehr davon liest sich so täglich in der Gruppe, Bio hat die Details. #Altcoin Season#
26
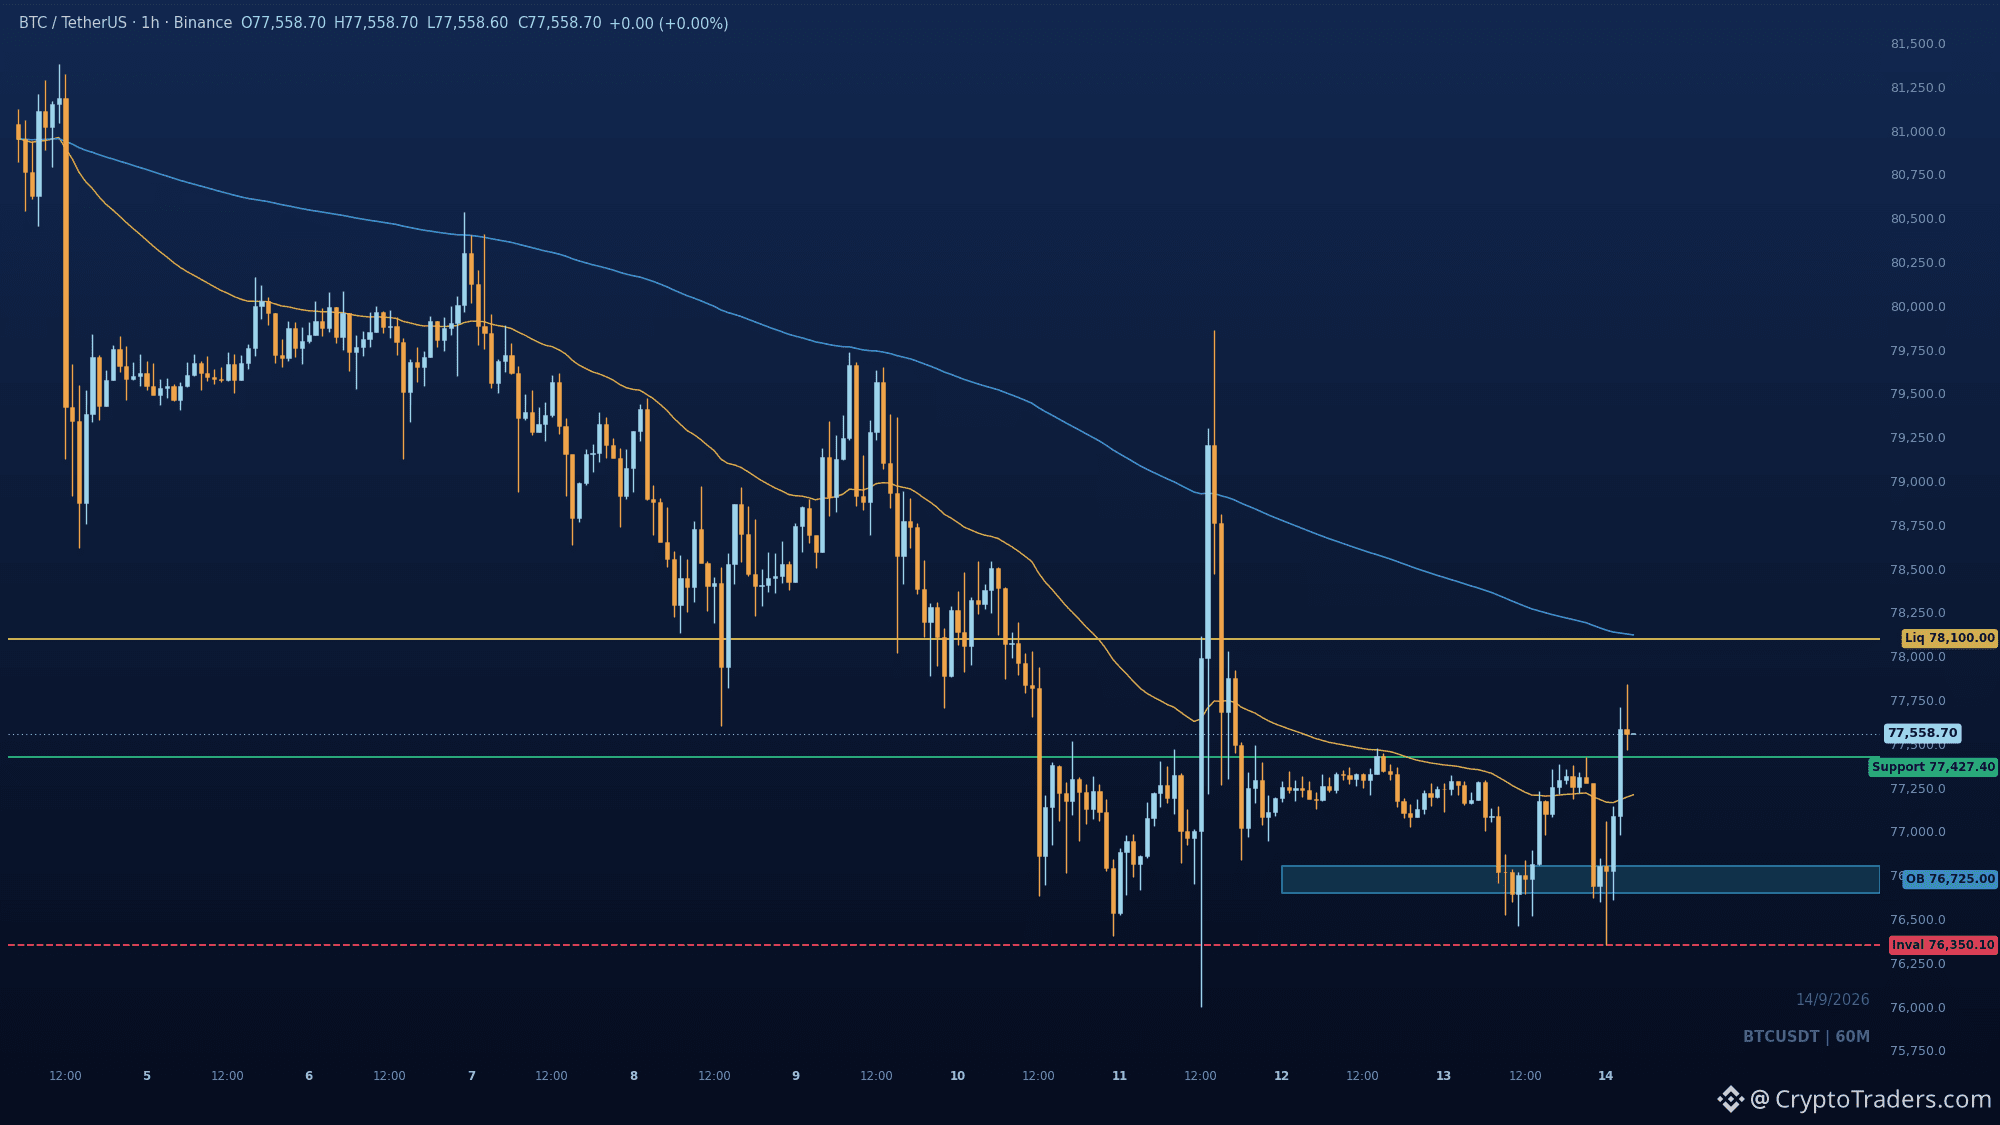
Bitcoin hält die Rückeroberung der Marke von 77.427, während ETF-Abflüsse den Bid testen. $BTC handelt derzeit nahe 77.608, ist über den Tag um 0,5% im Plus, und die aussagekräftigere Story liegt darunter: Verkäufer drängten in die Sell-Side-Liquidität bei 76.350, Käufer nahmen sie auf, und der Stundenchart drehte die Struktur wieder nach oben. Makro ist die Reibung. Die reale Rendite der 10 Jahre stieg um 14 Basispunkte auf 2,60%, obwohl das Treasury 5,19 Milliarden US-Dollar in Anleihen mit Laufzeiten von 10 bis 20 Jahren kaufte; Spot-Bitcoin-ETFs verloren netto 462,7 Millionen über den Zeitraum 8. bis 11. September. Die Unternehmensflusslage war gemischt: Metaplanet senkte die verbleibende Emission der Serie 10 um 55,5%, was BTC pro 1k effektiver verwässerter Aktien um 8,75% anhob, bei unveränderten Beständen von 43k. Der Chart: Die stündliche Struktur verschob sich; ein bullish CHoCH oberhalb von 77.427,4 zeigt sich, während der Preis weiterhin im Discount handelt. Diese gebrochene Swing-High-Marke markiert nun den ersten Support-Flip, und das Demand-Order-Block bei 76.650 bis 76.800 liegt dahinter als tieferes Bid. Fortsetzung ist die Annahme. Ein Retest von 77.427,4 bis 77.209,6, der hält, hält die zurückeroberte Struktur gültig und deutet auf 78.100 hin, wo frühere Hochs und der Overhead-Buy-Side-Pool liegen. Die Überraschung wäre ein Fehlschlag bei der Verteidigung dieser Rückeroberung: Ein Bruch von 76.350,1 entwertet den Flip und gibt die Kontrolle zurück an die Verkäufer. Worauf es ankommt: der erste Retest von 77.427,4 und ob die ETF-Flows nach der 462,7-Millionen-Ausdehnung aufhören, weiter abzuverkaufen. Reale Renditen sind die zweite wichtige Eingabe: die 10-Jahres-Rendite liegt bei 2,60%. Rektcapital sieht einen Wochenabschluss oberhalb von ungefähr 78.300 als die Linie, die verhindert, dass sich die Entwicklung aus Mai wiederholt. Wo erwartest du den Retest zuerst landen – bei 77.427 oder im 76.650-Block? Weitere Lektüre wie diese geht täglich an die Community, und das Bio zeigt dir den Weg. #BTC Price Analysis# #Bitcoin Price Prediction: Was ist Bitcoins nächster Schritt?# #Macro Insights#
Bitcoin hält die Rückeroberung der Marke von 77.427, während ETF-Abflüsse den Bid testen. $BTC handelt derzeit nahe 77.608, ist über den Tag um 0,5% im Plus, und die aussagekräftigere Story liegt darunter: Verkäufer drängten in die Sell-Side-Liquidität bei 76.350, Käufer nahmen sie auf, und der Stundenchart drehte die Struktur wieder nach oben. Makro ist die Reibung. Die reale Rendite der 10 Jahre stieg um 14 Basispunkte auf 2,60%, obwohl das Treasury 5,19 Milliarden US-Dollar in Anleihen mit Laufzeiten von 10 bis 20 Jahren kaufte; Spot-Bitcoin-ETFs verloren netto 462,7 Millionen über den Zeitraum 8. bis 11. September. Die Unternehmensflusslage war gemischt: Metaplanet senkte die verbleibende Emission der Serie 10 um 55,5%, was BTC pro 1k effektiver verwässerter Aktien um 8,75% anhob, bei unveränderten Beständen von 43k. Der Chart: Die stündliche Struktur verschob sich; ein bullish CHoCH oberhalb von 77.427,4 zeigt sich, während der Preis weiterhin im Discount handelt. Diese gebrochene Swing-High-Marke markiert nun den ersten Support-Flip, und das Demand-Order-Block bei 76.650 bis 76.800 liegt dahinter als tieferes Bid. Fortsetzung ist die Annahme. Ein Retest von 77.427,4 bis 77.209,6, der hält, hält die zurückeroberte Struktur gültig und deutet auf 78.100 hin, wo frühere Hochs und der Overhead-Buy-Side-Pool liegen. Die Überraschung wäre ein Fehlschlag bei der Verteidigung dieser Rückeroberung: Ein Bruch von 76.350,1 entwertet den Flip und gibt die Kontrolle zurück an die Verkäufer. Worauf es ankommt: der erste Retest von 77.427,4 und ob die ETF-Flows nach der 462,7-Millionen-Ausdehnung aufhören, weiter abzuverkaufen. Reale Renditen sind die zweite wichtige Eingabe: die 10-Jahres-Rendite liegt bei 2,60%. Rektcapital sieht einen Wochenabschluss oberhalb von ungefähr 78.300 als die Linie, die verhindert, dass sich die Entwicklung aus Mai wiederholt. Wo erwartest du den Retest zuerst landen – bei 77.427 oder im 76.650-Block? Weitere Lektüre wie diese geht täglich an die Community, und das Bio zeigt dir den Weg. #BTC Price Analysis# #Bitcoin Price Prediction: Was ist Bitcoins nächster Schritt?# #Macro Insights#
44
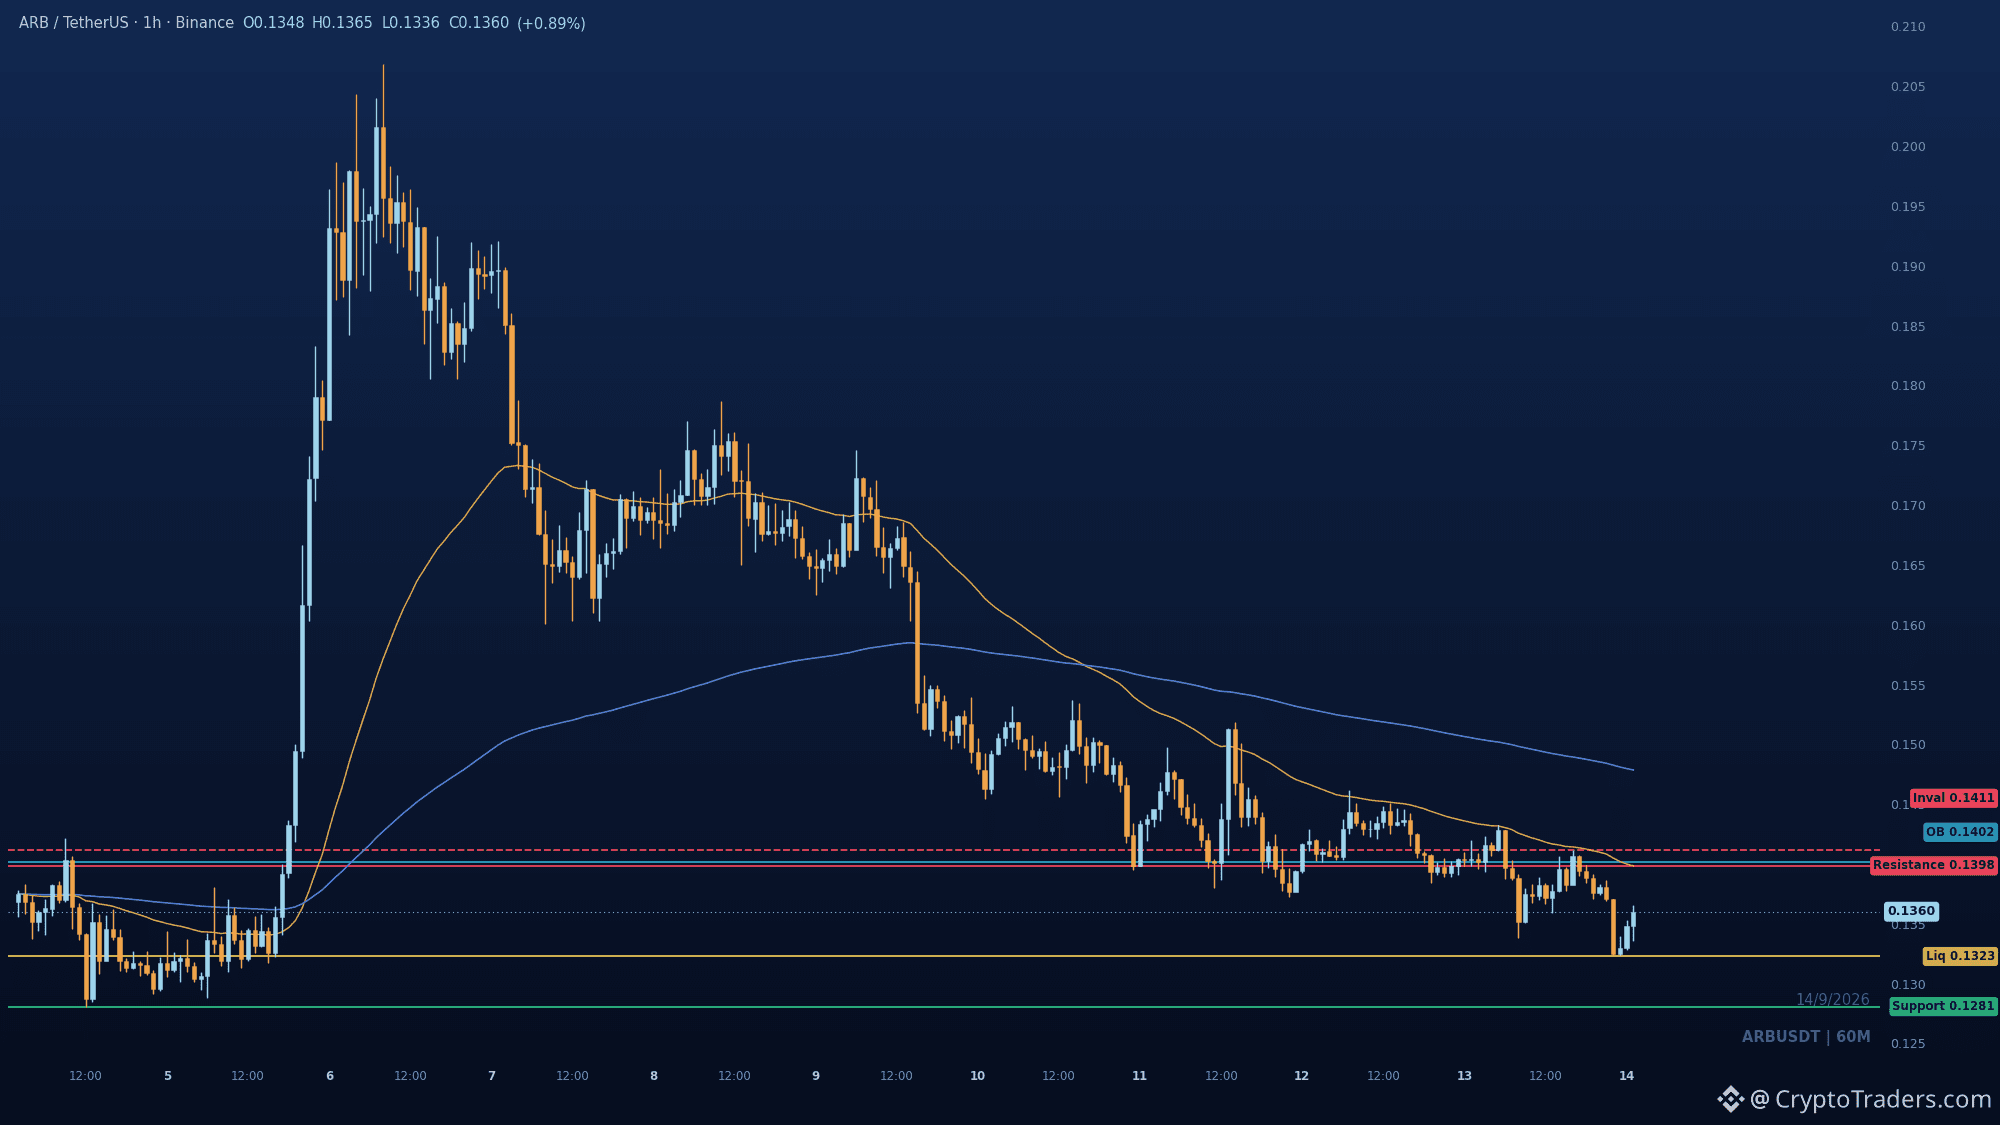
Arbitrum hat gerade ein Rekord-Dex-Volumen gedruckt, während sein Fee-Take um 84,5% einbrach – und $ARB-Inhaber bekommen trotzdem keinen automatischen Anteil daran 📉 1⃣ Gebühren fielen wie vom Boden: Arbitrum-Gebühren sanken um 84,5% auf 936.000, obwohl das DEX-Volumen einen Allzeithochwert von 2,901 Milliarden erreichte. Die Governance der Robinhood Chain erhöhte ihr Gas-Ziel und Nitro-Backlogs wurden zurückgesetzt, sodass die Aktivität stieg, während die Wertabschöpfung schrumpfte. 2⃣ Der Umsatzanteil bleibt theoretisch: Arbitrums 10% Anteil am Umsatz erfolgt ohne automatischen Ausschüttungsmechanismus an ARB-Inhaber. Rekord-Durchsatz ohne umgeleitete Auszahlung schwächt den direkten-Inhaber-Wertfall. 3⃣ Der Preis preist die Lücke ein: ARB handelt bei 0,1361, -3,1% über 24 Stunden, im Vergleich zu diesem Rekord von 2,901 Milliarden im DEX-Volumen. In der Zwischenzeit schoss LSK um 67,9% auf 153 Millionen im Quote-Volumen nach vorn – ein Hinweis darauf, wo der spekulative Flow tatsächlich hin ging. Volumen ohne Gebührenabschöpfung ist nur Aktivität, und der Markt behandelt es genau so. Was würde ARB tatsächlich neu bewerten: ein umgeleiteter Umsatzanteil oder einfach mehr Volumen? Liest sich, als ob das jeden Tag in der Gruppe landet – also schau in die Bio, wie es geht. #Altcoin Season# #Macro Insights#
Arbitrum hat gerade ein Rekord-Dex-Volumen gedruckt, während sein Fee-Take um 84,5% einbrach – und $ARB-Inhaber bekommen trotzdem keinen automatischen Anteil daran 📉 1⃣ Gebühren fielen wie vom Boden: Arbitrum-Gebühren sanken um 84,5% auf 936.000, obwohl das DEX-Volumen einen Allzeithochwert von 2,901 Milliarden erreichte. Die Governance der Robinhood Chain erhöhte ihr Gas-Ziel und Nitro-Backlogs wurden zurückgesetzt, sodass die Aktivität stieg, während die Wertabschöpfung schrumpfte. 2⃣ Der Umsatzanteil bleibt theoretisch: Arbitrums 10% Anteil am Umsatz erfolgt ohne automatischen Ausschüttungsmechanismus an ARB-Inhaber. Rekord-Durchsatz ohne umgeleitete Auszahlung schwächt den direkten-Inhaber-Wertfall. 3⃣ Der Preis preist die Lücke ein: ARB handelt bei 0,1361, -3,1% über 24 Stunden, im Vergleich zu diesem Rekord von 2,901 Milliarden im DEX-Volumen. In der Zwischenzeit schoss LSK um 67,9% auf 153 Millionen im Quote-Volumen nach vorn – ein Hinweis darauf, wo der spekulative Flow tatsächlich hin ging. Volumen ohne Gebührenabschöpfung ist nur Aktivität, und der Markt behandelt es genau so. Was würde ARB tatsächlich neu bewerten: ein umgeleiteter Umsatzanteil oder einfach mehr Volumen? Liest sich, als ob das jeden Tag in der Gruppe landet – also schau in die Bio, wie es geht. #Altcoin Season# #Macro Insights#
53
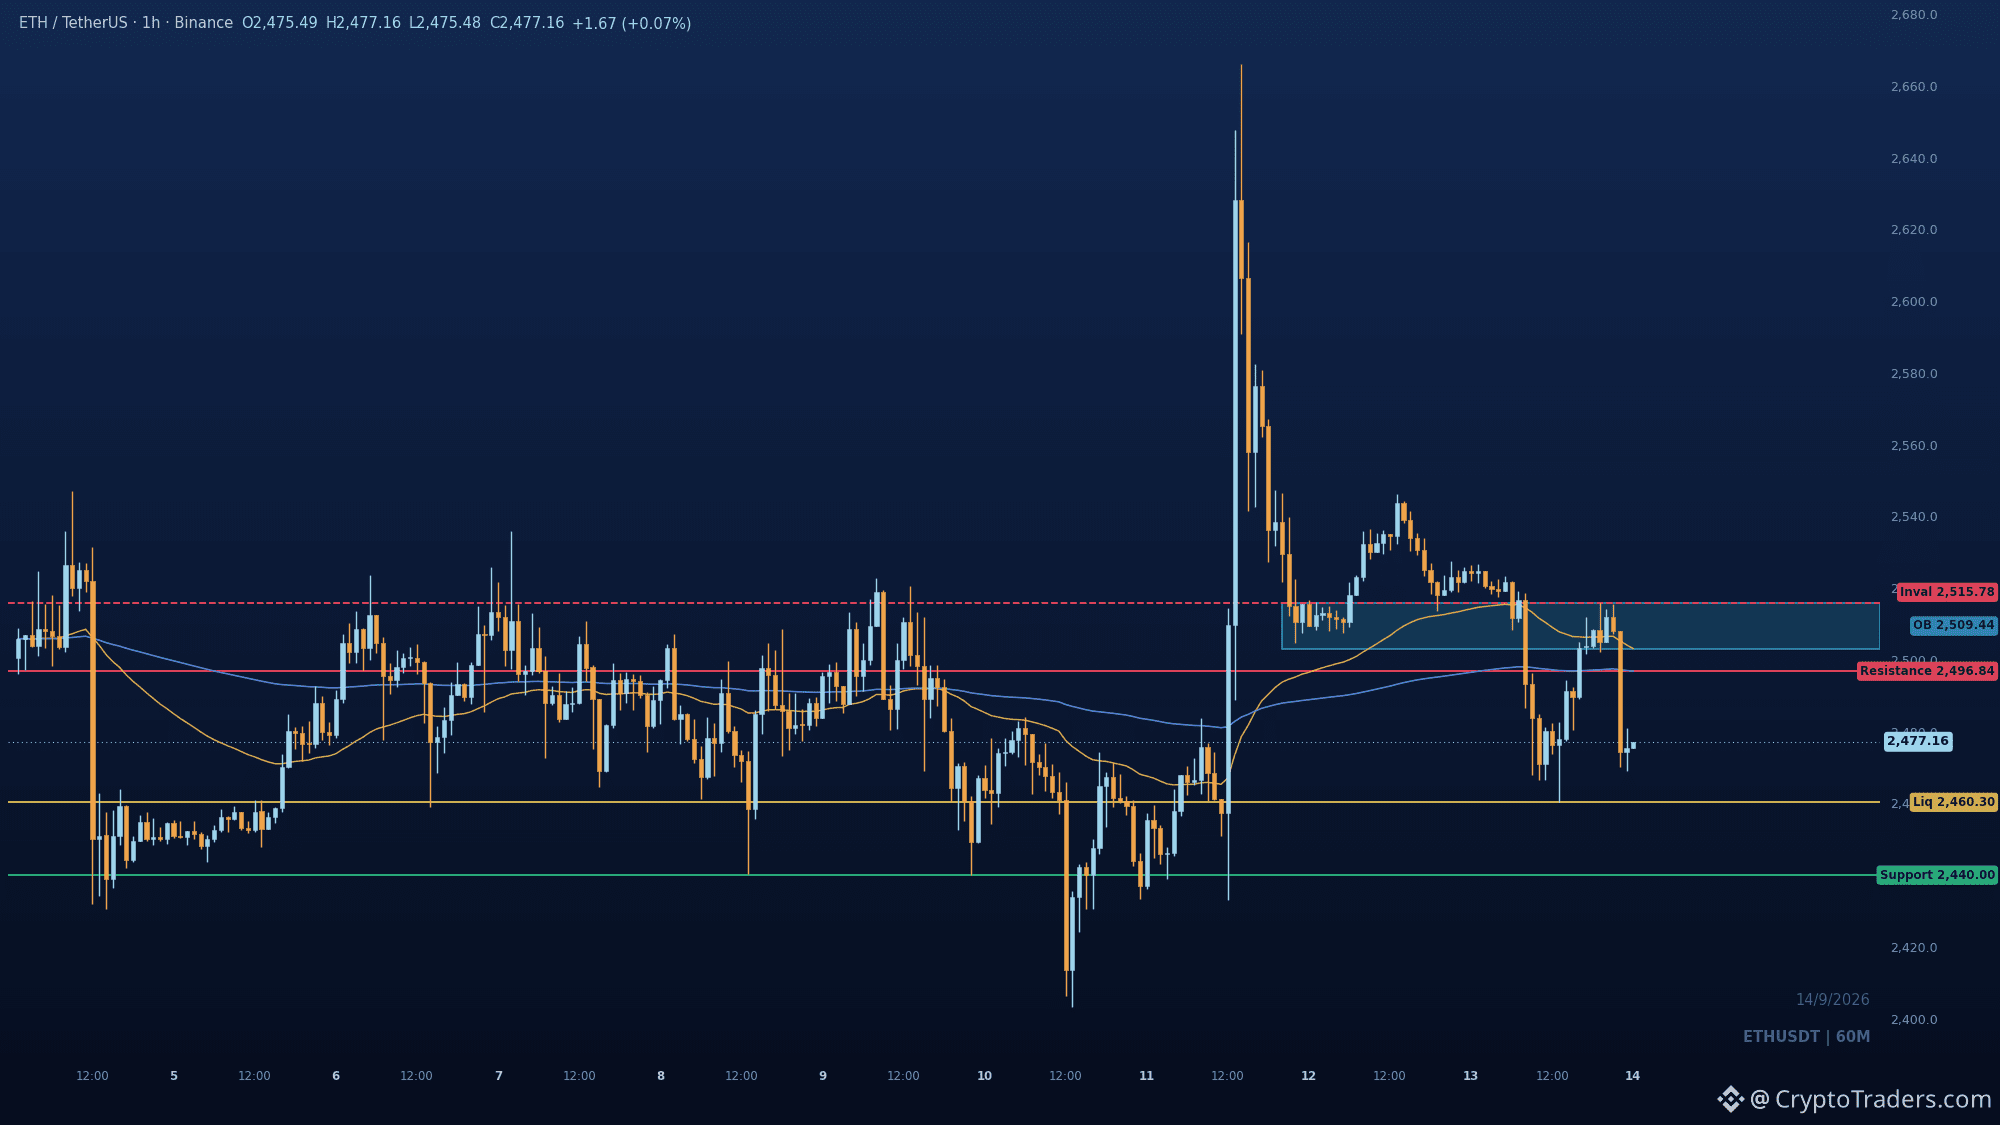
Das Ungewöhnliche an $ETH heute ist, dass Verkäufer die Kontrolle unter 2515.78 übernommen haben, während der Kurs weiterhin mit Abschlag handelt, nicht mit Aufschlag. Diese 2515.78-Abweisung hat ein bärisches CHoCH auf dem 1h erzeugt, und der EMA-Cluster bei 2496.84 begrenzt nun jeden Bounce-Versuch. Der Angebotsblock von 2503.10 bis 2515.78 ist die Zone, die man beobachten sollte. Ein Retracement in diesen Bereich würde die Spanne neu ausbalancieren, bevor sich die Sell-Side-Liquidität unter 2460.30 bemerkbar macht. Das Zurückerobern von 2515.78 invalidiert die bärische Struktur. Bis dahin ist das vorherige Reaktions-Tief bei 2440.00 das, was zählt. Hält 2460.30 als Boden, oder läuft der Sweep tiefer? Mehr Charts wie dieser landen jeden Tag in der Gruppe, bio hat den Weg hinein. #Altcoin Season#
Das Ungewöhnliche an $ETH heute ist, dass Verkäufer die Kontrolle unter 2515.78 übernommen haben, während der Kurs weiterhin mit Abschlag handelt, nicht mit Aufschlag. Diese 2515.78-Abweisung hat ein bärisches CHoCH auf dem 1h erzeugt, und der EMA-Cluster bei 2496.84 begrenzt nun jeden Bounce-Versuch. Der Angebotsblock von 2503.10 bis 2515.78 ist die Zone, die man beobachten sollte. Ein Retracement in diesen Bereich würde die Spanne neu ausbalancieren, bevor sich die Sell-Side-Liquidität unter 2460.30 bemerkbar macht. Das Zurückerobern von 2515.78 invalidiert die bärische Struktur. Bis dahin ist das vorherige Reaktions-Tief bei 2440.00 das, was zählt. Hält 2460.30 als Boden, oder läuft der Sweep tiefer? Mehr Charts wie dieser landen jeden Tag in der Gruppe, bio hat den Weg hinein. #Altcoin Season#
64
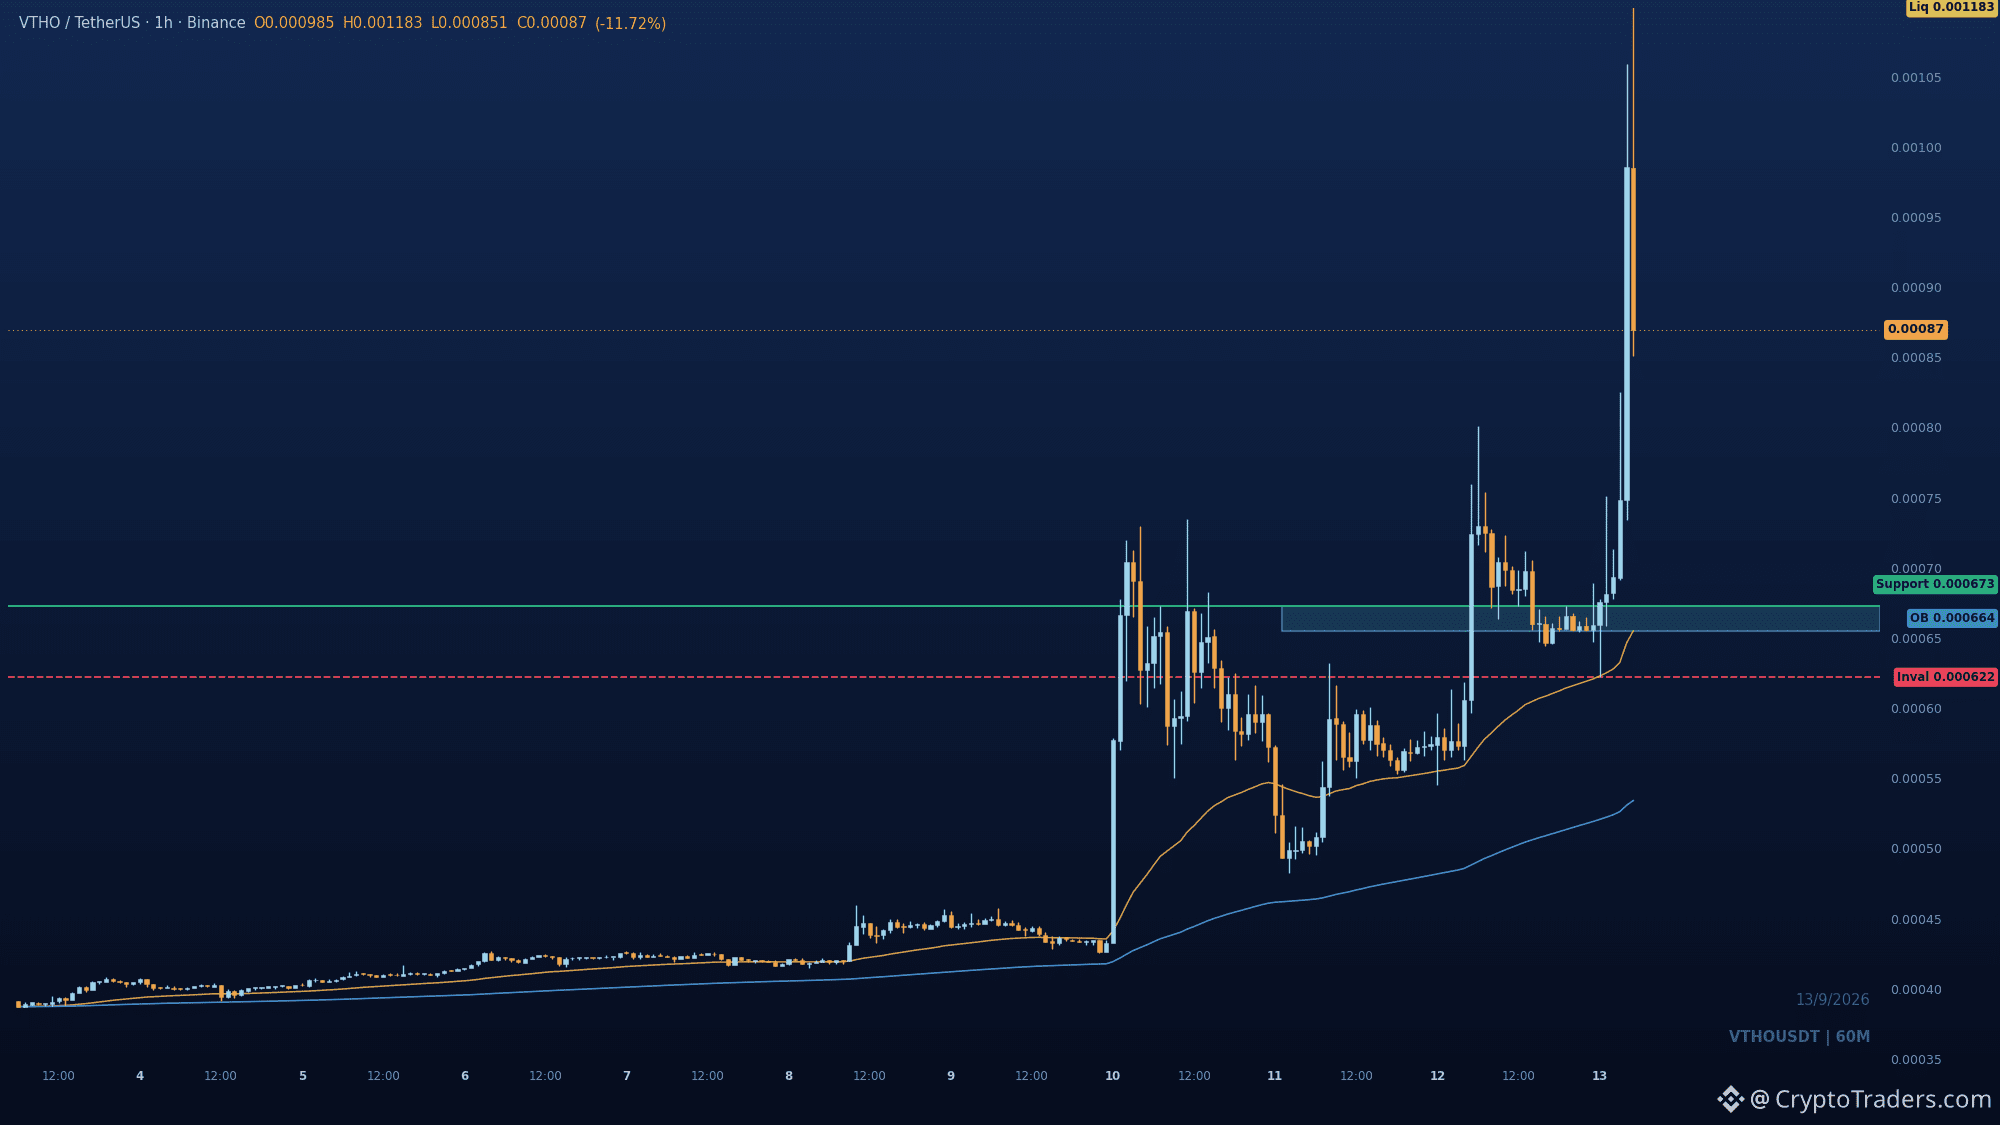
0.0006727 ist die Linie, die bestimmt, was als Nächstes auf $VTHO passiert. Der Preis ist am Tag um +20,9% gestiegen und hat dieses Swing-High mit echter Displacement durchbrochen. Daher ist die 1h-Struktur bullisch, und die obere Hälfte der Range ist genau dort, wo wir gerade sitzen. Die Bewegung, die ich erwarte: ein Pullback in den 0.0006727 bis 0.0006551 Order Block, wo die letzte Pause vor dem Impuls entstand, und dann die Fortsetzung Richtung das 0.001183 Liquidity-High. Diese Flip-Zone ist der Hinweis. Wenn man sie hält, bleibt die Sequenz intakt; das Verlieren von 0.000622 bricht die bullische Struktur und stellt die gesamte Bewegung in Frage. Wartest du auf den Retest oder jagst du der Kerze hinterher? Mehr Lesestoff wie dieser landet täglich in der Gruppe, in meiner Bio steht der Weg rein. #Altcoin Season#
0.0006727 ist die Linie, die bestimmt, was als Nächstes auf $VTHO passiert. Der Preis ist am Tag um +20,9% gestiegen und hat dieses Swing-High mit echter Displacement durchbrochen. Daher ist die 1h-Struktur bullisch, und die obere Hälfte der Range ist genau dort, wo wir gerade sitzen. Die Bewegung, die ich erwarte: ein Pullback in den 0.0006727 bis 0.0006551 Order Block, wo die letzte Pause vor dem Impuls entstand, und dann die Fortsetzung Richtung das 0.001183 Liquidity-High. Diese Flip-Zone ist der Hinweis. Wenn man sie hält, bleibt die Sequenz intakt; das Verlieren von 0.000622 bricht die bullische Struktur und stellt die gesamte Bewegung in Frage. Wartest du auf den Retest oder jagst du der Kerze hinterher? Mehr Lesestoff wie dieser landet täglich in der Gruppe, in meiner Bio steht der Weg rein. #Altcoin Season#
38
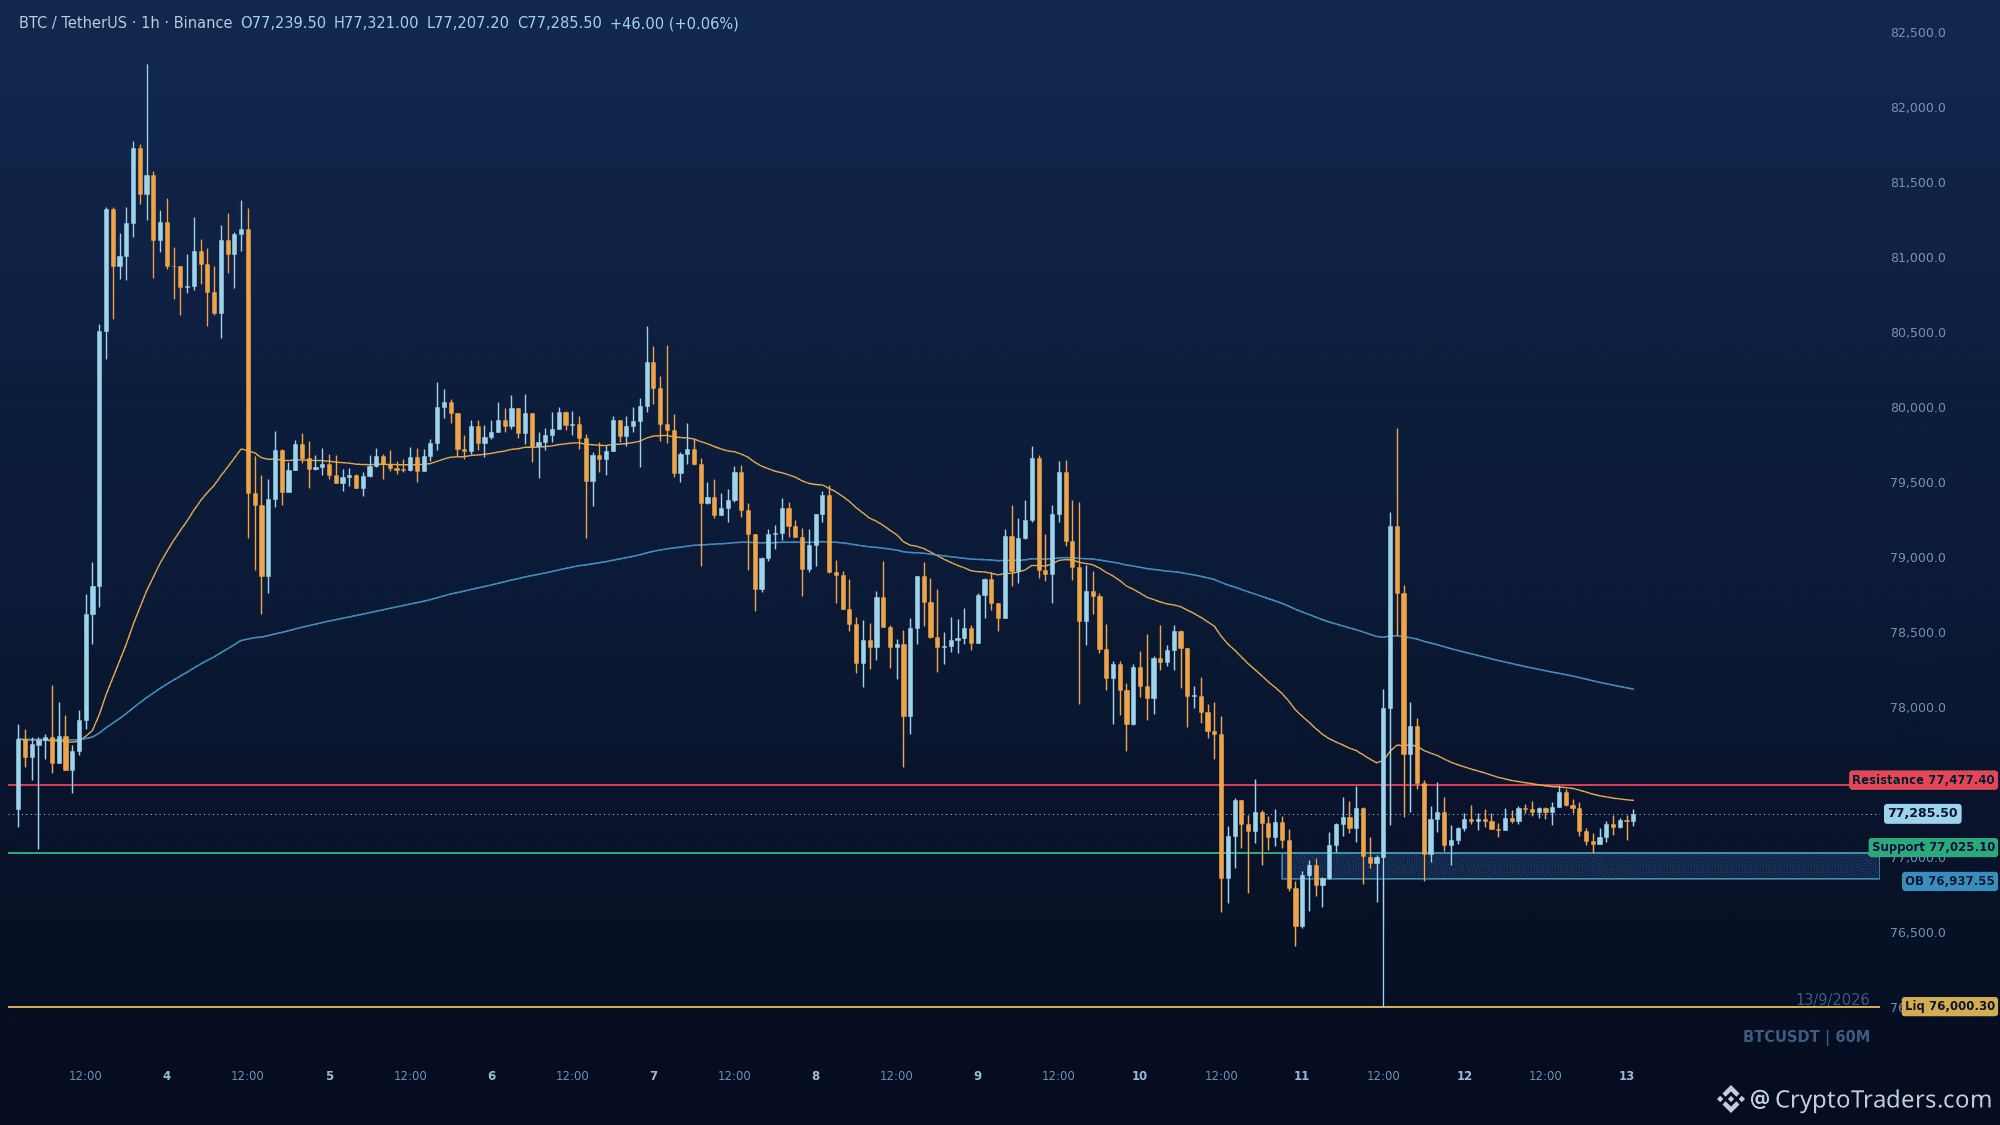
L-BTC-Unterstützung bleibt bei 85,76% hängen, während $BTC bei 77.320 🧭 1⃣ Weiterhin Wrapped-BTC-Defizit: Liquid's L-BTC-Deckung liegt weiterhin bei etwa 85,76%, ohne Peg-Outs und ohne Aussicht auf eine vollständige Wiederherstellung der Reserven. Neue Peg-Ins tilgen das bestehende Defizit nicht, sodass das Instrument weiterhin dem Risiko von Rücknahmen und Vertrauensverlust ausgesetzt ist. 2⃣ ETH-ETFs leiden, Renditen drücken: Spot-ETH-ETFs verzeichneten in drei Sitzungen 19,5 Millionen US-Dollar an Nettoabflüssen, während Treasury-Renditen zusätzlichen Druck aufbauten. ETH braucht einen wöchentlichen Schlusskurs über 2.550, um die Ausgangslage zu reparieren; unter 2.400 verstärkt sich das Abwärtsrisiko. 3⃣ Tokenisierte Equity-Modelle wackeln: Der am AMC geknüpfte Token verzeichnete einen Anstieg der Angebotsmenge um 25,69x, gefolgt von einer Kontraktion um 35,85%, wobei SEC-Vorgaben für Emittenten-Zustimmung ein Ausfall-/Stopp-Risiko nahelegen. OnDos Plattform zeigt 831,7 Millionen an ausgeschüttetem Wert, doch ONDO-Inhaber haben keine vertragliche Anspruchsbasis auf Sicherheiten oder Gebühren. Deckungslücken und Abflussdruck bestimmen weiterhin dieses Kursgeschehen – selbst wenn die großen Coins seitwärts laufen. Welche dieser drei Strukturen macht dir am meisten Sorgen in Richtung der nächsten Woche? Liest sich so, als würde das jeden Tag in der Community landen, das Bio zeigt den Weg. #BTC Price Analysis# #Bitcoin Price Prediction: What is Bitcoins next move?# #Macro Insights#
L-BTC-Unterstützung bleibt bei 85,76% hängen, während $BTC bei 77.320 🧭 1⃣ Weiterhin Wrapped-BTC-Defizit: Liquid's L-BTC-Deckung liegt weiterhin bei etwa 85,76%, ohne Peg-Outs und ohne Aussicht auf eine vollständige Wiederherstellung der Reserven. Neue Peg-Ins tilgen das bestehende Defizit nicht, sodass das Instrument weiterhin dem Risiko von Rücknahmen und Vertrauensverlust ausgesetzt ist. 2⃣ ETH-ETFs leiden, Renditen drücken: Spot-ETH-ETFs verzeichneten in drei Sitzungen 19,5 Millionen US-Dollar an Nettoabflüssen, während Treasury-Renditen zusätzlichen Druck aufbauten. ETH braucht einen wöchentlichen Schlusskurs über 2.550, um die Ausgangslage zu reparieren; unter 2.400 verstärkt sich das Abwärtsrisiko. 3⃣ Tokenisierte Equity-Modelle wackeln: Der am AMC geknüpfte Token verzeichnete einen Anstieg der Angebotsmenge um 25,69x, gefolgt von einer Kontraktion um 35,85%, wobei SEC-Vorgaben für Emittenten-Zustimmung ein Ausfall-/Stopp-Risiko nahelegen. OnDos Plattform zeigt 831,7 Millionen an ausgeschüttetem Wert, doch ONDO-Inhaber haben keine vertragliche Anspruchsbasis auf Sicherheiten oder Gebühren. Deckungslücken und Abflussdruck bestimmen weiterhin dieses Kursgeschehen – selbst wenn die großen Coins seitwärts laufen. Welche dieser drei Strukturen macht dir am meisten Sorgen in Richtung der nächsten Woche? Liest sich so, als würde das jeden Tag in der Community landen, das Bio zeigt den Weg. #BTC Price Analysis# #Bitcoin Price Prediction: What is Bitcoins next move?# #Macro Insights#
47
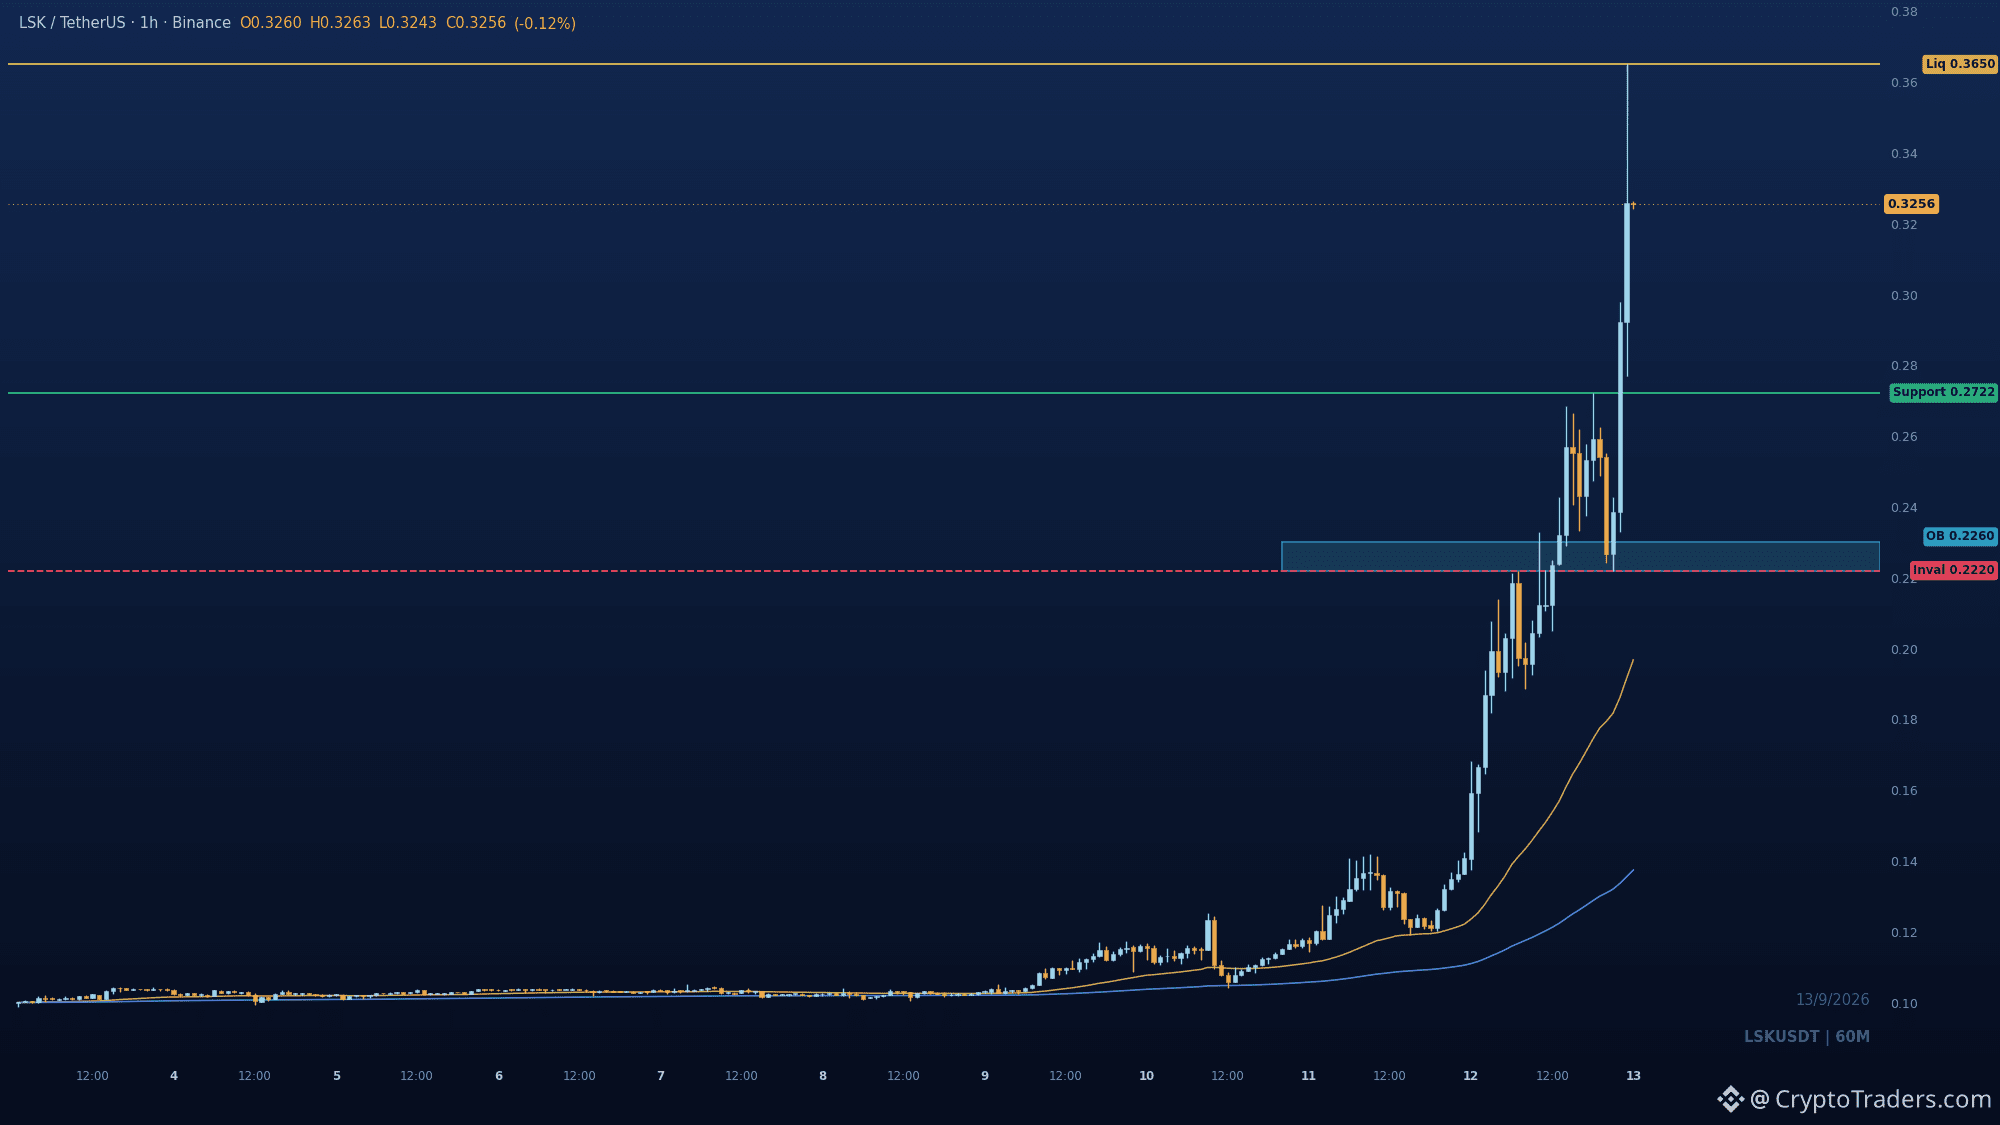
Die +136%-Kerze bei $LSK ist nicht die Geschichte, als die sie jeder denkt: Der Docht hat bereits 0.365 getestet und damit der Kaufseite ihre Liquidität gegeben. Die Struktur ist weiterhin bullisch: Konsekutives BOS über 0.27219 hält den Kurs in der Entdeckung, und Smart Money hat die Tiefs geladen, bevor es zur Displacement kam. Was ich tatsächlich erwarte, ist ein Retrace auf 0.27219 – das gebrochene Swing-High, das zu Support werden sollte – mit dem Demand-Block von 0.22202 bis 0.23000 als tieferer „Shelf“. Dass Käufer diese erste Zone verteidigen, bestätigt die Fortsetzung. Verliert man 0.22202, ist die gesamte Bewegung ungültig. Wo soll der Pullback enden, bevor du die nächste Etappe für vertrauenswürdig hältst? Klingt, als würde dieses Land täglich in der Community gelesen; in meinem Bio steht der Rest. #Altcoin Season#
Die +136%-Kerze bei $LSK ist nicht die Geschichte, als die sie jeder denkt: Der Docht hat bereits 0.365 getestet und damit der Kaufseite ihre Liquidität gegeben. Die Struktur ist weiterhin bullisch: Konsekutives BOS über 0.27219 hält den Kurs in der Entdeckung, und Smart Money hat die Tiefs geladen, bevor es zur Displacement kam. Was ich tatsächlich erwarte, ist ein Retrace auf 0.27219 – das gebrochene Swing-High, das zu Support werden sollte – mit dem Demand-Block von 0.22202 bis 0.23000 als tieferer „Shelf“. Dass Käufer diese erste Zone verteidigen, bestätigt die Fortsetzung. Verliert man 0.22202, ist die gesamte Bewegung ungültig. Wo soll der Pullback enden, bevor du die nächste Etappe für vertrauenswürdig hältst? Klingt, als würde dieses Land täglich in der Community gelesen; in meinem Bio steht der Rest. #Altcoin Season#
66
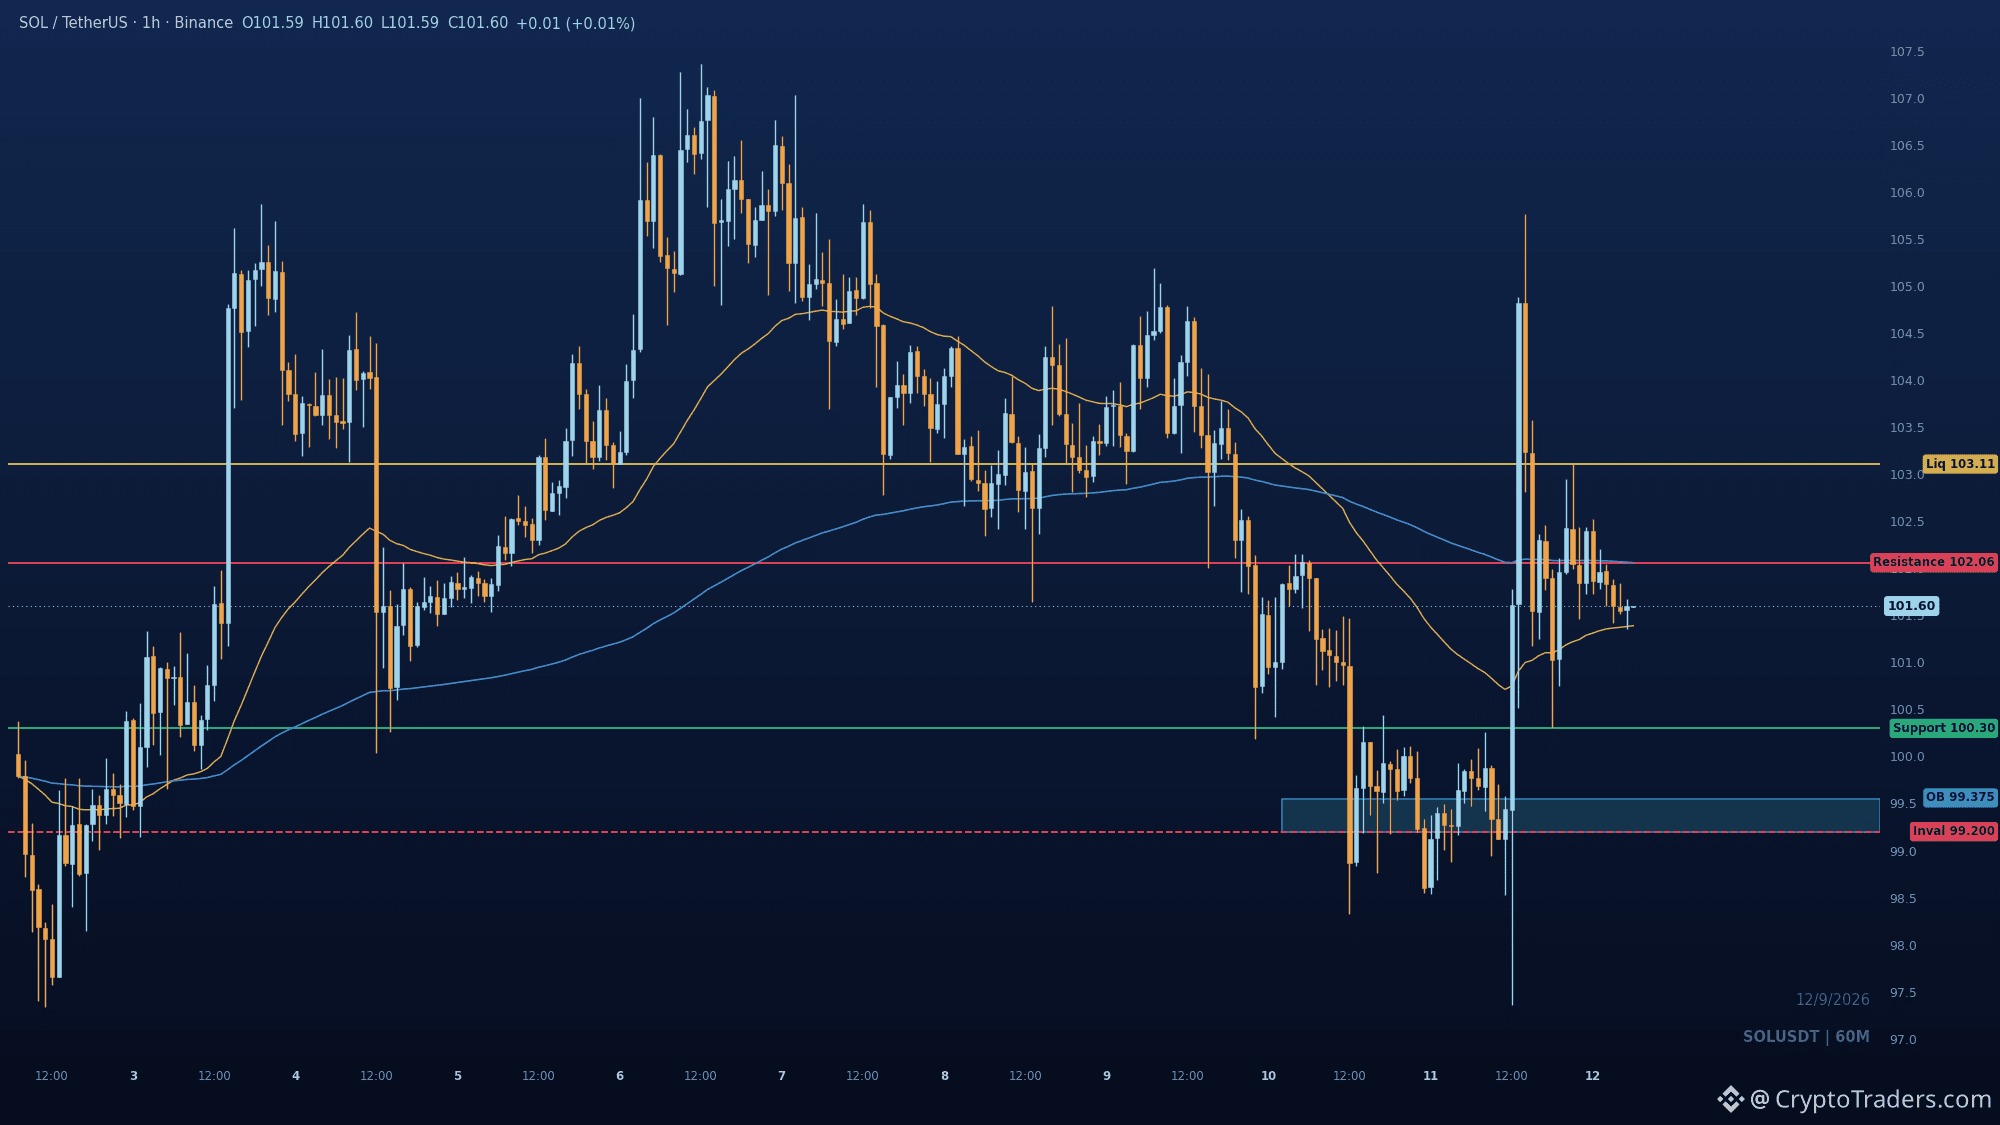
$SOL hat einen Standoff bei 100.30, und der Markt muss sich vor dem nächsten Bewegungsschritt entscheiden: 1h-gesweepte Sell-Side-Liquidität bei 97.34, dann nach oben verdrängt und 100.30 zurückerobert. Ein bullischer CHoCH, wobei der Preis noch im Discount der Range von 100.30 bis 99.55 liegt – das ist die Nachfrage-Sperre, die es zu beobachten gilt. Eine Verteidigung dort bereitet 102.06 an der 200 EMA vor, dann 103.11, wo die Buy-Side-Liquidität liegt. Verliere 99.2, und die Erholungsstruktur ist hinfällig – es öffnet sich ein Retest des Sweep-Lows. Gib ihm ein paar Stunden in der nächsten Session, bevor sich das auflöst. Behandelst du 100.30 als Support oder als den ersten Riss im Bounce? Mehr Charts wie diese landen täglich in der Gruppe – bio hat den Weg in #Altcoin Season#
$SOL hat einen Standoff bei 100.30, und der Markt muss sich vor dem nächsten Bewegungsschritt entscheiden: 1h-gesweepte Sell-Side-Liquidität bei 97.34, dann nach oben verdrängt und 100.30 zurückerobert. Ein bullischer CHoCH, wobei der Preis noch im Discount der Range von 100.30 bis 99.55 liegt – das ist die Nachfrage-Sperre, die es zu beobachten gilt. Eine Verteidigung dort bereitet 102.06 an der 200 EMA vor, dann 103.11, wo die Buy-Side-Liquidität liegt. Verliere 99.2, und die Erholungsstruktur ist hinfällig – es öffnet sich ein Retest des Sweep-Lows. Gib ihm ein paar Stunden in der nächsten Session, bevor sich das auflöst. Behandelst du 100.30 als Support oder als den ersten Riss im Bounce? Mehr Charts wie diese landen täglich in der Gruppe – bio hat den Weg in #Altcoin Season#
55
Jeder liest sich das +3,2% auf $ETH als Ausbruch durch, aber der 1h-Sweep hat 2666 abgeholt und stattdessen einen bärischen CHoCH ausgedruckt. Dieses Hoch bei 2666 war gekaufte Buy-Side-Liquidität, nicht Stärke. Die Displacement kam direkt danach. Jetzt steht der Preis bei 2516, mit dem 2496,74 EMA-Pullback-Support als erstem echten Test. Hält das, dann wird der Sweep absorbiert; verliert man es, dann ist als Nächstes 2474,75 da, mit darunter aufgedeckter Sell-Side-Liquidität bei 2433,04. 2560 ist die Linie, die das bärische Bild kippt. Glaubst du, dass 2496 bei diesem Retrace hält? Ich poste jeden Tag Charts wie diesen in die Gruppe, Bio hat den Weg rein. #Altcoin Season#
Jeder liest sich das +3,2% auf $ETH als Ausbruch durch, aber der 1h-Sweep hat 2666 abgeholt und stattdessen einen bärischen CHoCH ausgedruckt. Dieses Hoch bei 2666 war gekaufte Buy-Side-Liquidität, nicht Stärke. Die Displacement kam direkt danach. Jetzt steht der Preis bei 2516, mit dem 2496,74 EMA-Pullback-Support als erstem echten Test. Hält das, dann wird der Sweep absorbiert; verliert man es, dann ist als Nächstes 2474,75 da, mit darunter aufgedeckter Sell-Side-Liquidität bei 2433,04. 2560 ist die Linie, die das bärische Bild kippt. Glaubst du, dass 2496 bei diesem Retrace hält? Ich poste jeden Tag Charts wie diesen in die Gruppe, Bio hat den Weg rein. #Altcoin Season#

62
$ZEC Entweder reclaims 1143.1 und wandelt es wieder in Support um, oder dass das gebrochene Swing-Low den Bounce kappt und den Kurs zurück Richtung 1082.0 schickt. Ich tendiere zur zweiten Variante. Die 1h hat ein bearish CHoCH unter 1143.1 gedruckt, nachdem Smart Money nahe dem Hoch bei 1297.5 verteilt hat, daher wirkt der aktuelle Rebound wie ein Retrace in über dem Kopf liegende Angebotszonen und nicht wie ein frischer Impuls. Der Orderblock bei 1218 bis 1232 ist die letzte bullische Kerze vor dem Selloff und liegt darüber als stärkere Resistance. Unten ist die Demand-Zone bei 1068 bis 1082 das, was den Rebound gehalten hat, während Sell-Side-Liquidität immer noch bei 1053.79 ruht. Die Invalidation ist sauber: Ein Push durch 1157.28 dreht dieses Setup, und dann übernimmt das Reclaim-Szenario. Behandelst du diesen Bounce als Retrace oder als den Start von etwas Größerem? Mehr Charts wie diesen gehen täglich in die Gruppe, bio hat den Weg rein. #Altcoin Season#
$ZEC Entweder reclaims 1143.1 und wandelt es wieder in Support um, oder dass das gebrochene Swing-Low den Bounce kappt und den Kurs zurück Richtung 1082.0 schickt. Ich tendiere zur zweiten Variante. Die 1h hat ein bearish CHoCH unter 1143.1 gedruckt, nachdem Smart Money nahe dem Hoch bei 1297.5 verteilt hat, daher wirkt der aktuelle Rebound wie ein Retrace in über dem Kopf liegende Angebotszonen und nicht wie ein frischer Impuls. Der Orderblock bei 1218 bis 1232 ist die letzte bullische Kerze vor dem Selloff und liegt darüber als stärkere Resistance. Unten ist die Demand-Zone bei 1068 bis 1082 das, was den Rebound gehalten hat, während Sell-Side-Liquidität immer noch bei 1053.79 ruht. Die Invalidation ist sauber: Ein Push durch 1157.28 dreht dieses Setup, und dann übernimmt das Reclaim-Szenario. Behandelst du diesen Bounce als Retrace oder als den Start von etwas Größerem? Mehr Charts wie diesen gehen täglich in die Gruppe, bio hat den Weg rein. #Altcoin Season#

25
Kann $BTC 77.700 halten oder entscheidet die Breaker-Zone bei 80.500 die nächste Etappe? Der Preis drückt nach dem Rückgang in den markierten Demand-Bereich, und genau hier müssen die Käufer auftauchen. Darüber, bei 80.500, liegt der Breaker, der den letzten Push begrenzte, mit 81.600 als Upside-Projektion, falls er zurückerobert wird. Unten, wenn 76.200 verloren geht, öffnet sich das starke Tief und macht jede Bounce-Struktur ungültig. Also welche Seite gibt zuerst nach: die Demand-Shelf oder der Breaker oberhalb? Mehr solche Breakdowns landen jeden Tag in der Gruppe, Bio hat den Weg rein. #BTC Preisanalyse# #Bitcoin Preisvorhersage: Was ist Bitcoins nächster Move?#
Kann $BTC 77.700 halten oder entscheidet die Breaker-Zone bei 80.500 die nächste Etappe? Der Preis drückt nach dem Rückgang in den markierten Demand-Bereich, und genau hier müssen die Käufer auftauchen. Darüber, bei 80.500, liegt der Breaker, der den letzten Push begrenzte, mit 81.600 als Upside-Projektion, falls er zurückerobert wird. Unten, wenn 76.200 verloren geht, öffnet sich das starke Tief und macht jede Bounce-Struktur ungültig. Also welche Seite gibt zuerst nach: die Demand-Shelf oder der Breaker oberhalb? Mehr solche Breakdowns landen jeden Tag in der Gruppe, Bio hat den Weg rein. #BTC Preisanalyse# #Bitcoin Preisvorhersage: Was ist Bitcoins nächster Move?#

36
Solana rutscht unter 100, da sich die Sell-Side-Liquidität bei 98,54 in den Fokus schiebt Solana wird bei 99,32 gehandelt, fällt am Tag um 2,5%, und der $SOL-Chart hat gerade den 100,11-Swing zurückgegeben, der in der letzten Phase der Konsolidierung standhielt. Was treibt es an: Keine einzelne Schlagzeile erklärt die Bewegung. PumpFun hat tokenisierte Aktien als Paarungs-Assets für Token-Launches ergänzt und geht damit über SOL und USDC hinaus – eine strukturelle Veränderung für eine Chain, bei der Launch-Aktivität eine konstante Nachfragequelle ist. Die Aufmerksamkeit von Crypto Twitter über die letzten 24 Stunden konzentriert sich auf BTC und ETH, plus ETF-Flow- und Funding-Gewusel; SOL verzeichnete nur eine Nennung unter den Top-Themen. Der Chart: Smart Money verteilte sich vom 104- bis 107-Premium und trieb anschließend eine bärische Ausweitung unter 100,11 an, wo der Preis jetzt im Abschlag konsolidiert. Die 1-Stunden-Lesart deutet auf eine Rückkehr in das über dem Kurs liegende Angebot bei 100,11 bis 101,14 hin, bevor die Fortsetzungskurse 98,54 und danach 97,34 ansteuern – das Tagestief. Die Invalidierung liegt bei 101,35, dem bärischen Order-Block, der die Verdrängung auslöste. Zwei mögliche Szenarien. Wenn der Rückprall in das Angebot verkauft wird, werden Short-Positionen weiter bequem bezahlt, und 98,54 ist der Bereich, in den dieser Flow hineinfällt. Wenn dagegen 101,35 zurückerobert und gehalten wird, ist das Scheitern eher eine Verschiebung, wer zahlt, statt ein Ende: Das Angebot von 101,10 bis 101,35 stoppt das Absorbieren, und die Trader, die dem Break nach unten hinterherliefen, werden zur Exit-Liquidität für die Umkehr. Worauf zu achten ist: Ob ein Push in 100,11 bis 101,14 bei abnehmendem Volumen eintrifft – das hält die bärische Lesart intakt – und ob 98,54 sauber gehandelt wird oder nur mit Wicks durchschneidet. Funding- und Leverage-Gewusel lohnt sich zu beobachten, falls 101,35 bricht, denn überfüllte Shorts sind der Treibstoff für diese Rückeroberung. Möchtest du zuerst sehen, wie 98,54 leergekauft wird, oder zuerst, wie 101,35 zurückerobert wird? Mehr solcher Reads gehen täglich an die Gruppe raus – im Bio steht der Weg hinein. #Altcoin Season# #Macro Insights#
Solana rutscht unter 100, da sich die Sell-Side-Liquidität bei 98,54 in den Fokus schiebt Solana wird bei 99,32 gehandelt, fällt am Tag um 2,5%, und der $SOL-Chart hat gerade den 100,11-Swing zurückgegeben, der in der letzten Phase der Konsolidierung standhielt. Was treibt es an: Keine einzelne Schlagzeile erklärt die Bewegung. PumpFun hat tokenisierte Aktien als Paarungs-Assets für Token-Launches ergänzt und geht damit über SOL und USDC hinaus – eine strukturelle Veränderung für eine Chain, bei der Launch-Aktivität eine konstante Nachfragequelle ist. Die Aufmerksamkeit von Crypto Twitter über die letzten 24 Stunden konzentriert sich auf BTC und ETH, plus ETF-Flow- und Funding-Gewusel; SOL verzeichnete nur eine Nennung unter den Top-Themen. Der Chart: Smart Money verteilte sich vom 104- bis 107-Premium und trieb anschließend eine bärische Ausweitung unter 100,11 an, wo der Preis jetzt im Abschlag konsolidiert. Die 1-Stunden-Lesart deutet auf eine Rückkehr in das über dem Kurs liegende Angebot bei 100,11 bis 101,14 hin, bevor die Fortsetzungskurse 98,54 und danach 97,34 ansteuern – das Tagestief. Die Invalidierung liegt bei 101,35, dem bärischen Order-Block, der die Verdrängung auslöste. Zwei mögliche Szenarien. Wenn der Rückprall in das Angebot verkauft wird, werden Short-Positionen weiter bequem bezahlt, und 98,54 ist der Bereich, in den dieser Flow hineinfällt. Wenn dagegen 101,35 zurückerobert und gehalten wird, ist das Scheitern eher eine Verschiebung, wer zahlt, statt ein Ende: Das Angebot von 101,10 bis 101,35 stoppt das Absorbieren, und die Trader, die dem Break nach unten hinterherliefen, werden zur Exit-Liquidität für die Umkehr. Worauf zu achten ist: Ob ein Push in 100,11 bis 101,14 bei abnehmendem Volumen eintrifft – das hält die bärische Lesart intakt – und ob 98,54 sauber gehandelt wird oder nur mit Wicks durchschneidet. Funding- und Leverage-Gewusel lohnt sich zu beobachten, falls 101,35 bricht, denn überfüllte Shorts sind der Treibstoff für diese Rückeroberung. Möchtest du zuerst sehen, wie 98,54 leergekauft wird, oder zuerst, wie 101,35 zurückerobert wird? Mehr solcher Reads gehen täglich an die Gruppe raus – im Bio steht der Weg hinein. #Altcoin Season# #Macro Insights#

47
Anmelden und weiter Inhalte entdecken
Krypto-Nutzer weltweit auf Binance Square kennenlernen
⚡️ Bleib in Sachen Krypto stets am Puls.
💬 Die weltgrößte Kryptobörse vertraut darauf.
👍 Erhalte verlässliche Einblicke von verifizierten Creators.
E-Mail-Adresse/Telefonnummer
Trendthemen
FedRateWatch
1.1M Aufrufe
5,025 Kommentare
Teile & gewinne Traffic-Belohnungen in unserer Kampagne mit angesagtem Hashtag
✨Thema: FOMC September, Was ist der nächste Schritt der Fed?
👉So nimmst du teil:
Veröffentliche einen kurzen Beitrag oder Artikel mit dem Hashtag #FedRateWatch
Erstelle Inhalte basierend auf den folgenden Blickwinkeln:
- Der August-Core-CPI stieg um 0,3% im Monatsvergleich, und die Wahrscheinlichkeit für eine 25bp-Erhöhung diese Woche liegt nun bei fast 90%. Erwartest du diese Woche eine Zinserhöhung? Handelt es sich um einen einmaligen Schritt oder den Beginn eines längeren Zinserhöhungszyklus?
- Wenn die Erhöhung erfolgt: Wie entwickelt sich das für BTC, Tech-Aktien und Gold? Aufwärts- oder abwärtsgerichtet?
- Wie planst du als Nächstes zu handeln? Teile deinen BTC-, Aktien- oder Gold-Trade/Bestände mit unserem Trade-Sharing-Widget.
⏰Kampagnenzeitraum:
- 2026-09-15 11:00 - 2026-09-17 3:00 UTC
🎁Belohnung:
- Qualifizierte Beiträge, die die oben genannten Richtlinien erfüllen und mehr als 100 Wörter enthalten, werden überprüft und erhalten möglicherweise einen zufälligen Traffic-Boost von 500 bis 3.000 Aufrufen. Du erhältst eine Benachrichtigung von deiner Feed-Secretary, wenn dein Beitrag ausgewählt wird.
- Erhalte die Chance, dass dein Artikel auf Binance Square Official vorgestellt wird
Du brauchst Ideen für deinen Beitrag? Besuche die Themenseite #FedRateWatch oder die Square Guide on How to Post for Better Reach.
Binance Square Official
·561 Likes
·1.3M Aufrufe
ZcashHoldersBackNU7Upgrade
3,228 Aufrufe
124 Kommentare
MSTRTradingVolumeSurpassesMorganStanley
9,432 Aufrufe
327 Kommentare