

Moonacci
747 Beiträge

Moonacci
Melden
Nutzer blockieren
Professional SMC Trader | Precision-based liquidity & structure analysis. Focused on high-probability setups and disciplined execution.
X @Syedalirazase
248 Following
6.2K+ Follower
1.2K+ Like gegeben
Beiträge
Alle
Zitierungen
Videos
Live
PINNED
·
--
Artikel
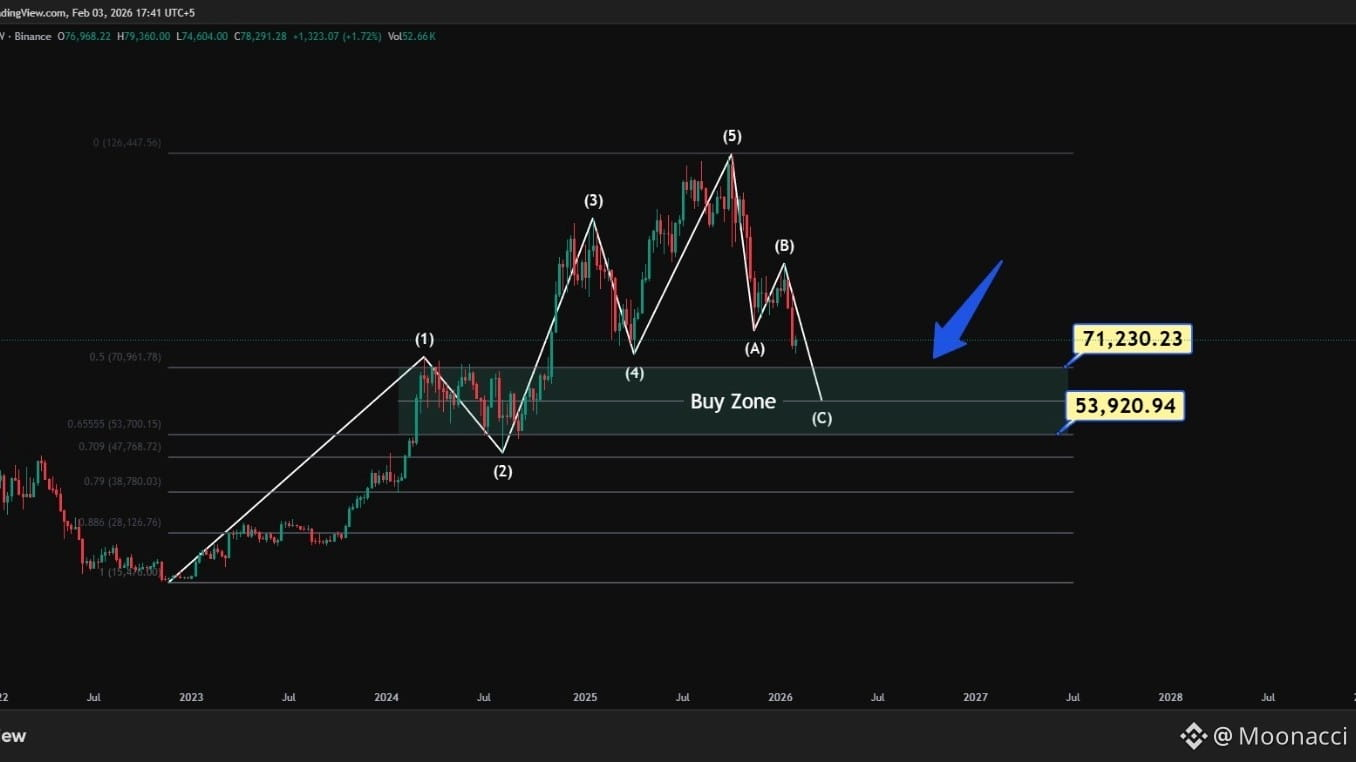
BTCUSDT | Seltene Spot-Akkumulationsmöglichkeit | Langfristige Elliott-WellenprognoseNach fast drei Jahren nähert sich Bitcoin dem Abschluss seines großen Elliott-Wellenzyklus.
Historisch gesehen, sobald eine vollständige impulsive Elliott-Wellenstruktur abgeschlossen ist, wechselt der Markt in eine Korrekturphase, die oft seltene, hochwahrscheinliche Akkumulationsmöglichkeiten schafft.
Das ist kein typischer Rückgang.
Solche Gelegenheiten sind kurzlebig und extrem selten, erscheinen normalerweise einmal alle fünf Jahre.
🔍 Elliott-Wellenstruktur
Der impulsive Elliott-Wellenzyklus ist abgeschlossen
Der Markt hat die A–B–C Korrekturphase betreten
BTCUSDT | Seltene Spot-Akkumulationsmöglichkeit | Langfristige Elliott-Wellenprognose
Nach fast drei Jahren nähert sich Bitcoin dem Abschluss seines großen Elliott-Wellenzyklus.
Historisch gesehen, sobald eine vollständige impulsive Elliott-Wellenstruktur abgeschlossen ist, wechselt der Markt in eine Korrekturphase, die oft seltene, hochwahrscheinliche Akkumulationsmöglichkeiten schafft.
Das ist kein typischer Rückgang.
Solche Gelegenheiten sind kurzlebig und extrem selten, erscheinen normalerweise einmal alle fünf Jahre.
🔍 Elliott-Wellenstruktur
Der impulsive Elliott-Wellenzyklus ist abgeschlossen
Der Markt hat die A–B–C Korrekturphase betreten
557
285
67
557
·
--
$BCH Long-Setup abgesagt. TP1 wurde vor dem Einstieg erreicht. Verpasst, ich jage dem Kurs nicht hinterher.
Keine Finanzberatung. Nur eine Lernidee, manage dein eigenes Risiko.
#BCH
$BCH Long-Setup abgesagt. TP1 wurde vor dem Einstieg erreicht. Verpasst, ich jage dem Kurs nicht hinterher.
Keine Finanzberatung. Nur eine Lernidee, manage dein eigenes Risiko.
#BCH
Keine Finanzberatung. Nur eine Lernidee, manage dein eigenes Risiko.
#BCH
2
148
·
--
Übersetzung ansehen
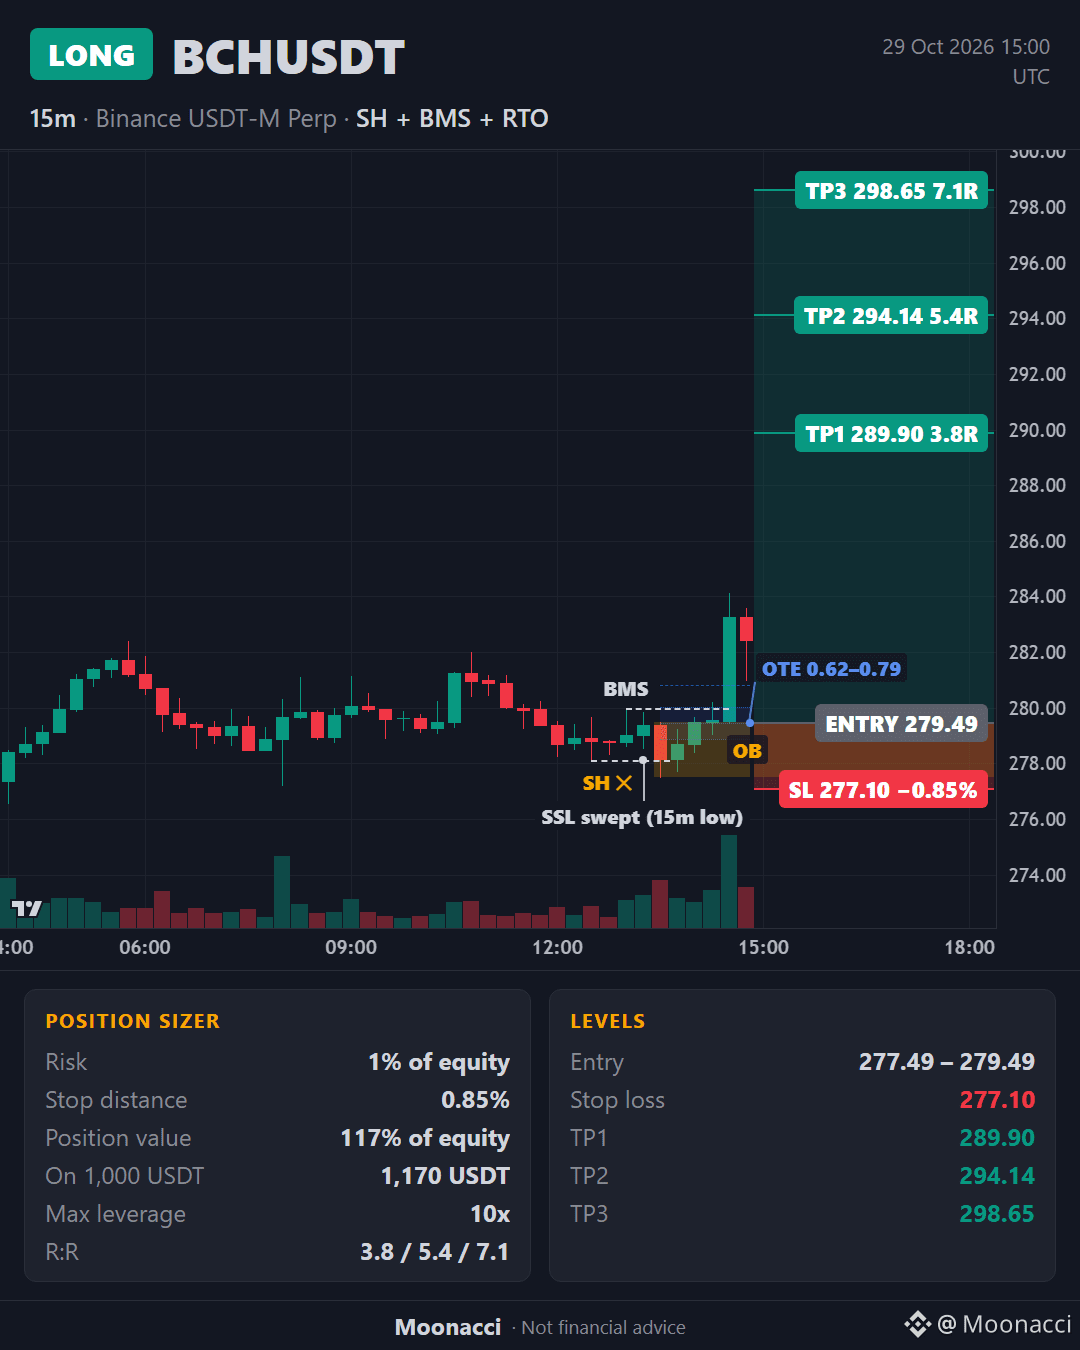
🟢 $BCH long on the 15m
Entry: 277.49 – 279.49
SL: 277.10 (0.85%)
TP1: 289.90
TP2: 294.14
TP3: 298.65
R:R 3.8 / 5.4 / 7.1 after fees
Risk 1% · Leverage max 10x
Size: 1% ÷ 0.85% stop ≈ 117% of equity (1,000 USDT → 1,170 USDT)
4H and 1H are both bullish. Price swept the 15m swing low at 278.13 and broke structure at 280.00 on 5.5x volume. Plan is to catch the return to the 15m order block.
Entry is in the 4H discount. The move started in the New York open.
Idea is invalid below 277.10. Order good for 12h, skip it if TP1 prints first.
Not financial advice. Educational idea only, manage your own risk.
#BCH #BCHUSDT
1
97
·
--
Übersetzung ansehen
$ETH short hit the stop at 2332.71. -1R, moving on.
Not financial advice. Educational idea only, manage your own risk.
#ETH
$ETH short hit the stop at 2332.71. -1R, moving on.
Not financial advice. Educational idea only, manage your own risk.
#ETH
Not financial advice. Educational idea only, manage your own risk.
#ETH
1
90
·
--
$ETH -Short ist live. Ausgeführt bei 2323.33, SL 2332.71.
Keine Finanzberatung. Nur zu Bildungszwecken. Verwalten Sie Ihr Risiko selbst.
#ETH
$ETH -Short ist live. Ausgeführt bei 2323.33, SL 2332.71.
Keine Finanzberatung. Nur zu Bildungszwecken. Verwalten Sie Ihr Risiko selbst.
#ETH
Keine Finanzberatung. Nur zu Bildungszwecken. Verwalten Sie Ihr Risiko selbst.
#ETH
2
218
·
--
Übersetzung ansehen
The Wick Was the Whole Trade #shorts #ict #rejectionblock
$BTC $GOLD.US
The Wick Was the Whole Trade #shorts #ict #rejectionblock
$BTC $GOLD.US
$BTC $GOLD.US
1
4
260
·
--
Übersetzung ansehen
Two Weekly Zones, One Winner: The 3 Checks Behind Every Swing Trade.
$BTC
Two Weekly Zones, One Winner: The 3 Checks Behind Every Swing Trade.
$BTC
$BTC
2
95
·
--
Übersetzung ansehen
The candle after the sweep changed the whole day. Real gold, Tuesday 1 September 2026, an hour into London: price broke Monday's low and the candle closed back above it, which on its own looks like a sweep. But the next candle closed below, and price never closed above that low again. That's acceptance, not a visit: a run. So the trade flips: entry in the middle of the fair value gap the run left, stop above the last up candle.
The candle after the sweep changed the whole day. Real gold, Tuesday 1 September 2026, an hour into London: price broke Monday's low and the candle closed back above it, which on its own looks like a sweep. But the next candle closed below, and price never closed above that low again. That's acceptance, not a visit: a run. So the trade flips: entry in the middle of the fair value gap the run left, stop above the last up candle.
4
478
·
--
Übersetzung ansehen
Two equal lows look like support, but that's where buyers hide their stops: it's a pool, not a floor. Real gold example, Monday 24 August 2026, London morning. The second bottom closed green, the buy went in with the stop just under the lows, price lifted for a moment, then cut through both lows and took the stop. Rewind: one candle closed below the lows, the next closed right back above, and strong candles left a fair value gap. Entry in its middle, stop under the new low (not the old bottoms), target the high between the two bottoms: about three times the risk. SWEEP OR RUN 2/3.
Two equal lows look like support, but that's where buyers hide their stops: it's a pool, not a floor. Real gold example, Monday 24 August 2026, London morning. The second bottom closed green, the buy went in with the stop just under the lows, price lifted for a moment, then cut through both lows and took the stop. Rewind: one candle closed below the lows, the next closed right back above, and strong candles left a fair value gap. Entry in its middle, stop under the new low (not the old bottoms), target the high between the two bottoms: about three times the risk. SWEEP OR RUN 2/3.
3
239
·
--
Übersetzung ansehen
Before you short a high, three things have to happen in order: the high gets taken, a candle closes below the last low, and that fall opens a fair value gap. Real gold example: Thursday 10 September 2026, London open. Price ran above the previous day's high, took the buy stops and closed back below it. Two candles later one closed below the last low (a close, not a wick). Entry in the middle of the gap, stop over the sweep high, target the Asian low: about three times the risk. No sweep first, or only a wick through the low? Skip it. SWEEP OR RUN 1/3.
Before you short a high, three things have to happen in order: the high gets taken, a candle closes below the last low, and that fall opens a fair value gap. Real gold example: Thursday 10 September 2026, London open. Price ran above the previous day's high, took the buy stops and closed back below it. Two candles later one closed below the last low (a close, not a wick). Entry in the middle of the gap, stop over the sweep high, target the Asian low: about three times the risk. No sweep first, or only a wick through the low? Skip it. SWEEP OR RUN 1/3.
3
244
·
--
Übersetzung ansehen
Most fair value gaps on your chart are supposed to fail. In this video you'll learn the four checks a gap must pass before you trade it, where to enter (the middle of the gap, consequent encroachment), where your stop really belongs, and the one candle close that tells you a gap is dead. Four worked trades (New York long, London short, a patience trade, the clean version) and the two mistakes that turn good-looking gaps into losses.
Most fair value gaps on your chart are supposed to fail. In this video you'll learn the four checks a gap must pass before you trade it, where to enter (the middle of the gap, consequent encroachment), where your stop really belongs, and the one candle close that tells you a gap is dead. Four worked trades (New York long, London short, a patience trade, the clean version) and the two mistakes that turn good-looking gaps into losses.
2
179
·
--
Übersetzung ansehen
Which Candle Is the Real Order Block Most Traders Pick Wrong
Which Candle Is the Real Order Block Most Traders Pick Wrong
3
151
·
--
Übersetzung ansehen
The Truth About ICT Order Blocks (And Why You Lose)
Most order blocks you draw were never order blocks. In this video you'll learn what an ICT order block really is, the three filters that separate the ones that hold from the ones that break, the exact entry level (the mean threshold), where your stop really belongs, and the one sign that tells you an order block is dead.
Disclaimer: Educational content only. Not financial advice. Trading involves substantial risk of loss. Past examples do not guarantee future results.
1
1
6
166



Anmelden und weiter Inhalte entdecken
Krypto-Nutzer weltweit auf Binance Square kennenlernen
⚡️ Bleib in Sachen Krypto stets am Puls.
💬 Die weltgrößte Kryptobörse vertraut darauf.
👍 Erhalte verlässliche Einblicke von verifizierten Creators.
E-Mail-Adresse/Telefonnummer
Trendthemen
FedWatch
16.3M Aufrufe
39,429 Kommentare
🚨 🇺🇸 PETER SCHIFF HAT SOEBEN EINE DEUTLICHE WARNUNG AN DIE FED GERICHTET!
Peter Schiff bezeichnet Kevin Warshs harte Rhetorik zur Inflation als „Bluff“, und seine Prognose könnte erhebliche Auswirkungen auf die Märkte haben.
Schiff glaubt, dass die Fed irgendwann wieder zur Geldschöpfung durch quantitative Lockerung (QE) zurückkehren und sogar im nächsten Jahr die Zinsen senken könnte, obwohl die Inflation weiter steigt.
Denk einen Moment darüber nach.
🔥 Die Inflation könnte weiterhin ein Problem bleiben. 🔥 Die Fed könnte trotzdem auf eine lockerere Geldpolitik zusteuern. 🔥 Mehr Liquidität könnte in die Finanzmärkte fließen.
Sollte dieses Szenario eintreten, könnte das für Aktien, Gold, Bitcoin und den gesamten Kryptomarkt ein völlig anderes Marktumfeld schaffen.
Doch es gibt einen Haken: Bleibt die Inflation hoch, könnte die Fed vor der schwierigen Entscheidung stehen, ob sie steigende Preise bekämpfen oder die Wirtschaft stützen soll.
Wird Warsh an einer strikten Inflationspolitik festhalten, oder wird die Fed irgendwann ihren Kurs ändern?
Der nächste Schritt könnte für Anleger sehr wichtig sein.
#FedWatch #EarningsSeason #USMidtermElections #BrazilCryptoExchangesMustApplyForLicensesByFriday #StanDruckenmillerBecomesInvestorInTradeXYZ
Jackson Liam
·4 Likes
·8.5k Aufrufe
EarningsSeason
6.4M Aufrufe
32,118 Kommentare
USMidtermElections
45,540 Aufrufe
634 Kommentare