
ajuxarjun
16 Beiträge

ajuxarjun
Melden
Nutzer blockieren
Visualisation is the key 💸
0 Following
0 Follower
5 Like gegeben
Beiträge
·
--
Übersetzung ansehen
🚨 $SOL IS APPROACHING A LEVEL THAT COULD GET VERY INTERESTING.
SOL is trading around $118.79, up roughly 2% in 24 hours, with about $4.2B in 24H volume. (Binance)
But the bigger story isn’t just the chart.
Solana’s Alpenglow upgrade is targeting roughly 150ms transaction finality, compared with about 12.8 seconds under the current consensus system. Solana says the upgrade is on track for mainnet release later this year. (Solana)
Now look at the chart:
📍 $120 = immediate psychological resistance
📍 $115.95 = recent 24H low / nearby support
📍 $118.79 = current price
If SOL can break and hold above $120 with expanding volume, the breakout becomes much more interesting.
If $120 rejects and price loses $115.95, the momentum setup weakens.
The upgrade is the catalyst.
$120 is the battlefield.
[INSERT LIVE $SOL CANDLE CHART WIDGET HERE]
Would you wait for SOL to reclaim $120 — or wait for a pullback first? 👇
#SOL #Solana #CryptoTrading #BinanceSquare #Altcoins #Crypto
🚨 $SOL IS APPROACHING A LEVEL THAT COULD GET VERY INTERESTING.
SOL is trading around $118.79, up roughly 2% in 24 hours, with about $4.2B in 24H volume. (Binance)
But the bigger story isn’t just the chart.
Solana’s Alpenglow upgrade is targeting roughly 150ms transaction finality, compared with about 12.8 seconds under the current consensus system. Solana says the upgrade is on track for mainnet release later this year. (Solana)
Now look at the chart:
📍 $120 = immediate psychological resistance
📍 $115.95 = recent 24H low / nearby support
📍 $118.79 = current price
If SOL can break and hold above $120 with expanding volume, the breakout becomes much more interesting.
If $120 rejects and price loses $115.95, the momentum setup weakens.
The upgrade is the catalyst.
$120 is the battlefield.
[INSERT LIVE $SOL CANDLE CHART WIDGET HERE]
Would you wait for SOL to reclaim $120 — or wait for a pullback first? 👇
#SOL #Solana #CryptoTrading #BinanceSquare #Altcoins #Crypto
SOL is trading around $118.79, up roughly 2% in 24 hours, with about $4.2B in 24H volume. (Binance)
But the bigger story isn’t just the chart.
Solana’s Alpenglow upgrade is targeting roughly 150ms transaction finality, compared with about 12.8 seconds under the current consensus system. Solana says the upgrade is on track for mainnet release later this year. (Solana)
Now look at the chart:
📍 $120 = immediate psychological resistance
📍 $115.95 = recent 24H low / nearby support
📍 $118.79 = current price
If SOL can break and hold above $120 with expanding volume, the breakout becomes much more interesting.
If $120 rejects and price loses $115.95, the momentum setup weakens.
The upgrade is the catalyst.
$120 is the battlefield.
[INSERT LIVE $SOL CANDLE CHART WIDGET HERE]
Would you wait for SOL to reclaim $120 — or wait for a pullback first? 👇
#SOL #Solana #CryptoTrading #BinanceSquare #Altcoins #Crypto

43
·
--
🚨 $ETH IST AUF DEM NIVEAU, DAS WIRKT.
Ethereum ist stark angestiegen, aber der echte Kampf findet jetzt bei $2,775–$2,825 statt. Ein sauberer Ausbruch und ein bestätigtes Halten könnten die Fortsetzung bestätigen; eine Abweisung könnte ETH zurück in Richtung der Ausbruchszone um $2,661 schicken. Die ETF-Zuflüsse machen diese Bewegung noch interessanter — aber der Kurs muss sich erst noch beweisen. 👀
Würdest du auf den Ausbruch warten oder auf den Retest?
#ETH #Ethereum #CryptoTrading #BinanceSquare #Crypto #Altcoins
🚨 $ETH IST AUF DEM NIVEAU, DAS WIRKT.
Ethereum ist stark angestiegen, aber der echte Kampf findet jetzt bei $2,775–$2,825 statt. Ein sauberer Ausbruch und ein bestätigtes Halten könnten die Fortsetzung bestätigen; eine Abweisung könnte ETH zurück in Richtung der Ausbruchszone um $2,661 schicken. Die ETF-Zuflüsse machen diese Bewegung noch interessanter — aber der Kurs muss sich erst noch beweisen. 👀
Würdest du auf den Ausbruch warten oder auf den Retest?
#ETH #Ethereum #CryptoTrading #BinanceSquare #Crypto #Altcoins
Ethereum ist stark angestiegen, aber der echte Kampf findet jetzt bei $2,775–$2,825 statt. Ein sauberer Ausbruch und ein bestätigtes Halten könnten die Fortsetzung bestätigen; eine Abweisung könnte ETH zurück in Richtung der Ausbruchszone um $2,661 schicken. Die ETF-Zuflüsse machen diese Bewegung noch interessanter — aber der Kurs muss sich erst noch beweisen. 👀
Würdest du auf den Ausbruch warten oder auf den Retest?
#ETH #Ethereum #CryptoTrading #BinanceSquare #Crypto #Altcoins

86
·
--
🚨 $PENGU ICH BIN GENAU IN DIE LEVEL GEKOMMEN, DIE WIRKLICH ZÄHLEN.
PENGU reißt nach oben — aber der interessante Teil ist nicht der Pump.
Sondern das, was hier passiert.
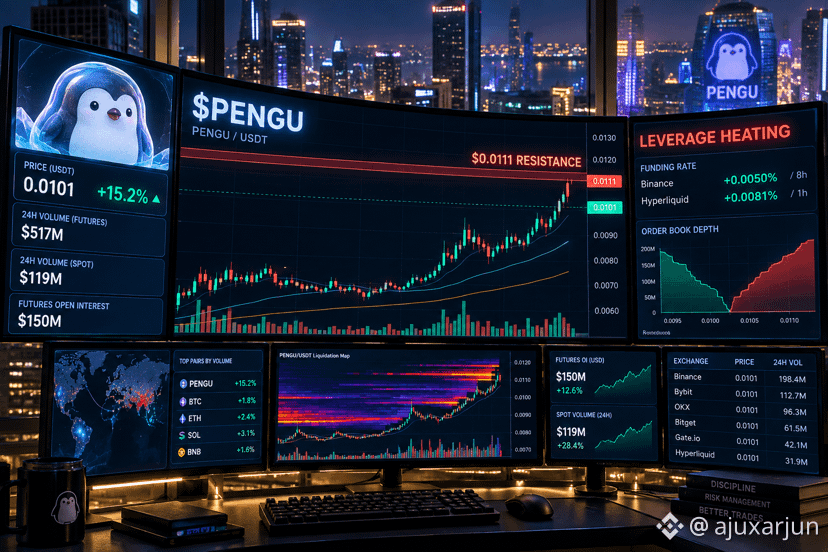
Der Preis drückt nach einer starken Bewegung in die Widerstandszone von 0,0111 US-Dollar, während die Futures-Aktivität und das Open Interest (OI) gestiegen sind.
Das ergibt eine einfache Schlacht:
🐂 Bull Case:
Ein sauberer Ausbruch + starkes Volumen + Akzeptanz oberhalb des Widerstands könnte den Weg für eine weitere Bewegung nach oben öffnen.
🐻 Bear Case:
Wenn 0,0111 US-Dollar abgewiesen wird und verschuldete Longs anfangen, sich aufzulösen, könnte die Bewegung schnell zurücklaufen.
Der Fehler ist, der Kerze hinterherzulaufen.
Das Level ist die Story.
📍 Schlüssellevel: 0,0111 US-Dollar Widerstand
📍 Beobachten: Volumen + OI während des Ausbruchs
⚠️ Invalidierung: Rückfall unter die Ausbruchs-Struktur
Ich beobachte die Reaktion — nicht das Ergebnis.
Würdest du den Ausbruch traden — oder auf den Retest warten? 👇
#PENGU #Crypto #BinanceSquare #Altcoins #Trading #CryptoTrading
🚨 $PENGU ICH BIN GENAU IN DIE LEVEL GEKOMMEN, DIE WIRKLICH ZÄHLEN.
PENGU reißt nach oben — aber der interessante Teil ist nicht der Pump.
Sondern das, was hier passiert.
Der Preis drückt nach einer starken Bewegung in die Widerstandszone von 0,0111 US-Dollar, während die Futures-Aktivität und das Open Interest (OI) gestiegen sind.
Das ergibt eine einfache Schlacht:
🐂 Bull Case:
Ein sauberer Ausbruch + starkes Volumen + Akzeptanz oberhalb des Widerstands könnte den Weg für eine weitere Bewegung nach oben öffnen.
🐻 Bear Case:
Wenn 0,0111 US-Dollar abgewiesen wird und verschuldete Longs anfangen, sich aufzulösen, könnte die Bewegung schnell zurücklaufen.
Der Fehler ist, der Kerze hinterherzulaufen.
Das Level ist die Story.
📍 Schlüssellevel: 0,0111 US-Dollar Widerstand
📍 Beobachten: Volumen + OI während des Ausbruchs
⚠️ Invalidierung: Rückfall unter die Ausbruchs-Struktur
Ich beobachte die Reaktion — nicht das Ergebnis.
Würdest du den Ausbruch traden — oder auf den Retest warten? 👇
#PENGU #Crypto #BinanceSquare #Altcoins #Trading #CryptoTrading
PENGU reißt nach oben — aber der interessante Teil ist nicht der Pump.
Sondern das, was hier passiert.
Der Preis drückt nach einer starken Bewegung in die Widerstandszone von 0,0111 US-Dollar, während die Futures-Aktivität und das Open Interest (OI) gestiegen sind.
Das ergibt eine einfache Schlacht:
🐂 Bull Case:
Ein sauberer Ausbruch + starkes Volumen + Akzeptanz oberhalb des Widerstands könnte den Weg für eine weitere Bewegung nach oben öffnen.
🐻 Bear Case:
Wenn 0,0111 US-Dollar abgewiesen wird und verschuldete Longs anfangen, sich aufzulösen, könnte die Bewegung schnell zurücklaufen.
Der Fehler ist, der Kerze hinterherzulaufen.
Das Level ist die Story.
📍 Schlüssellevel: 0,0111 US-Dollar Widerstand
📍 Beobachten: Volumen + OI während des Ausbruchs
⚠️ Invalidierung: Rückfall unter die Ausbruchs-Struktur
Ich beobachte die Reaktion — nicht das Ergebnis.
Würdest du den Ausbruch traden — oder auf den Retest warten? 👇
#PENGU #Crypto #BinanceSquare #Altcoins #Trading #CryptoTrading
177
·
--
$NEAR heizt sich auf. 🚀
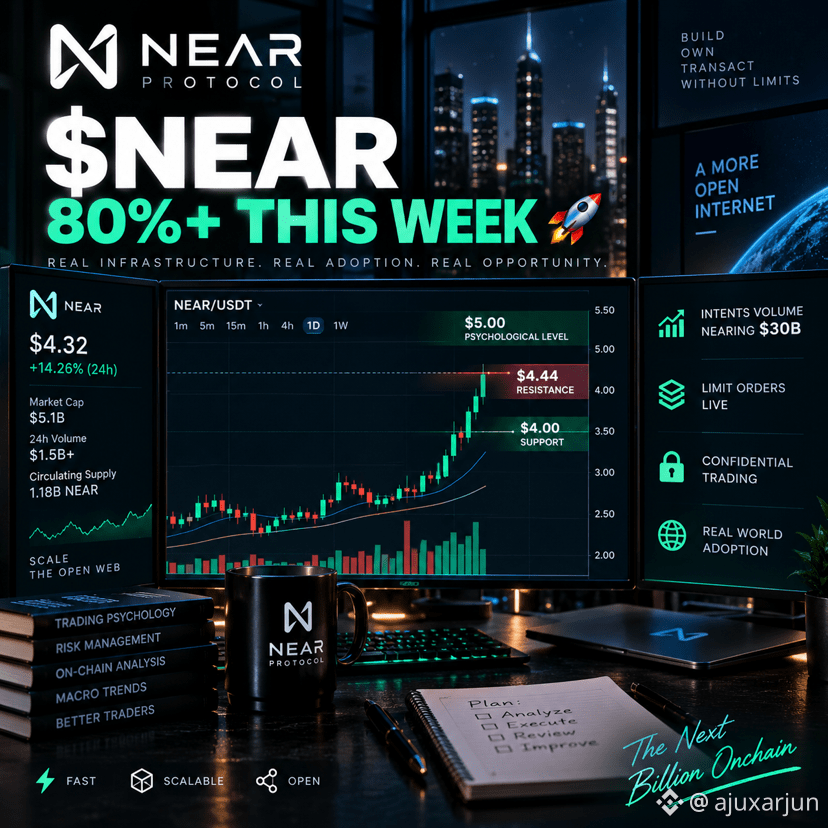
80%+ wöchentlicher Anstieg. Massives Volumen. $4,44 ist die entscheidende Ausbruchszone — während $4,00 die Marke ist, die die Bullen verteidigen müssen.
Wenn $NEAR nach oben ausbricht, wird $5 zum psychologischen Ziel. 👀
Beobachtest du diesen Move?
#NEAR #Crypto #altcoins #Binance #DeFi
$NEAR heizt sich auf. 🚀
80%+ wöchentlicher Anstieg. Massives Volumen. $4,44 ist die entscheidende Ausbruchszone — während $4,00 die Marke ist, die die Bullen verteidigen müssen.
Wenn $NEAR nach oben ausbricht, wird $5 zum psychologischen Ziel. 👀
Beobachtest du diesen Move?
#NEAR #Crypto #altcoins #Binance #DeFi
80%+ wöchentlicher Anstieg. Massives Volumen. $4,44 ist die entscheidende Ausbruchszone — während $4,00 die Marke ist, die die Bullen verteidigen müssen.
Wenn $NEAR nach oben ausbricht, wird $5 zum psychologischen Ziel. 👀
Beobachtest du diesen Move?
#NEAR #Crypto #altcoins #Binance #DeFi
34
·
--
Übersetzung ansehen
⚡ $ASTER IS SITTING RIGHT UNDER A MAJOR LIQUIDITY WALL
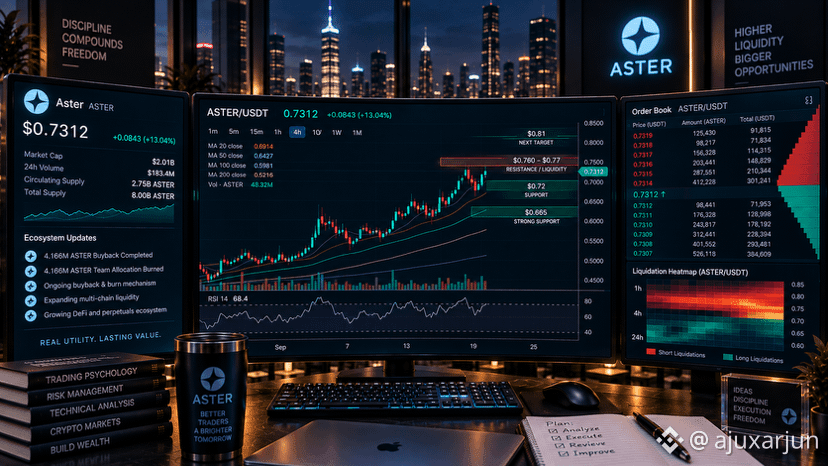
$ASTER is around $0.73, down roughly 1% over 24h after failing to hold the recent $0.76–$0.77 area. The key technical levels are $0.7606 resistance and $0.6655 support, with $0.81 becoming the next upside reference if buyers establish acceptance above resistance. (Binance)
The bigger story is tokenomics: Aster’s latest cycle used 99% of platform fees from Sept. 7–21 to buy back 4.166M $ASTER, while another 4.166M $ASTER was burned from the team allocation. The broader mechanism targets a reduction in total supply from 8B toward 3B, although the pace depends on actual platform fees. (Bitrue)
Derivatives are where this gets interesting: tracked ASTER perpetual open interest is around $148M, with Binance accounting for roughly 60%, while funding remains positive. Current liquidation data shows approximately $6.8M of short-liquidation exposure, meaning a breakout could produce a volatility event—but leverage can accelerate reversals just as quickly. (Squeeze Insights Lab)
🎯 $ASTER LEVELS
* 🔴 $0.760–$0.77 — breakout / liquidity zone
* 🚀 $0.81 — next upside reference
* 🟢 $0.72 — immediate support
* 🟢 $0.665 — major support
* 🔻 $0.573 — deeper structural support
The chart is compressed. The leverage is real. Let price choose the direction. ⚡📊
#ASTER #Aster #Crypto #Altcoins #BinanceSquare
⚡ $ASTER IS SITTING RIGHT UNDER A MAJOR LIQUIDITY WALL
$ASTER is around $0.73, down roughly 1% over 24h after failing to hold the recent $0.76–$0.77 area. The key technical levels are $0.7606 resistance and $0.6655 support, with $0.81 becoming the next upside reference if buyers establish acceptance above resistance. (Binance)
The bigger story is tokenomics: Aster’s latest cycle used 99% of platform fees from Sept. 7–21 to buy back 4.166M $ASTER, while another 4.166M $ASTER was burned from the team allocation. The broader mechanism targets a reduction in total supply from 8B toward 3B, although the pace depends on actual platform fees. (Bitrue)
Derivatives are where this gets interesting: tracked ASTER perpetual open interest is around $148M, with Binance accounting for roughly 60%, while funding remains positive. Current liquidation data shows approximately $6.8M of short-liquidation exposure, meaning a breakout could produce a volatility event—but leverage can accelerate reversals just as quickly. (Squeeze Insights Lab)
🎯 $ASTER LEVELS
* 🔴 $0.760–$0.77 — breakout / liquidity zone
* 🚀 $0.81 — next upside reference
* 🟢 $0.72 — immediate support
* 🟢 $0.665 — major support
* 🔻 $0.573 — deeper structural support
The chart is compressed. The leverage is real. Let price choose the direction. ⚡📊
#ASTER #Aster #Crypto #Altcoins #BinanceSquare
$ASTER is around $0.73, down roughly 1% over 24h after failing to hold the recent $0.76–$0.77 area. The key technical levels are $0.7606 resistance and $0.6655 support, with $0.81 becoming the next upside reference if buyers establish acceptance above resistance. (Binance)
The bigger story is tokenomics: Aster’s latest cycle used 99% of platform fees from Sept. 7–21 to buy back 4.166M $ASTER, while another 4.166M $ASTER was burned from the team allocation. The broader mechanism targets a reduction in total supply from 8B toward 3B, although the pace depends on actual platform fees. (Bitrue)
Derivatives are where this gets interesting: tracked ASTER perpetual open interest is around $148M, with Binance accounting for roughly 60%, while funding remains positive. Current liquidation data shows approximately $6.8M of short-liquidation exposure, meaning a breakout could produce a volatility event—but leverage can accelerate reversals just as quickly. (Squeeze Insights Lab)
🎯 $ASTER LEVELS
* 🔴 $0.760–$0.77 — breakout / liquidity zone
* 🚀 $0.81 — next upside reference
* 🟢 $0.72 — immediate support
* 🟢 $0.665 — major support
* 🔻 $0.573 — deeper structural support
The chart is compressed. The leverage is real. Let price choose the direction. ⚡📊
#ASTER #Aster #Crypto #Altcoins #BinanceSquare
624
·
--
Übersetzung ansehen
🚨 $BTC HAS ONE LAST WALL TO CLEAR — $87K
$BTC surged above $86K for the first time since January and briefly traded above $87K, while the broader crypto market pushed back toward a $3T total market cap. Institutional demand has been part of the move: U.S. spot Bitcoin ETFs recorded roughly $433M of inflows on Friday, while Strategy bought approximately $75.7M of BTC. (The Wall Street Journal)
Now comes the important part: the squeeze has already happened. More than $1B of crypto positions were liquidated over the past day, with roughly 82% reportedly being shorts, meaning the next leg needs genuine spot buying rather than another wave of forced liquidations. (CoinDesk)
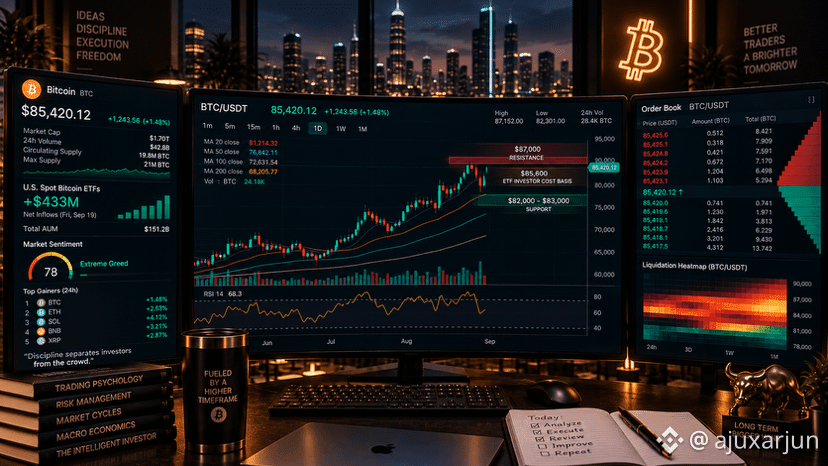
Technically, $87K is the immediate ceiling. A sustained breakout above it would put the market into price discovery territory relative to the recent range; rejection keeps $85.6K as an important reference and $82K–$83K as the major support zone. This is a confirmation setup—not a reason to chase a vertical candle.
🎯 FINAL $BTC LEVELS
* 🔴 $87,000 — breakout / liquidity wall
* 🟡 $85,600 — key near-term reference
* 🟢 $82,000–$83,000 — major support
* 🔻 $78,500 — deeper structural support
$87K decides the next chapter. Watch the reaction, not the headline. 👀📊⚡
#BTC #Bitcoin #Crypto #BinanceSquare #Trading
🚨 $BTC HAS ONE LAST WALL TO CLEAR — $87K
$BTC surged above $86K for the first time since January and briefly traded above $87K, while the broader crypto market pushed back toward a $3T total market cap. Institutional demand has been part of the move: U.S. spot Bitcoin ETFs recorded roughly $433M of inflows on Friday, while Strategy bought approximately $75.7M of BTC. (The Wall Street Journal)
Now comes the important part: the squeeze has already happened. More than $1B of crypto positions were liquidated over the past day, with roughly 82% reportedly being shorts, meaning the next leg needs genuine spot buying rather than another wave of forced liquidations. (CoinDesk)
Technically, $87K is the immediate ceiling. A sustained breakout above it would put the market into price discovery territory relative to the recent range; rejection keeps $85.6K as an important reference and $82K–$83K as the major support zone. This is a confirmation setup—not a reason to chase a vertical candle.
🎯 FINAL $BTC LEVELS
* 🔴 $87,000 — breakout / liquidity wall
* 🟡 $85,600 — key near-term reference
* 🟢 $82,000–$83,000 — major support
* 🔻 $78,500 — deeper structural support
$87K decides the next chapter. Watch the reaction, not the headline. 👀📊⚡
#BTC #Bitcoin #Crypto #BinanceSquare #Trading
$BTC surged above $86K for the first time since January and briefly traded above $87K, while the broader crypto market pushed back toward a $3T total market cap. Institutional demand has been part of the move: U.S. spot Bitcoin ETFs recorded roughly $433M of inflows on Friday, while Strategy bought approximately $75.7M of BTC. (The Wall Street Journal)
Now comes the important part: the squeeze has already happened. More than $1B of crypto positions were liquidated over the past day, with roughly 82% reportedly being shorts, meaning the next leg needs genuine spot buying rather than another wave of forced liquidations. (CoinDesk)
Technically, $87K is the immediate ceiling. A sustained breakout above it would put the market into price discovery territory relative to the recent range; rejection keeps $85.6K as an important reference and $82K–$83K as the major support zone. This is a confirmation setup—not a reason to chase a vertical candle.
🎯 FINAL $BTC LEVELS
* 🔴 $87,000 — breakout / liquidity wall
* 🟡 $85,600 — key near-term reference
* 🟢 $82,000–$83,000 — major support
* 🔻 $78,500 — deeper structural support
$87K decides the next chapter. Watch the reaction, not the headline. 👀📊⚡
#BTC #Bitcoin #Crypto #BinanceSquare #Trading
8
·
--
🚨 $SUI HAT JETZT WIEDER $1 EINGESAMMELT — DER ECHTE TEST BEGINNT JETZT ⚡
$SUI ist wieder über der psychologischen $1,00-Marke, handelt um $1,04 nach einem starken Momentum-Ausbruch. Das 24h-Volumen liegt bei rund $1,7 Mrd., während SUI in sieben Tagen ungefähr 44% zugelegt hat — das ist keine ruhige Erholung mehr. (CoinStats)
Der Chart sitzt jetzt direkt in der Entscheidungszone $1,04–$1,08. Eine klare Bestätigung über $1,08 würde $1,16–$1,28 in den Fokus rücken, während das Verlieren der Breakout-Marke bei $0,9725 das Setup schwächen und möglicherweise die $0,91-Region freilegen würde. (CoinMarketCap)
Hinter der Bewegung steckt außerdem eine fundamentale Story: Suilend hat V2.0 gelauncht, wodurch Lending-, Borrowing- und Kapitalmanagement-Tools konsolidiert wurden, während die Aktivität im Sui-Ökosystem sich demnächst 5 Milliarden Transaktionen nähert. Händler schauen außerdem auf das bevorstehende Sui Basecamp-Event am 7.–8. Oktober und auf Erwartungen rund um ein angedeutetes Finanzprodukt. (CoinStats)
Aber hier ist die Gefahr: Der Leverage steigt rasant. Das gemeldete SUI Open Interest erreichte ungefähr $1 Mrd., ist in sieben Tagen um fast 65% gestiegen, während die täglichen RSI-Werte auf manchen technischen Feeds bereits im überkauften Bereich liegen. Das Momentum ist real; es blind zu jagen ist das Risiko. (CoinStats)
🎯 SUI-NIVEAUS
* 🔥 $1,08 — Breakout-Bestätigung
* 🚀 $1,16–$1,28 — nächste Momentum-Zone
* 🟢 $0,9725 — kritischer Breakout-Support
* 🟢 $0,91 — tieferer Support
$1 war der psychologische Kampf. $1,08 ist der Bereich, in dem es spannend wird. 👀📊
#SUI #SuiNetwork #Krypto #Altcoins #BinanceSquare
🚨 $SUI HAT JETZT WIEDER $1 EINGESAMMELT — DER ECHTE TEST BEGINNT JETZT ⚡
$SUI ist wieder über der psychologischen $1,00-Marke, handelt um $1,04 nach einem starken Momentum-Ausbruch. Das 24h-Volumen liegt bei rund $1,7 Mrd., während SUI in sieben Tagen ungefähr 44% zugelegt hat — das ist keine ruhige Erholung mehr. (CoinStats)
Der Chart sitzt jetzt direkt in der Entscheidungszone $1,04–$1,08. Eine klare Bestätigung über $1,08 würde $1,16–$1,28 in den Fokus rücken, während das Verlieren der Breakout-Marke bei $0,9725 das Setup schwächen und möglicherweise die $0,91-Region freilegen würde. (CoinMarketCap)
Hinter der Bewegung steckt außerdem eine fundamentale Story: Suilend hat V2.0 gelauncht, wodurch Lending-, Borrowing- und Kapitalmanagement-Tools konsolidiert wurden, während die Aktivität im Sui-Ökosystem sich demnächst 5 Milliarden Transaktionen nähert. Händler schauen außerdem auf das bevorstehende Sui Basecamp-Event am 7.–8. Oktober und auf Erwartungen rund um ein angedeutetes Finanzprodukt. (CoinStats)
Aber hier ist die Gefahr: Der Leverage steigt rasant. Das gemeldete SUI Open Interest erreichte ungefähr $1 Mrd., ist in sieben Tagen um fast 65% gestiegen, während die täglichen RSI-Werte auf manchen technischen Feeds bereits im überkauften Bereich liegen. Das Momentum ist real; es blind zu jagen ist das Risiko. (CoinStats)
🎯 SUI-NIVEAUS
* 🔥 $1,08 — Breakout-Bestätigung
* 🚀 $1,16–$1,28 — nächste Momentum-Zone
* 🟢 $0,9725 — kritischer Breakout-Support
* 🟢 $0,91 — tieferer Support
$1 war der psychologische Kampf. $1,08 ist der Bereich, in dem es spannend wird. 👀📊
#SUI #SuiNetwork #Krypto #Altcoins #BinanceSquare
$SUI ist wieder über der psychologischen $1,00-Marke, handelt um $1,04 nach einem starken Momentum-Ausbruch. Das 24h-Volumen liegt bei rund $1,7 Mrd., während SUI in sieben Tagen ungefähr 44% zugelegt hat — das ist keine ruhige Erholung mehr. (CoinStats)
Der Chart sitzt jetzt direkt in der Entscheidungszone $1,04–$1,08. Eine klare Bestätigung über $1,08 würde $1,16–$1,28 in den Fokus rücken, während das Verlieren der Breakout-Marke bei $0,9725 das Setup schwächen und möglicherweise die $0,91-Region freilegen würde. (CoinMarketCap)
Hinter der Bewegung steckt außerdem eine fundamentale Story: Suilend hat V2.0 gelauncht, wodurch Lending-, Borrowing- und Kapitalmanagement-Tools konsolidiert wurden, während die Aktivität im Sui-Ökosystem sich demnächst 5 Milliarden Transaktionen nähert. Händler schauen außerdem auf das bevorstehende Sui Basecamp-Event am 7.–8. Oktober und auf Erwartungen rund um ein angedeutetes Finanzprodukt. (CoinStats)
Aber hier ist die Gefahr: Der Leverage steigt rasant. Das gemeldete SUI Open Interest erreichte ungefähr $1 Mrd., ist in sieben Tagen um fast 65% gestiegen, während die täglichen RSI-Werte auf manchen technischen Feeds bereits im überkauften Bereich liegen. Das Momentum ist real; es blind zu jagen ist das Risiko. (CoinStats)
🎯 SUI-NIVEAUS
* 🔥 $1,08 — Breakout-Bestätigung
* 🚀 $1,16–$1,28 — nächste Momentum-Zone
* 🟢 $0,9725 — kritischer Breakout-Support
* 🟢 $0,91 — tieferer Support
$1 war der psychologische Kampf. $1,08 ist der Bereich, in dem es spannend wird. 👀📊
#SUI #SuiNetwork #Krypto #Altcoins #BinanceSquare

68
·
--
Übersetzung ansehen
🐕🚨 $DOGE JUST BECAME THE MEMECOIN TO WATCH TODAY
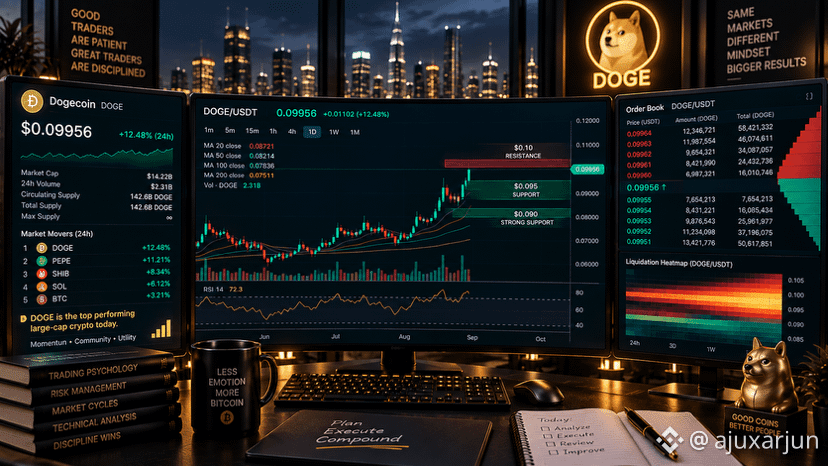
$DOGE is currently around $0.0996, up ~12.5%, making it the leading mover in a live crypto snapshot, while overall crypto breadth is also strong. Binance’s market feed has BTC around $85.5K (+4.7%), ETH around $2.73K (+2.6%), and SOL around $116.7 (+4.1%) — meaning DOGE is participating in a broader risk-on move rather than moving in isolation. (InteractiveCrypto)
The technical setup is getting interesting: $0.10 is the psychological resistance, while $0.095 is the first retest zone and $0.090 the stronger support area. Momentum is powerful, but the live snapshot already shows crypto sentiment around 78 / Extreme Greed, so chasing a vertical candle introduces considerably more volatility than waiting for price to establish support. (InteractiveCrypto)
Here’s the trigger I’m watching: break and hold above $0.10 with expanding volume versus rejection back below $0.095. If buyers establish acceptance above resistance, the next upside zones become a momentum-trading question; if $0.095 fails, the market has a clear nearby level to reassess rather than blindly averaging into weakness.
🎯 $DOGE LEVELS
* 🔴 $0.100 — psychological resistance / breakout trigger
* 🟢 $0.095 — first retest zone
* 🟢 $0.090 — stronger support
* ⚠️ RSI ~72 — momentum is strong, but stretched
DOGE doesn’t need a prediction. It needs a level to break. 🐕📊
#DOGE #Dogecoin #Memecoin #Crypto #BinanceSquare
🐕🚨 $DOGE JUST BECAME THE MEMECOIN TO WATCH TODAY
$DOGE is currently around $0.0996, up ~12.5%, making it the leading mover in a live crypto snapshot, while overall crypto breadth is also strong. Binance’s market feed has BTC around $85.5K (+4.7%), ETH around $2.73K (+2.6%), and SOL around $116.7 (+4.1%) — meaning DOGE is participating in a broader risk-on move rather than moving in isolation. (InteractiveCrypto)
The technical setup is getting interesting: $0.10 is the psychological resistance, while $0.095 is the first retest zone and $0.090 the stronger support area. Momentum is powerful, but the live snapshot already shows crypto sentiment around 78 / Extreme Greed, so chasing a vertical candle introduces considerably more volatility than waiting for price to establish support. (InteractiveCrypto)
Here’s the trigger I’m watching: break and hold above $0.10 with expanding volume versus rejection back below $0.095. If buyers establish acceptance above resistance, the next upside zones become a momentum-trading question; if $0.095 fails, the market has a clear nearby level to reassess rather than blindly averaging into weakness.
🎯 $DOGE LEVELS
* 🔴 $0.100 — psychological resistance / breakout trigger
* 🟢 $0.095 — first retest zone
* 🟢 $0.090 — stronger support
* ⚠️ RSI ~72 — momentum is strong, but stretched
DOGE doesn’t need a prediction. It needs a level to break. 🐕📊
#DOGE #Dogecoin #Memecoin #Crypto #BinanceSquare
$DOGE is currently around $0.0996, up ~12.5%, making it the leading mover in a live crypto snapshot, while overall crypto breadth is also strong. Binance’s market feed has BTC around $85.5K (+4.7%), ETH around $2.73K (+2.6%), and SOL around $116.7 (+4.1%) — meaning DOGE is participating in a broader risk-on move rather than moving in isolation. (InteractiveCrypto)
The technical setup is getting interesting: $0.10 is the psychological resistance, while $0.095 is the first retest zone and $0.090 the stronger support area. Momentum is powerful, but the live snapshot already shows crypto sentiment around 78 / Extreme Greed, so chasing a vertical candle introduces considerably more volatility than waiting for price to establish support. (InteractiveCrypto)
Here’s the trigger I’m watching: break and hold above $0.10 with expanding volume versus rejection back below $0.095. If buyers establish acceptance above resistance, the next upside zones become a momentum-trading question; if $0.095 fails, the market has a clear nearby level to reassess rather than blindly averaging into weakness.
🎯 $DOGE LEVELS
* 🔴 $0.100 — psychological resistance / breakout trigger
* 🟢 $0.095 — first retest zone
* 🟢 $0.090 — stronger support
* ⚠️ RSI ~72 — momentum is strong, but stretched
DOGE doesn’t need a prediction. It needs a level to break. 🐕📊
#DOGE #Dogecoin #Memecoin #Crypto #BinanceSquare
17
·
--
Übersetzung ansehen
🐸🚨 $PEPE JUST EXPLODED 26% — MEMECOIN ROTATION IS ON
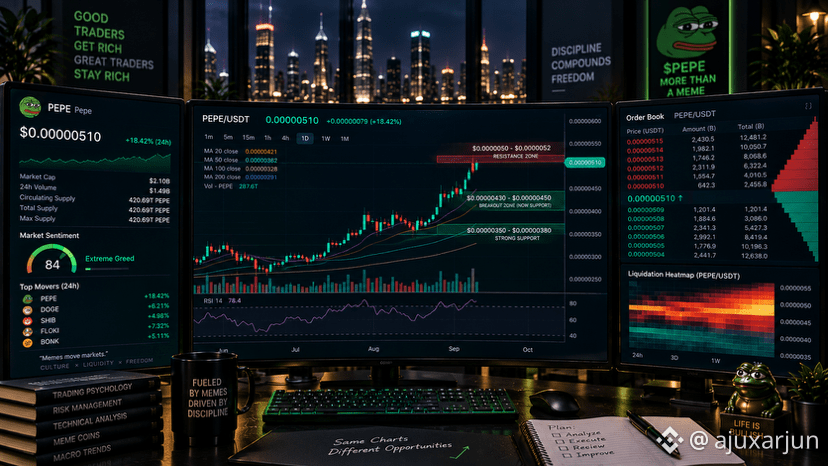
$PEPE is trading around $0.0000051, up roughly 26% in 24 hours, with approximately $1.5B in 24h volume and a market cap near $2.1B. The move is part of a broader risk-on rotation into meme coins as $BTC strengthens, but PEPE is currently moving much faster than the majors. (CoinMarketCap)
The interesting technical level is the $0.00000430–$0.00000450 breakout zone. PEPE has reclaimed that area and pushed toward $0.0000052, while hourly momentum remains positive; however, daily RSI is around 75, meaning the move is already stretched and a retest/consolidation would not be surprising. (InteractiveCrypto)
There’s another layer: recent reporting points to significant whale accumulation, while PEPE’s enormous trading volume shows just how aggressively speculative capital is rotating into the token. The flip side is equally important—meme coins can reverse violently, and PEPE’s high wallet concentration adds additional volatility risk. (InteractiveCrypto)
🎯 PEPE LEVELS
* 🔴 $0.00000520 — immediate breakout area
* 🚀 $0.00000550–$0.00000600 — momentum zone
* 🟢 $0.00000430–$0.00000450 — critical breakout-retest support
* 🟢 $0.00000350–$0.00000380 — stronger support
🐸 Meme season doesn’t announce itself. Volume usually does. 📊⚡
#PEPE #Memecoin #Crypto #BinanceSquare
🐸🚨 $PEPE JUST EXPLODED 26% — MEMECOIN ROTATION IS ON
$PEPE is trading around $0.0000051, up roughly 26% in 24 hours, with approximately $1.5B in 24h volume and a market cap near $2.1B. The move is part of a broader risk-on rotation into meme coins as $BTC strengthens, but PEPE is currently moving much faster than the majors. (CoinMarketCap)
The interesting technical level is the $0.00000430–$0.00000450 breakout zone. PEPE has reclaimed that area and pushed toward $0.0000052, while hourly momentum remains positive; however, daily RSI is around 75, meaning the move is already stretched and a retest/consolidation would not be surprising. (InteractiveCrypto)
There’s another layer: recent reporting points to significant whale accumulation, while PEPE’s enormous trading volume shows just how aggressively speculative capital is rotating into the token. The flip side is equally important—meme coins can reverse violently, and PEPE’s high wallet concentration adds additional volatility risk. (InteractiveCrypto)
🎯 PEPE LEVELS
* 🔴 $0.00000520 — immediate breakout area
* 🚀 $0.00000550–$0.00000600 — momentum zone
* 🟢 $0.00000430–$0.00000450 — critical breakout-retest support
* 🟢 $0.00000350–$0.00000380 — stronger support
🐸 Meme season doesn’t announce itself. Volume usually does. 📊⚡
#PEPE #Memecoin #Crypto #BinanceSquare
$PEPE is trading around $0.0000051, up roughly 26% in 24 hours, with approximately $1.5B in 24h volume and a market cap near $2.1B. The move is part of a broader risk-on rotation into meme coins as $BTC strengthens, but PEPE is currently moving much faster than the majors. (CoinMarketCap)
The interesting technical level is the $0.00000430–$0.00000450 breakout zone. PEPE has reclaimed that area and pushed toward $0.0000052, while hourly momentum remains positive; however, daily RSI is around 75, meaning the move is already stretched and a retest/consolidation would not be surprising. (InteractiveCrypto)
There’s another layer: recent reporting points to significant whale accumulation, while PEPE’s enormous trading volume shows just how aggressively speculative capital is rotating into the token. The flip side is equally important—meme coins can reverse violently, and PEPE’s high wallet concentration adds additional volatility risk. (InteractiveCrypto)
🎯 PEPE LEVELS
* 🔴 $0.00000520 — immediate breakout area
* 🚀 $0.00000550–$0.00000600 — momentum zone
* 🟢 $0.00000430–$0.00000450 — critical breakout-retest support
* 🟢 $0.00000350–$0.00000380 — stronger support
🐸 Meme season doesn’t announce itself. Volume usually does. 📊⚡
#PEPE #Memecoin #Crypto #BinanceSquare
25
·
--
Übersetzung ansehen
🚨 $BTC JUST PRINTED AN 8-MONTH HIGH — NOW WATCH $87K
$BTC ripped above $87,000 on Sept. 21, reaching its highest level since January before pulling back toward the mid-$85Ks. The move came alongside strong U.S. spot ETF inflows and a large wave of short covering, with reports putting Friday ETF inflows around $433M and total crypto short liquidations near $919M. (The Wall Street Journal)
The technical structure has changed: Bitcoin reclaimed the 50-week moving average after spending roughly 45 weeks below it, while the current ETF-investor cost basis has been reported around $85,600. That makes the $85K–$86K region an important area to watch if the breakout is going to hold. (The Economic Times)
But here’s the important part: $87K is resistance, not confirmation. A clean acceptance above the recent high would keep momentum intact; rejection followed by a loss of $85K could shift attention toward $82K–$83K, with $78.5K as a deeper structural level. Meanwhile, macro conditions remain mixed, with Treasury yields near 4.9% and markets still watching geopolitical and Fed-rate developments. (Reuters)
🎯 LEVELS TO WATCH
* 🔴 $87,000 — recent high / major resistance
* 🟡 $85,600 — reported ETF investor cost basis
* 🟢 $82,000–$83,000 — key support
* 🔻 $78,500 — deeper support
Breakout or bull trap? Let price prove it. 📊⚡
🚨 $BTC JUST PRINTED AN 8-MONTH HIGH — NOW WATCH $87K
$BTC ripped above $87,000 on Sept. 21, reaching its highest level since January before pulling back toward the mid-$85Ks. The move came alongside strong U.S. spot ETF inflows and a large wave of short covering, with reports putting Friday ETF inflows around $433M and total crypto short liquidations near $919M. (The Wall Street Journal)
The technical structure has changed: Bitcoin reclaimed the 50-week moving average after spending roughly 45 weeks below it, while the current ETF-investor cost basis has been reported around $85,600. That makes the $85K–$86K region an important area to watch if the breakout is going to hold. (The Economic Times)
But here’s the important part: $87K is resistance, not confirmation. A clean acceptance above the recent high would keep momentum intact; rejection followed by a loss of $85K could shift attention toward $82K–$83K, with $78.5K as a deeper structural level. Meanwhile, macro conditions remain mixed, with Treasury yields near 4.9% and markets still watching geopolitical and Fed-rate developments. (Reuters)
🎯 LEVELS TO WATCH
* 🔴 $87,000 — recent high / major resistance
* 🟡 $85,600 — reported ETF investor cost basis
* 🟢 $82,000–$83,000 — key support
* 🔻 $78,500 — deeper support
Breakout or bull trap? Let price prove it. 📊⚡
$BTC ripped above $87,000 on Sept. 21, reaching its highest level since January before pulling back toward the mid-$85Ks. The move came alongside strong U.S. spot ETF inflows and a large wave of short covering, with reports putting Friday ETF inflows around $433M and total crypto short liquidations near $919M. (The Wall Street Journal)
The technical structure has changed: Bitcoin reclaimed the 50-week moving average after spending roughly 45 weeks below it, while the current ETF-investor cost basis has been reported around $85,600. That makes the $85K–$86K region an important area to watch if the breakout is going to hold. (The Economic Times)
But here’s the important part: $87K is resistance, not confirmation. A clean acceptance above the recent high would keep momentum intact; rejection followed by a loss of $85K could shift attention toward $82K–$83K, with $78.5K as a deeper structural level. Meanwhile, macro conditions remain mixed, with Treasury yields near 4.9% and markets still watching geopolitical and Fed-rate developments. (Reuters)
🎯 LEVELS TO WATCH
* 🔴 $87,000 — recent high / major resistance
* 🟡 $85,600 — reported ETF investor cost basis
* 🟢 $82,000–$83,000 — key support
* 🔻 $78,500 — deeper support
Breakout or bull trap? Let price prove it. 📊⚡

10
·
--
Übersetzung ansehen
⚡ $BNB IS APPROACHING $823 — THE NEXT BREAKOUT TEST IS HERE
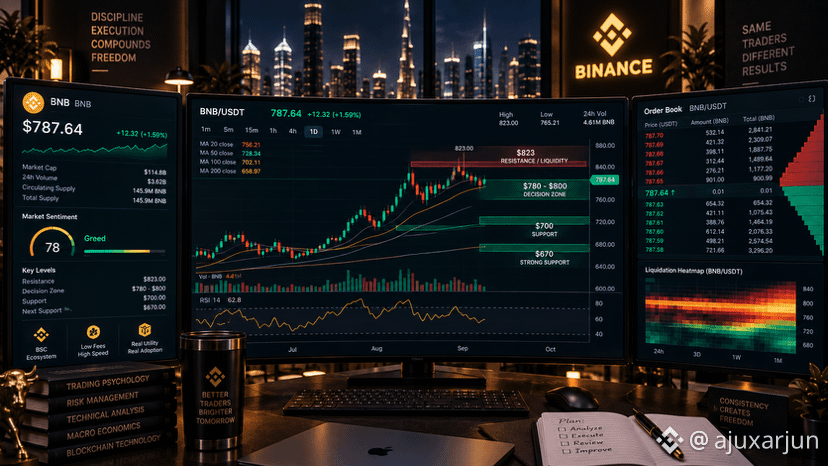
$BNB has climbed sharply from the July lows and is now hovering around the $780–$800 decision zone, with recent analysis placing $823.20 as the key resistance overhead. Momentum remains constructive on the higher timeframes, but price is also showing signs of cooling after the latest advance. (Pluang)
The technical structure is straightforward: $823 is the liquidity/resistance ceiling, while $780–$800 is the immediate battleground. A sustained move above $823 would change the short-term structure; rejection keeps $700 and then $670 as the major downside reference zones. (AMBCrypto)
There is also an important ecosystem backdrop. Binance completed a scheduled system upgrade today, while Binance announced a $100M investment in Circle and an expanded USDC partnership, including plans to integrate USDC into Binance digital-asset products. Separately, BNB’s U.S. ETF story remains an institutional catalyst to monitor. (Binance)
🎯 Key levels
* 🔴 $823 — major resistance / liquidity
* 🟡 $780–$800 — decision zone
* 🟢 $700 — primary support
* 🟢 $670 — strong lower support
$823 is the level to watch — confirmation matters more than prediction. 📊⚡
⚡ $BNB IS APPROACHING $823 — THE NEXT BREAKOUT TEST IS HERE
$BNB has climbed sharply from the July lows and is now hovering around the $780–$800 decision zone, with recent analysis placing $823.20 as the key resistance overhead. Momentum remains constructive on the higher timeframes, but price is also showing signs of cooling after the latest advance. (Pluang)
The technical structure is straightforward: $823 is the liquidity/resistance ceiling, while $780–$800 is the immediate battleground. A sustained move above $823 would change the short-term structure; rejection keeps $700 and then $670 as the major downside reference zones. (AMBCrypto)
There is also an important ecosystem backdrop. Binance completed a scheduled system upgrade today, while Binance announced a $100M investment in Circle and an expanded USDC partnership, including plans to integrate USDC into Binance digital-asset products. Separately, BNB’s U.S. ETF story remains an institutional catalyst to monitor. (Binance)
🎯 Key levels
* 🔴 $823 — major resistance / liquidity
* 🟡 $780–$800 — decision zone
* 🟢 $700 — primary support
* 🟢 $670 — strong lower support
$823 is the level to watch — confirmation matters more than prediction. 📊⚡
$BNB has climbed sharply from the July lows and is now hovering around the $780–$800 decision zone, with recent analysis placing $823.20 as the key resistance overhead. Momentum remains constructive on the higher timeframes, but price is also showing signs of cooling after the latest advance. (Pluang)
The technical structure is straightforward: $823 is the liquidity/resistance ceiling, while $780–$800 is the immediate battleground. A sustained move above $823 would change the short-term structure; rejection keeps $700 and then $670 as the major downside reference zones. (AMBCrypto)
There is also an important ecosystem backdrop. Binance completed a scheduled system upgrade today, while Binance announced a $100M investment in Circle and an expanded USDC partnership, including plans to integrate USDC into Binance digital-asset products. Separately, BNB’s U.S. ETF story remains an institutional catalyst to monitor. (Binance)
🎯 Key levels
* 🔴 $823 — major resistance / liquidity
* 🟡 $780–$800 — decision zone
* 🟢 $700 — primary support
* 🟢 $670 — strong lower support
$823 is the level to watch — confirmation matters more than prediction. 📊⚡
29
·
--
🚨 $XRP BRICHT AUS — 1,60$ IST DIE ENTSCHEIDUNGSZONE
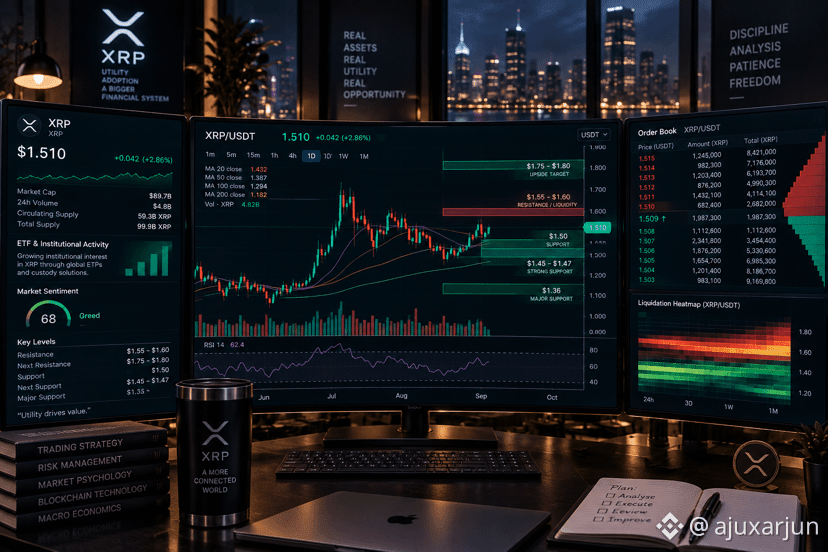
$XRP hat sich durch einen abwärtsgerichteten Kanal über mehrere Wochen durchgesetzt und wird derzeit um 1,51$ gehandelt. Der Schwung beschleunigt sich nach dem Ausbruch. Aktuelle technische Signale sehen den nächsten großen Test bei etwa 1,55–1,60$, während die 1,50$-Marke die erste Verteidigungslinie ist, falls der Preis den Ausbruch erneut testet. (CoinStats)
Das Derivate-Orderbuch weitet sich parallel zum Preis aus: Das gemeldete Open Interest bei XRP-Futures ist um etwa 19% gestiegen, während Short-Liquidationen den überwiegenden Großteil der jüngsten Liquidationen ausmachten. Das bestätigt eine aggressive Positionierung hinter der Bewegung, aber es bedeutet auch, dass ein gescheiterter Ausbruch zu erhöhter Volatilität in beide Richtungen führen kann. (CoinStats)
Es gibt außerdem ein Fenster für einen fundamentalen Katalysator: XRP-Spot-ETFs haben eine gemeldete 10-Wochen-Streak mit aufeinanderfolgenden wöchentlichen Zuflüssen beibehalten, während für die XRPL um den 29. September herum ein Batch V1.1-Upgrade geplant ist. Die Kombination aus sich verbessernder technischer Struktur und institutionellen/ledgerbezogenen Entwicklungen macht 1,55–1,60$ zur Zone, die ich für eine Bestätigung im Blick behalten würde, statt der aktuellen Bewegung blind hinterherzulaufen. (Coin Edition)
🎯 Wichtige Levels
* 🔴 1,55–1,60 — Ausbruch / Liquiditätszone
* 🚀 1,75–1,80 — nächster Widerstand nach oben
* 🟢 1,50 — unmittelbarer Support
* 🟢 1,45–1,47 — stärkerer Retest-Bereich
* 🔻 1,36 — wichtiger struktureller Support
Der Ausbruch ist interessant. Der Retest ist dort, wo die Informationen sind. 📊⚡
🚨 $XRP BRICHT AUS — 1,60$ IST DIE ENTSCHEIDUNGSZONE
$XRP hat sich durch einen abwärtsgerichteten Kanal über mehrere Wochen durchgesetzt und wird derzeit um 1,51$ gehandelt. Der Schwung beschleunigt sich nach dem Ausbruch. Aktuelle technische Signale sehen den nächsten großen Test bei etwa 1,55–1,60$, während die 1,50$-Marke die erste Verteidigungslinie ist, falls der Preis den Ausbruch erneut testet. (CoinStats)
Das Derivate-Orderbuch weitet sich parallel zum Preis aus: Das gemeldete Open Interest bei XRP-Futures ist um etwa 19% gestiegen, während Short-Liquidationen den überwiegenden Großteil der jüngsten Liquidationen ausmachten. Das bestätigt eine aggressive Positionierung hinter der Bewegung, aber es bedeutet auch, dass ein gescheiterter Ausbruch zu erhöhter Volatilität in beide Richtungen führen kann. (CoinStats)
Es gibt außerdem ein Fenster für einen fundamentalen Katalysator: XRP-Spot-ETFs haben eine gemeldete 10-Wochen-Streak mit aufeinanderfolgenden wöchentlichen Zuflüssen beibehalten, während für die XRPL um den 29. September herum ein Batch V1.1-Upgrade geplant ist. Die Kombination aus sich verbessernder technischer Struktur und institutionellen/ledgerbezogenen Entwicklungen macht 1,55–1,60$ zur Zone, die ich für eine Bestätigung im Blick behalten würde, statt der aktuellen Bewegung blind hinterherzulaufen. (Coin Edition)
🎯 Wichtige Levels
* 🔴 1,55–1,60 — Ausbruch / Liquiditätszone
* 🚀 1,75–1,80 — nächster Widerstand nach oben
* 🟢 1,50 — unmittelbarer Support
* 🟢 1,45–1,47 — stärkerer Retest-Bereich
* 🔻 1,36 — wichtiger struktureller Support
Der Ausbruch ist interessant. Der Retest ist dort, wo die Informationen sind. 📊⚡
$XRP hat sich durch einen abwärtsgerichteten Kanal über mehrere Wochen durchgesetzt und wird derzeit um 1,51$ gehandelt. Der Schwung beschleunigt sich nach dem Ausbruch. Aktuelle technische Signale sehen den nächsten großen Test bei etwa 1,55–1,60$, während die 1,50$-Marke die erste Verteidigungslinie ist, falls der Preis den Ausbruch erneut testet. (CoinStats)
Das Derivate-Orderbuch weitet sich parallel zum Preis aus: Das gemeldete Open Interest bei XRP-Futures ist um etwa 19% gestiegen, während Short-Liquidationen den überwiegenden Großteil der jüngsten Liquidationen ausmachten. Das bestätigt eine aggressive Positionierung hinter der Bewegung, aber es bedeutet auch, dass ein gescheiterter Ausbruch zu erhöhter Volatilität in beide Richtungen führen kann. (CoinStats)
Es gibt außerdem ein Fenster für einen fundamentalen Katalysator: XRP-Spot-ETFs haben eine gemeldete 10-Wochen-Streak mit aufeinanderfolgenden wöchentlichen Zuflüssen beibehalten, während für die XRPL um den 29. September herum ein Batch V1.1-Upgrade geplant ist. Die Kombination aus sich verbessernder technischer Struktur und institutionellen/ledgerbezogenen Entwicklungen macht 1,55–1,60$ zur Zone, die ich für eine Bestätigung im Blick behalten würde, statt der aktuellen Bewegung blind hinterherzulaufen. (Coin Edition)
🎯 Wichtige Levels
* 🔴 1,55–1,60 — Ausbruch / Liquiditätszone
* 🚀 1,75–1,80 — nächster Widerstand nach oben
* 🟢 1,50 — unmittelbarer Support
* 🟢 1,45–1,47 — stärkerer Retest-Bereich
* 🔻 1,36 — wichtiger struktureller Support
Der Ausbruch ist interessant. Der Retest ist dort, wo die Informationen sind. 📊⚡
70
·
--
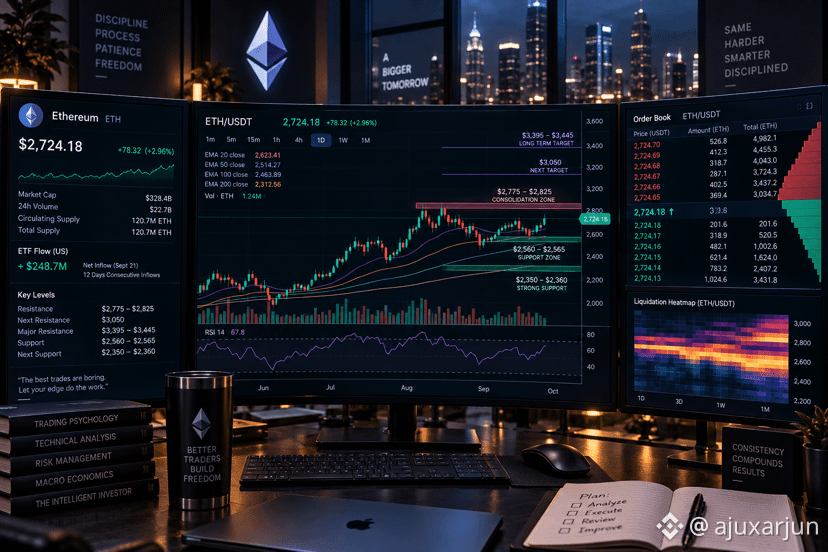
⚡ $ETH HAT DIE BULL-FLAGGE DURCHBROCHEN — $3.050 ALS NÄCHSTES?
$ETH wird derzeit bei rund $2.725 gehandelt, nachdem es die $2.661,52 Widerstandsmarke überwunden hat, die die jüngste Konsolidierung begrenzte. Reuters’ technische Analyse sieht darin einen Ausbruch aus einer Bull-Flag-Struktur, mit einem gemessenen Kursziel bei etwa $3.050 und einer Zwischen-Konsolidierungszone bei rund $2.775–$2.825. (Reuters)
Das Momentum-Bild ist stark, aber der Markt ist überdehnt. ETH liegt über seinen wichtigen gleitenden Durchschnitten, während die RSI-Werte sich dem oberen Bereich nähern; daher ist $2.775–$2.825 die entscheidende Zone, die man im Blick behalten sollte — für entweder Fortsetzung oder Zurückweisung. (The Cryptonomist)
Die Zuflüsse liefern zusätzlichen Treibstoff: Spot-Ether-ETFs sollen am 21. September etwa $270 Mio. Zuflüsse verzeichnet haben, den stärksten Einzeltageszufluss im Jahr 2026 laut jüngsten Berichten. Gleichzeitig bleibt ETH stark anfällig für die breitere Risiko-Stimmung und die vom Bitcoin angeführte Marktbewegung, daher ist Bestätigung wichtiger als dem Momentum hinterherzulaufen. (FinanceFeeds)
🎯 Niveaus, die ich im Blick habe
* 🔥 $2.775–$2.825 — unmittelbarer Widerstand / Ausbruch-Bestätigung
* 🚀 $3.050 — gemessenes Ausbruchsziel
* 🟣 $3.395–$3.445 — bedeutender Widerstand auf höheren Zeitebenen
* 🟢 $2.560–$2.565 — erster großer Support
* 🔻 $2.350–$2.360 — tieferer struktureller Support
Ausbruch bestätigt? Oder erst noch ein Retest, bevor die nächste Etappe startet? 📊⚡
⚡ $ETH HAT DIE BULL-FLAGGE DURCHBROCHEN — $3.050 ALS NÄCHSTES?
$ETH wird derzeit bei rund $2.725 gehandelt, nachdem es die $2.661,52 Widerstandsmarke überwunden hat, die die jüngste Konsolidierung begrenzte. Reuters’ technische Analyse sieht darin einen Ausbruch aus einer Bull-Flag-Struktur, mit einem gemessenen Kursziel bei etwa $3.050 und einer Zwischen-Konsolidierungszone bei rund $2.775–$2.825. (Reuters)
Das Momentum-Bild ist stark, aber der Markt ist überdehnt. ETH liegt über seinen wichtigen gleitenden Durchschnitten, während die RSI-Werte sich dem oberen Bereich nähern; daher ist $2.775–$2.825 die entscheidende Zone, die man im Blick behalten sollte — für entweder Fortsetzung oder Zurückweisung. (The Cryptonomist)
Die Zuflüsse liefern zusätzlichen Treibstoff: Spot-Ether-ETFs sollen am 21. September etwa $270 Mio. Zuflüsse verzeichnet haben, den stärksten Einzeltageszufluss im Jahr 2026 laut jüngsten Berichten. Gleichzeitig bleibt ETH stark anfällig für die breitere Risiko-Stimmung und die vom Bitcoin angeführte Marktbewegung, daher ist Bestätigung wichtiger als dem Momentum hinterherzulaufen. (FinanceFeeds)
🎯 Niveaus, die ich im Blick habe
* 🔥 $2.775–$2.825 — unmittelbarer Widerstand / Ausbruch-Bestätigung
* 🚀 $3.050 — gemessenes Ausbruchsziel
* 🟣 $3.395–$3.445 — bedeutender Widerstand auf höheren Zeitebenen
* 🟢 $2.560–$2.565 — erster großer Support
* 🔻 $2.350–$2.360 — tieferer struktureller Support
Ausbruch bestätigt? Oder erst noch ein Retest, bevor die nächste Etappe startet? 📊⚡
$ETH wird derzeit bei rund $2.725 gehandelt, nachdem es die $2.661,52 Widerstandsmarke überwunden hat, die die jüngste Konsolidierung begrenzte. Reuters’ technische Analyse sieht darin einen Ausbruch aus einer Bull-Flag-Struktur, mit einem gemessenen Kursziel bei etwa $3.050 und einer Zwischen-Konsolidierungszone bei rund $2.775–$2.825. (Reuters)
Das Momentum-Bild ist stark, aber der Markt ist überdehnt. ETH liegt über seinen wichtigen gleitenden Durchschnitten, während die RSI-Werte sich dem oberen Bereich nähern; daher ist $2.775–$2.825 die entscheidende Zone, die man im Blick behalten sollte — für entweder Fortsetzung oder Zurückweisung. (The Cryptonomist)
Die Zuflüsse liefern zusätzlichen Treibstoff: Spot-Ether-ETFs sollen am 21. September etwa $270 Mio. Zuflüsse verzeichnet haben, den stärksten Einzeltageszufluss im Jahr 2026 laut jüngsten Berichten. Gleichzeitig bleibt ETH stark anfällig für die breitere Risiko-Stimmung und die vom Bitcoin angeführte Marktbewegung, daher ist Bestätigung wichtiger als dem Momentum hinterherzulaufen. (FinanceFeeds)
🎯 Niveaus, die ich im Blick habe
* 🔥 $2.775–$2.825 — unmittelbarer Widerstand / Ausbruch-Bestätigung
* 🚀 $3.050 — gemessenes Ausbruchsziel
* 🟣 $3.395–$3.445 — bedeutender Widerstand auf höheren Zeitebenen
* 🟢 $2.560–$2.565 — erster großer Support
* 🔻 $2.350–$2.360 — tieferer struktureller Support
Ausbruch bestätigt? Oder erst noch ein Retest, bevor die nächste Etappe startet? 📊⚡
3
116
·
--
Übersetzung ansehen
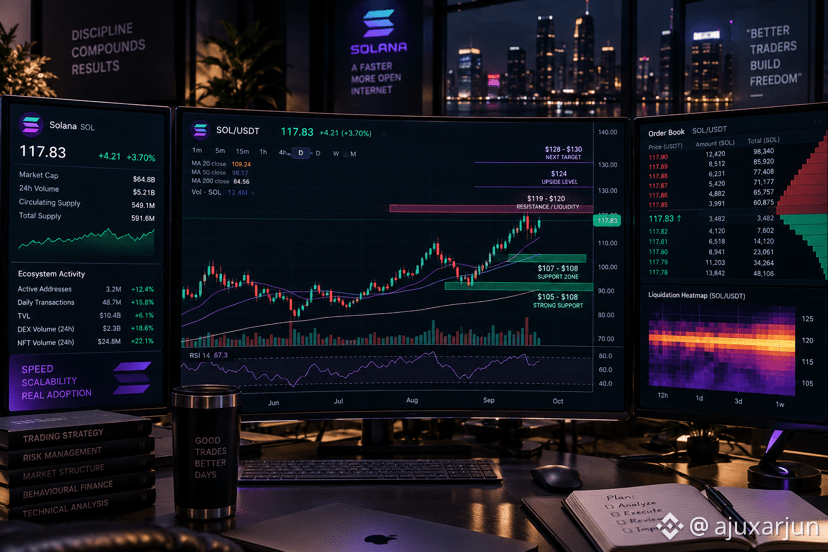
⚡ $SOL IS TESTING THE $120 WALL — BREAKOUT OR REJECTION?
$SOL is trading around $117–$118 after a strong recovery, with the daily structure firmly above its major moving averages. The key battle is now $119–$120, where recent price action has encountered sellers. (Invezz)
Momentum is strong, but the setup is getting extended: daily RSI is around 70, while SOL remains above the 20/50/100/200-day averages. That creates a classic momentum-continuation vs. exhaustion decision point rather than a level to chase blindly. (CoinLore)
The demand backdrop is notable: U.S. spot SOL ETFs recorded approximately $26.1M of net inflows on Sept. 21, extending the reported inflow streak to 12 weeks, while DeFi Development Corp. disclosed an additional 101,381 SOL accumulation. (Invezz)
My systematic framework: acceptance above $120 would put $124 and then $128–$130 into focus; failure at resistance keeps $107–$108 as the first major support zone, with roughly $105 as deeper trend support. 📊
Watch the confirmation. Don’t chase the candle. ⚡📈
⚡ $SOL IS TESTING THE $120 WALL — BREAKOUT OR REJECTION?
$SOL is trading around $117–$118 after a strong recovery, with the daily structure firmly above its major moving averages. The key battle is now $119–$120, where recent price action has encountered sellers. (Invezz)
Momentum is strong, but the setup is getting extended: daily RSI is around 70, while SOL remains above the 20/50/100/200-day averages. That creates a classic momentum-continuation vs. exhaustion decision point rather than a level to chase blindly. (CoinLore)
The demand backdrop is notable: U.S. spot SOL ETFs recorded approximately $26.1M of net inflows on Sept. 21, extending the reported inflow streak to 12 weeks, while DeFi Development Corp. disclosed an additional 101,381 SOL accumulation. (Invezz)
My systematic framework: acceptance above $120 would put $124 and then $128–$130 into focus; failure at resistance keeps $107–$108 as the first major support zone, with roughly $105 as deeper trend support. 📊
Watch the confirmation. Don’t chase the candle. ⚡📈
$SOL is trading around $117–$118 after a strong recovery, with the daily structure firmly above its major moving averages. The key battle is now $119–$120, where recent price action has encountered sellers. (Invezz)
Momentum is strong, but the setup is getting extended: daily RSI is around 70, while SOL remains above the 20/50/100/200-day averages. That creates a classic momentum-continuation vs. exhaustion decision point rather than a level to chase blindly. (CoinLore)
The demand backdrop is notable: U.S. spot SOL ETFs recorded approximately $26.1M of net inflows on Sept. 21, extending the reported inflow streak to 12 weeks, while DeFi Development Corp. disclosed an additional 101,381 SOL accumulation. (Invezz)
My systematic framework: acceptance above $120 would put $124 and then $128–$130 into focus; failure at resistance keeps $107–$108 as the first major support zone, with roughly $105 as deeper trend support. 📊
Watch the confirmation. Don’t chase the candle. ⚡📈
1
76
·
--
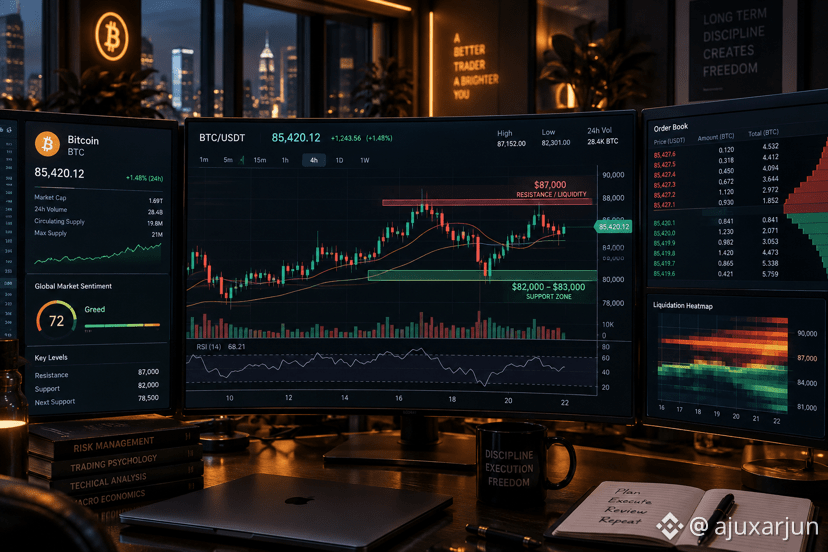
🚨 $BTC IST WIEDER ÜBER $85K — ABER DIE NÄCHSTE BEWEGUNG ZÄHLT
$BTC ist scharf in den Bereich $85K–$87K zurückgeprallt, wobei der Kurs zuletzt grob $87K erreicht hat, bevor er wieder zurücksetzte. Die übergeordnete Struktur bleibt konstruktiv, aber der Schwung ist zunehmend überdehnt: Eine aktuelle technische Auswertung verortet den täglichen RSI bei etwa 69, während die Fear & Greed-Kennzahl des Marktes in einem Extrem-Greed-Bereich liegt. (The Cryptonomist)
Der entscheidende Kampf ist nun der Widerstand/Liquiditätsbereich bei $87.000. Ein sauberer Ausbruch und die Akzeptanz oberhalb dieser Zone würden die bullische Struktur stärken; eine Zurückweisung könnte den Kurs zurück in Richtung der Unterstützung bei $82.000–$83.000 schicken, die derzeit als wichtiger Bereich für Käufer beobachtet wird. (Moneycontrol)
Auch institutionelle Zuflüsse spielen mit: Strategy hat kürzlich etwa 950 BTC (~$75–76 Mio.) hinzugefügt, während aktuelle Berichte auf bedeutende Zuflüsse in Spot-Bitcoin-ETFs hinwiesen. Gleichzeitig reagiert BTC sensibel auf die allgemeine Risikostimmung, Treasury-Renditen und geopolitische Entwicklungen, daher birgt das Nachjagen einer verlängerten Kerze zusätzliches Volatilitätsrisiko. (The Wall Street Journal)
Mein Rahmen: bullisch, solange die Struktur auf höheren Zeitebenen hält, aber ich möchte eine Bestätigung statt blind in den Widerstand zu kaufen. 📊⚡
🎯 Wichtige Levels
* 🔴 $87,000 — Ausbruch / Liquiditätszone
* 🟢 $82,000–$83,000 — wichtigste Unterstützung
* 🟡 $78,500 — tieferer Bereich für Invalidierung
BTC-Setup: Ausbruch-Bestätigung > emotionales FOMO. 📈
🚨 $BTC IST WIEDER ÜBER $85K — ABER DIE NÄCHSTE BEWEGUNG ZÄHLT
$BTC ist scharf in den Bereich $85K–$87K zurückgeprallt, wobei der Kurs zuletzt grob $87K erreicht hat, bevor er wieder zurücksetzte. Die übergeordnete Struktur bleibt konstruktiv, aber der Schwung ist zunehmend überdehnt: Eine aktuelle technische Auswertung verortet den täglichen RSI bei etwa 69, während die Fear & Greed-Kennzahl des Marktes in einem Extrem-Greed-Bereich liegt. (The Cryptonomist)
Der entscheidende Kampf ist nun der Widerstand/Liquiditätsbereich bei $87.000. Ein sauberer Ausbruch und die Akzeptanz oberhalb dieser Zone würden die bullische Struktur stärken; eine Zurückweisung könnte den Kurs zurück in Richtung der Unterstützung bei $82.000–$83.000 schicken, die derzeit als wichtiger Bereich für Käufer beobachtet wird. (Moneycontrol)
Auch institutionelle Zuflüsse spielen mit: Strategy hat kürzlich etwa 950 BTC (~$75–76 Mio.) hinzugefügt, während aktuelle Berichte auf bedeutende Zuflüsse in Spot-Bitcoin-ETFs hinwiesen. Gleichzeitig reagiert BTC sensibel auf die allgemeine Risikostimmung, Treasury-Renditen und geopolitische Entwicklungen, daher birgt das Nachjagen einer verlängerten Kerze zusätzliches Volatilitätsrisiko. (The Wall Street Journal)
Mein Rahmen: bullisch, solange die Struktur auf höheren Zeitebenen hält, aber ich möchte eine Bestätigung statt blind in den Widerstand zu kaufen. 📊⚡
🎯 Wichtige Levels
* 🔴 $87,000 — Ausbruch / Liquiditätszone
* 🟢 $82,000–$83,000 — wichtigste Unterstützung
* 🟡 $78,500 — tieferer Bereich für Invalidierung
BTC-Setup: Ausbruch-Bestätigung > emotionales FOMO. 📈
$BTC ist scharf in den Bereich $85K–$87K zurückgeprallt, wobei der Kurs zuletzt grob $87K erreicht hat, bevor er wieder zurücksetzte. Die übergeordnete Struktur bleibt konstruktiv, aber der Schwung ist zunehmend überdehnt: Eine aktuelle technische Auswertung verortet den täglichen RSI bei etwa 69, während die Fear & Greed-Kennzahl des Marktes in einem Extrem-Greed-Bereich liegt. (The Cryptonomist)
Der entscheidende Kampf ist nun der Widerstand/Liquiditätsbereich bei $87.000. Ein sauberer Ausbruch und die Akzeptanz oberhalb dieser Zone würden die bullische Struktur stärken; eine Zurückweisung könnte den Kurs zurück in Richtung der Unterstützung bei $82.000–$83.000 schicken, die derzeit als wichtiger Bereich für Käufer beobachtet wird. (Moneycontrol)
Auch institutionelle Zuflüsse spielen mit: Strategy hat kürzlich etwa 950 BTC (~$75–76 Mio.) hinzugefügt, während aktuelle Berichte auf bedeutende Zuflüsse in Spot-Bitcoin-ETFs hinwiesen. Gleichzeitig reagiert BTC sensibel auf die allgemeine Risikostimmung, Treasury-Renditen und geopolitische Entwicklungen, daher birgt das Nachjagen einer verlängerten Kerze zusätzliches Volatilitätsrisiko. (The Wall Street Journal)
Mein Rahmen: bullisch, solange die Struktur auf höheren Zeitebenen hält, aber ich möchte eine Bestätigung statt blind in den Widerstand zu kaufen. 📊⚡
🎯 Wichtige Levels
* 🔴 $87,000 — Ausbruch / Liquiditätszone
* 🟢 $82,000–$83,000 — wichtigste Unterstützung
* 🟡 $78,500 — tieferer Bereich für Invalidierung
BTC-Setup: Ausbruch-Bestätigung > emotionales FOMO. 📈
1
124
Anmelden und weiter Inhalte entdecken
Krypto-Nutzer weltweit auf Binance Square kennenlernen
⚡️ Bleib in Sachen Krypto stets am Puls.
💬 Die weltgrößte Kryptobörse vertraut darauf.
👍 Erhalte verlässliche Einblicke von verifizierten Creators.
E-Mail-Adresse/Telefonnummer
Trendthemen
AIStocksWhatNext
874,300 Aufrufe
6,580 Kommentare
Teile & gewinne Traffic-Rewards in unserer angesagten Hashtag-Kampagne
✨Thema: Welche anderen Investitionsmöglichkeiten gibt es noch, während KI-Aktien weiter steigen?
👉So machst du mit:
Veröffentliche einen kurzen Beitrag oder Artikel mit dem Hashtag #AIStocksWhatNext
Teile, ob du bullisch oder bärisch bist, und poste deine KI-Aktienbestände oder Trades – die Nutzung des Trade-Widgets kann deine Berechtigung verbessern.
Du kannst deinen Beitrag auch stärken, indem du Daten oder Diagramme teilst und KI-generierte Bilder vermeidest.
✍️Erstelle Inhalte basierend auf den folgenden Blickwinkeln:
- Nvidia sagt, dass sich der Chip-Umsatz im nächsten Jahr verdoppeln wird, und die führenden KI-Unternehmen erreichen weiterhin Rekordumsätze – der Rechenaufwand dahinter ist ebenso beeindruckend. Verläuft die Nachfrage nach KI wirklich gerade erst so richtig, oder geht es nur noch eine Weile weiter? KI-Aktien steigen derzeit branchenweit. Ist das ein echter Ausbruch oder nur ein kurzfristiger Rückprall?
- Branchenführer fordern dazu auf, die Entwicklung von KI zu verlangsamen, während Trump plant, eine „AI Force“ aufzubauen, und behauptet, KI könne in der Zukunft 25% des US-BIP ausmachen. Auf welcher Seite stehst du? Wird staatliche Unterstützung ein langfristiger Gewinn für KI-Aktien sein?
- Kaufst du KI-Aktien? Teile deinen KI-bezogenen Trade/deine Bestände mit unserem Trade-Sharing-Widget.
⏰Kampagnenzeitraum:
- 2026-09-22 7:00 - 2026-09-24 4:00 UTC
🎁Belohnung:
- Qualifizierte Beiträge, die die oben genannten Richtlinien einhalten und mehr als 100 Wörter enthalten, werden überprüft und können möglicherweise einen zufälligen Traffic-Boost von 500 bis 3.000 Views erhalten. Du erhältst eine Benachrichtigung von deiner Feed-Sekretärin, wenn dein Beitrag ausgewählt wurde.
- Erhalte die Chance, dass dein Artikel auf Binance Square Official vorgestellt wird
Brauchst du Ideen für deinen Beitrag? Besuche die Thema-Seite #AIStocksWhatNext oder die Square Guide on How to Post for Better Reach.
Binance Square Official
·582 Likes
·1.7M Aufrufe
BitcoinRejectedAt$87,300Twice
0 Aufrufe
0 Kommentare
BCHJumps28%OnCMEFuturesListing
10,061 Aufrufe
489 Kommentare