
AirTrader9
4 Beiträge

AirTrader9
Melden
Nutzer blockieren
AirTrader9 crypto 📊 Crypto Trader 📊 Crypto Trader | Market Analyst |
2 Following
2 Follower
3 Like gegeben
Beiträge
·
--
Übersetzung ansehen
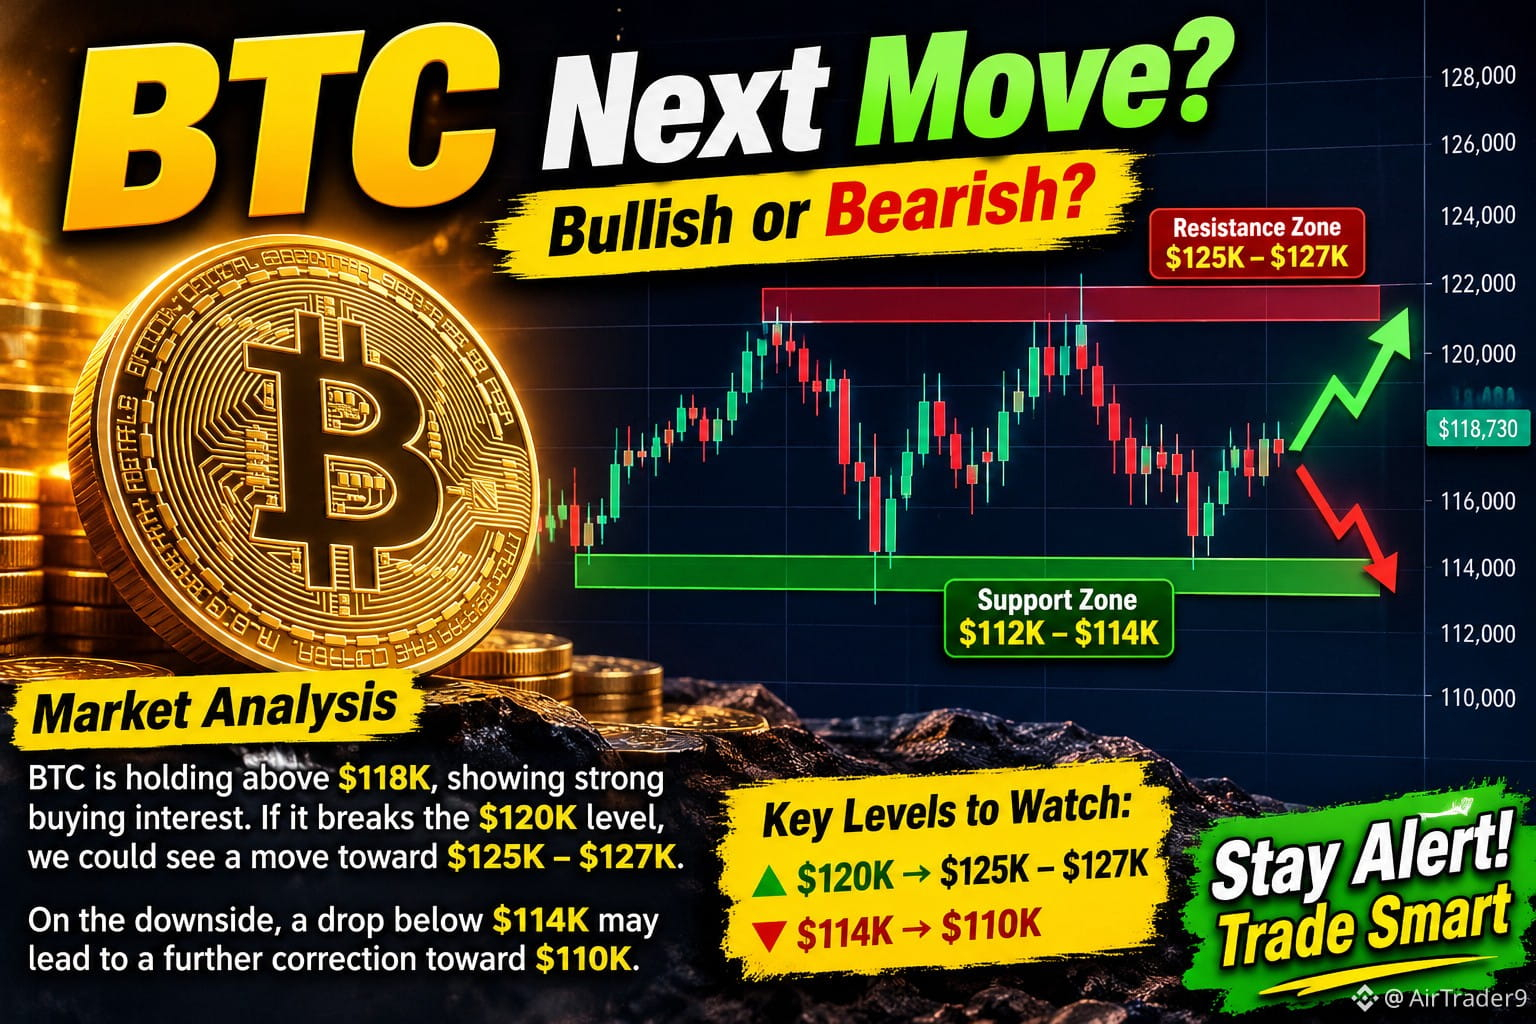
$BTC is showing interesting market activity, and the next move could be very important! 🟠
$BTC bulls are trying to regain control, but sellers are also watching the key resistance zones closely.
📊 Key Levels to Watch:
🟢 Resistance: $120,000
🚀 Bullish target: $125,000–$127,000
🔴 Support: $114,000
⚠️ Breakdown target: $110,000
My Trading View:
If BTC breaks above resistance with strong buying volume, we could see another bullish rally. However, if sellers take control and BTC loses support, a deeper correction may follow.
💡 Don't chase the market blindly. Wait for confirmation, manage your risk, and trade smart!
🔥 What do you think?
Are we going to see BTC at $125K+ or another big correction?
👇 Comment your BTC target!
#BTC #bitcoin #BitcoinAnalysis #CryptoMarket #Binance
{future}(BTCUSDT)
$BTC is showing interesting market activity, and the next move could be very important! 🟠
$BTC bulls are trying to regain control, but sellers are also watching the key resistance zones closely.
📊 Key Levels to Watch:
🟢 Resistance: $120,000
🚀 Bullish target: $125,000–$127,000
🔴 Support: $114,000
⚠️ Breakdown target: $110,000
My Trading View:
If BTC breaks above resistance with strong buying volume, we could see another bullish rally. However, if sellers take control and BTC loses support, a deeper correction may follow.
💡 Don't chase the market blindly. Wait for confirmation, manage your risk, and trade smart!
🔥 What do you think?
Are we going to see BTC at $125K+ or another big correction?
👇 Comment your BTC target!
#BTC #bitcoin #BitcoinAnalysis #CryptoMarket #Binance
$BTC bulls are trying to regain control, but sellers are also watching the key resistance zones closely.
📊 Key Levels to Watch:
🟢 Resistance: $120,000
🚀 Bullish target: $125,000–$127,000
🔴 Support: $114,000
⚠️ Breakdown target: $110,000
My Trading View:
If BTC breaks above resistance with strong buying volume, we could see another bullish rally. However, if sellers take control and BTC loses support, a deeper correction may follow.
💡 Don't chase the market blindly. Wait for confirmation, manage your risk, and trade smart!
🔥 What do you think?
Are we going to see BTC at $125K+ or another big correction?
👇 Comment your BTC target!
#BTC #bitcoin #BitcoinAnalysis #CryptoMarket #Binance
84
·
--
Übersetzung ansehen
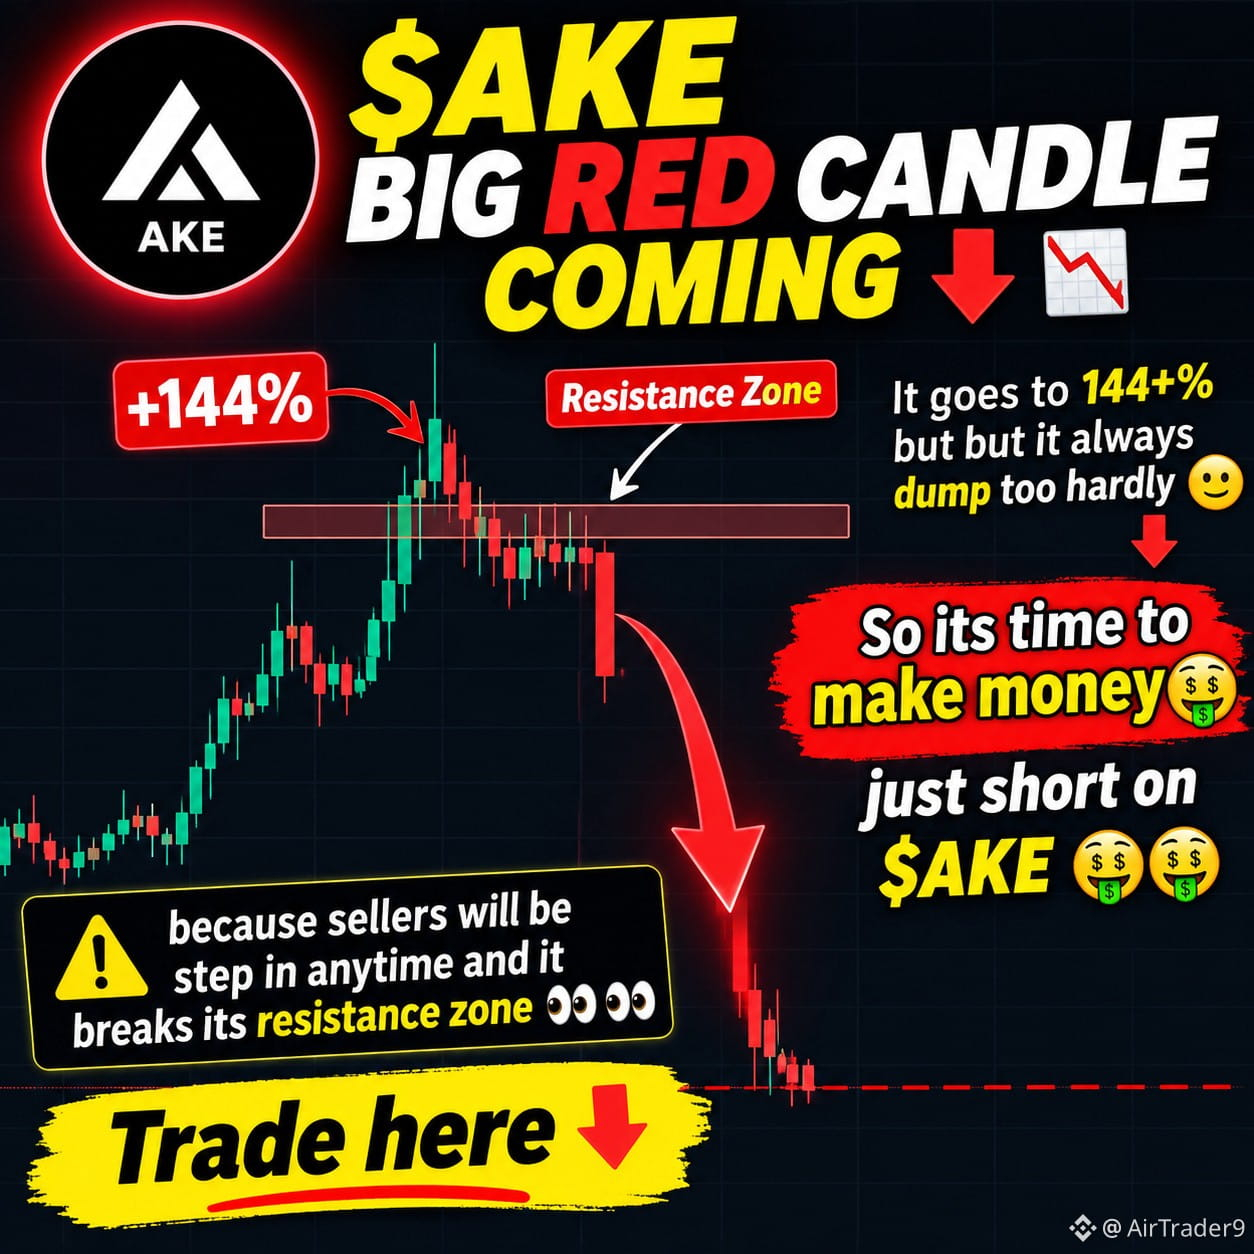
# 🚨 $AKE — Is a Big Red Candle Coming? 📉🔴
Hello traders! 👋
$AKE has made an impressive move, pumping more than **144%+** recently. 🚀 But here's the big question: can this bullish momentum continue, or are sellers preparing to take control?
After such a strong rally, profit-taking could increase, and selling pressure may appear at important resistance levels.
👀 **Things I'm watching on $AKE :**
- 🔴 A possible rejection near the resistance zone.
- 📉 Increasing selling pressure.
- ⚠️ A potential bearish breakdown.
- 📊 Trading volume and confirmation before entering a position.
If sellers step in and price confirms a breakdown, a short setup could become interesting. However, nothing is guaranteed in crypto — always use a stop-loss and manage your risk.
💬 **What's your opinion?**
Are you bullish on $AKE, or do you think a big red candle is coming?
👇 Share your thoughts!
{future}(AKEUSDT)
#AKE #crypto #trading #ShortTrading #Altcoins
# 🚨 $AKE — Is a Big Red Candle Coming? 📉🔴
Hello traders! 👋
$AKE has made an impressive move, pumping more than **144%+** recently. 🚀 But here's the big question: can this bullish momentum continue, or are sellers preparing to take control?
After such a strong rally, profit-taking could increase, and selling pressure may appear at important resistance levels.
👀 **Things I'm watching on $AKE :**
- 🔴 A possible rejection near the resistance zone.
- 📉 Increasing selling pressure.
- ⚠️ A potential bearish breakdown.
- 📊 Trading volume and confirmation before entering a position.
If sellers step in and price confirms a breakdown, a short setup could become interesting. However, nothing is guaranteed in crypto — always use a stop-loss and manage your risk.
💬 **What's your opinion?**
Are you bullish on $AKE , or do you think a big red candle is coming?
👇 Share your thoughts!
#AKE #crypto #trading #ShortTrading #Altcoins
Hello traders! 👋
$AKE has made an impressive move, pumping more than **144%+** recently. 🚀 But here's the big question: can this bullish momentum continue, or are sellers preparing to take control?
After such a strong rally, profit-taking could increase, and selling pressure may appear at important resistance levels.
👀 **Things I'm watching on $AKE :**
- 🔴 A possible rejection near the resistance zone.
- 📉 Increasing selling pressure.
- ⚠️ A potential bearish breakdown.
- 📊 Trading volume and confirmation before entering a position.
If sellers step in and price confirms a breakdown, a short setup could become interesting. However, nothing is guaranteed in crypto — always use a stop-loss and manage your risk.
💬 **What's your opinion?**
Are you bullish on $AKE , or do you think a big red candle is coming?
👇 Share your thoughts!
#AKE #crypto #trading #ShortTrading #Altcoins
373
·
--
Übersetzung ansehen
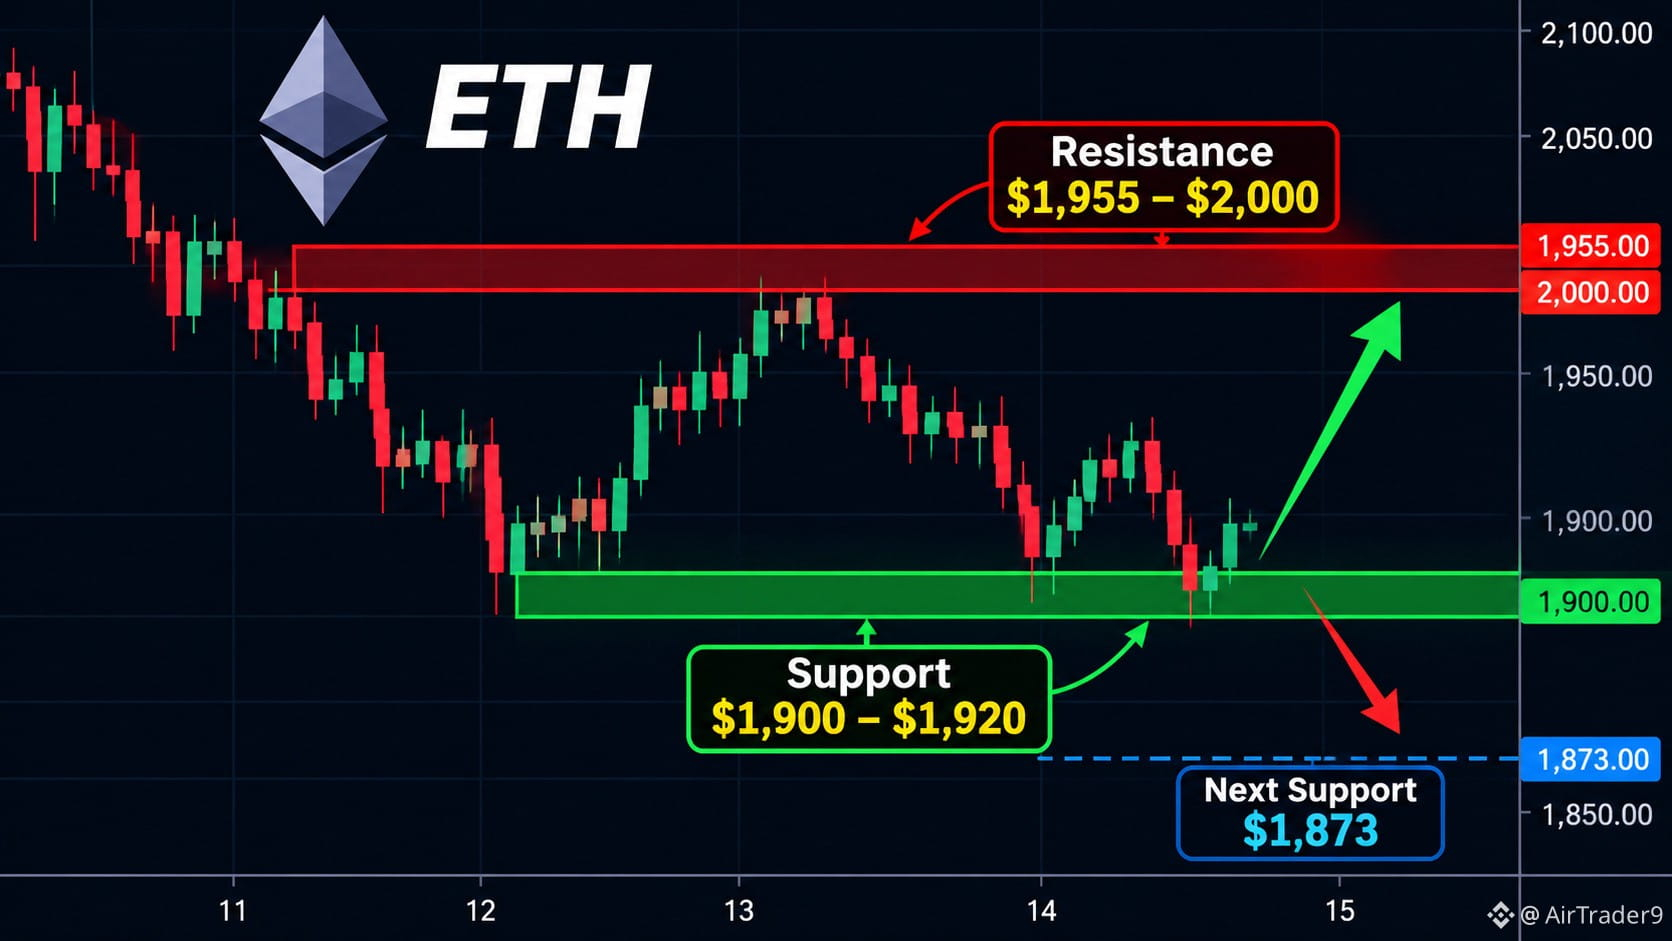
🚨 ($ETH ) LATEST MARKET ANALYSIS**
📉 $ETH is facing strong selling pressure and currently showing a bearish short-term structure.
**Key levels to watch:**
- 🟢 Support: $1,900–$1,920
- 🔵 Next support: $1,873
- 🔴 Resistance: $1,955–$2,000
**Market outlook:**
If $ETH holds the $1,900 support zone, we could see a relief bounce toward $1,955–$2,000.
However, a clean breakdown below $1,900 could trigger another downside move toward $1,873.
**My view:** Stay cautious. Wait for confirmation before entering a trade. A breakout above resistance could change the short-term trend.
#ETH #Ethereum #CryptoAnalysis #Binance #TradingSignals
{spot}(ETHUSDT)
🚨 ($ETH ) LATEST MARKET ANALYSIS**
📉 $ETH is facing strong selling pressure and currently showing a bearish short-term structure.
**Key levels to watch:**
- 🟢 Support: $1,900–$1,920
- 🔵 Next support: $1,873
- 🔴 Resistance: $1,955–$2,000
**Market outlook:**
If $ETH holds the $1,900 support zone, we could see a relief bounce toward $1,955–$2,000.
However, a clean breakdown below $1,900 could trigger another downside move toward $1,873.
**My view:** Stay cautious. Wait for confirmation before entering a trade. A breakout above resistance could change the short-term trend.
#ETH #Ethereum #CryptoAnalysis #Binance #TradingSignals
📉 $ETH is facing strong selling pressure and currently showing a bearish short-term structure.
**Key levels to watch:**
- 🟢 Support: $1,900–$1,920
- 🔵 Next support: $1,873
- 🔴 Resistance: $1,955–$2,000
**Market outlook:**
If $ETH holds the $1,900 support zone, we could see a relief bounce toward $1,955–$2,000.
However, a clean breakdown below $1,900 could trigger another downside move toward $1,873.
**My view:** Stay cautious. Wait for confirmation before entering a trade. A breakout above resistance could change the short-term trend.
#ETH #Ethereum #CryptoAnalysis #Binance #TradingSignals
116
·
--
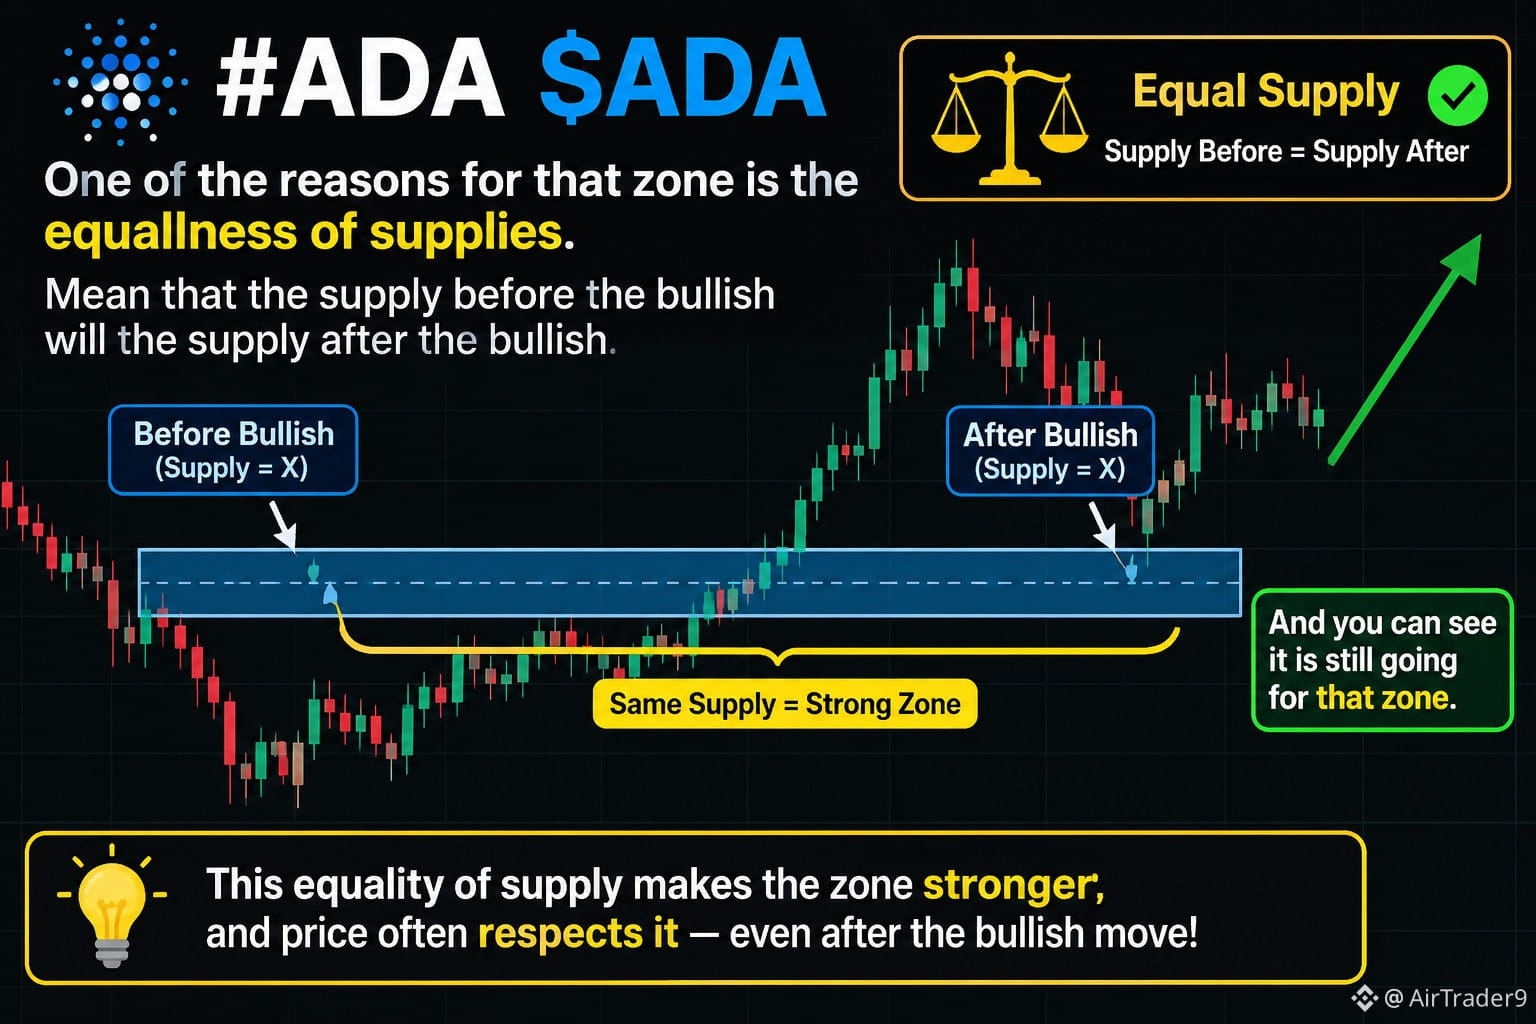
$ADA Einer der wichtigsten Gründe für diese bedeutende Zone im Chart von **Cardano ($ADA )** ist das Gleichgewicht des Angebots.
Einfach ausgedrückt ist das Angebot vor der Aufwärtsbewegung ungefähr gleich groß wie das Angebot danach. Dadurch entsteht ein interessantes Gleichgewicht am Markt, und die Zone ist es wert, beobachtet zu werden.
Wie wir im Chart sehen können, bewegt sich $ADA noch immer auf diese Zone zu. Wenn der Kurs sie respektiert, könnte sie zu einem wichtigen Bereich für eine mögliche Reaktion werden.
**Behalte dieses Niveau im Auge.** Marktstruktur, Volumen und Kursbewegungen werden wichtig sein, um den nächsten Schritt zu bestätigen.
#WhatWillDriveCryptoandStocks’NextRebound? #Anthropic’s6xIPODemandSignalsPotentialRecordRaise
{spot}(ADAUSDT)
$ADA Einer der wichtigsten Gründe für diese bedeutende Zone im Chart von **Cardano ($ADA )** ist das Gleichgewicht des Angebots.
Einfach ausgedrückt ist das Angebot vor der Aufwärtsbewegung ungefähr gleich groß wie das Angebot danach. Dadurch entsteht ein interessantes Gleichgewicht am Markt, und die Zone ist es wert, beobachtet zu werden.
Wie wir im Chart sehen können, bewegt sich $ADA noch immer auf diese Zone zu. Wenn der Kurs sie respektiert, könnte sie zu einem wichtigen Bereich für eine mögliche Reaktion werden.
**Behalte dieses Niveau im Auge.** Marktstruktur, Volumen und Kursbewegungen werden wichtig sein, um den nächsten Schritt zu bestätigen.
#WhatWillDriveCryptoandStocks’NextRebound? #Anthropic’s6xIPODemandSignalsPotentialRecordRaise
Einfach ausgedrückt ist das Angebot vor der Aufwärtsbewegung ungefähr gleich groß wie das Angebot danach. Dadurch entsteht ein interessantes Gleichgewicht am Markt, und die Zone ist es wert, beobachtet zu werden.
Wie wir im Chart sehen können, bewegt sich $ADA noch immer auf diese Zone zu. Wenn der Kurs sie respektiert, könnte sie zu einem wichtigen Bereich für eine mögliche Reaktion werden.
**Behalte dieses Niveau im Auge.** Marktstruktur, Volumen und Kursbewegungen werden wichtig sein, um den nächsten Schritt zu bestätigen.
#WhatWillDriveCryptoandStocks’NextRebound? #Anthropic’s6xIPODemandSignalsPotentialRecordRaise
1
3
563
Anmelden und weiter Inhalte entdecken
Krypto-Nutzer weltweit auf Binance Square kennenlernen
⚡️ Bleib in Sachen Krypto stets am Puls.
💬 Die weltgrößte Kryptobörse vertraut darauf.
👍 Erhalte verlässliche Einblicke von verifizierten Creators.
E-Mail-Adresse/Telefonnummer
Trendthemen
WhoWillSucceedJensenHuangatNvidia?
121,639 Aufrufe
1,413 Kommentare
Nvidia: Keine Gespräche über CEO-Nachfolge – Petition „Stand With Jensen“ erreicht mehr als 77.900 Unterschriften
Binance News
·30 Likes
·47.7k Aufrufe
WhatWillDriveCryptoandStocks’NextRebound?
504,273 Aufrufe
3,289 Kommentare
BitcoinActiveSupplyInProfitDropsBelow45%
49,611 Aufrufe
567 Kommentare