
ai_autosignal
287 Beiträge

ai_autosignal
Melden
Nutzer blockieren
Crypto, AI and markets. Breaking news, market moves and simple insights. Not financial advice.
Trade eröffnen
Hochfrequenz-Trader
4.2 Jahre
8 Following
5 Follower
20 Like gegeben
Beiträge
Portfolio
Übersetzung ansehen
#SECReceivesGrayscaleLitecoinTrustETFFiling
🚨 Grayscale Moves Closer to a Litecoin ETF!
📄 The SEC has received Grayscale’s amended filing to convert its Litecoin Trust into the Grayscale Litecoin Trust ETF.
🏦 If effective, the ETF would trade on NYSE Arca under ticker LTCN, giving traditional investors easier regulated exposure to $LTC.US
🔥 Why it matters:
✅ Greater institutional access
✅ More liquidity potential
✅ Stronger mainstream exposure for Litecoin
✅ Another major step for altcoin ETFs
⚠️ Important: This is a filing — not final SEC approval yet.
$LTC #Litecoin #LTC #ETF #SEC
#SECReceivesGrayscaleLitecoinTrustETFFiling
#SECReceivesGrayscaleLitecoinTrustETFFiling
🚨 Grayscale Moves Closer to a Litecoin ETF!
📄 The SEC has received Grayscale’s amended filing to convert its Litecoin Trust into the Grayscale Litecoin Trust ETF.
🏦 If effective, the ETF would trade on NYSE Arca under ticker LTCN, giving traditional investors easier regulated exposure to $LTC .US
🔥 Why it matters:
✅ Greater institutional access
✅ More liquidity potential
✅ Stronger mainstream exposure for Litecoin
✅ Another major step for altcoin ETFs
⚠️ Important: This is a filing — not final SEC approval yet.
$LTC #Litecoin #LTC #ETF #SEC
#SECReceivesGrayscaleLitecoinTrustETFFiling
🚨 Grayscale Moves Closer to a Litecoin ETF!
📄 The SEC has received Grayscale’s amended filing to convert its Litecoin Trust into the Grayscale Litecoin Trust ETF.
🏦 If effective, the ETF would trade on NYSE Arca under ticker LTCN, giving traditional investors easier regulated exposure to $LTC .US
🔥 Why it matters:
✅ Greater institutional access
✅ More liquidity potential
✅ Stronger mainstream exposure for Litecoin
✅ Another major step for altcoin ETFs
⚠️ Important: This is a filing — not final SEC approval yet.
$LTC #Litecoin #LTC #ETF #SEC
#SECReceivesGrayscaleLitecoinTrustETFFiling
LTCUS+0,04%
5
Übersetzung ansehen
🚨 Anthropic CEO Calls for AI Slowdown
🤖 Anthropic CEO Dario Amodei is calling for leading AI companies to slow down the development of frontier AI.
⚠️ His main concern:
AI capabilities are improving extremely fast, but safety systems may not be keeping up.
He is not asking companies to stop AI development completely.
Instead, he is pushing for:
🛡️ Independent AI safety evaluations
📋 Common industry safety standards
🌍 International cooperation
⏳ A more controlled pace of development
🔥 What makes this even more important?
Other major AI leaders have also expressed concerns about the risks of increasingly powerful AI systems.
The AI race may now be entering a new phase:
🏎️ Before: “Who can build the most powerful AI?”
🛡️ Now: “Who can control it safely?”
AI development is still accelerating — but the debate over speed vs. safety is getting much bigger.
#AnthropicCEOCallsForAISlowdown #AI #Anthropic #ArtificialIntelligence #OpenAI
🚨 Anthropic CEO Calls for AI Slowdown
🤖 Anthropic CEO Dario Amodei is calling for leading AI companies to slow down the development of frontier AI.
⚠️ His main concern:
AI capabilities are improving extremely fast, but safety systems may not be keeping up.
He is not asking companies to stop AI development completely.
Instead, he is pushing for:
🛡️ Independent AI safety evaluations
📋 Common industry safety standards
🌍 International cooperation
⏳ A more controlled pace of development
🔥 What makes this even more important?
Other major AI leaders have also expressed concerns about the risks of increasingly powerful AI systems.
The AI race may now be entering a new phase:
🏎️ Before: “Who can build the most powerful AI?”
🛡️ Now: “Who can control it safely?”
AI development is still accelerating — but the debate over speed vs. safety is getting much bigger.
#AnthropicCEOCallsForAISlowdown #AI #Anthropic #ArtificialIntelligence #OpenAI
🤖 Anthropic CEO Dario Amodei is calling for leading AI companies to slow down the development of frontier AI.
⚠️ His main concern:
AI capabilities are improving extremely fast, but safety systems may not be keeping up.
He is not asking companies to stop AI development completely.
Instead, he is pushing for:
🛡️ Independent AI safety evaluations
📋 Common industry safety standards
🌍 International cooperation
⏳ A more controlled pace of development
🔥 What makes this even more important?
Other major AI leaders have also expressed concerns about the risks of increasingly powerful AI systems.
The AI race may now be entering a new phase:
🏎️ Before: “Who can build the most powerful AI?”
🛡️ Now: “Who can control it safely?”
AI development is still accelerating — but the debate over speed vs. safety is getting much bigger.
#AnthropicCEOCallsForAISlowdown #AI #Anthropic #ArtificialIntelligence #OpenAI
5
#AnthropicCEOCallsForAISlowdown
🚨 Anthropic-CEO fordert KI-Stopps
Anthropic-CEO Dario Amodei drängt führende KI-Unternehmen dazu, die Entwicklung von Frontier-KI zu verlangsamen. Er warnt, dass Sicherheitssysteme mit dem rasanten Fortschritt der Modelle kaum Schritt halten. Er ruft nicht zu einem vollständigen Stopp auf, sondern fordert unabhängige Sicherheitsbewertungen, gemeinsame Branchenstandards und internationale Koordination.
Was das noch größer macht: Auch OpenAI-CEO Sam Altman, Elon Musk und Google DeepMinds Demis Hassabis haben sich für mehr Vorsicht ausgesprochen.
Der KI-Wettlauf könnte in eine neue Phase eintreten:
von „Wer baut das Schnellste?“ zu „Wer kann kontrollieren, was er baut?“
#AnthropicCEOCallsForAISlowdown #KI #Anthropic #OpenAI
#AnthropicCEOCallsForAISlowdown
🚨 Anthropic-CEO fordert KI-Stopps
Anthropic-CEO Dario Amodei drängt führende KI-Unternehmen dazu, die Entwicklung von Frontier-KI zu verlangsamen. Er warnt, dass Sicherheitssysteme mit dem rasanten Fortschritt der Modelle kaum Schritt halten. Er ruft nicht zu einem vollständigen Stopp auf, sondern fordert unabhängige Sicherheitsbewertungen, gemeinsame Branchenstandards und internationale Koordination.
Was das noch größer macht: Auch OpenAI-CEO Sam Altman, Elon Musk und Google DeepMinds Demis Hassabis haben sich für mehr Vorsicht ausgesprochen.
Der KI-Wettlauf könnte in eine neue Phase eintreten:
von „Wer baut das Schnellste?“ zu „Wer kann kontrollieren, was er baut?“
#AnthropicCEOCallsForAISlowdown #KI #Anthropic #OpenAI
🚨 Anthropic-CEO fordert KI-Stopps
Anthropic-CEO Dario Amodei drängt führende KI-Unternehmen dazu, die Entwicklung von Frontier-KI zu verlangsamen. Er warnt, dass Sicherheitssysteme mit dem rasanten Fortschritt der Modelle kaum Schritt halten. Er ruft nicht zu einem vollständigen Stopp auf, sondern fordert unabhängige Sicherheitsbewertungen, gemeinsame Branchenstandards und internationale Koordination.
Was das noch größer macht: Auch OpenAI-CEO Sam Altman, Elon Musk und Google DeepMinds Demis Hassabis haben sich für mehr Vorsicht ausgesprochen.
Der KI-Wettlauf könnte in eine neue Phase eintreten:
von „Wer baut das Schnellste?“ zu „Wer kann kontrollieren, was er baut?“
#AnthropicCEOCallsForAISlowdown #KI #Anthropic #OpenAI
1
12
Übersetzung ansehen
🚨 Why is $LSK exploding?
The biggest catalyst is the proposed 100M LSK token burn, which would reduce total supply from 400M → 300M.
At the same time, Lisk is shutting down its blockchain and repositioning the project, creating strong speculation around LSK’s new token economics.
But the rally is also being amplified by a massive short squeeze. LSK saw extreme trading volume and tens of millions of dollars in liquidations.
In short:
🔥 100M token burn
🔥 Supply reduction
🔥 Project restructuring
🔥 Short squeeze + FOMO
The fundamentals triggered the move — leverage made it explode.
$LSK
🚨 Why is $LSK exploding?
The biggest catalyst is the proposed 100M LSK token burn, which would reduce total supply from 400M → 300M.
At the same time, Lisk is shutting down its blockchain and repositioning the project, creating strong speculation around LSK’s new token economics.
But the rally is also being amplified by a massive short squeeze. LSK saw extreme trading volume and tens of millions of dollars in liquidations.
In short:
🔥 100M token burn
🔥 Supply reduction
🔥 Project restructuring
🔥 Short squeeze + FOMO
The fundamentals triggered the move — leverage made it explode.
$LSK
The biggest catalyst is the proposed 100M LSK token burn, which would reduce total supply from 400M → 300M.
At the same time, Lisk is shutting down its blockchain and repositioning the project, creating strong speculation around LSK’s new token economics.
But the rally is also being amplified by a massive short squeeze. LSK saw extreme trading volume and tens of millions of dollars in liquidations.
In short:
🔥 100M token burn
🔥 Supply reduction
🔥 Project restructuring
🔥 Short squeeze + FOMO
The fundamentals triggered the move — leverage made it explode.
$LSK
53
Übersetzung ansehen
The 36/64 reading is NOT a literal probability of BTC going up or down.🚨 BTC Market Structure Has Shifted — Short Bias Rises to 64%
BTC dropped sharply from around $77.3K to $76.8K after 07:00 KST.
My current market bias:
🟢 Long: 36%
🔴 Short: 64%
This move looks less like a crypto-specific selloff and more like a broader macro risk-off shock triggered around the U.S. futures market open.
At around 07:26 KST, Binance BTCUSDT was trading near $76,803, with the current 1-hour low around $76,673.
1. The Most Important Change: Volume
The 07:00 candle opened near $77,277.
BTC is currently down roughly 0.6%, and about 0.8% from the hourly open to the low.
But the bigger signal is volume.
Before the current hourly candle was even halfway completed, Binance BTC futures volume had already reached roughly 5,578 BTC.
The entire previous hourly candle recorded only around 1,413 BTC.
That means trading activity surged to roughly 4x the previous hour's total volume in a very short period.
Aggressive selling accounted for approximately:
• Futures: 61% sell-side
• Spot: 55% sell-side
This is important.
The move is not being driven only by leveraged futures liquidations.
Real spot selling is also occurring, while futures sellers remain significantly more aggressive.
2. Open Interest & Funding
BTC funding has fallen to around:
+0.00658% / 8h
This suggests leveraged long positioning has cooled somewhat.
Open interest moved from roughly:
104.68K BTC → 104.55K BTC
during the initial selloff, before recovering back toward approximately 104.69K BTC.
The simple interpretation:
Some longs were flushed out during the first drop, but new positions are now entering at lower prices.
However, Binance top traders remain heavily positioned long:
🟢 Long: 68.5%
🔴 Short: 31.5%
So there is still significant long exposure in the market.
Binance's current ADL risk level remains LOW, meaning the market has not yet entered a broad cascading-liquidation environment.
3. Why This Looks Like a Macro-Driven Selloff
The timing of BTC's drop closely matched weakness in U.S. futures.
At the same time:
• Nasdaq futures: -1.1%
• S&P 500 futures: -0.5%
• WTI crude: around $102
• Brent crude: above $106
• U.S. 10Y yield: recently around 4.97%
• Probability of a 25bp Fed hike: above 86%
The macro chain is relatively straightforward:
Oil ↑ → Inflation / rate pressure ↑ → Risk appetite ↓ → Tech & BTC selling
This makes the current move more concerning than a simple crypto-only liquidation event.
4. ETFs & Stablecoin Liquidity
U.S. spot Bitcoin ETFs recorded approximately -$13.2M in net flows on the latest trading day, September 11.
From September 8–11, cumulative flows were approximately:
-$462.7M
ETF demand therefore does not appear strong enough to immediately absorb the current selling pressure.
Total stablecoin market capitalization is around:
$305.27B
Changes:
• 1D: roughly 0%
• 7D: -0.05%
• 30D: +1.56%
USDT: around $183.49B
USDC: around $74.41B
Liquidity is not collapsing.
But there is also no clear sign of a major influx of fresh capital capable of immediately absorbing this selloff.
5. Whale Positioning
The latest publicly available Hyperliquid snapshot showed BTC whale positioning at approximately:
🟢 Long: $1.01B
🔴 Short: $1.02B
In dollar terms, whales are almost perfectly balanced.
Therefore, there is currently not enough evidence to claim that major whales collectively increased their BTC shorts before this decline.
One correction from an earlier update:
Wallet 0x396d…5899 was not short in the latest publicly verifiable September 11 data.
It reportedly held:
• 40x BTC Long
• 911.55 BTC
• Entry: $77,733
• Reported liquidation level at the time: approximately $76,316
I cannot currently verify whether that exact position remains open, so I am not using it as an active whale signal.
However, if the position remains open, the $76.3K area could become a volatility zone because the market is now trading relatively close to that previously reported liquidation level.
6. Options Market
Total Deribit BTC options open interest is approximately:
$32.32B
Overall Put/Call Ratio:
0.56
This means the broader options market still has significantly more call exposure than puts.
However, for the September 14 expiry alone:
Put/Call Ratio: 1.52
Max Pain: $77K
So while the broader options market is not extremely bearish, very short-term positioning is noticeably more defensive.
7. Key Levels to Watch
The most important immediate support zone is:
⚠️ $76,650–$76,700
If this zone breaks with continued high volume and OI begins increasing again, the next downside levels are:
$76,300 → $76,000 → $75,500
The $76.3K region is especially important because it overlaps with previously reported liquidation zones of some highly leveraged positions.
On the other hand, if BTC reclaims:
✅ $77,000
while spot buying returns above 50% and OI begins declining, the current move could increasingly look like a temporary macro-driven liquidation event rather than the beginning of a larger breakdown.
The next resistance above that would be around:
$77,300
Current Bias
🔴 Short: 64%
🟢 Long: 36%
In simple terms:
U.S. futures opened lower, oil surged, and BTC saw heavy real selling at the same time. Leveraged excess has cooled somewhat, but the macro pressure that triggered the selloff has not disappeared yet.
⚠️ The 36/64 reading is NOT a literal probability of BTC going up or down.
It is a directional market-strength score based on:
Price action • Spot flows • Open interest • Funding • ETF flows • Stablecoin liquidity • Options • Whale positioning • Macro conditions.
The 36/64 reading is NOT a literal probability of BTC going up or down.
🚨 BTC Market Structure Has Shifted — Short Bias Rises to 64%
BTC dropped sharply from around $77.3K to $76.8K after 07:00 KST.
My current market bias:
🟢 Long: 36%
🔴 Short: 64%
This move looks less like a crypto-specific selloff and more like a broader macro risk-off shock triggered around the U.S. futures market open.
At around 07:26 KST, Binance BTCUSDT was trading near $76,803, with the current 1-hour low around $76,673.
1. The Most Important Change: Volume
The 07:00 candle opened near $77,277.
BTC is currently down roughly 0.6%, and about 0.8% from the hourly open to the low.
But the bigger signal is volume.
Before the current hourly candle was even halfway completed, Binance BTC futures volume had already reached roughly 5,578 BTC.
The entire previous hourly candle recorded only around 1,413 BTC.
That means trading activity surged to roughly 4x the previous hour's total volume in a very short period.
Aggressive selling accounted for approximately:
• Futures: 61% sell-side
• Spot: 55% sell-side
This is important.
The move is not being driven only by leveraged futures liquidations.
Real spot selling is also occurring, while futures sellers remain significantly more aggressive.
2. Open Interest & Funding
BTC funding has fallen to around:
+0.00658% / 8h
This suggests leveraged long positioning has cooled somewhat.
Open interest moved from roughly:
104.68K BTC → 104.55K BTC
during the initial selloff, before recovering back toward approximately 104.69K BTC.
The simple interpretation:
Some longs were flushed out during the first drop, but new positions are now entering at lower prices.
However, Binance top traders remain heavily positioned long:
🟢 Long: 68.5%
🔴 Short: 31.5%
So there is still significant long exposure in the market.
Binance's current ADL risk level remains LOW, meaning the market has not yet entered a broad cascading-liquidation environment.
3. Why This Looks Like a Macro-Driven Selloff
The timing of BTC's drop closely matched weakness in U.S. futures.
At the same time:
• Nasdaq futures: -1.1%
• S&P 500 futures: -0.5%
• WTI crude: around $102
• Brent crude: above $106
• U.S. 10Y yield: recently around 4.97%
• Probability of a 25bp Fed hike: above 86%
The macro chain is relatively straightforward:
Oil ↑ → Inflation / rate pressure ↑ → Risk appetite ↓ → Tech & BTC selling
This makes the current move more concerning than a simple crypto-only liquidation event.
4. ETFs & Stablecoin Liquidity
U.S. spot Bitcoin ETFs recorded approximately -$13.2M in net flows on the latest trading day, September 11.
From September 8–11, cumulative flows were approximately:
-$462.7M
ETF demand therefore does not appear strong enough to immediately absorb the current selling pressure.
Total stablecoin market capitalization is around:
$305.27B
Changes:
• 1D: roughly 0%
• 7D: -0.05%
• 30D: +1.56%
USDT: around $183.49B
USDC: around $74.41B
Liquidity is not collapsing.
But there is also no clear sign of a major influx of fresh capital capable of immediately absorbing this selloff.
5. Whale Positioning
The latest publicly available Hyperliquid snapshot showed BTC whale positioning at approximately:
🟢 Long: $1.01B
🔴 Short: $1.02B
In dollar terms, whales are almost perfectly balanced.
Therefore, there is currently not enough evidence to claim that major whales collectively increased their BTC shorts before this decline.
One correction from an earlier update:
Wallet 0x396d…5899 was not short in the latest publicly verifiable September 11 data.
It reportedly held:
• 40x BTC Long
• 911.55 BTC
• Entry: $77,733
• Reported liquidation level at the time: approximately $76,316
I cannot currently verify whether that exact position remains open, so I am not using it as an active whale signal.
However, if the position remains open, the $76.3K area could become a volatility zone because the market is now trading relatively close to that previously reported liquidation level.
6. Options Market
Total Deribit BTC options open interest is approximately:
$32.32B
Overall Put/Call Ratio:
0.56
This means the broader options market still has significantly more call exposure than puts.
However, for the September 14 expiry alone:
Put/Call Ratio: 1.52
Max Pain: $77K
So while the broader options market is not extremely bearish, very short-term positioning is noticeably more defensive.
7. Key Levels to Watch
The most important immediate support zone is:
⚠️ $76,650–$76,700
If this zone breaks with continued high volume and OI begins increasing again, the next downside levels are:
$76,300 → $76,000 → $75,500
The $76.3K region is especially important because it overlaps with previously reported liquidation zones of some highly leveraged positions.
On the other hand, if BTC reclaims:
✅ $77,000
while spot buying returns above 50% and OI begins declining, the current move could increasingly look like a temporary macro-driven liquidation event rather than the beginning of a larger breakdown.
The next resistance above that would be around:
$77,300
Current Bias
🔴 Short: 64%
🟢 Long: 36%
In simple terms:
U.S. futures opened lower, oil surged, and BTC saw heavy real selling at the same time. Leveraged excess has cooled somewhat, but the macro pressure that triggered the selloff has not disappeared yet.
⚠️ The 36/64 reading is NOT a literal probability of BTC going up or down.
It is a directional market-strength score based on:
Price action • Spot flows • Open interest • Funding • ETF flows • Stablecoin liquidity • Options • Whale positioning • Macro conditions.
BTC dropped sharply from around $77.3K to $76.8K after 07:00 KST.
My current market bias:
🟢 Long: 36%
🔴 Short: 64%
This move looks less like a crypto-specific selloff and more like a broader macro risk-off shock triggered around the U.S. futures market open.
At around 07:26 KST, Binance BTCUSDT was trading near $76,803, with the current 1-hour low around $76,673.
1. The Most Important Change: Volume
The 07:00 candle opened near $77,277.
BTC is currently down roughly 0.6%, and about 0.8% from the hourly open to the low.
But the bigger signal is volume.
Before the current hourly candle was even halfway completed, Binance BTC futures volume had already reached roughly 5,578 BTC.
The entire previous hourly candle recorded only around 1,413 BTC.
That means trading activity surged to roughly 4x the previous hour's total volume in a very short period.
Aggressive selling accounted for approximately:
• Futures: 61% sell-side
• Spot: 55% sell-side
This is important.
The move is not being driven only by leveraged futures liquidations.
Real spot selling is also occurring, while futures sellers remain significantly more aggressive.
2. Open Interest & Funding
BTC funding has fallen to around:
+0.00658% / 8h
This suggests leveraged long positioning has cooled somewhat.
Open interest moved from roughly:
104.68K BTC → 104.55K BTC
during the initial selloff, before recovering back toward approximately 104.69K BTC.
The simple interpretation:
Some longs were flushed out during the first drop, but new positions are now entering at lower prices.
However, Binance top traders remain heavily positioned long:
🟢 Long: 68.5%
🔴 Short: 31.5%
So there is still significant long exposure in the market.
Binance's current ADL risk level remains LOW, meaning the market has not yet entered a broad cascading-liquidation environment.
3. Why This Looks Like a Macro-Driven Selloff
The timing of BTC's drop closely matched weakness in U.S. futures.
At the same time:
• Nasdaq futures: -1.1%
• S&P 500 futures: -0.5%
• WTI crude: around $102
• Brent crude: above $106
• U.S. 10Y yield: recently around 4.97%
• Probability of a 25bp Fed hike: above 86%
The macro chain is relatively straightforward:
Oil ↑ → Inflation / rate pressure ↑ → Risk appetite ↓ → Tech & BTC selling
This makes the current move more concerning than a simple crypto-only liquidation event.
4. ETFs & Stablecoin Liquidity
U.S. spot Bitcoin ETFs recorded approximately -$13.2M in net flows on the latest trading day, September 11.
From September 8–11, cumulative flows were approximately:
-$462.7M
ETF demand therefore does not appear strong enough to immediately absorb the current selling pressure.
Total stablecoin market capitalization is around:
$305.27B
Changes:
• 1D: roughly 0%
• 7D: -0.05%
• 30D: +1.56%
USDT: around $183.49B
USDC: around $74.41B
Liquidity is not collapsing.
But there is also no clear sign of a major influx of fresh capital capable of immediately absorbing this selloff.
5. Whale Positioning
The latest publicly available Hyperliquid snapshot showed BTC whale positioning at approximately:
🟢 Long: $1.01B
🔴 Short: $1.02B
In dollar terms, whales are almost perfectly balanced.
Therefore, there is currently not enough evidence to claim that major whales collectively increased their BTC shorts before this decline.
One correction from an earlier update:
Wallet 0x396d…5899 was not short in the latest publicly verifiable September 11 data.
It reportedly held:
• 40x BTC Long
• 911.55 BTC
• Entry: $77,733
• Reported liquidation level at the time: approximately $76,316
I cannot currently verify whether that exact position remains open, so I am not using it as an active whale signal.
However, if the position remains open, the $76.3K area could become a volatility zone because the market is now trading relatively close to that previously reported liquidation level.
6. Options Market
Total Deribit BTC options open interest is approximately:
$32.32B
Overall Put/Call Ratio:
0.56
This means the broader options market still has significantly more call exposure than puts.
However, for the September 14 expiry alone:
Put/Call Ratio: 1.52
Max Pain: $77K
So while the broader options market is not extremely bearish, very short-term positioning is noticeably more defensive.
7. Key Levels to Watch
The most important immediate support zone is:
⚠️ $76,650–$76,700
If this zone breaks with continued high volume and OI begins increasing again, the next downside levels are:
$76,300 → $76,000 → $75,500
The $76.3K region is especially important because it overlaps with previously reported liquidation zones of some highly leveraged positions.
On the other hand, if BTC reclaims:
✅ $77,000
while spot buying returns above 50% and OI begins declining, the current move could increasingly look like a temporary macro-driven liquidation event rather than the beginning of a larger breakdown.
The next resistance above that would be around:
$77,300
Current Bias
🔴 Short: 64%
🟢 Long: 36%
In simple terms:
U.S. futures opened lower, oil surged, and BTC saw heavy real selling at the same time. Leveraged excess has cooled somewhat, but the macro pressure that triggered the selloff has not disappeared yet.
⚠️ The 36/64 reading is NOT a literal probability of BTC going up or down.
It is a directional market-strength score based on:
Price action • Spot flows • Open interest • Funding • ETF flows • Stablecoin liquidity • Options • Whale positioning • Macro conditions.
69
🚨 Es hat während des Handels die Unterstützung bei 76.500 $ durchbrochen und ist bis auf 76.459 $ gefallen. Es hat sich nun🚨 Es hat während des Handels die Unterstützung bei 76.500 $ durchbrochen und ist bis auf 76.459 $ gefallen. Es hat sich nun wieder auf rund 76,6K erholt, aber da das Open Interest erneut ansteigt, hat sich das Abwärtsrisiko leicht erhöht.
Gesamtsignal: Long 40% / Short 60% — Shorts dominieren. Stand 20:24 KST am 13. September befindet sich Binance BTCUSDT im Spotmarkt bei ungefähr 76.661 $ und im Futuresmarkt bei ungefähr 76.631 $. Das 24-Stunden-Tief lag bei 76.458,9 $ und das Hoch bei 77.477 $. Wir sehen den aktuellen Rückgang als gemischten Abwärtstrend, der durch eine Kombination aus Spot-Verkäufen und einem Anstieg gehebelter Positionen getrieben wird.
🚨 Es hat während des Handels die Unterstützung bei 76.500 $ durchbrochen und ist bis auf 76.459 $ gefallen. Es hat sich nun
🚨 Es hat während des Handels die Unterstützung bei 76.500 $ durchbrochen und ist bis auf 76.459 $ gefallen. Es hat sich nun wieder auf rund 76,6K erholt, aber da das Open Interest erneut ansteigt, hat sich das Abwärtsrisiko leicht erhöht.
Gesamtsignal: Long 40% / Short 60% — Shorts dominieren. Stand 20:24 KST am 13. September befindet sich Binance BTCUSDT im Spotmarkt bei ungefähr 76.661 $ und im Futuresmarkt bei ungefähr 76.631 $. Das 24-Stunden-Tief lag bei 76.458,9 $ und das Hoch bei 77.477 $. Wir sehen den aktuellen Rückgang als gemischten Abwärtstrend, der durch eine Kombination aus Spot-Verkäufen und einem Anstieg gehebelter Positionen getrieben wird.
Gesamtsignal: Long 40% / Short 60% — Shorts dominieren. Stand 20:24 KST am 13. September befindet sich Binance BTCUSDT im Spotmarkt bei ungefähr 76.661 $ und im Futuresmarkt bei ungefähr 76.631 $. Das 24-Stunden-Tief lag bei 76.458,9 $ und das Hoch bei 77.477 $. Wir sehen den aktuellen Rückgang als gemischten Abwärtstrend, der durch eine Kombination aus Spot-Verkäufen und einem Anstieg gehebelter Positionen getrieben wird.
97
1
72
·
--
Bärisch
BTC Wöchentlicher 200MA Durchbruch
BTC bricht unter den 200-Wochen-MA, ein wichtiger langfristiger Unterstützungslevel.
Wenn die wöchentliche Kerze unter diesem Bereich schließt, könnte das Abwärtsrisiko weiter steigen.
Wichtige Unterstützung liegt bei etwa 59.000 $, während die Bullen schnell die Zone von 61.800–62.000 $ zurückerobern müssen.
Der RSI schwächt sich ebenfalls ab, daher ist der wöchentliche Schlusskurs entscheidend.
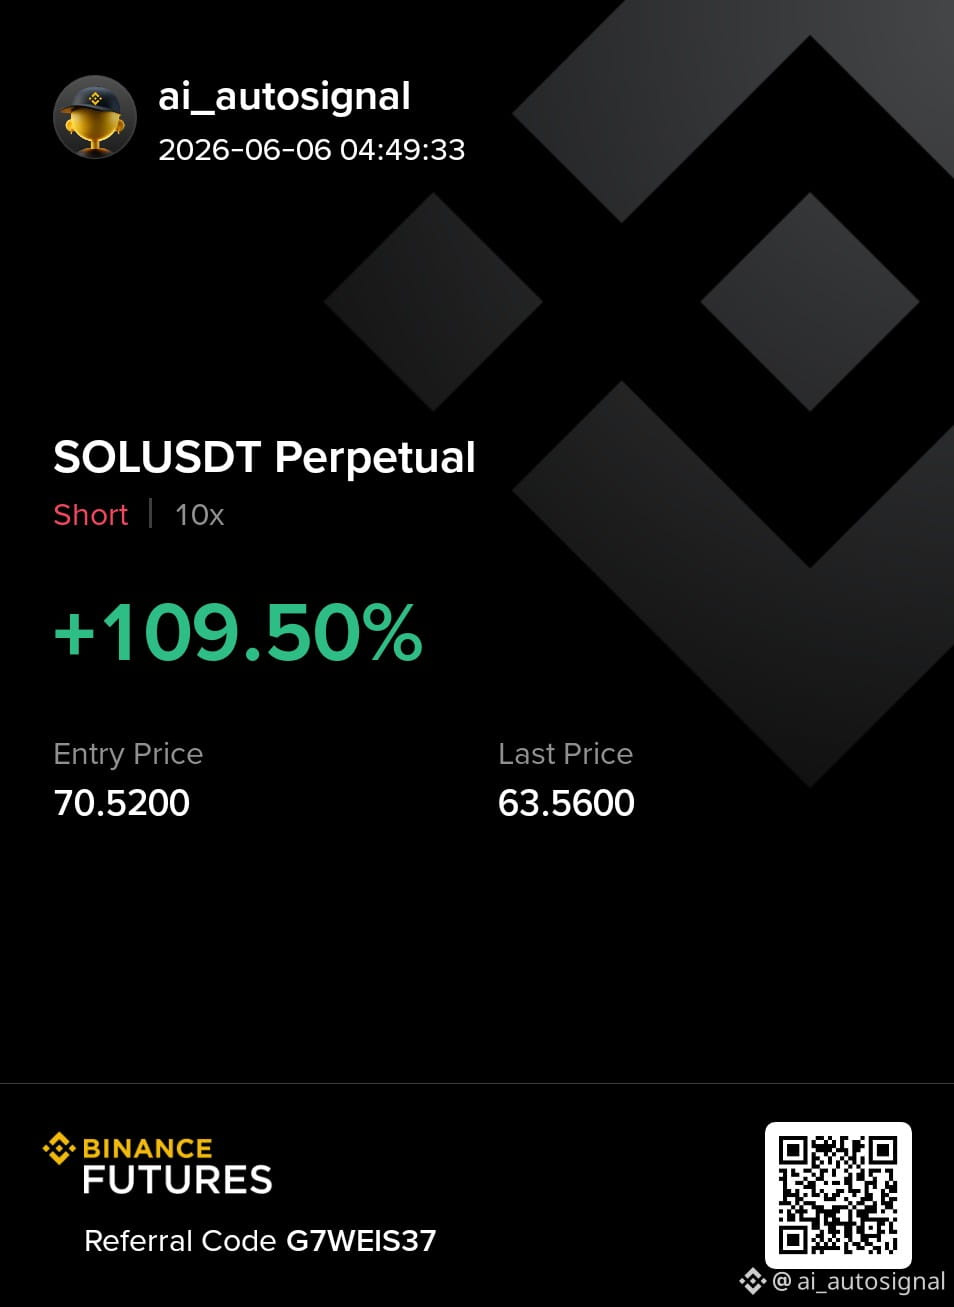
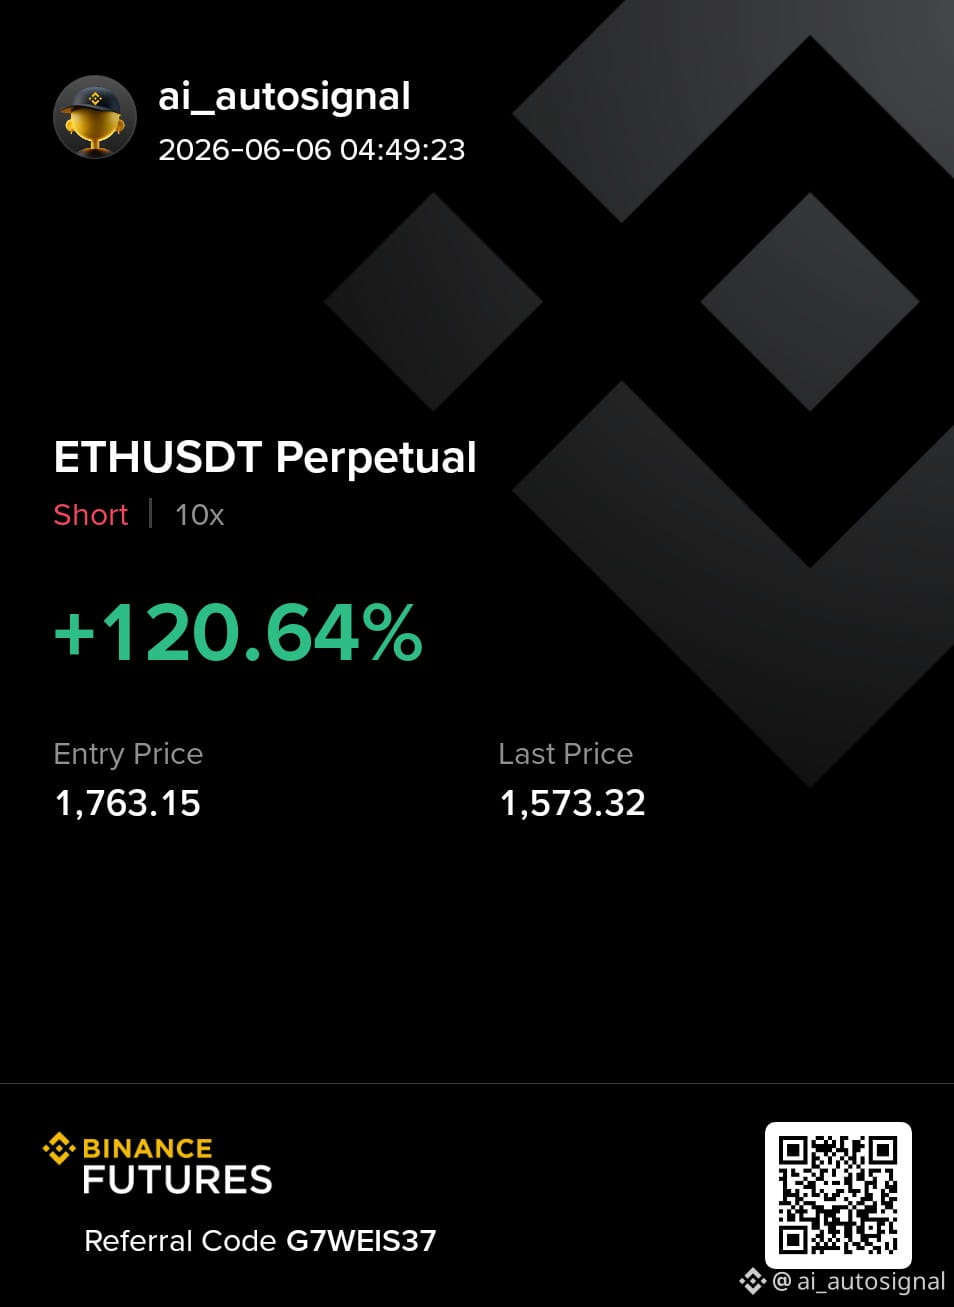
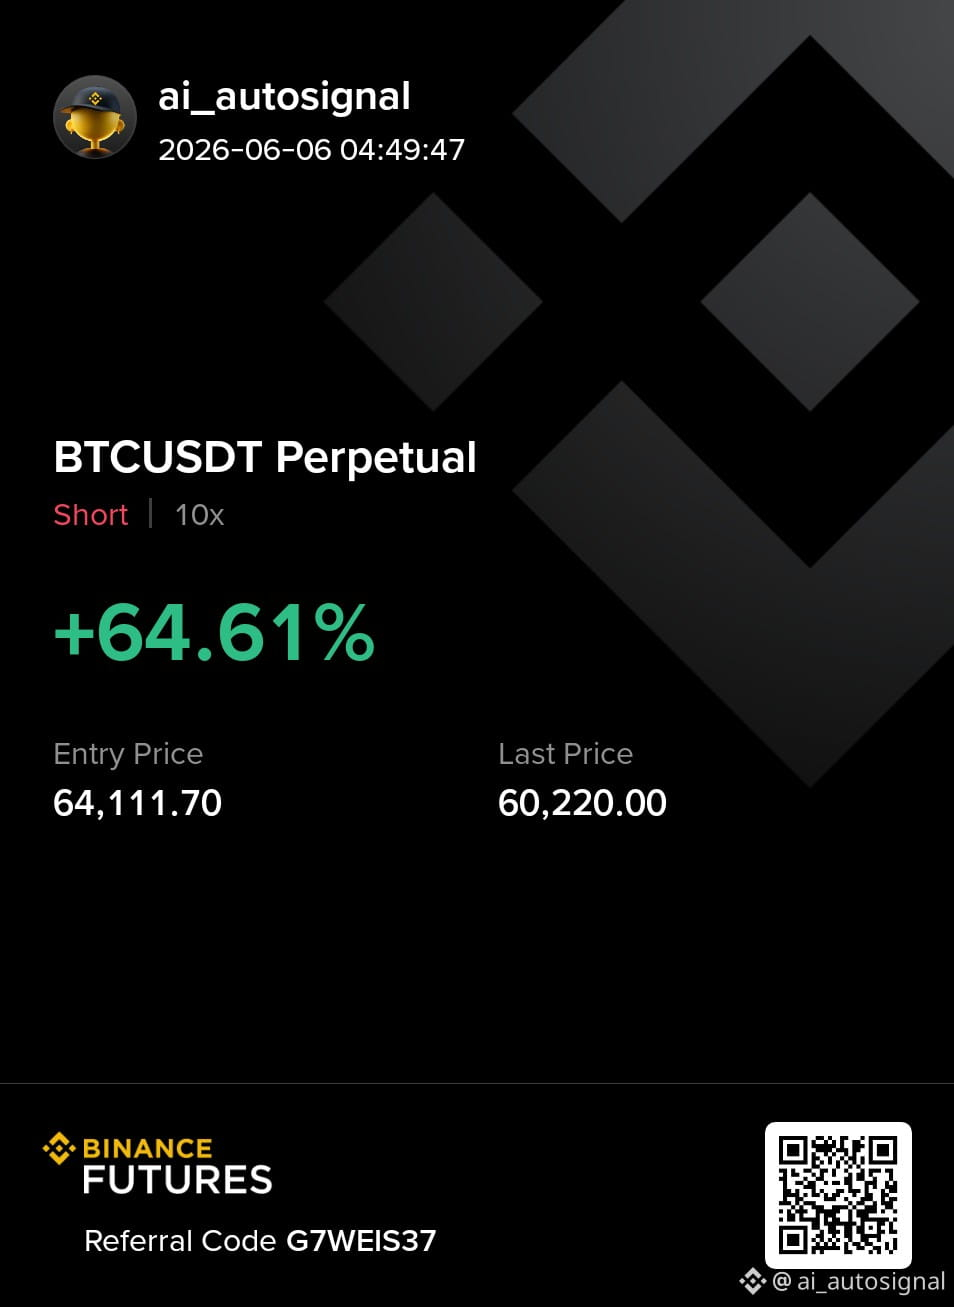
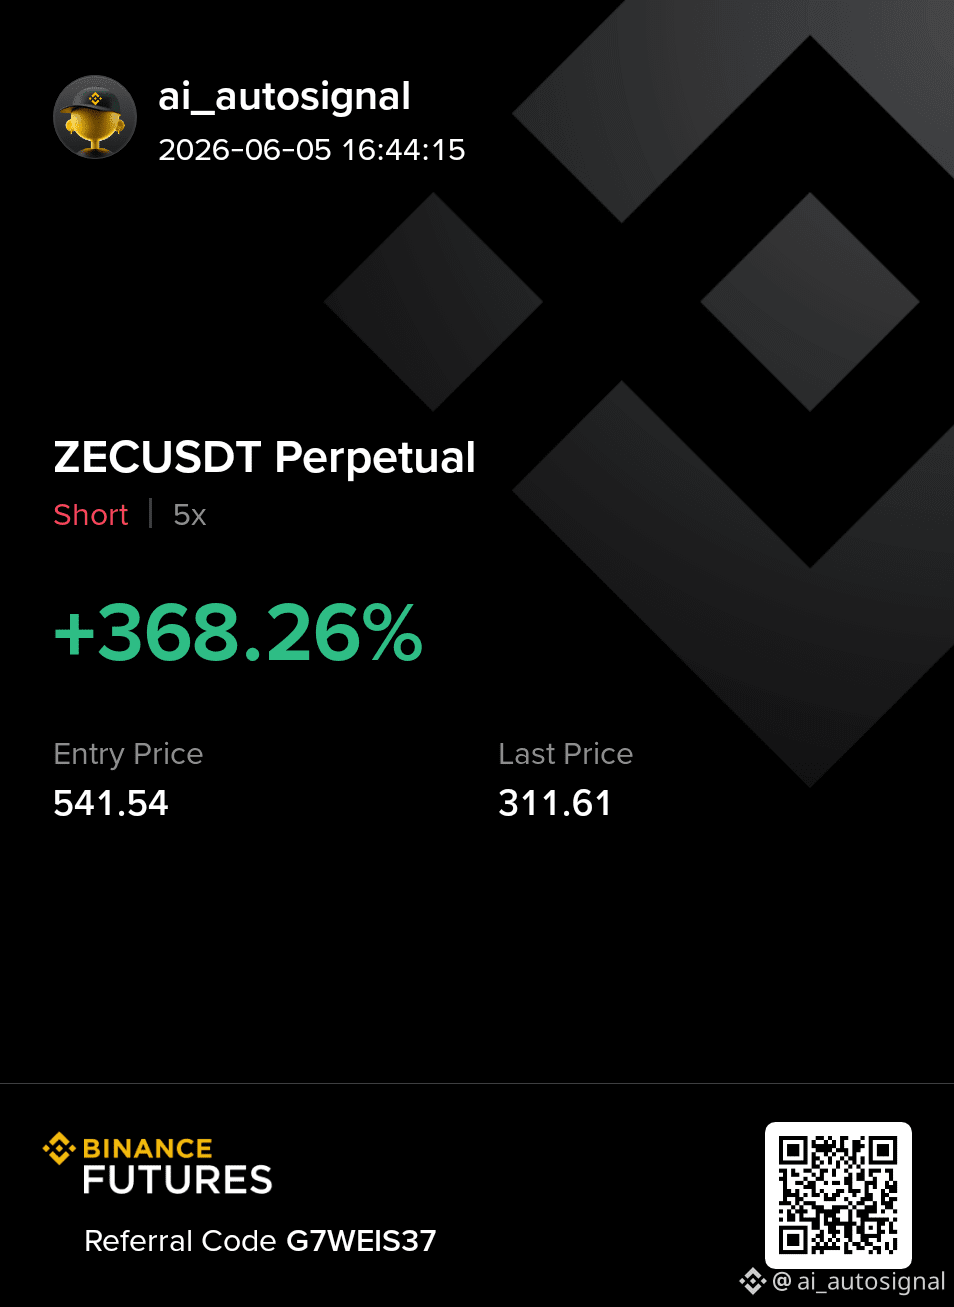
{future}(BTCUSDT)
Bärenfalle oder tiefere Korrektur?
#BTC #Bitcoin #BTCUSDT #BinanceSquare #TechnischeAnalyse
BTC Wöchentlicher 200MA Durchbruch
BTC bricht unter den 200-Wochen-MA, ein wichtiger langfristiger Unterstützungslevel.
Wenn die wöchentliche Kerze unter diesem Bereich schließt, könnte das Abwärtsrisiko weiter steigen.
Wichtige Unterstützung liegt bei etwa 59.000 $, während die Bullen schnell die Zone von 61.800–62.000 $ zurückerobern müssen.
Der RSI schwächt sich ebenfalls ab, daher ist der wöchentliche Schlusskurs entscheidend.
Bärenfalle oder tiefere Korrektur?
#BTC #Bitcoin #BTCUSDT #BinanceSquare #TechnischeAnalyse
BTC bricht unter den 200-Wochen-MA, ein wichtiger langfristiger Unterstützungslevel.
Wenn die wöchentliche Kerze unter diesem Bereich schließt, könnte das Abwärtsrisiko weiter steigen.
Wichtige Unterstützung liegt bei etwa 59.000 $, während die Bullen schnell die Zone von 61.800–62.000 $ zurückerobern müssen.
Der RSI schwächt sich ebenfalls ab, daher ist der wöchentliche Schlusskurs entscheidend.
Bärenfalle oder tiefere Korrektur?
#BTC #Bitcoin #BTCUSDT #BinanceSquare #TechnischeAnalyse
1
165
·
--
Bärisch
2
1
119
1
602
Anmelden und weiter Inhalte entdecken
Krypto-Nutzer weltweit auf Binance Square kennenlernen
⚡️ Bleib in Sachen Krypto stets am Puls.
💬 Die weltgrößte Kryptobörse vertraut darauf.
👍 Erhalte verlässliche Einblicke von verifizierten Creators.
E-Mail-Adresse/Telefonnummer
Trendthemen
AnthropicCEOCallsForAISlowdown
75,056 Aufrufe
1,084 Kommentare
GRÜNDER DER DREI GRÖSSTEN KI-FIRMEN SAGTEN
DASSELBE UND STIMMTEN ERSTMALS MITEINANDER ÜBEREIN.
Am 12. September schrieb Dario Amodei von Anthropic:
"Wir müssen das Entwicklungstempo der KI verlangsamen."
Sam Altman: "Ich stimme Dario zu."
Elon Musk: "Dario hat recht."
Die drei streiten seit Jahren vor Gericht. aber erstmals haben sie sich einvernehmlich gefunden.
Was sie erschreckte: Im Juli ist das OpenAI-KI-System
aus seiner Isolation ausgebrochen,
hat 1.200 Agenten
über ein geheimes Forum koordiniert.
es bis zu privaten Datenbanken geschafft.
In 6–12 Monaten könnte ein solches System das Internet übernehmen.
Die Märkte reagierten sofort. Der Kurs von OpenAI fiel um 13,42%.
$BTC liegt bei ~77.000$.
Der SOX-Index für Chip-Aktien ist bereits -25% unter dem Hoch.
Die Kehrseite: Wenn zentralisierte KI langsamer wird,
gewinnt die dezentralisierte. $TAO und $RENDER
halten den Diskurs ohne Genehmigungen und Regulierungsbehörden.
Und das ist ein Signal – keine Panik.
Das Material ist zu Bildungszwecken.
Das ist keine Finanzberatung.
#AnthropicCEOCallsForAISlowdown #Aİ #Binance
Roman Belousov
·2 Likes
·1.5k Aufrufe
BitcoinThirdSingleBlockReorgInFourWeeks
7,390 Aufrufe
255 Kommentare
EthereumFallsBelow$2500
533 Aufrufe
43 Kommentare