
CryptoQuant Quicktake
8.8k Beiträge

CryptoQuant Quicktake
 Square Verified+
Melden
Nutzer blockieren
CryptoQuant.com - Leading On-chain Data/Analytics Provider
0 Following
22.9K+ Follower
27.1K+ Like gegeben
Beiträge

Artikel
Übersetzung ansehen
Binance ETH Open Interest Rises Above Its 30-Day AverageData from Binance shows a notable rise in open interest for Ethereum contracts recently, coinciding with the recovery in ETH’s price and renewed activity in the derivatives market.
According to recent data, open interest stood at approximately $6.05 billion, compared with a 30-day moving average of about $5.77 billion, meaning that current levels exceed the recent average by roughly 4.7%. Meanwhile, the standard deviation stood at approximately $600.7 million, while the Z-score reached about 0.45.
This positive reading indicates that open interest has risen above its 30-day average, yet it remains far from the extreme levels that typically signal an exceptional surge in trader positioning or leverage usage.
This trend coincides with Ethereum trading near $2,400, following a period of market volatility over the past few months. The rise in open interest may reflect a return of liquidity and interest to ETH futures contracts, as traders prepare to open new positions amid improving price action.
However, a Z-score of 0.45 suggests that the current increase remains moderate and does not, on its own, clearly signal an overheated derivatives market. Therefore, monitoring open interest, trading volume, and funding rates will be crucial in determining whether this rise represents a sustainable buildup of positions or merely a temporary spike in trading activity.
Written by Arab Chain
Binance ETH Open Interest Rises Above Its 30-Day Average
Data from Binance shows a notable rise in open interest for Ethereum contracts recently, coinciding with the recovery in ETH’s price and renewed activity in the derivatives market.
According to recent data, open interest stood at approximately $6.05 billion, compared with a 30-day moving average of about $5.77 billion, meaning that current levels exceed the recent average by roughly 4.7%. Meanwhile, the standard deviation stood at approximately $600.7 million, while the Z-score reached about 0.45.
This positive reading indicates that open interest has risen above its 30-day average, yet it remains far from the extreme levels that typically signal an exceptional surge in trader positioning or leverage usage.
This trend coincides with Ethereum trading near $2,400, following a period of market volatility over the past few months. The rise in open interest may reflect a return of liquidity and interest to ETH futures contracts, as traders prepare to open new positions amid improving price action.
However, a Z-score of 0.45 suggests that the current increase remains moderate and does not, on its own, clearly signal an overheated derivatives market. Therefore, monitoring open interest, trading volume, and funding rates will be crucial in determining whether this rise represents a sustainable buildup of positions or merely a temporary spike in trading activity.
Written by Arab Chain
According to recent data, open interest stood at approximately $6.05 billion, compared with a 30-day moving average of about $5.77 billion, meaning that current levels exceed the recent average by roughly 4.7%. Meanwhile, the standard deviation stood at approximately $600.7 million, while the Z-score reached about 0.45.
This positive reading indicates that open interest has risen above its 30-day average, yet it remains far from the extreme levels that typically signal an exceptional surge in trader positioning or leverage usage.
This trend coincides with Ethereum trading near $2,400, following a period of market volatility over the past few months. The rise in open interest may reflect a return of liquidity and interest to ETH futures contracts, as traders prepare to open new positions amid improving price action.
However, a Z-score of 0.45 suggests that the current increase remains moderate and does not, on its own, clearly signal an overheated derivatives market. Therefore, monitoring open interest, trading volume, and funding rates will be crucial in determining whether this rise represents a sustainable buildup of positions or merely a temporary spike in trading activity.
Written by Arab Chain
133

Artikel
Übersetzung ansehen
Bitcoin Traders Cut $842M in 7-Day Open Interest Across Five Exchanges As Binance Hits Deepest Dr...Bitcoin derivatives traders sharply reduced open positions across several major exchanges on September 11, with the combined seven-day open interest change across Binance, Bybit, Deribit, HTX and Bitfinex reaching approximately -$842 million.
The largest contraction came from traders on
Binance dropped to around -$400 million, marking its lowest point since July.
Bybit followed at around -$240 million, while
Deribit recorded -$96 million,
HTX Global -$72 million, and
Bitfinex about -$34 million.
Together, Binance and Bybit accounted for approximately 76% of the $842 million decline, highlighting where most of the reduction in open derivatives exposure was concentrated.
Gate.io stood out as the main exception.
Traders there increased seven-day open interest by approximately $125 million, diverging from the broader contraction seen across the other major venues.
The readings were recorded after Bitcoin touched the $77,000 area and during a sensitive macro window.
These readings came directly after the latest U.S. PPI release on September 10, which showed producer prices rising 0.4% month over month in August and 5.4% from a year earlier.
The data kept inflation concerns in focus ahead of another major macro test for markets.
The contraction in open interest also comes just hours before the release of August U.S. CPI data on September 11, placing the reduction in derivatives exposure between two closely watched inflation reports.
The timing suggests traders may be reducing risk ahead of potential volatility, although open interest alone cannot establish whether long or short positions were being closed.
Written by Amr Taha
Bitcoin Traders Cut $842M in 7-Day Open Interest Across Five Exchanges As Binance Hits Deepest Dr...
Bitcoin derivatives traders sharply reduced open positions across several major exchanges on September 11, with the combined seven-day open interest change across Binance, Bybit, Deribit, HTX and Bitfinex reaching approximately -$842 million.
The largest contraction came from traders on
Binance dropped to around -$400 million, marking its lowest point since July.
Bybit followed at around -$240 million, while
Deribit recorded -$96 million,
HTX Global -$72 million, and
Bitfinex about -$34 million.
Together, Binance and Bybit accounted for approximately 76% of the $842 million decline, highlighting where most of the reduction in open derivatives exposure was concentrated.
Gate.io stood out as the main exception.
Traders there increased seven-day open interest by approximately $125 million, diverging from the broader contraction seen across the other major venues.
The readings were recorded after Bitcoin touched the $77,000 area and during a sensitive macro window.
These readings came directly after the latest U.S. PPI release on September 10, which showed producer prices rising 0.4% month over month in August and 5.4% from a year earlier.
The data kept inflation concerns in focus ahead of another major macro test for markets.
The contraction in open interest also comes just hours before the release of August U.S. CPI data on September 11, placing the reduction in derivatives exposure between two closely watched inflation reports.
The timing suggests traders may be reducing risk ahead of potential volatility, although open interest alone cannot establish whether long or short positions were being closed.
Written by Amr Taha
The largest contraction came from traders on
Binance dropped to around -$400 million, marking its lowest point since July.
Bybit followed at around -$240 million, while
Deribit recorded -$96 million,
HTX Global -$72 million, and
Bitfinex about -$34 million.
Together, Binance and Bybit accounted for approximately 76% of the $842 million decline, highlighting where most of the reduction in open derivatives exposure was concentrated.
Gate.io stood out as the main exception.
Traders there increased seven-day open interest by approximately $125 million, diverging from the broader contraction seen across the other major venues.
The readings were recorded after Bitcoin touched the $77,000 area and during a sensitive macro window.
These readings came directly after the latest U.S. PPI release on September 10, which showed producer prices rising 0.4% month over month in August and 5.4% from a year earlier.
The data kept inflation concerns in focus ahead of another major macro test for markets.
The contraction in open interest also comes just hours before the release of August U.S. CPI data on September 11, placing the reduction in derivatives exposure between two closely watched inflation reports.
The timing suggests traders may be reducing risk ahead of potential volatility, although open interest alone cannot establish whether long or short positions were being closed.
Written by Amr Taha
127

Artikel
Übersetzung ansehen
Institutional Liquidity Architecture and the Impending Supply Crunch in BitcoinThe pullback seen in the first quarter of 2026 was an aggressive flush targeting thin market liquidity and purging weak hands from the system. As the price drifted toward the $60K region, sharp red deviations on the Liquidity Friction Index clearly indicated margin liquidations and a sell-side pressure that fully dried up order book depth.
However, moving into the July–September 2026 window, the market structure shifted entirely. While price consolidated within the $80K range, the vertical surge in the 30-day Net Capital Inflow presented a textbook example of order book absorption. Despite the price not printing immediate new highs, sell-side liquidity across the order books was being absorbed on the spot side by OTC desks and institutional entities. This bullish divergence between the massive influx of fresh capital and the lagging price action confirms that whales and market makers were quietly elevating their cost basis.
Ultimately, the capital outflow phase has officially closed, giving way to aggressive spot accumulation. Even if technical resistances have yet to break, on-chain capital injection is running well ahead of price—pointing directly to an inevitable supply crunch and a sharp upward repricing move in the period ahead.
Written by FundingVest
Institutional Liquidity Architecture and the Impending Supply Crunch in Bitcoin
The pullback seen in the first quarter of 2026 was an aggressive flush targeting thin market liquidity and purging weak hands from the system. As the price drifted toward the $60K region, sharp red deviations on the Liquidity Friction Index clearly indicated margin liquidations and a sell-side pressure that fully dried up order book depth.
However, moving into the July–September 2026 window, the market structure shifted entirely. While price consolidated within the $80K range, the vertical surge in the 30-day Net Capital Inflow presented a textbook example of order book absorption. Despite the price not printing immediate new highs, sell-side liquidity across the order books was being absorbed on the spot side by OTC desks and institutional entities. This bullish divergence between the massive influx of fresh capital and the lagging price action confirms that whales and market makers were quietly elevating their cost basis.
Ultimately, the capital outflow phase has officially closed, giving way to aggressive spot accumulation. Even if technical resistances have yet to break, on-chain capital injection is running well ahead of price—pointing directly to an inevitable supply crunch and a sharp upward repricing move in the period ahead.
Written by FundingVest
However, moving into the July–September 2026 window, the market structure shifted entirely. While price consolidated within the $80K range, the vertical surge in the 30-day Net Capital Inflow presented a textbook example of order book absorption. Despite the price not printing immediate new highs, sell-side liquidity across the order books was being absorbed on the spot side by OTC desks and institutional entities. This bullish divergence between the massive influx of fresh capital and the lagging price action confirms that whales and market makers were quietly elevating their cost basis.
Ultimately, the capital outflow phase has officially closed, giving way to aggressive spot accumulation. Even if technical resistances have yet to break, on-chain capital injection is running well ahead of price—pointing directly to an inevitable supply crunch and a sharp upward repricing move in the period ahead.
Written by FundingVest
151
Teilweise korrekt

Artikel
Übersetzung ansehen
Binance's BTC Reserves Just Hit a 2-year HighBinance's BTC reserves have just hit a new record, reaching their highest level in two years.
Today, Binance holds more than 693 000 Bitcoin, representing roughly 30% of all Bitcoin held in the reserves of major exchanges.
Between late April and today alone, Binance's BTC reserves grew by 77 000 Bitcoin, a far-from-negligible increase over such a short period.
This growth is largely explained by investors taking advantage of May's rally, and then today's, to move their BTC onto an exchange in order to sell. Given Binance's particularly deep liquidity, it makes sense that the largest BTC flows in the market show up there.
Beyond these inflows, there's also the launch of the SAFU fund, which aimed to deploy $1B to acquire roughly 15,000 additional BTC, in a move meant to show support for the Bitcoin community during this correction phase.
One last factor that may have pushed investors to move their BTC to an exchange like Binance is security. Following the ColdCard incident, some may have chosen to send their Bitcoin to a third-party platform for added protection of their assets.
Still, this record is far from trivial, seeing BTC reserves climb this much deserves close attention, given the potential selling pressure it could represent for the market.
Written by Darkfost
Binance's BTC Reserves Just Hit a 2-year High
Binance's BTC reserves have just hit a new record, reaching their highest level in two years.
Today, Binance holds more than 693 000 Bitcoin, representing roughly 30% of all Bitcoin held in the reserves of major exchanges.
Between late April and today alone, Binance's BTC reserves grew by 77 000 Bitcoin, a far-from-negligible increase over such a short period.
This growth is largely explained by investors taking advantage of May's rally, and then today's, to move their BTC onto an exchange in order to sell. Given Binance's particularly deep liquidity, it makes sense that the largest BTC flows in the market show up there.
Beyond these inflows, there's also the launch of the SAFU fund, which aimed to deploy $1B to acquire roughly 15,000 additional BTC, in a move meant to show support for the Bitcoin community during this correction phase.
One last factor that may have pushed investors to move their BTC to an exchange like Binance is security. Following the ColdCard incident, some may have chosen to send their Bitcoin to a third-party platform for added protection of their assets.
Still, this record is far from trivial, seeing BTC reserves climb this much deserves close attention, given the potential selling pressure it could represent for the market.
Written by Darkfost
Today, Binance holds more than 693 000 Bitcoin, representing roughly 30% of all Bitcoin held in the reserves of major exchanges.
Between late April and today alone, Binance's BTC reserves grew by 77 000 Bitcoin, a far-from-negligible increase over such a short period.
This growth is largely explained by investors taking advantage of May's rally, and then today's, to move their BTC onto an exchange in order to sell. Given Binance's particularly deep liquidity, it makes sense that the largest BTC flows in the market show up there.
Beyond these inflows, there's also the launch of the SAFU fund, which aimed to deploy $1B to acquire roughly 15,000 additional BTC, in a move meant to show support for the Bitcoin community during this correction phase.
One last factor that may have pushed investors to move their BTC to an exchange like Binance is security. Following the ColdCard incident, some may have chosen to send their Bitcoin to a third-party platform for added protection of their assets.
Still, this record is far from trivial, seeing BTC reserves climb this much deserves close attention, given the potential selling pressure it could represent for the market.
Written by Darkfost
112

Artikel
Bitcoin: Mehr als ein Jahrzehnt alte Bestände verlagern sich, während der Binance-Dollar-Puffer sich anhäuftBeobachtung. Bitcoin schloss am 9. September bei 78.315 US-Dollar – 2,5% unter dem Print von 80.336 US-Dollar vom 6. September, und hält seit dem 5. September eine Spanne von etwa 2,6% ein. Der aggregierte Exchange-Nettozufluss lag im Tagesdurchschnitt bei +669 BTC, ein Plus von 259% im Wochenvergleich (WoW) und 542% gegenüber dem Quartals-Benchmark.
Kontext. Die Ausgaben der 10y+-Gruppe lagen im Durchschnitt bei 469 BTC pro Tag (37,4 Mio. US-Dollar), +161% WoW. Doch der anteilgebundene Teil an der Börse ist vernachlässigbar – der Zufluss von 10y+ zu Coinbase lag bei durchschnittlich 0,88 BTC. Die älteste verfügbare Menge scheint sich zu verlagern, statt ausgeliefert zu werden; diese Unterscheidung würde allein der prozentuale Veränderungseffekt verschleiern.
Bitcoin: Mehr als ein Jahrzehnt alte Bestände verlagern sich, während der Binance-Dollar-Puffer sich anhäuft
Beobachtung. Bitcoin schloss am 9. September bei 78.315 US-Dollar – 2,5% unter dem Print von 80.336 US-Dollar vom 6. September, und hält seit dem 5. September eine Spanne von etwa 2,6% ein. Der aggregierte Exchange-Nettozufluss lag im Tagesdurchschnitt bei +669 BTC, ein Plus von 259% im Wochenvergleich (WoW) und 542% gegenüber dem Quartals-Benchmark.
Kontext. Die Ausgaben der 10y+-Gruppe lagen im Durchschnitt bei 469 BTC pro Tag (37,4 Mio. US-Dollar), +161% WoW. Doch der anteilgebundene Teil an der Börse ist vernachlässigbar – der Zufluss von 10y+ zu Coinbase lag bei durchschnittlich 0,88 BTC. Die älteste verfügbare Menge scheint sich zu verlagern, statt ausgeliefert zu werden; diese Unterscheidung würde allein der prozentuale Veränderungseffekt verschleiern.
Kontext. Die Ausgaben der 10y+-Gruppe lagen im Durchschnitt bei 469 BTC pro Tag (37,4 Mio. US-Dollar), +161% WoW. Doch der anteilgebundene Teil an der Börse ist vernachlässigbar – der Zufluss von 10y+ zu Coinbase lag bei durchschnittlich 0,88 BTC. Die älteste verfügbare Menge scheint sich zu verlagern, statt ausgeliefert zu werden; diese Unterscheidung würde allein der prozentuale Veränderungseffekt verschleiern.
76

Artikel
Bitcoin Sales Absorption Vertieft: Geht die Korrektur weiter?Bitcoin ist nach dem Scheitern, die starke Verkaufswand im Bereich von 81,5 Tsd. bis 82 Tsd. US-Dollar zu durchbrechen, in eine klare Retracement-Phase eingetreten. Nach dieser scharfen Korrektur vom Hoch hat sich der BTC-Preis auf die Zone von 76,8 Tsd. bis 77,2 Tsd. US-Dollar zurückgezogen. Mit Blick auf die aktuellen Marktdynamiken scheint der Haupttreiber für diesen Rückgang eine starke Sales Absorption zu sein, die an großen Börsen stattfindet.
Während der Preis fällt, werden Versuche der Käufer, Liquidität zu absorbieren, sofort durch aggressive Verkaufsorders abgefangen und verschluckt. Dieses Absorptionsmechanismus verhindert, dass Bullen an Volumenmomentum gewinnen, während gleichzeitig ein unaufhörlicher Abwärtsdruck auf den Preis aufrechterhalten wird.
Bitcoin Sales Absorption Vertieft: Geht die Korrektur weiter?
Bitcoin ist nach dem Scheitern, die starke Verkaufswand im Bereich von 81,5 Tsd. bis 82 Tsd. US-Dollar zu durchbrechen, in eine klare Retracement-Phase eingetreten. Nach dieser scharfen Korrektur vom Hoch hat sich der BTC-Preis auf die Zone von 76,8 Tsd. bis 77,2 Tsd. US-Dollar zurückgezogen. Mit Blick auf die aktuellen Marktdynamiken scheint der Haupttreiber für diesen Rückgang eine starke Sales Absorption zu sein, die an großen Börsen stattfindet.
Während der Preis fällt, werden Versuche der Käufer, Liquidität zu absorbieren, sofort durch aggressive Verkaufsorders abgefangen und verschluckt. Dieses Absorptionsmechanismus verhindert, dass Bullen an Volumenmomentum gewinnen, während gleichzeitig ein unaufhörlicher Abwärtsdruck auf den Preis aufrechterhalten wird.
Während der Preis fällt, werden Versuche der Käufer, Liquidität zu absorbieren, sofort durch aggressive Verkaufsorders abgefangen und verschluckt. Dieses Absorptionsmechanismus verhindert, dass Bullen an Volumenmomentum gewinnen, während gleichzeitig ein unaufhörlicher Abwärtsdruck auf den Preis aufrechterhalten wird.
90
Artikel
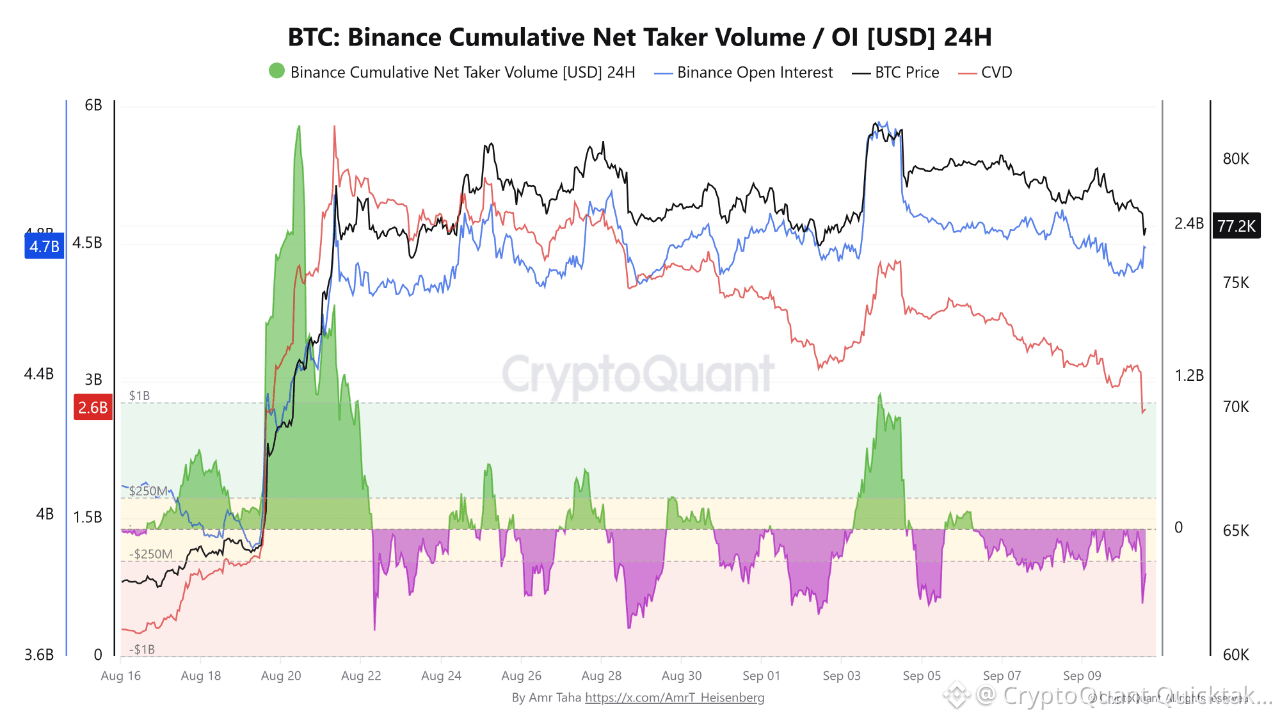
Bitcoin-Derivatehändler schwenken scharf auf die Verkaufsseite um, während CVD um 54% fällt und das OI nur um 4% sinktBitcoin-Derivatehändler auf Binance zeigten einen deutlichen Umschwung hin zu aggressivem Verkauf; das Net Taker Volume fiel auf -440 Millionen US-Dollar, nachdem die US-Daten zum August-PPI veröffentlicht worden waren.
Der breitere Wandel im Händlerverhalten wird noch deutlicher in der Cumulative Net Taker Volume.
CVD fiel von 5,77 Milliarden US-Dollar am 21. August auf 2,67 Milliarden US-Dollar heute – ein Rückgang von ungefähr 3,1 Milliarden US-Dollar bzw. 54%.
Doch das Open Interest für Bitcoin auf Binance blieb im selben Zeitraum relativ stabil und ging nur von etwa 4,9 Milliarden US-Dollar auf 4,7 Milliarden US-Dollar zurück – ein Rückgang von lediglich rund 4%.
Bitcoin-Derivatehändler schwenken scharf auf die Verkaufsseite um, während CVD um 54% fällt und das OI nur um 4% sinkt
Bitcoin-Derivatehändler auf Binance zeigten einen deutlichen Umschwung hin zu aggressivem Verkauf; das Net Taker Volume fiel auf -440 Millionen US-Dollar, nachdem die US-Daten zum August-PPI veröffentlicht worden waren.
Der breitere Wandel im Händlerverhalten wird noch deutlicher in der Cumulative Net Taker Volume.
CVD fiel von 5,77 Milliarden US-Dollar am 21. August auf 2,67 Milliarden US-Dollar heute – ein Rückgang von ungefähr 3,1 Milliarden US-Dollar bzw. 54%.
Doch das Open Interest für Bitcoin auf Binance blieb im selben Zeitraum relativ stabil und ging nur von etwa 4,9 Milliarden US-Dollar auf 4,7 Milliarden US-Dollar zurück – ein Rückgang von lediglich rund 4%.
Der breitere Wandel im Händlerverhalten wird noch deutlicher in der Cumulative Net Taker Volume.
CVD fiel von 5,77 Milliarden US-Dollar am 21. August auf 2,67 Milliarden US-Dollar heute – ein Rückgang von ungefähr 3,1 Milliarden US-Dollar bzw. 54%.
Doch das Open Interest für Bitcoin auf Binance blieb im selben Zeitraum relativ stabil und ging nur von etwa 4,9 Milliarden US-Dollar auf 4,7 Milliarden US-Dollar zurück – ein Rückgang von lediglich rund 4%.
104
Artikel
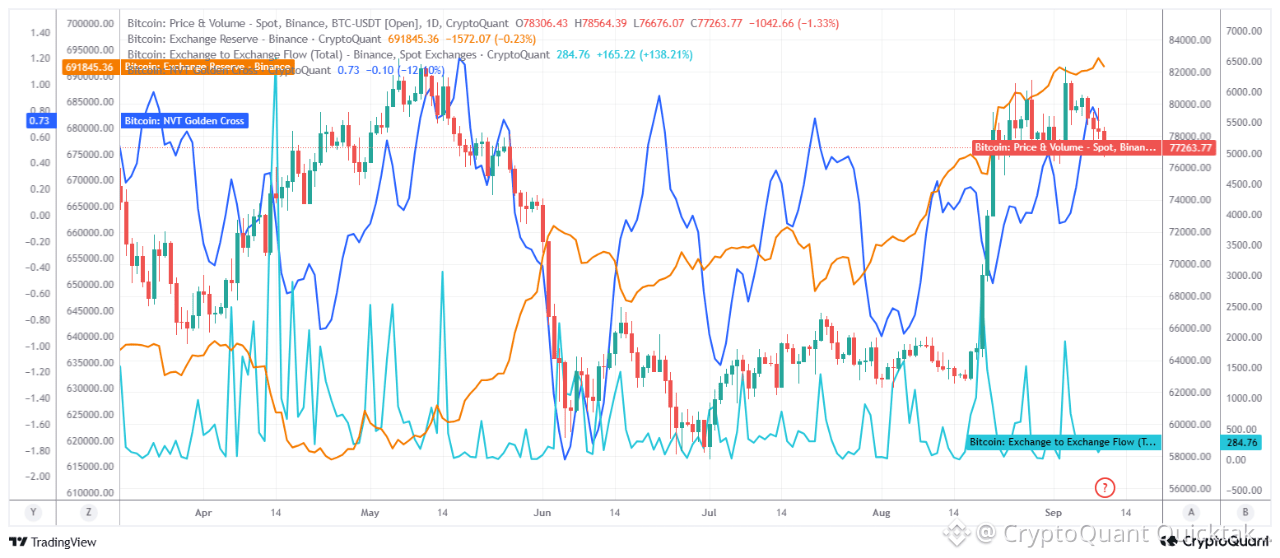
Bitcoin-Reserven bei Binance haben ein gefährliches Niveau erreichtBitcoin zeigt eine starke Erholung, aber aktuelle Daten deuten darauf hin, dass Gewinnmitnahmen möglicherweise bereits begonnen haben.
Die gesamte BTC-Reserve von Binance beläuft sich auf 691.845 BTC, was ein Warnsignal für die mittelfristige Entwicklung ist. Die Reserve ist seit Mai generell gestiegen und zeichnet damit ein vorsichtiges Bild aus Sicht der Angebotsseite. Während sich BTC Ende August und Anfang September erholte, blieben die Reserven von Binance erhöht. Diese Divergenz deutet darauf hin, dass selbst wenn der Aufwärtstrend weitergeht, das Risiko für Gewinnmitnahmen oder einen scharfen Rücksetzer möglicherweise zunimmt.
Bitcoin-Reserven bei Binance haben ein gefährliches Niveau erreicht
Bitcoin zeigt eine starke Erholung, aber aktuelle Daten deuten darauf hin, dass Gewinnmitnahmen möglicherweise bereits begonnen haben.
Die gesamte BTC-Reserve von Binance beläuft sich auf 691.845 BTC, was ein Warnsignal für die mittelfristige Entwicklung ist. Die Reserve ist seit Mai generell gestiegen und zeichnet damit ein vorsichtiges Bild aus Sicht der Angebotsseite. Während sich BTC Ende August und Anfang September erholte, blieben die Reserven von Binance erhöht. Diese Divergenz deutet darauf hin, dass selbst wenn der Aufwärtstrend weitergeht, das Risiko für Gewinnmitnahmen oder einen scharfen Rücksetzer möglicherweise zunimmt.
Die gesamte BTC-Reserve von Binance beläuft sich auf 691.845 BTC, was ein Warnsignal für die mittelfristige Entwicklung ist. Die Reserve ist seit Mai generell gestiegen und zeichnet damit ein vorsichtiges Bild aus Sicht der Angebotsseite. Während sich BTC Ende August und Anfang September erholte, blieben die Reserven von Binance erhöht. Diese Divergenz deutet darauf hin, dass selbst wenn der Aufwärtstrend weitergeht, das Risiko für Gewinnmitnahmen oder einen scharfen Rücksetzer möglicherweise zunimmt.
125
Artikel
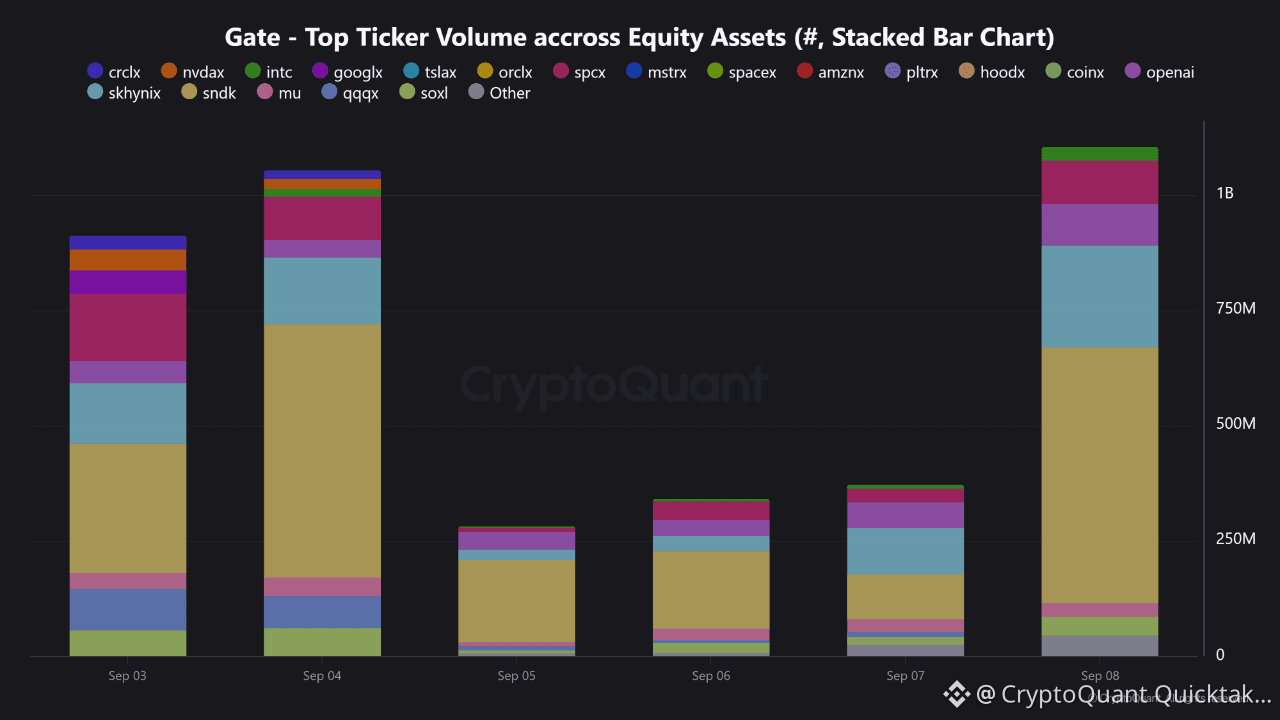
Gate’s Top-Aktienticker treiben Rekord- TradFi-VolumenDie Aktienaktivität von Gate wird zunehmend von einer kleinen Gruppe hochüberzeugter Ticker angetrieben.
In den letzten Wochen haben die führenden TradFi-Aktiennamen der Plattform ein deutliches Handelsvolumen erzeugt. Seit Ende Juli haben die Top-Aktienticker von Gate durchgehend mehr als 10 Mrd. USD an wöchentlichen Umsätzen verzeichnet. Eine einzelne Woche lag bei über 20 Mrd. USD, was einen neuen Plattformrekord markierte und einem Anstieg von 94 % gegenüber der Vorwoche entspricht.
Die herausragenden Namen sind unter anderem:
SNDK (SanDisk) glänzte mit einem außergewöhnlichen Tagesvolumen von mehr als 3,6 Mrd. USD.
Gate’s Top-Aktienticker treiben Rekord- TradFi-Volumen
Die Aktienaktivität von Gate wird zunehmend von einer kleinen Gruppe hochüberzeugter Ticker angetrieben.
In den letzten Wochen haben die führenden TradFi-Aktiennamen der Plattform ein deutliches Handelsvolumen erzeugt. Seit Ende Juli haben die Top-Aktienticker von Gate durchgehend mehr als 10 Mrd. USD an wöchentlichen Umsätzen verzeichnet. Eine einzelne Woche lag bei über 20 Mrd. USD, was einen neuen Plattformrekord markierte und einem Anstieg von 94 % gegenüber der Vorwoche entspricht.
Die herausragenden Namen sind unter anderem:
SNDK (SanDisk) glänzte mit einem außergewöhnlichen Tagesvolumen von mehr als 3,6 Mrd. USD.
In den letzten Wochen haben die führenden TradFi-Aktiennamen der Plattform ein deutliches Handelsvolumen erzeugt. Seit Ende Juli haben die Top-Aktienticker von Gate durchgehend mehr als 10 Mrd. USD an wöchentlichen Umsätzen verzeichnet. Eine einzelne Woche lag bei über 20 Mrd. USD, was einen neuen Plattformrekord markierte und einem Anstieg von 94 % gegenüber der Vorwoche entspricht.
Die herausragenden Namen sind unter anderem:
SNDK (SanDisk) glänzte mit einem außergewöhnlichen Tagesvolumen von mehr als 3,6 Mrd. USD.
134
Artikel
Übersetzung ansehen
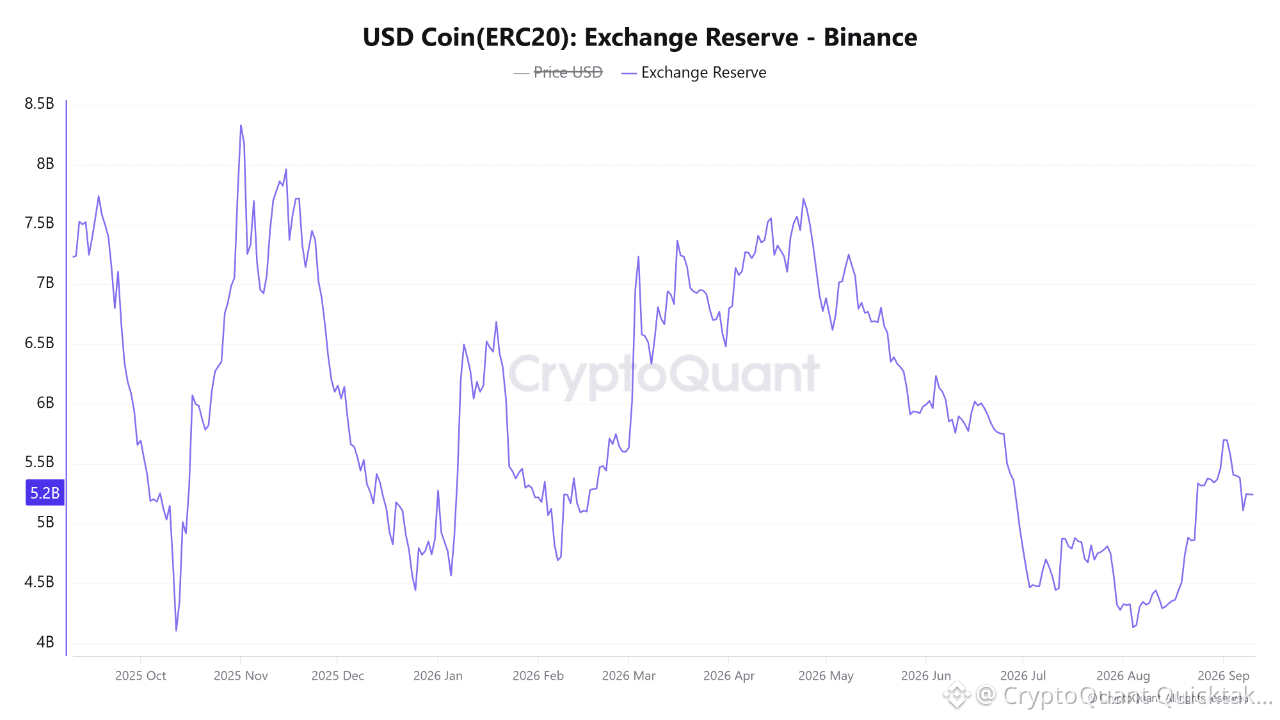
USDC Reserves on Binance Just Bounced Back.USDC mostly represents institutional money and size traders. When this reserve sat at the lows throughout July and August, the market barely had any real support. Seeing USDC flow back onto the exchange in less than a month shows a noticeable amount of cash is sitting ready in accounts again.
Capital isn't just sitting in cold wallets anymore—it's moving onto CEXs. That means people are willing to take on custody risk to wait for an opportunity.
It builds a thick buy-side liquidity cushion right on Binance. Whether this dry powder actually gets deployed to push prices up right away is hard to say. But at least the market isn't completely running on fumes like it was a few weeks ago.
Having cash parked on the exchange is where the story starts.
Written by Rei Researcher
USDC Reserves on Binance Just Bounced Back.
USDC mostly represents institutional money and size traders. When this reserve sat at the lows throughout July and August, the market barely had any real support. Seeing USDC flow back onto the exchange in less than a month shows a noticeable amount of cash is sitting ready in accounts again.
Capital isn't just sitting in cold wallets anymore—it's moving onto CEXs. That means people are willing to take on custody risk to wait for an opportunity.
It builds a thick buy-side liquidity cushion right on Binance. Whether this dry powder actually gets deployed to push prices up right away is hard to say. But at least the market isn't completely running on fumes like it was a few weeks ago.
Having cash parked on the exchange is where the story starts.
Written by Rei Researcher
Capital isn't just sitting in cold wallets anymore—it's moving onto CEXs. That means people are willing to take on custody risk to wait for an opportunity.
It builds a thick buy-side liquidity cushion right on Binance. Whether this dry powder actually gets deployed to push prices up right away is hard to say. But at least the market isn't completely running on fumes like it was a few weeks ago.
Having cash parked on the exchange is where the story starts.
Written by Rei Researcher
51
Artikel
Übersetzung ansehen
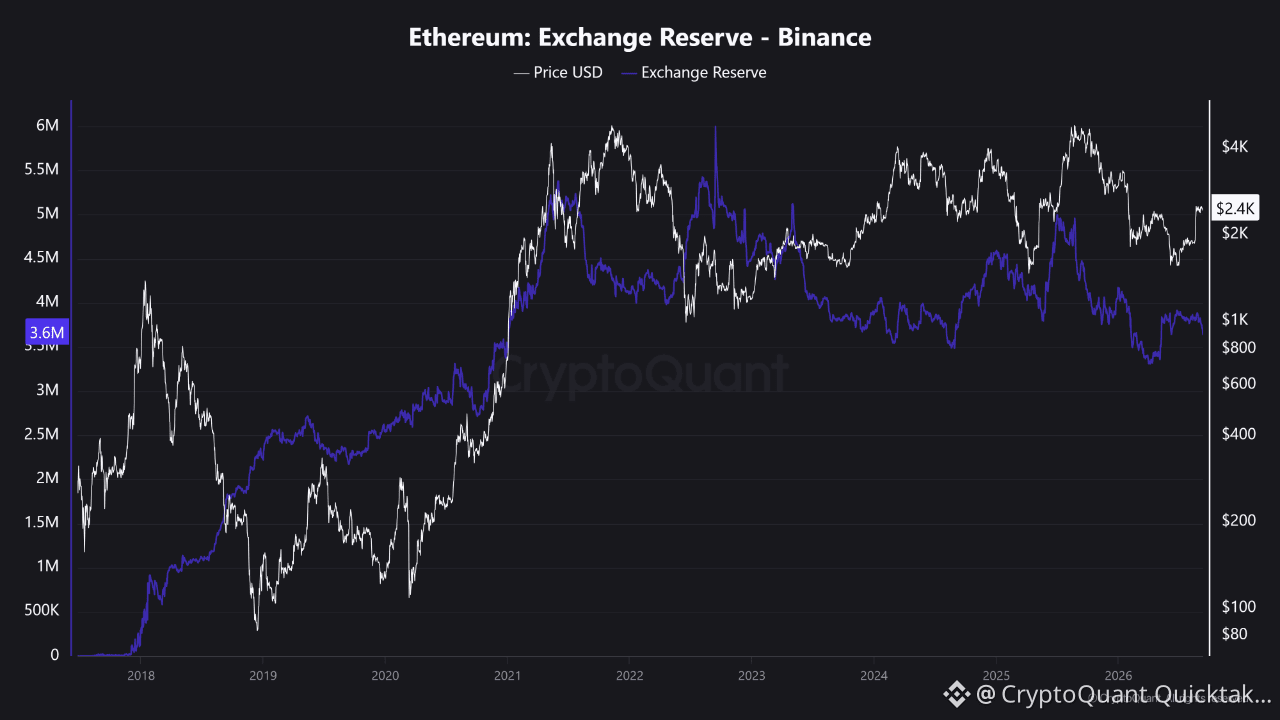
Binance ETH Reserves Drop to 3 Month Low As Staking Hits Record 35.9%Ethereum is consolidating around the $2,420 to $2,470 range after recent volatility, while a notable supply signal is emerging on Binance.
CryptoQuant data shows that Binance ETH reserves have fallen to approximately 3.74M ETH, the lowest level in three months. This decline is part of a broader reduction in exchange held ETH, with total reserves across major exchanges recently reaching a multi year low of approximately 14.88M ETH.
The decline on Binance matters because it reduces the amount of ETH immediately available for selling on one of the world's largest exchanges by trading volume. When ETH moves from exchanges into self custody or staking, the amount of liquid supply available for short term selling generally decreases.
This reserve decline coincides with a record level of Ethereum staking. Approximately 43.1M ETH, or 35.91% of circulating supply, is now staked, marking an all time high. More ETH is therefore being locked into the network rather than remaining readily available for sale on exchanges.
On the derivatives side, Binance continues to hold a significant share of ETH open interest at around $5.6B, while long positioning remains dominant. The combination of falling exchange reserves, record staking, and elevated but not extreme leverage points to a market where liquid ETH supply is gradually tightening as price consolidates.
If Binance ETH reserves continue to decline while staking remains elevated, the structural supply picture for Ethereum could improve further. The key metrics to watch are continued negative exchange netflows and whether spot demand begins absorbing the remaining available liquidity.
Written by theophiluspep
Binance ETH Reserves Drop to 3 Month Low As Staking Hits Record 35.9%
Ethereum is consolidating around the $2,420 to $2,470 range after recent volatility, while a notable supply signal is emerging on Binance.
CryptoQuant data shows that Binance ETH reserves have fallen to approximately 3.74M ETH, the lowest level in three months. This decline is part of a broader reduction in exchange held ETH, with total reserves across major exchanges recently reaching a multi year low of approximately 14.88M ETH.
The decline on Binance matters because it reduces the amount of ETH immediately available for selling on one of the world's largest exchanges by trading volume. When ETH moves from exchanges into self custody or staking, the amount of liquid supply available for short term selling generally decreases.
This reserve decline coincides with a record level of Ethereum staking. Approximately 43.1M ETH, or 35.91% of circulating supply, is now staked, marking an all time high. More ETH is therefore being locked into the network rather than remaining readily available for sale on exchanges.
On the derivatives side, Binance continues to hold a significant share of ETH open interest at around $5.6B, while long positioning remains dominant. The combination of falling exchange reserves, record staking, and elevated but not extreme leverage points to a market where liquid ETH supply is gradually tightening as price consolidates.
If Binance ETH reserves continue to decline while staking remains elevated, the structural supply picture for Ethereum could improve further. The key metrics to watch are continued negative exchange netflows and whether spot demand begins absorbing the remaining available liquidity.
Written by theophiluspep
CryptoQuant data shows that Binance ETH reserves have fallen to approximately 3.74M ETH, the lowest level in three months. This decline is part of a broader reduction in exchange held ETH, with total reserves across major exchanges recently reaching a multi year low of approximately 14.88M ETH.
The decline on Binance matters because it reduces the amount of ETH immediately available for selling on one of the world's largest exchanges by trading volume. When ETH moves from exchanges into self custody or staking, the amount of liquid supply available for short term selling generally decreases.
This reserve decline coincides with a record level of Ethereum staking. Approximately 43.1M ETH, or 35.91% of circulating supply, is now staked, marking an all time high. More ETH is therefore being locked into the network rather than remaining readily available for sale on exchanges.
On the derivatives side, Binance continues to hold a significant share of ETH open interest at around $5.6B, while long positioning remains dominant. The combination of falling exchange reserves, record staking, and elevated but not extreme leverage points to a market where liquid ETH supply is gradually tightening as price consolidates.
If Binance ETH reserves continue to decline while staking remains elevated, the structural supply picture for Ethereum could improve further. The key metrics to watch are continued negative exchange netflows and whether spot demand begins absorbing the remaining available liquidity.
Written by theophiluspep
140
Artikel
Übersetzung ansehen
ECB Hike + Hot US PPI Send Bitcoin Futures Into Sell-off ModeThis afternoon, markets faced two rather negative pieces of news.
The first is the 0.25bps rate hike announced by the ECB. This is the second rate hike of the year, driven by concerns over rising inflation.
We also just got US Producer Price Index (PPI) figures, which came in stronger than expected. Core PPI, which excludes food and energy, rose to 4.6% YoY versus 4.5% expected, and headline PPI came in at 5.4% versus 5.1% expected.
These figures add to fears of intensifying inflation, something the markets immediately priced in.
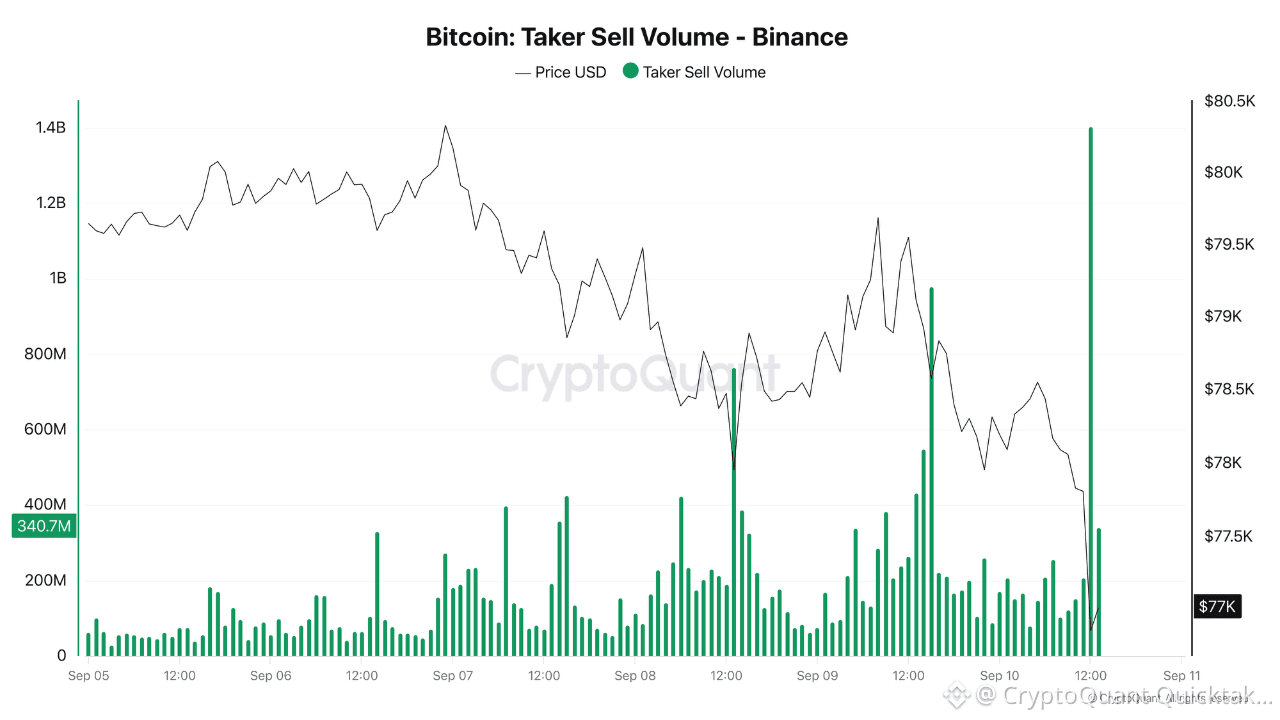
This can be seen in the Bitcoin futures market, where Taker sell volume surged to over $1.4 billion on Binance in that hour alone.
This sudden spike in selling pressure on futures reflects real investor concern, as they prefer to hedge by betting on a Bitcoin downside. The move was also accompanied by more than $60 million liquidated on Bitcoin in under an hour.
Written by Darkfost
ECB Hike + Hot US PPI Send Bitcoin Futures Into Sell-off Mode
This afternoon, markets faced two rather negative pieces of news.
The first is the 0.25bps rate hike announced by the ECB. This is the second rate hike of the year, driven by concerns over rising inflation.
We also just got US Producer Price Index (PPI) figures, which came in stronger than expected. Core PPI, which excludes food and energy, rose to 4.6% YoY versus 4.5% expected, and headline PPI came in at 5.4% versus 5.1% expected.
These figures add to fears of intensifying inflation, something the markets immediately priced in.
This can be seen in the Bitcoin futures market, where Taker sell volume surged to over $1.4 billion on Binance in that hour alone.
This sudden spike in selling pressure on futures reflects real investor concern, as they prefer to hedge by betting on a Bitcoin downside. The move was also accompanied by more than $60 million liquidated on Bitcoin in under an hour.
Written by Darkfost
The first is the 0.25bps rate hike announced by the ECB. This is the second rate hike of the year, driven by concerns over rising inflation.
We also just got US Producer Price Index (PPI) figures, which came in stronger than expected. Core PPI, which excludes food and energy, rose to 4.6% YoY versus 4.5% expected, and headline PPI came in at 5.4% versus 5.1% expected.
These figures add to fears of intensifying inflation, something the markets immediately priced in.
This can be seen in the Bitcoin futures market, where Taker sell volume surged to over $1.4 billion on Binance in that hour alone.
This sudden spike in selling pressure on futures reflects real investor concern, as they prefer to hedge by betting on a Bitcoin downside. The move was also accompanied by more than $60 million liquidated on Bitcoin in under an hour.
Written by Darkfost
95
Artikel
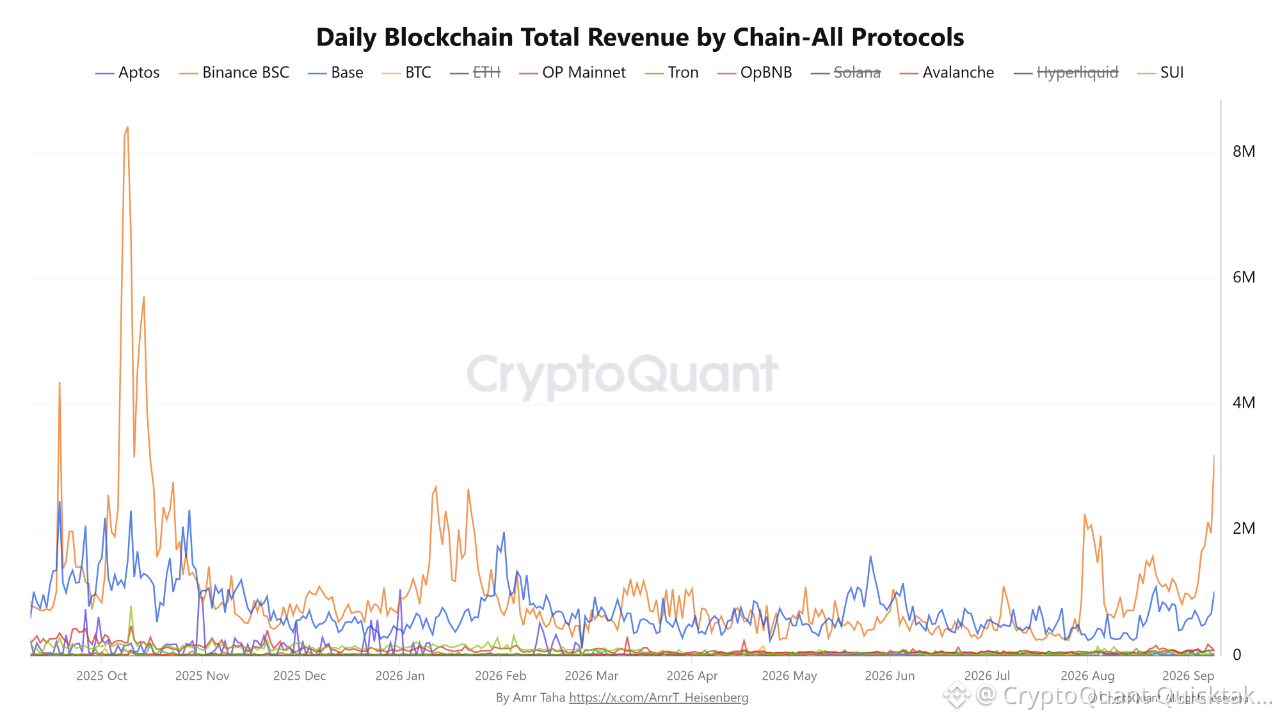
Die Protokolleinnahmen auf BNB Chain steigen um 42% auf den höchsten Stand seit Oktober 2025Die tägliche Gesamteinnahme der BNB Smart Chain stieg auf 3,2 Mio. $ am 9. September, den höchsten Stand seit Oktober 2025. Das markiert einen starken Anstieg der gebührengenerierenden Aktivität über alle Protokolle hinweg im Netzwerk.
Der neueste Stand liegt rund 42% über den 2,25 Mio. $, die am 31. Juli verzeichnet wurden, als Bitcoin nahe 62,4 Tsd. $ gehandelt wurde.
Im gleichen Zeitraum stieg BTC um etwa 26% auf 78,4 Tsd. $, was bedeutet, dass die Einnahmen der BSC-Protokolle deutlich schneller gewachsen sind als der Preis von Bitcoin.
Das aktuelle Niveau liegt zudem etwa 19% über den 2,68 Mio. $, die am 12. Januar erfasst wurden, obwohl Bitcoin mittlerweile ungefähr 14% unter seinem Januarkurs von 91,2 Tsd. $ liegt.
Die Protokolleinnahmen auf BNB Chain steigen um 42% auf den höchsten Stand seit Oktober 2025
Die tägliche Gesamteinnahme der BNB Smart Chain stieg auf 3,2 Mio. $ am 9. September, den höchsten Stand seit Oktober 2025. Das markiert einen starken Anstieg der gebührengenerierenden Aktivität über alle Protokolle hinweg im Netzwerk.
Der neueste Stand liegt rund 42% über den 2,25 Mio. $, die am 31. Juli verzeichnet wurden, als Bitcoin nahe 62,4 Tsd. $ gehandelt wurde.
Im gleichen Zeitraum stieg BTC um etwa 26% auf 78,4 Tsd. $, was bedeutet, dass die Einnahmen der BSC-Protokolle deutlich schneller gewachsen sind als der Preis von Bitcoin.
Das aktuelle Niveau liegt zudem etwa 19% über den 2,68 Mio. $, die am 12. Januar erfasst wurden, obwohl Bitcoin mittlerweile ungefähr 14% unter seinem Januarkurs von 91,2 Tsd. $ liegt.
Der neueste Stand liegt rund 42% über den 2,25 Mio. $, die am 31. Juli verzeichnet wurden, als Bitcoin nahe 62,4 Tsd. $ gehandelt wurde.
Im gleichen Zeitraum stieg BTC um etwa 26% auf 78,4 Tsd. $, was bedeutet, dass die Einnahmen der BSC-Protokolle deutlich schneller gewachsen sind als der Preis von Bitcoin.
Das aktuelle Niveau liegt zudem etwa 19% über den 2,68 Mio. $, die am 12. Januar erfasst wurden, obwohl Bitcoin mittlerweile ungefähr 14% unter seinem Januarkurs von 91,2 Tsd. $ liegt.
134
Artikel
Übersetzung ansehen
Bitcoin Demand Is Stabilizing. Now It Needs ConvictionBitcoin’s apparent demand structure is beginning to improve, but the market is not yet showing the type of demand expansion normally associated with a sustained bullish regime.
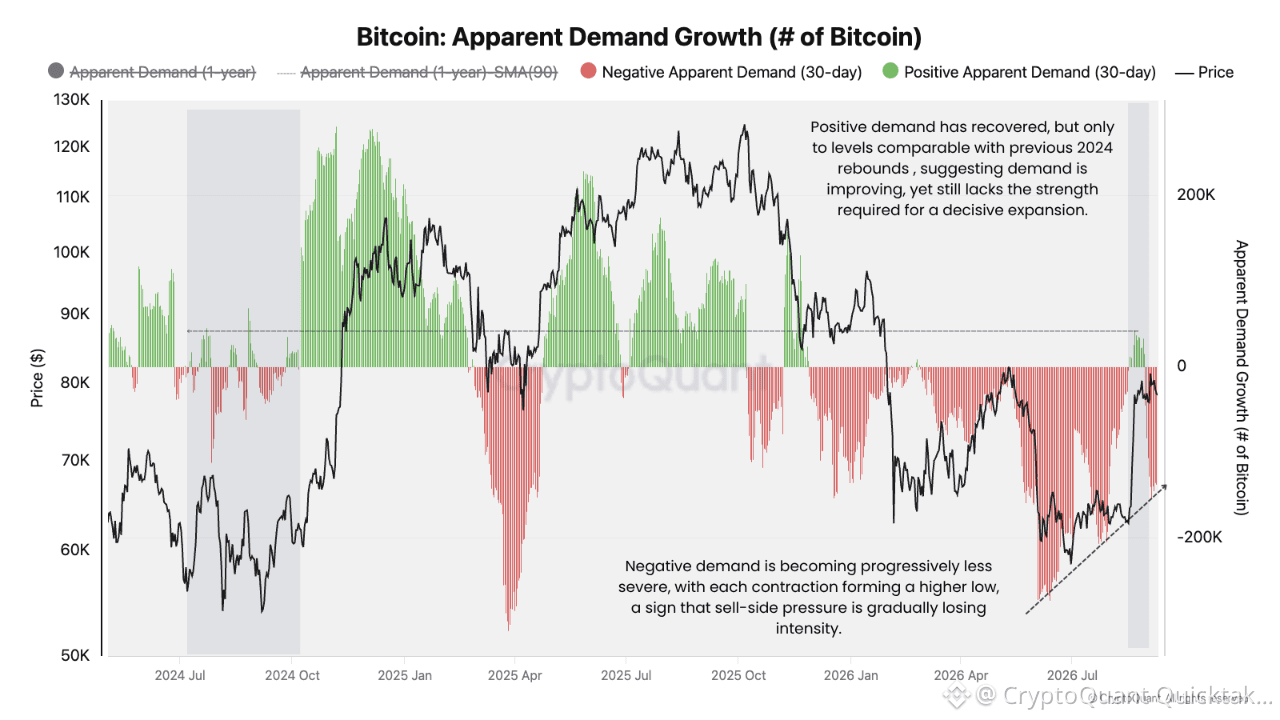
Apparent Demand is designed to capture whether new Bitcoin supply is being absorbed by the market. In practical terms, positive readings point to net demand expansion, while negative readings indicate that available supply is exceeding the amount being absorbed.
The most constructive development is occurring on the negative side of the metric.
Since the deep contraction registered around May–June, successive negative-demand troughs have become progressively shallower. The higher-low structure suggests that the imbalance beneath price is improving: each new contraction is requiring less demand destruction than the previous one.
That is an important characteristic of a market moving away from a bearish regime. But there is another side to the signal.
The recent return of positive apparent demand has so far reached only levels comparable with relatively modest rebounds seen during 2024. It remains far from the stronger and more persistent demand expansions visible during the major advances of late 2024 and 2025.
Bitcoin may be transitioning from demand contraction into demand stabilization, rather than already entering demand expansion. Price can recover during that transition because the marginal imbalance between supply and demand is improving.
But for a durable upside leg, the market likely needs a sustained positive demand, progressively higher demand peaks, and enough liquidity and investor conviction to absorb supply consistently rather than temporarily.
Written by MorenoDV_
Bitcoin Demand Is Stabilizing. Now It Needs Conviction
Bitcoin’s apparent demand structure is beginning to improve, but the market is not yet showing the type of demand expansion normally associated with a sustained bullish regime.
Apparent Demand is designed to capture whether new Bitcoin supply is being absorbed by the market. In practical terms, positive readings point to net demand expansion, while negative readings indicate that available supply is exceeding the amount being absorbed.
The most constructive development is occurring on the negative side of the metric.
Since the deep contraction registered around May–June, successive negative-demand troughs have become progressively shallower. The higher-low structure suggests that the imbalance beneath price is improving: each new contraction is requiring less demand destruction than the previous one.
That is an important characteristic of a market moving away from a bearish regime. But there is another side to the signal.
The recent return of positive apparent demand has so far reached only levels comparable with relatively modest rebounds seen during 2024. It remains far from the stronger and more persistent demand expansions visible during the major advances of late 2024 and 2025.
Bitcoin may be transitioning from demand contraction into demand stabilization, rather than already entering demand expansion. Price can recover during that transition because the marginal imbalance between supply and demand is improving.
But for a durable upside leg, the market likely needs a sustained positive demand, progressively higher demand peaks, and enough liquidity and investor conviction to absorb supply consistently rather than temporarily.
Written by MorenoDV_
Apparent Demand is designed to capture whether new Bitcoin supply is being absorbed by the market. In practical terms, positive readings point to net demand expansion, while negative readings indicate that available supply is exceeding the amount being absorbed.
The most constructive development is occurring on the negative side of the metric.
Since the deep contraction registered around May–June, successive negative-demand troughs have become progressively shallower. The higher-low structure suggests that the imbalance beneath price is improving: each new contraction is requiring less demand destruction than the previous one.
That is an important characteristic of a market moving away from a bearish regime. But there is another side to the signal.
The recent return of positive apparent demand has so far reached only levels comparable with relatively modest rebounds seen during 2024. It remains far from the stronger and more persistent demand expansions visible during the major advances of late 2024 and 2025.
Bitcoin may be transitioning from demand contraction into demand stabilization, rather than already entering demand expansion. Price can recover during that transition because the marginal imbalance between supply and demand is improving.
But for a durable upside leg, the market likely needs a sustained positive demand, progressively higher demand peaks, and enough liquidity and investor conviction to absorb supply consistently rather than temporarily.
Written by MorenoDV_
103
Artikel
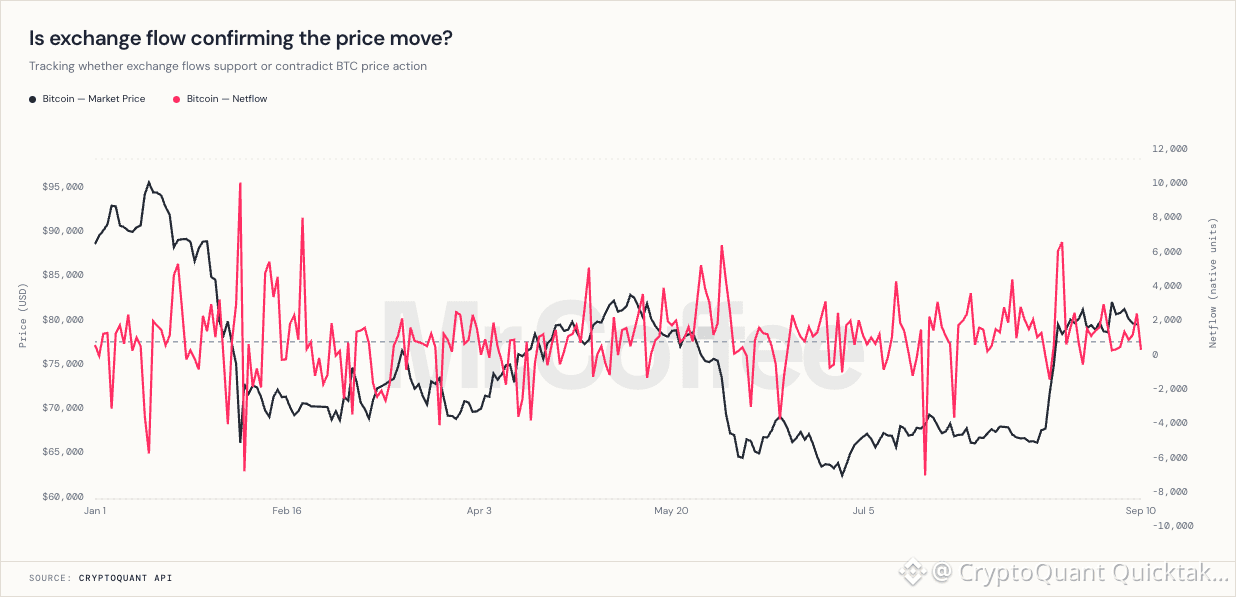
Bestätigt der Exchange-Flow die Kursbewegung?BTC ist wieder über 80.000 US-Dollar, aber irgendetwas fühlt sich ein wenig seltsam an
Der Exchange-Nettozufluss hat gerade wieder einen ziemlich großen Ausschlag gepostet, und wir haben ähnliche Ausschläge während des Verkaufs im Zeitraum von Mai bis Juli gesehen
Offensichtlich bedeutet das nicht, dass BTC gleich abstürzen wird, aber diese großen Zuflüsse, während der Kurs weiter nach oben drückt, ist etwas, das ich nicht ignorieren möchte
Vielleicht nutzen Verkäufer die Stärke aus, oder vielleicht absorbiert der Markt einfach den ganzen Flow und drückt weiter nach oben
Mal sehen, was davon sich durchsetzt
Geschrieben von nocoffeenobrain
Bestätigt der Exchange-Flow die Kursbewegung?
BTC ist wieder über 80.000 US-Dollar, aber irgendetwas fühlt sich ein wenig seltsam an
Der Exchange-Nettozufluss hat gerade wieder einen ziemlich großen Ausschlag gepostet, und wir haben ähnliche Ausschläge während des Verkaufs im Zeitraum von Mai bis Juli gesehen
Offensichtlich bedeutet das nicht, dass BTC gleich abstürzen wird, aber diese großen Zuflüsse, während der Kurs weiter nach oben drückt, ist etwas, das ich nicht ignorieren möchte
Vielleicht nutzen Verkäufer die Stärke aus, oder vielleicht absorbiert der Markt einfach den ganzen Flow und drückt weiter nach oben
Mal sehen, was davon sich durchsetzt
Geschrieben von nocoffeenobrain
Der Exchange-Nettozufluss hat gerade wieder einen ziemlich großen Ausschlag gepostet, und wir haben ähnliche Ausschläge während des Verkaufs im Zeitraum von Mai bis Juli gesehen
Offensichtlich bedeutet das nicht, dass BTC gleich abstürzen wird, aber diese großen Zuflüsse, während der Kurs weiter nach oben drückt, ist etwas, das ich nicht ignorieren möchte
Vielleicht nutzen Verkäufer die Stärke aus, oder vielleicht absorbiert der Markt einfach den ganzen Flow und drückt weiter nach oben
Mal sehen, was davon sich durchsetzt
Geschrieben von nocoffeenobrain
1
1
226
Artikel
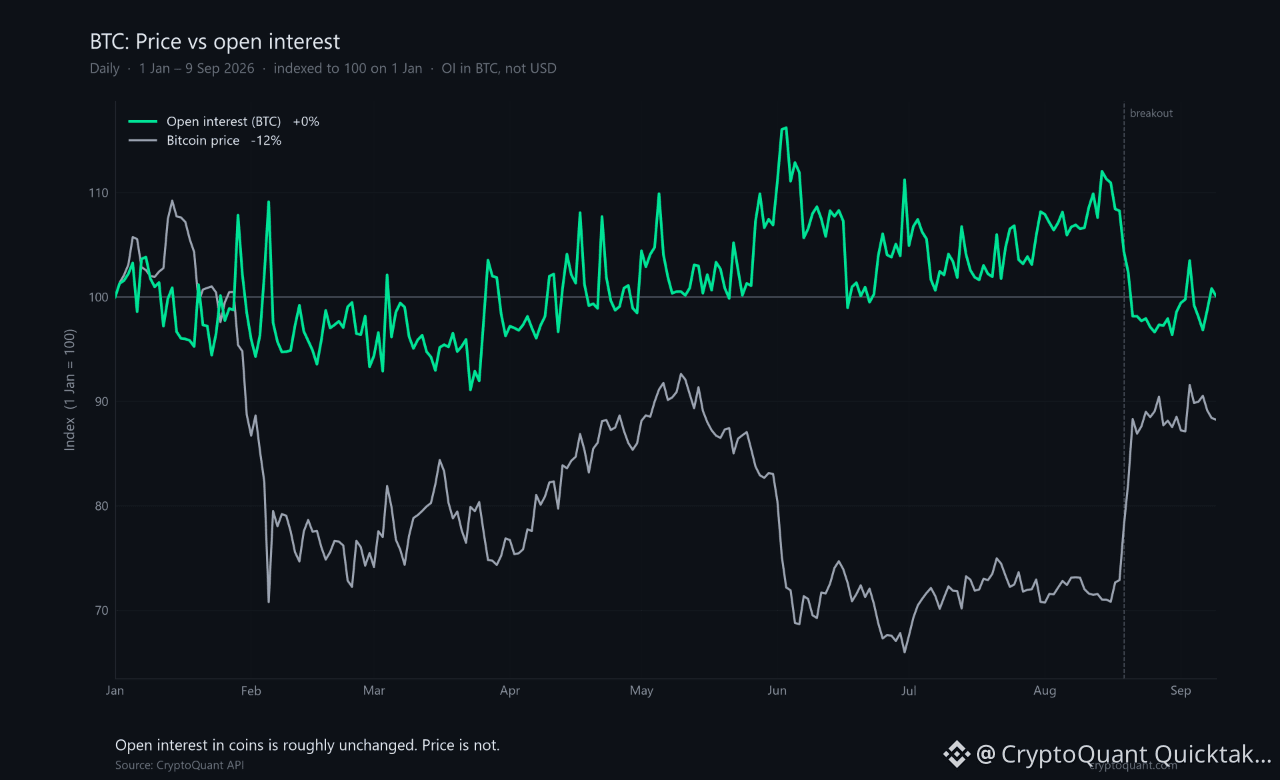
Seit Januar ist Bitcoin um etwa 12% gefallen. Das Open Interest in Coins jedoch nicht.Vom 1. Januar bis zum 9. September, indexiert auf 100: Der Preis endete bei etwa 88, das Open Interest in BTC bei etwa 100. Genau die gleiche Menge Bitcoin liegt in Perps. Sehr unterschiedlicher Preis. Das Juni-Tief brachte den Preis nahe $58,5k. Der August-Ausbruch markierte $80k zweimal. Diese Bewegungen sind weder als dauerhafte Verschiebung im Coin-denominierten OI sichtbar.
Das USD-Open-Interest wirkt wie fest mit dem Preis verklebt. Das liegt zum größten Teil an der Einheit. Wenn das Notional in Dollar gemessen wird, steigt das OI, sobald der Preis steigt, selbst wenn niemand eine größere Coin-Position eröffnet hat. Teile durch den Preis und die Einsatzgröße in BTC – das blieb kaum im Trend. Es pendelte nur um das gleiche Niveau. Es explodierte nicht mit dem Ausbruch im August, und es brach nicht mit dem Tief im Juni ein.
Seit Januar ist Bitcoin um etwa 12% gefallen. Das Open Interest in Coins jedoch nicht.
Vom 1. Januar bis zum 9. September, indexiert auf 100: Der Preis endete bei etwa 88, das Open Interest in BTC bei etwa 100. Genau die gleiche Menge Bitcoin liegt in Perps. Sehr unterschiedlicher Preis. Das Juni-Tief brachte den Preis nahe $58,5k. Der August-Ausbruch markierte $80k zweimal. Diese Bewegungen sind weder als dauerhafte Verschiebung im Coin-denominierten OI sichtbar.
Das USD-Open-Interest wirkt wie fest mit dem Preis verklebt. Das liegt zum größten Teil an der Einheit. Wenn das Notional in Dollar gemessen wird, steigt das OI, sobald der Preis steigt, selbst wenn niemand eine größere Coin-Position eröffnet hat. Teile durch den Preis und die Einsatzgröße in BTC – das blieb kaum im Trend. Es pendelte nur um das gleiche Niveau. Es explodierte nicht mit dem Ausbruch im August, und es brach nicht mit dem Tief im Juni ein.
Das USD-Open-Interest wirkt wie fest mit dem Preis verklebt. Das liegt zum größten Teil an der Einheit. Wenn das Notional in Dollar gemessen wird, steigt das OI, sobald der Preis steigt, selbst wenn niemand eine größere Coin-Position eröffnet hat. Teile durch den Preis und die Einsatzgröße in BTC – das blieb kaum im Trend. Es pendelte nur um das gleiche Niveau. Es explodierte nicht mit dem Ausbruch im August, und es brach nicht mit dem Tief im Juni ein.
122
Artikel
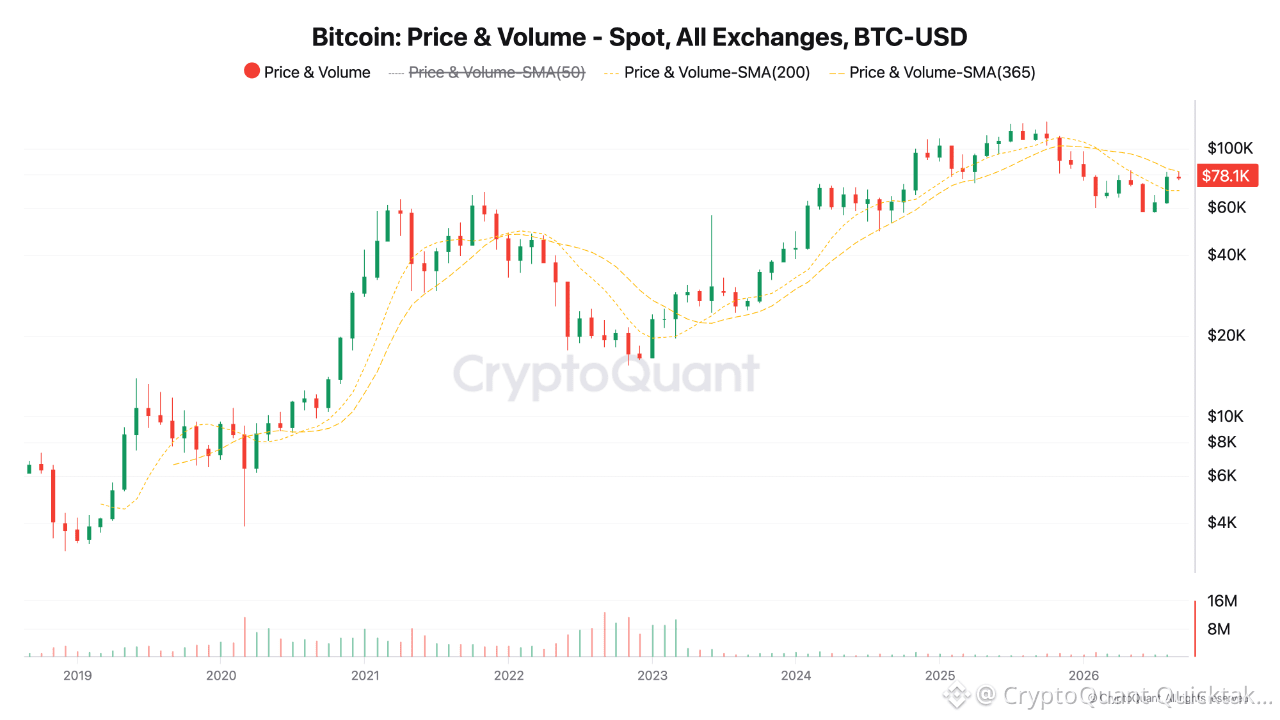
Stimmt die echte Erholung oder ist das Geschäft noch nicht beendet?Bitcoin hat sowohl seine 200-Tage-SMA als auch seine 200-Wochen-MA zurückerobert, nachdem es diese im frühen Juni kurz unterschritten hatte und sich danach fast zwei Monate lang nahe daran konsolidierte. Der Ausbruch erfolgte am 19. August, aber der Widerstand an der 365-Tage-SMA (~82.000 $) hat bereits einen Test abgewiesen: Der Kurs schoss am 3. September auf 82.293 $ und zog sich anschließend zurück in Richtung 79.000 $.
On-Chain bleibt der Preis oberhalb sowohl des Realized Price der kurzfristigen als auch der langfristigen Inhaber. Die STH-SOPR liegt nahe bei 1,00 — auf Break-even. Die LTH-SOPR ist aussagekräftiger: Sie verbrachte den Großteil von 2026 unter 1, was bedeutet, dass langfristige Inhaber über einen Großteil des Jahres Verluste realisierten, keine Gewinne. Nur die letzten zwei Wochen zeigten Werte über 1 (1,20 am 8. September), immer noch volatil — am nächsten Tag fiel sie auf 0,89. NUPL liegt bei 0,32, in der Optimismus-Zone: Die Stimmung hat sich zwar ins Positive gedreht, ist aber noch weit von Euphorie entfernt.
Stimmt die echte Erholung oder ist das Geschäft noch nicht beendet?
Bitcoin hat sowohl seine 200-Tage-SMA als auch seine 200-Wochen-MA zurückerobert, nachdem es diese im frühen Juni kurz unterschritten hatte und sich danach fast zwei Monate lang nahe daran konsolidierte. Der Ausbruch erfolgte am 19. August, aber der Widerstand an der 365-Tage-SMA (~82.000 $) hat bereits einen Test abgewiesen: Der Kurs schoss am 3. September auf 82.293 $ und zog sich anschließend zurück in Richtung 79.000 $.
On-Chain bleibt der Preis oberhalb sowohl des Realized Price der kurzfristigen als auch der langfristigen Inhaber. Die STH-SOPR liegt nahe bei 1,00 — auf Break-even. Die LTH-SOPR ist aussagekräftiger: Sie verbrachte den Großteil von 2026 unter 1, was bedeutet, dass langfristige Inhaber über einen Großteil des Jahres Verluste realisierten, keine Gewinne. Nur die letzten zwei Wochen zeigten Werte über 1 (1,20 am 8. September), immer noch volatil — am nächsten Tag fiel sie auf 0,89. NUPL liegt bei 0,32, in der Optimismus-Zone: Die Stimmung hat sich zwar ins Positive gedreht, ist aber noch weit von Euphorie entfernt.
On-Chain bleibt der Preis oberhalb sowohl des Realized Price der kurzfristigen als auch der langfristigen Inhaber. Die STH-SOPR liegt nahe bei 1,00 — auf Break-even. Die LTH-SOPR ist aussagekräftiger: Sie verbrachte den Großteil von 2026 unter 1, was bedeutet, dass langfristige Inhaber über einen Großteil des Jahres Verluste realisierten, keine Gewinne. Nur die letzten zwei Wochen zeigten Werte über 1 (1,20 am 8. September), immer noch volatil — am nächsten Tag fiel sie auf 0,89. NUPL liegt bei 0,32, in der Optimismus-Zone: Die Stimmung hat sich zwar ins Positive gedreht, ist aber noch weit von Euphorie entfernt.
118
Artikel
"I'm the House Now ! "Eine ikonische Aussage von Finanzminister Scott Bessent zur US-Intervention beim Yen.
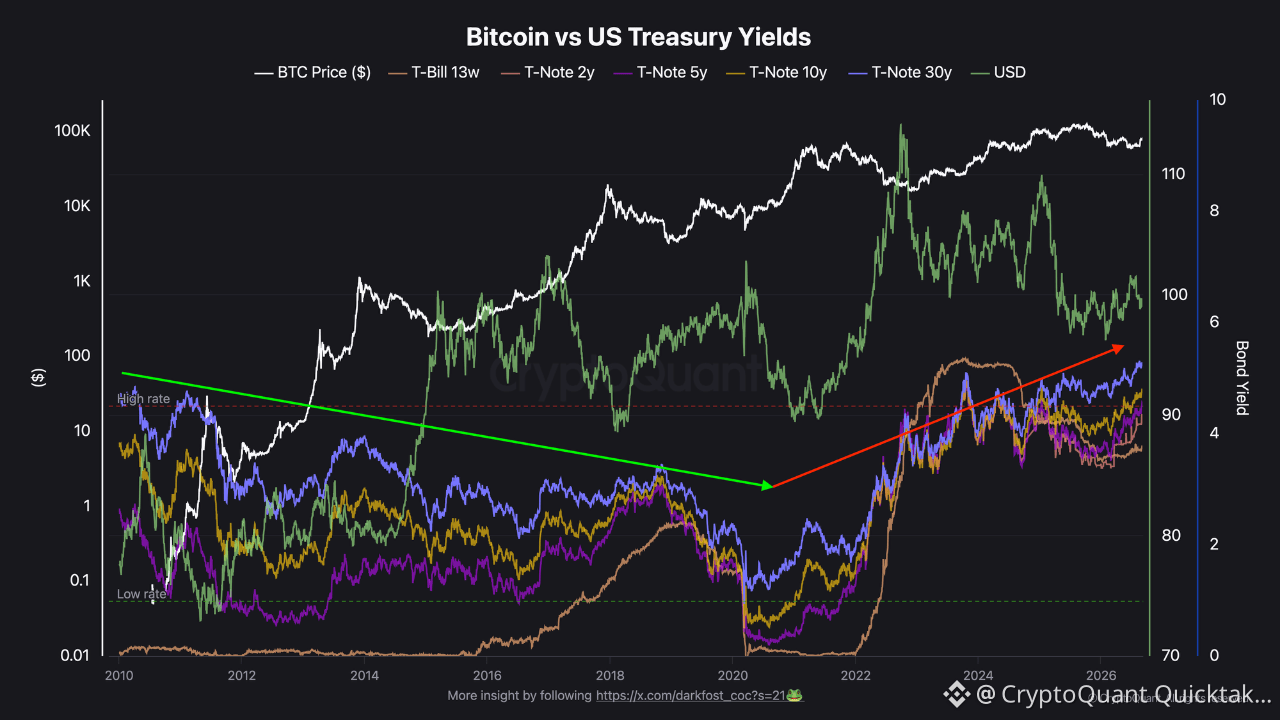
Zugleich kündigte Bessent an, dass das US-Finanzministerium mehr als 6 Milliarden US-Dollar in 10- bis 20-jährige Staatsanleihen kaufen würde – eine Ankündigung, die darauf abzielte, den explosiven Aufwärtstrend der Renditen zu dämpfen.
Eine Ankündigung, die sich für viele als ziemlich enttäuschend herausstellte – bis hin zu dem Punkt, dass sich die US-10Y-Kurve der 5%-Marke und ihrem letzten Hoch von 2023 nähert, ein Niveau ähnlich dem von 2008. Das gilt auch für die US-20Y, die seit Juli nun oberhalb von 5% gehandelt wird.
"I'm the House Now ! "
Eine ikonische Aussage von Finanzminister Scott Bessent zur US-Intervention beim Yen.
Zugleich kündigte Bessent an, dass das US-Finanzministerium mehr als 6 Milliarden US-Dollar in 10- bis 20-jährige Staatsanleihen kaufen würde – eine Ankündigung, die darauf abzielte, den explosiven Aufwärtstrend der Renditen zu dämpfen.
Eine Ankündigung, die sich für viele als ziemlich enttäuschend herausstellte – bis hin zu dem Punkt, dass sich die US-10Y-Kurve der 5%-Marke und ihrem letzten Hoch von 2023 nähert, ein Niveau ähnlich dem von 2008. Das gilt auch für die US-20Y, die seit Juli nun oberhalb von 5% gehandelt wird.
Zugleich kündigte Bessent an, dass das US-Finanzministerium mehr als 6 Milliarden US-Dollar in 10- bis 20-jährige Staatsanleihen kaufen würde – eine Ankündigung, die darauf abzielte, den explosiven Aufwärtstrend der Renditen zu dämpfen.
Eine Ankündigung, die sich für viele als ziemlich enttäuschend herausstellte – bis hin zu dem Punkt, dass sich die US-10Y-Kurve der 5%-Marke und ihrem letzten Hoch von 2023 nähert, ein Niveau ähnlich dem von 2008. Das gilt auch für die US-20Y, die seit Juli nun oberhalb von 5% gehandelt wird.
189
Artikel
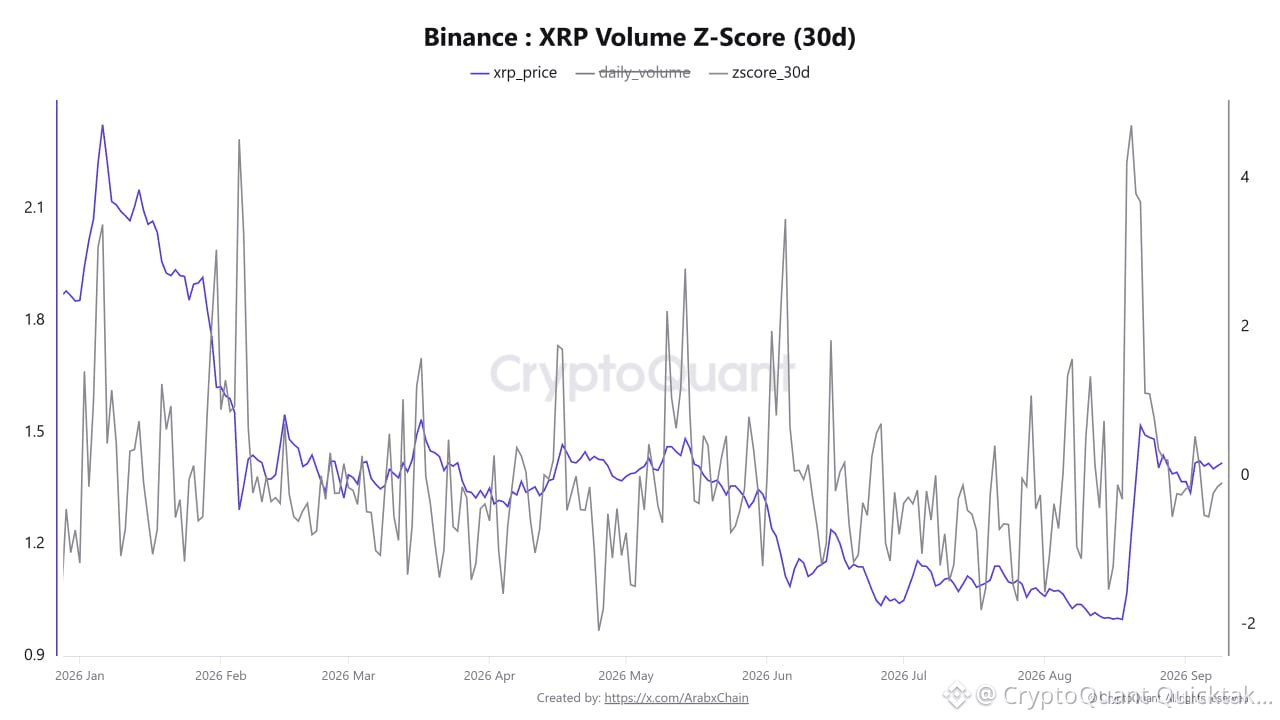
XRP-Handelsvolumen-Z-Score sinkt auf Binance, während die Aktivität abkühltDer Binance XRP-Volumen-Z-Score (30 Tage) Indikator zeigt einen Rückgang der Dynamik bei den XRP-Handelsvolumina auf der Binance-Plattform, nachdem es in der zweiten Hälfte des Augusts zu einem Anstieg der Marktaktivität gekommen war. Die Daten zeigen, dass der Z-Score über 4 seinen Höhepunkt erreichte, zeitgleich mit dem Kursanstieg von XRP von nahe 1,00 USD auf über 1,40 USD. Das spiegelt einen außergewöhnlichen Anstieg des Handelsvolumens im Verhältnis zum 30-Tage-Durchschnitt wider.
Der Indikator befindet sich jedoch anschließend in einem Abwärtstrend und liegt derzeit nahe bei null. Am 9. September lag er bei ungefähr -0,09, während der XRP-Preis sich bei rund 1,419 USD stabilisierte. Dieses Niveau bedeutet, dass das aktuelle Handelsvolumen sehr nah am Durchschnitt für den gemessenen Zeitraum liegt und keine nennenswerte positive oder negative Abweichung von der typischen Aktivität zeigt.
XRP-Handelsvolumen-Z-Score sinkt auf Binance, während die Aktivität abkühlt
Der Binance XRP-Volumen-Z-Score (30 Tage) Indikator zeigt einen Rückgang der Dynamik bei den XRP-Handelsvolumina auf der Binance-Plattform, nachdem es in der zweiten Hälfte des Augusts zu einem Anstieg der Marktaktivität gekommen war. Die Daten zeigen, dass der Z-Score über 4 seinen Höhepunkt erreichte, zeitgleich mit dem Kursanstieg von XRP von nahe 1,00 USD auf über 1,40 USD. Das spiegelt einen außergewöhnlichen Anstieg des Handelsvolumens im Verhältnis zum 30-Tage-Durchschnitt wider.
Der Indikator befindet sich jedoch anschließend in einem Abwärtstrend und liegt derzeit nahe bei null. Am 9. September lag er bei ungefähr -0,09, während der XRP-Preis sich bei rund 1,419 USD stabilisierte. Dieses Niveau bedeutet, dass das aktuelle Handelsvolumen sehr nah am Durchschnitt für den gemessenen Zeitraum liegt und keine nennenswerte positive oder negative Abweichung von der typischen Aktivität zeigt.
Der Indikator befindet sich jedoch anschließend in einem Abwärtstrend und liegt derzeit nahe bei null. Am 9. September lag er bei ungefähr -0,09, während der XRP-Preis sich bei rund 1,419 USD stabilisierte. Dieses Niveau bedeutet, dass das aktuelle Handelsvolumen sehr nah am Durchschnitt für den gemessenen Zeitraum liegt und keine nennenswerte positive oder negative Abweichung von der typischen Aktivität zeigt.
196
Artikel
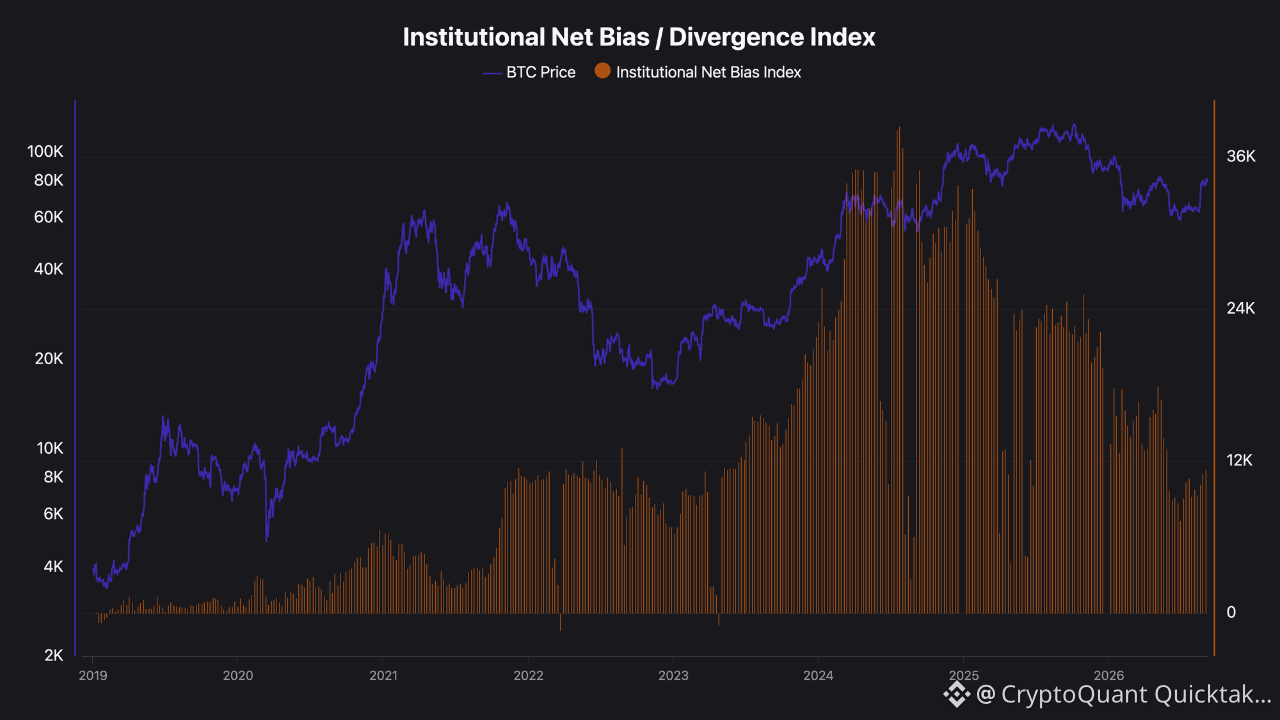
Institutional Trap oder das endgültige Tief? Was der Net Bias Index über BTC aussagtWährend Bitcoin sich dem Ende seiner Bärenmarktphase nähert, ist der institutionelle Net Bias Index auf der CME-Seite auf die unteren Werte zurückgegangen, die während 2021–2022 zu sehen waren. Amerikanische institutionelle Anleger, Hedgefonds und Asset-Management-Gesellschaften strukturieren und rebalancieren ihre Positionen in regelmäßigen Abständen neu.
Während des makroökonomischen Tiefs im Jahr 2022 fiel Bitcoin auf etwa 15.000 US-Dollar, während der Net Bias Index auf den Bereich von 8K–10K einbrach. Aktuell wird Bitcoin bei rund 78K gehandelt, während der institutionelle Net Bias Index bei 11K liegt – eine Kennzahl, die tatsächlich bis auf 8K gesunken ist, als Bitcoin bei 60K war.
Institutional Trap oder das endgültige Tief? Was der Net Bias Index über BTC aussagt
Während Bitcoin sich dem Ende seiner Bärenmarktphase nähert, ist der institutionelle Net Bias Index auf der CME-Seite auf die unteren Werte zurückgegangen, die während 2021–2022 zu sehen waren. Amerikanische institutionelle Anleger, Hedgefonds und Asset-Management-Gesellschaften strukturieren und rebalancieren ihre Positionen in regelmäßigen Abständen neu.
Während des makroökonomischen Tiefs im Jahr 2022 fiel Bitcoin auf etwa 15.000 US-Dollar, während der Net Bias Index auf den Bereich von 8K–10K einbrach. Aktuell wird Bitcoin bei rund 78K gehandelt, während der institutionelle Net Bias Index bei 11K liegt – eine Kennzahl, die tatsächlich bis auf 8K gesunken ist, als Bitcoin bei 60K war.
Während des makroökonomischen Tiefs im Jahr 2022 fiel Bitcoin auf etwa 15.000 US-Dollar, während der Net Bias Index auf den Bereich von 8K–10K einbrach. Aktuell wird Bitcoin bei rund 78K gehandelt, während der institutionelle Net Bias Index bei 11K liegt – eine Kennzahl, die tatsächlich bis auf 8K gesunken ist, als Bitcoin bei 60K war.
140
Anmelden und weiter Inhalte entdecken
Krypto-Nutzer weltweit auf Binance Square kennenlernen
⚡️ Bleib in Sachen Krypto stets am Puls.
💬 Die weltgrößte Kryptobörse vertraut darauf.
👍 Erhalte verlässliche Einblicke von verifizierten Creators.
E-Mail-Adresse/Telefonnummer
Trendthemen
CPIWatch
86.2M Aufrufe
499,665 Kommentare
Teile & gewinne Traffic-Belohnungen in unserer Kampagne mit den Trend-Hashtags
✨Thema: Wird CPI eine Zinserhöhung auslösen?
👉So nimmst du teil:
Veröffentliche einen kurzen Beitrag oder Artikel mit dem Hashtag #CPIWatch
Erstelle Inhalte basierend auf den folgenden zwei Blickwinkeln:
- Nichtlandwirtschaftliche Payrolls übertreffen die Erwartungen und CPI steht kurz bevor—glaubst du, dass die Fed die Zinsen erhöht oder hält?
- Bärisch oder bullisch? Teile deine Einschätzung und präsentiere deine Aktien oder Gold-Trades/Bestände mit unserem Widget zum Teilen von Trades.
🚀Kampagnenzeitraum:
- 2026-09-11 3:00 - 2026-09-12 9:00 UTC
🎁Belohnung:
- Qualifizierte Beiträge, die die oben genannten Richtlinien einhalten und mehr als 100 Wörter enthalten, werden überprüft und können möglicherweise einen zufälligen Traffic-Boost von 500 bis 3.000 Views erhalten. Du erhältst eine Benachrichtigung von deiner Feed-Sekretärin, wenn dein Beitrag ausgewählt wurde.
- Erhalte die Chance, dass dein Artikel auf Binance Square Official vorgestellt wird
Brauchst du Ideen für deinen Beitrag? Besuche die Themen-Seite #CPIWatch oder die Square Guide on How to Post for Better Reach.
Binance Square Official
·281 Likes
·482.7k Aufrufe
TencentBackedEnflameToStartTradingAfter$911MIPO
100 Aufrufe
5 Kommentare
BlockstreamRefusesToPayRansomToLiquidAttacker
327 Aufrufe
32 Kommentare