
CryptoZeno 1
392 Beiträge

CryptoZeno 1
Melden
Nutzer blockieren
Featured Creator on #CoinMarketCap #BinanceSquare and #CryptoQuant | On Chain Research and Market Insights
0 Following
8 Follower
19 Like gegeben
Beiträge
·
--
Übersetzung ansehen
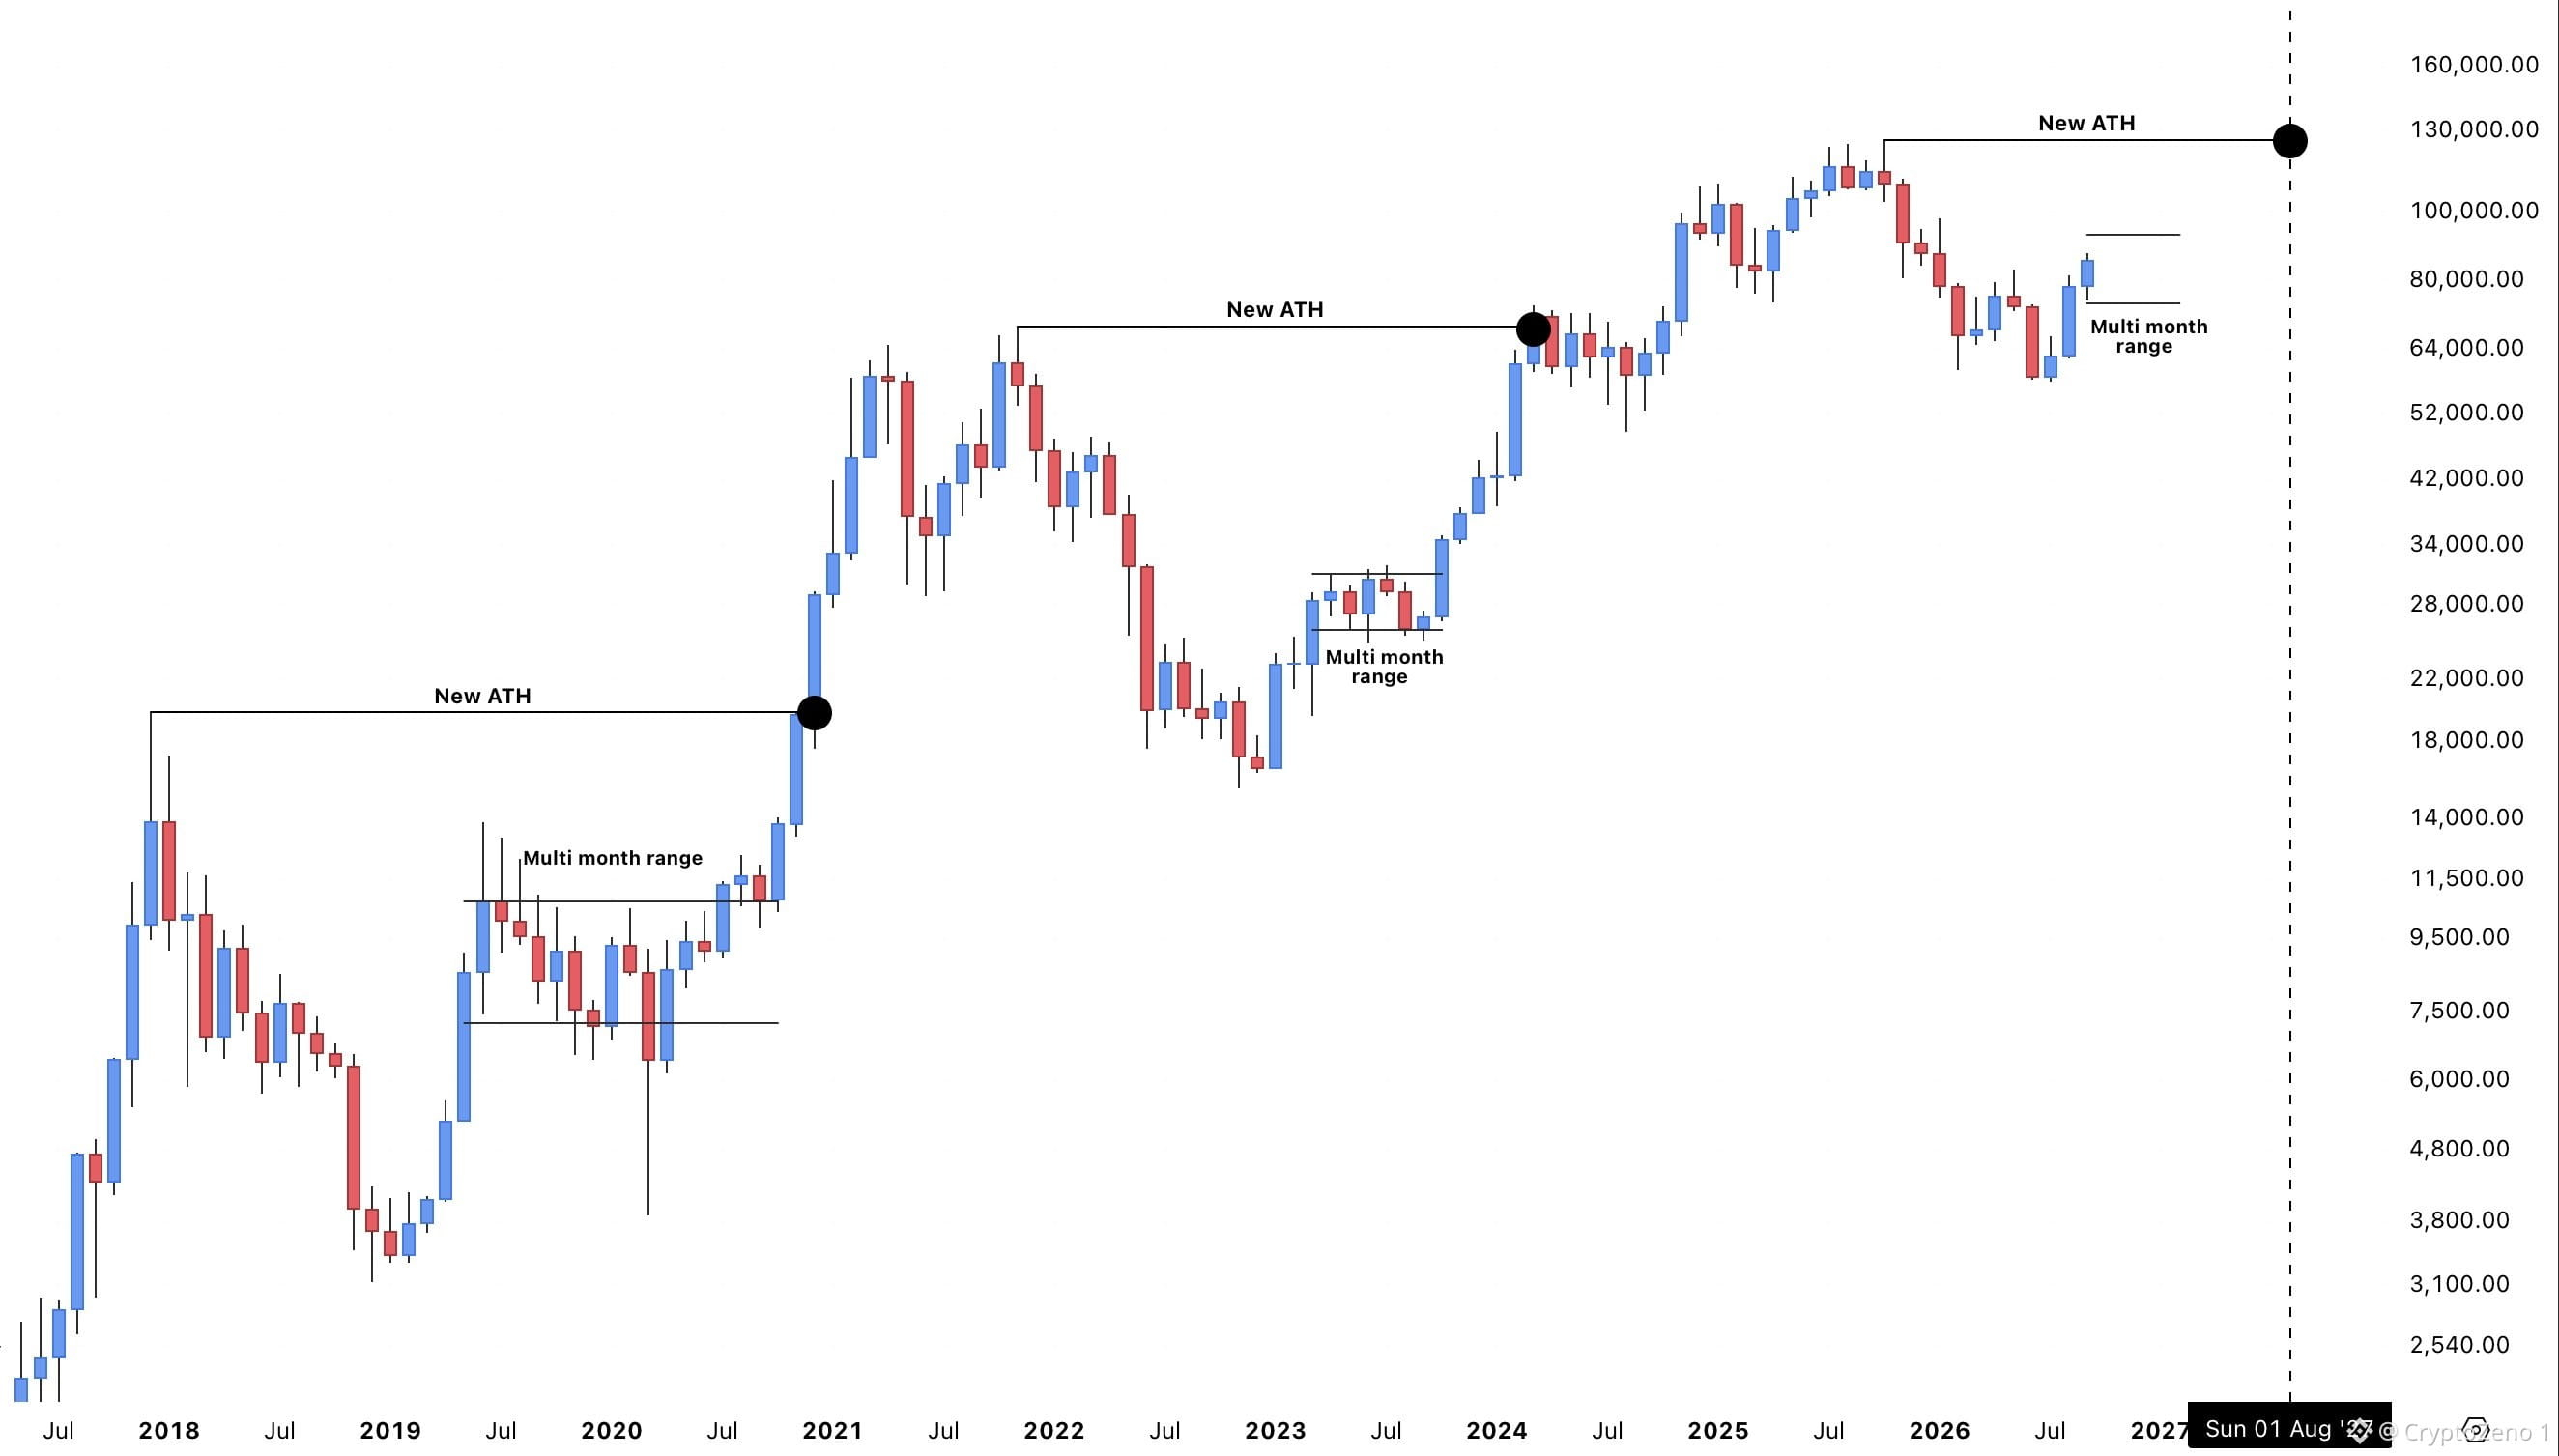
$BTC Consolidation before New ATH...
If the pattern repeats, price will likely range for a couple of months before the next major leg higher.
That move could lead to a new ATH around August 2027. #BTC Price Analysis# #Macro Insights#
$BTC Consolidation before New ATH...
If the pattern repeats, price will likely range for a couple of months before the next major leg higher.
That move could lead to a new ATH around August 2027. #BTC Price Analysis# #Macro Insights#
If the pattern repeats, price will likely range for a couple of months before the next major leg higher.
That move could lead to a new ATH around August 2027. #BTC Price Analysis# #Macro Insights#
40
·
--
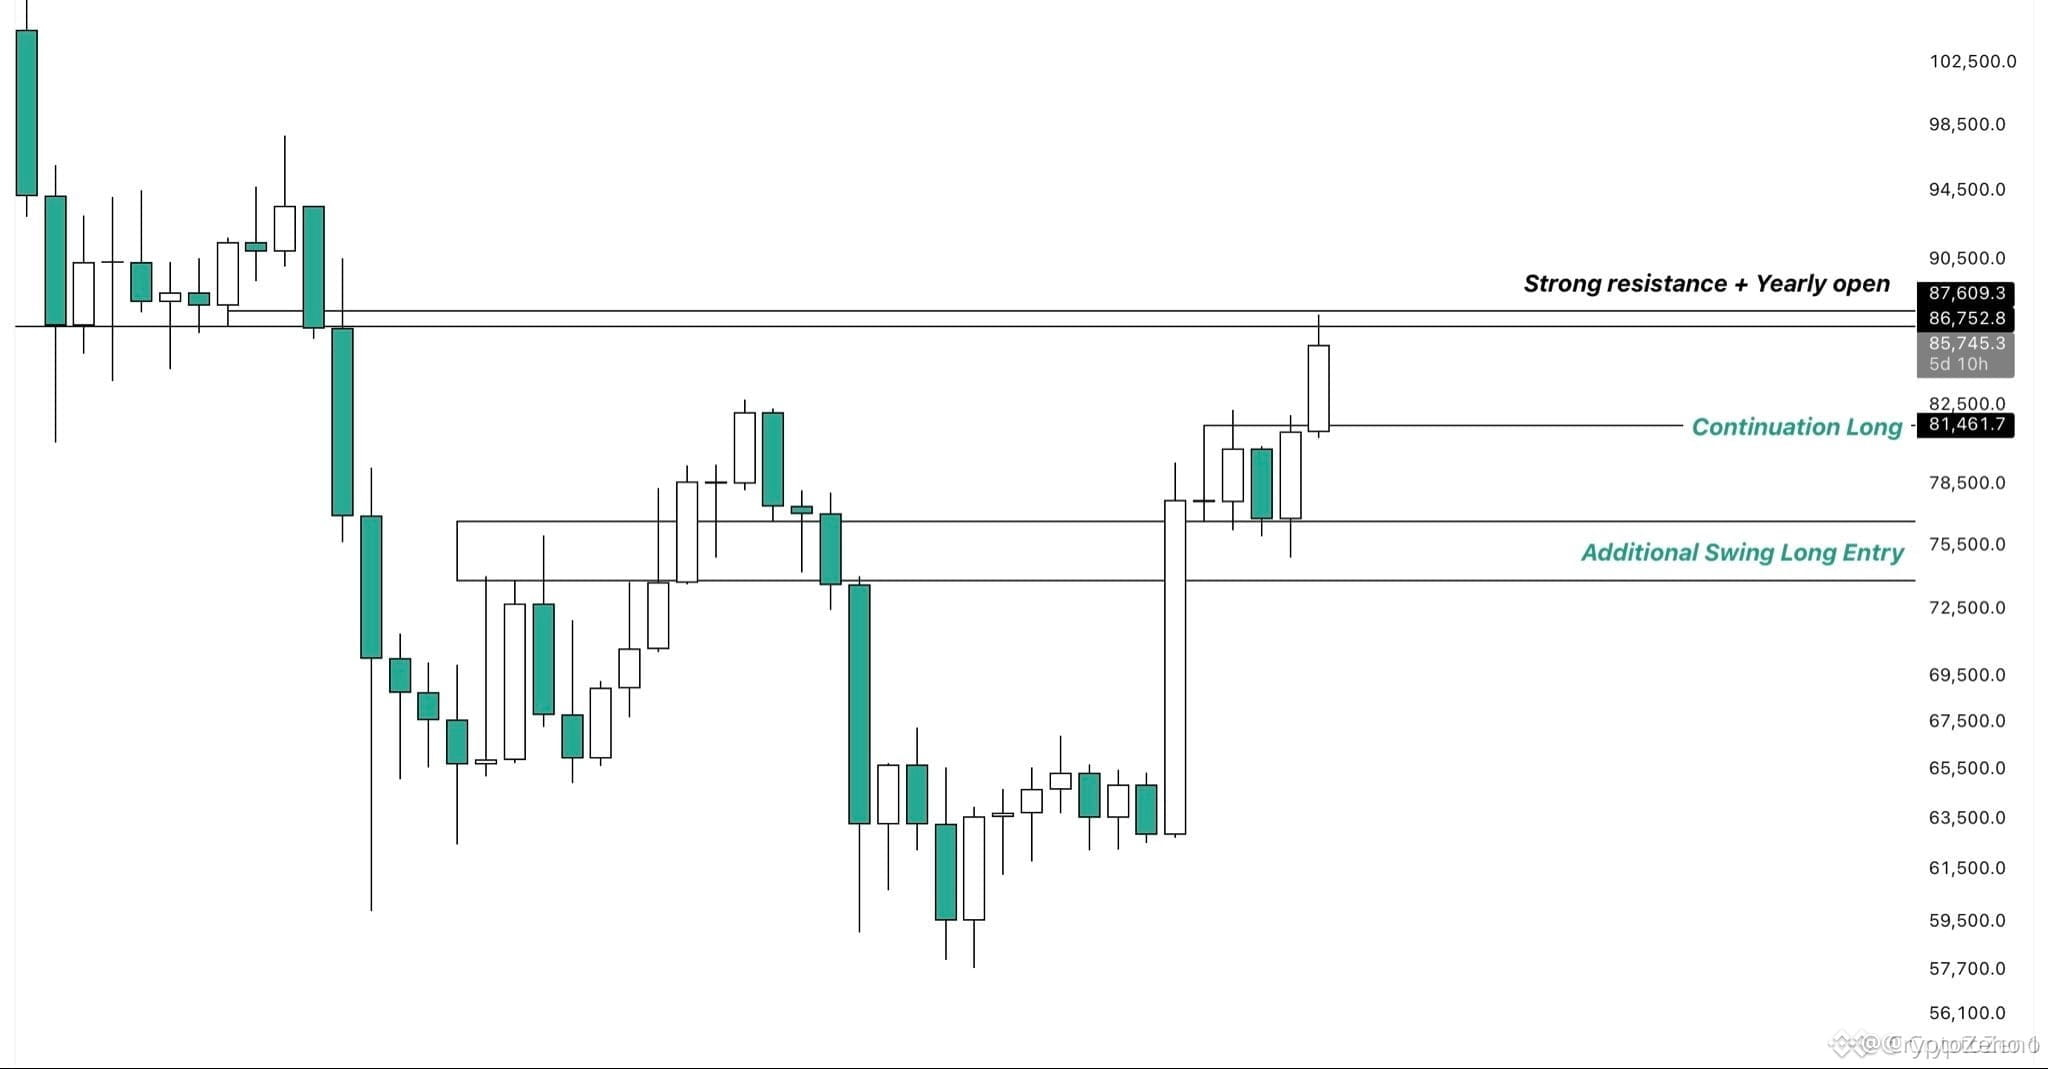
$BTC Dieser wöchentliche Schlusskurs wird absolut entscheidend sein.
BTC ist derzeit dabei, eine wichtige HTF-Resistance-Zone zu testen, wobei der Jahres-Open direkt darüber liegt – das verstärkt die Aussagekraft für diesen Bereich.
Wenn Käufer es schaffen, darüber auszubrechen und wir einen starken wöchentlichen Schlusskurs sehen, gefolgt von einer Akzeptanz über dieser Zone, dann würde ich eine Fortsetzung in Richtung des großen Swing-Highs um $97K erwarten.
Wenn BTC hingegen kurzzeitig durch dieses Niveau handelt, es aber nicht halten kann und wieder darunter schließt, würde ich das als Zeichen von Schwäche werten und eine kurzfristige Korrektur bevorzugen.
Dafür gibt es zwei Bereiche, die ich im Blick habe.
Der erste sind die jüngsten Range-Hochs: Dort würde ich auf einen Fortsetzungs-Long setzen, genau wie in meinem vorherigen Post erwähnt.
Wenn dieses Niveau nicht hält und BTC zurück in die alte Range zurückfällt, liegt mein nächster interessanter Bereich bei etwa $73K–$76K, wo ich meine Swing-Long-Exponierung erhöhen würde. #BTC Price Analysis# #Macro Insights#
$BTC Dieser wöchentliche Schlusskurs wird absolut entscheidend sein.
BTC ist derzeit dabei, eine wichtige HTF-Resistance-Zone zu testen, wobei der Jahres-Open direkt darüber liegt – das verstärkt die Aussagekraft für diesen Bereich.
Wenn Käufer es schaffen, darüber auszubrechen und wir einen starken wöchentlichen Schlusskurs sehen, gefolgt von einer Akzeptanz über dieser Zone, dann würde ich eine Fortsetzung in Richtung des großen Swing-Highs um $97K erwarten.
Wenn BTC hingegen kurzzeitig durch dieses Niveau handelt, es aber nicht halten kann und wieder darunter schließt, würde ich das als Zeichen von Schwäche werten und eine kurzfristige Korrektur bevorzugen.
Dafür gibt es zwei Bereiche, die ich im Blick habe.
Der erste sind die jüngsten Range-Hochs: Dort würde ich auf einen Fortsetzungs-Long setzen, genau wie in meinem vorherigen Post erwähnt.
Wenn dieses Niveau nicht hält und BTC zurück in die alte Range zurückfällt, liegt mein nächster interessanter Bereich bei etwa $73K–$76K, wo ich meine Swing-Long-Exponierung erhöhen würde. #BTC Price Analysis# #Macro Insights#
BTC ist derzeit dabei, eine wichtige HTF-Resistance-Zone zu testen, wobei der Jahres-Open direkt darüber liegt – das verstärkt die Aussagekraft für diesen Bereich.
Wenn Käufer es schaffen, darüber auszubrechen und wir einen starken wöchentlichen Schlusskurs sehen, gefolgt von einer Akzeptanz über dieser Zone, dann würde ich eine Fortsetzung in Richtung des großen Swing-Highs um $97K erwarten.
Wenn BTC hingegen kurzzeitig durch dieses Niveau handelt, es aber nicht halten kann und wieder darunter schließt, würde ich das als Zeichen von Schwäche werten und eine kurzfristige Korrektur bevorzugen.
Dafür gibt es zwei Bereiche, die ich im Blick habe.
Der erste sind die jüngsten Range-Hochs: Dort würde ich auf einen Fortsetzungs-Long setzen, genau wie in meinem vorherigen Post erwähnt.
Wenn dieses Niveau nicht hält und BTC zurück in die alte Range zurückfällt, liegt mein nächster interessanter Bereich bei etwa $73K–$76K, wo ich meine Swing-Long-Exponierung erhöhen würde. #BTC Price Analysis# #Macro Insights#
53
·
--
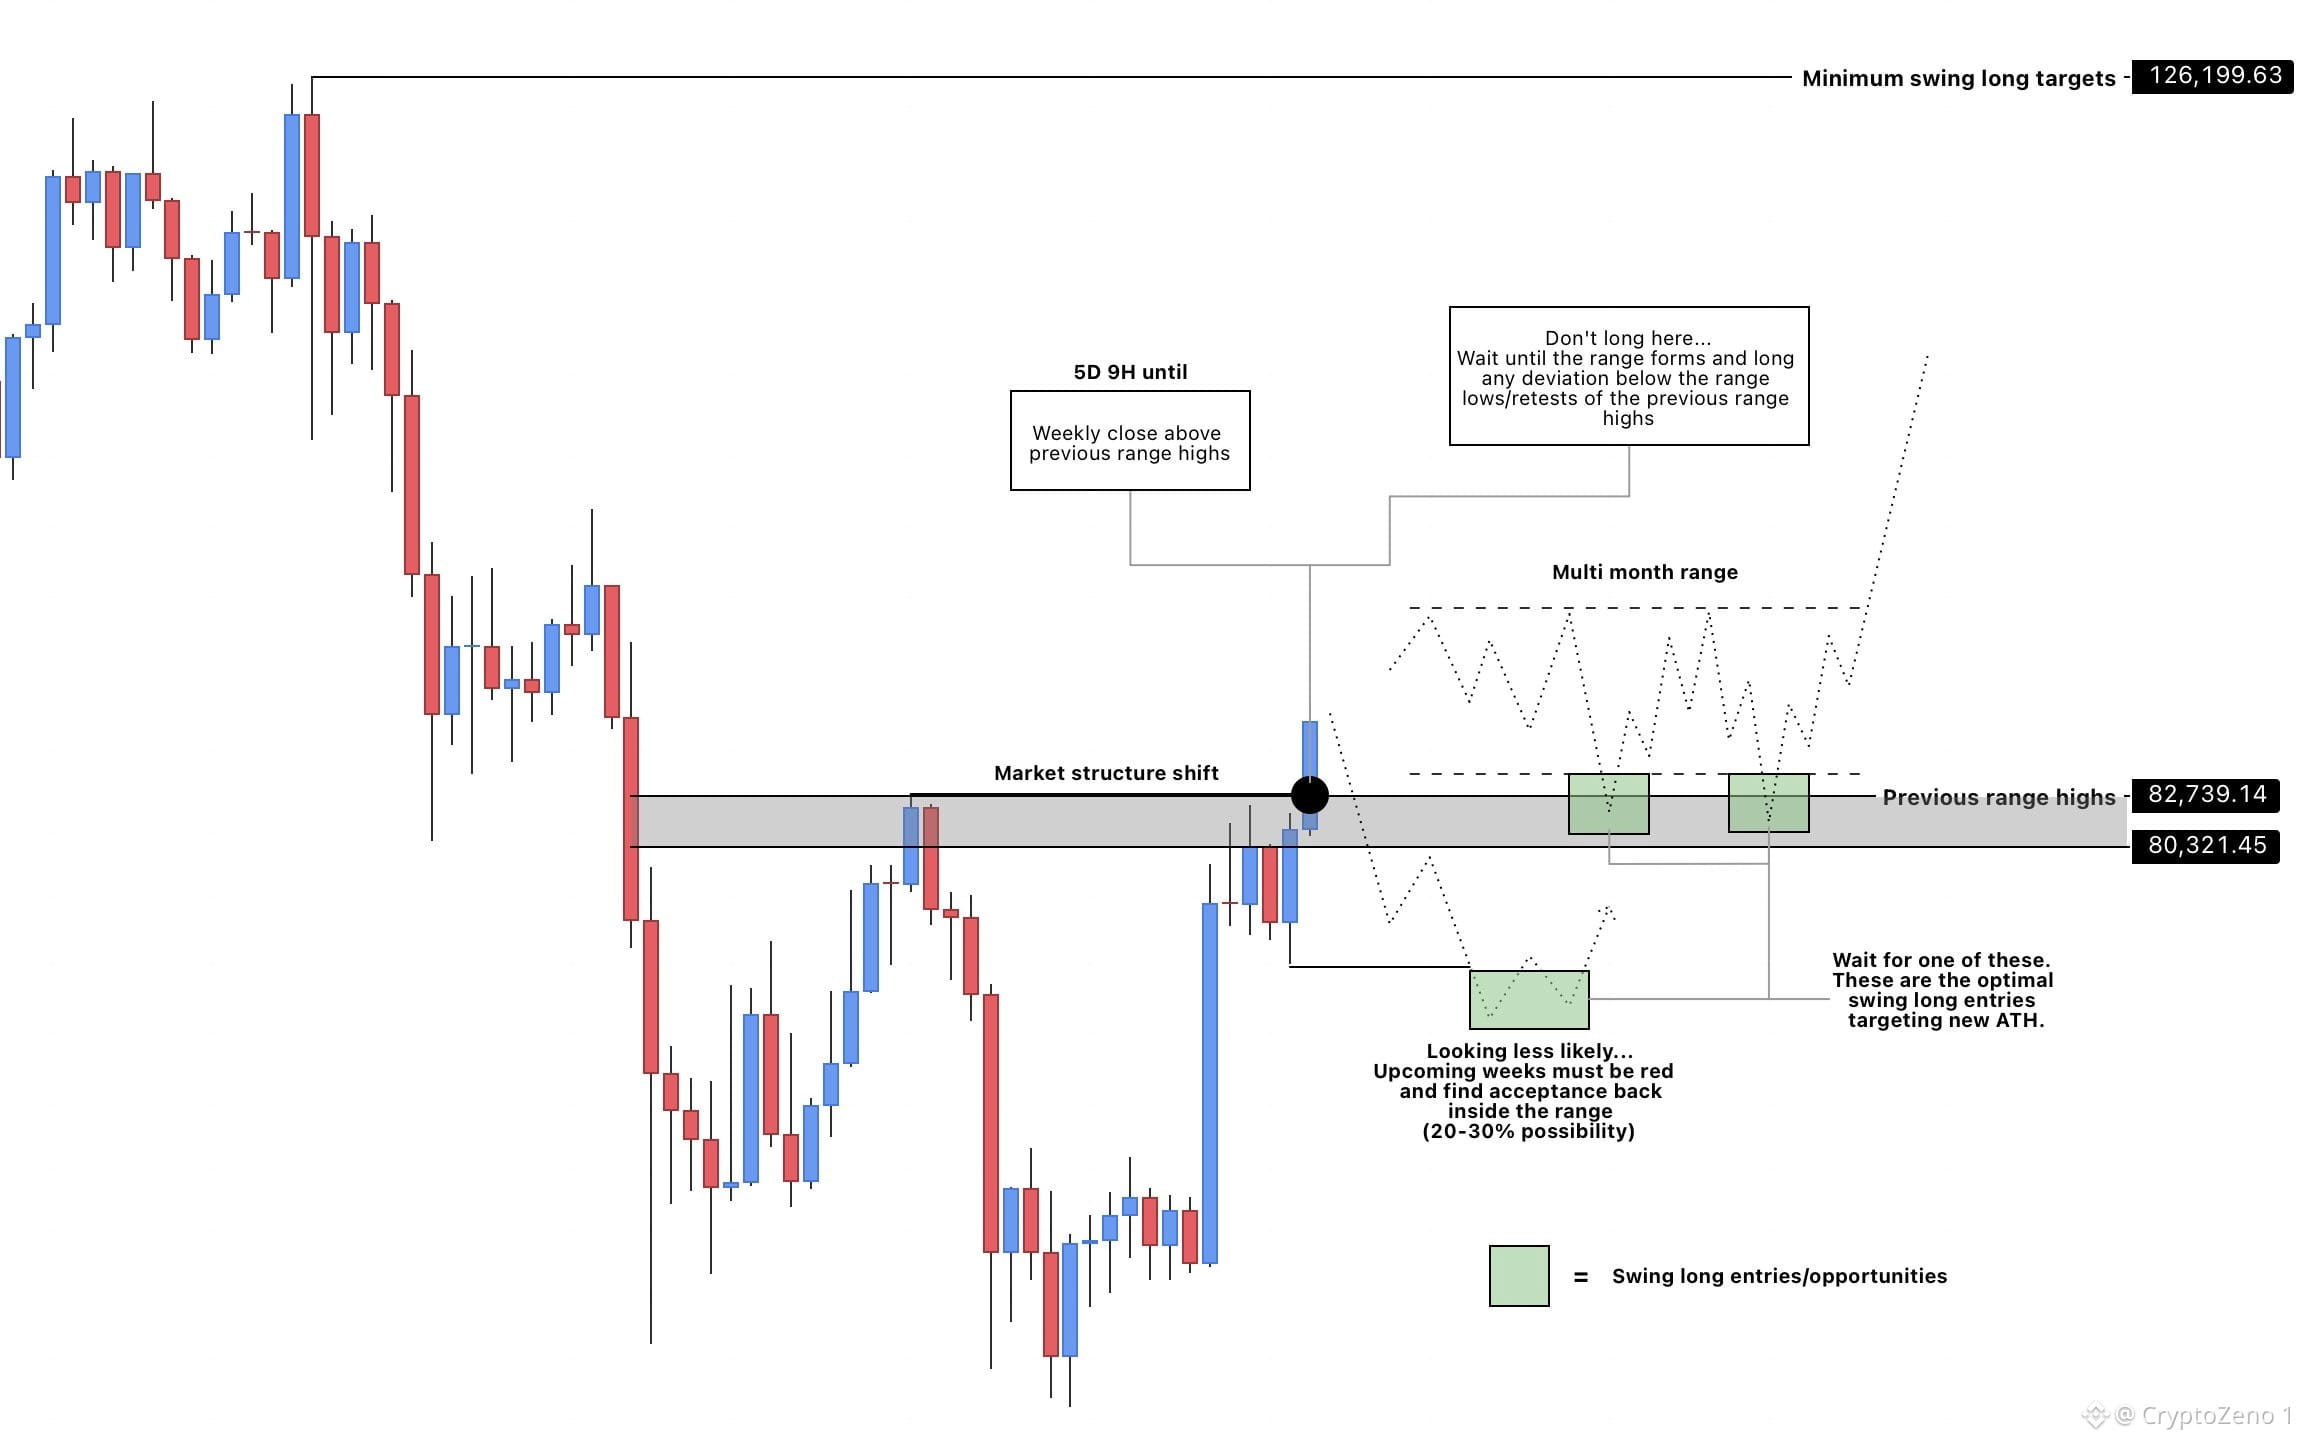
$BTC Nicht hier long gehen...
1. Das ist nur eine Abweichung, und der Preis retraced die gesamte Bewegung in den nächsten ein paar Wochen, bevor er die vorherigen Tiefs bei 74K abräumt. Dieses Szenario wird deutlich unwahrscheinlicher, wenn wöchentliche Kerzen beginnen, über den vorherigen Range-Hochs zu schließen.
2. Der Preis bildet eine neue Spanne und konsolidiert in den 80K, wobei er eine mehrmonatige Range bildet, bevor es zur nächsten Aufwärtsbewegung kommt.
Szenario 2 wird bereits wahrscheinlicher, und diese Wahrscheinlichkeit wird weiter steigen, wenn weitere wöchentliche Kerzen über den vorherigen Range-Hochs schließen.
Wie auch immer: Hier longzugehen ergibt keinen Sinn. Besser ist es, auf die optimalen Einstiege in den grünen Zonen zu warten.
Was den Grund betrifft, warum ich nur Longs betrachte: Das habe ich mehrfach erwähnt. Der Trend hat sich gedreht, und Shorten geht jetzt gegen den Trend. #BTC Preisanalyse# #Makro-Insights# #Altcoin-Saison#
$BTC Nicht hier long gehen...
1. Das ist nur eine Abweichung, und der Preis retraced die gesamte Bewegung in den nächsten ein paar Wochen, bevor er die vorherigen Tiefs bei 74K abräumt. Dieses Szenario wird deutlich unwahrscheinlicher, wenn wöchentliche Kerzen beginnen, über den vorherigen Range-Hochs zu schließen.
2. Der Preis bildet eine neue Spanne und konsolidiert in den 80K, wobei er eine mehrmonatige Range bildet, bevor es zur nächsten Aufwärtsbewegung kommt.
Szenario 2 wird bereits wahrscheinlicher, und diese Wahrscheinlichkeit wird weiter steigen, wenn weitere wöchentliche Kerzen über den vorherigen Range-Hochs schließen.
Wie auch immer: Hier longzugehen ergibt keinen Sinn. Besser ist es, auf die optimalen Einstiege in den grünen Zonen zu warten.
Was den Grund betrifft, warum ich nur Longs betrachte: Das habe ich mehrfach erwähnt. Der Trend hat sich gedreht, und Shorten geht jetzt gegen den Trend. #BTC Preisanalyse# #Makro-Insights# #Altcoin-Saison#
1. Das ist nur eine Abweichung, und der Preis retraced die gesamte Bewegung in den nächsten ein paar Wochen, bevor er die vorherigen Tiefs bei 74K abräumt. Dieses Szenario wird deutlich unwahrscheinlicher, wenn wöchentliche Kerzen beginnen, über den vorherigen Range-Hochs zu schließen.
2. Der Preis bildet eine neue Spanne und konsolidiert in den 80K, wobei er eine mehrmonatige Range bildet, bevor es zur nächsten Aufwärtsbewegung kommt.
Szenario 2 wird bereits wahrscheinlicher, und diese Wahrscheinlichkeit wird weiter steigen, wenn weitere wöchentliche Kerzen über den vorherigen Range-Hochs schließen.
Wie auch immer: Hier longzugehen ergibt keinen Sinn. Besser ist es, auf die optimalen Einstiege in den grünen Zonen zu warten.
Was den Grund betrifft, warum ich nur Longs betrachte: Das habe ich mehrfach erwähnt. Der Trend hat sich gedreht, und Shorten geht jetzt gegen den Trend. #BTC Preisanalyse# #Makro-Insights# #Altcoin-Saison#
94
·
--
Übersetzung ansehen
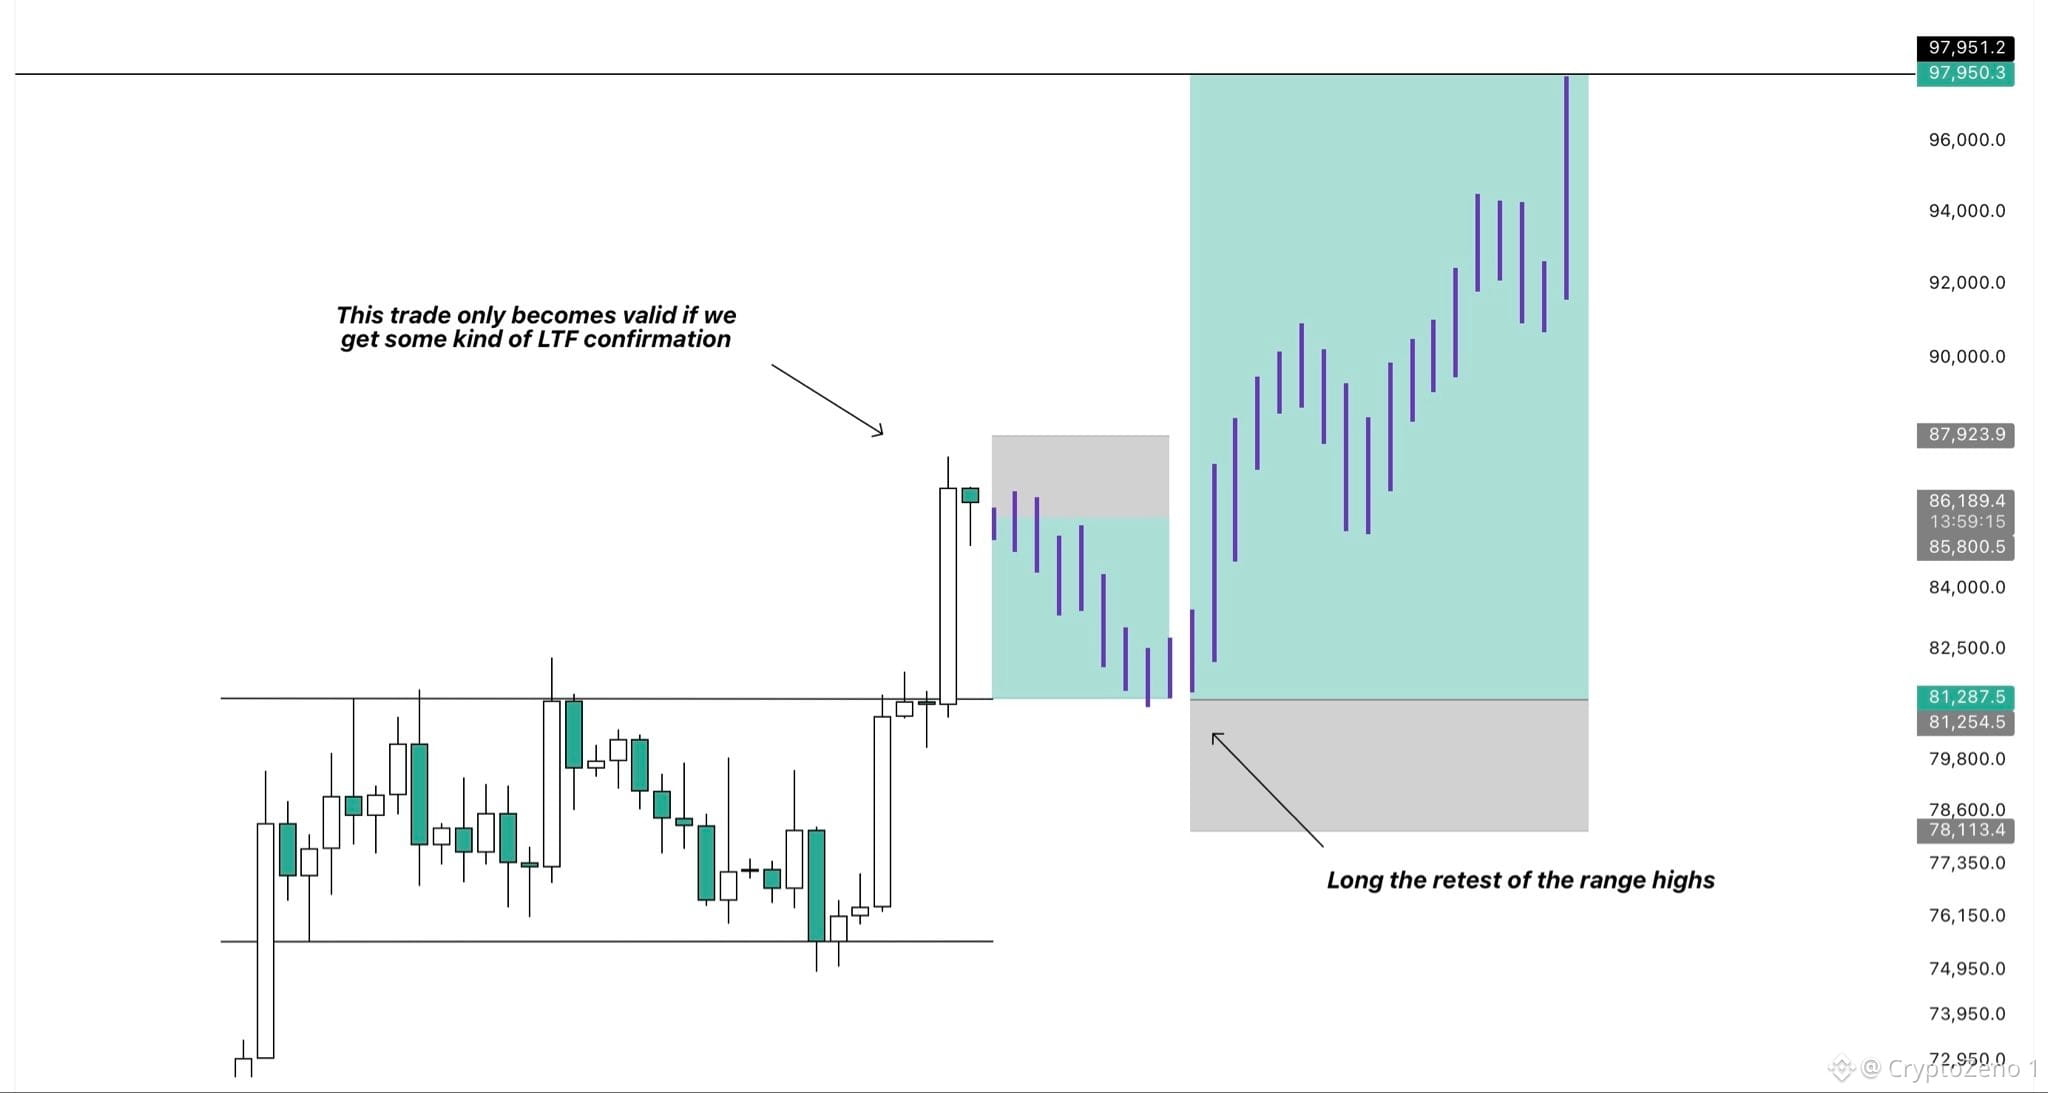
$BTC Staying flat makes the most sense for me right now.
Spot bags are printing. Swing long is printing. So why chase any trades here?
However, there are two scenarios from here where I would want to enter another trade.
The first would be a rejection from the HTF resistance zone we’re currently retesting, followed by a bearish market structure shift on lower timeframes. In that case, I’d look to enter a short targeting the $81.2K region, where price would retest the recent breakout from the range highs.
The second, and currently much more interesting setup to me, would be a long from a successful retest of those highs.
Price broke above the range with a lot of momentum, and yesterday’s daily close came in well above $81.2K.
Considering that the move was also strongly supported by spot buying, this looks much more like a genuine
breakout to me than a simple liquidity grab or fakeout.
If price comes back into that area and starts showing strength again, I’ll look to enter another long targeting the major swing high around $97K.
Until either of these setups presents itself, I see no reason to force a trade. #BTC Price Analysis# #Macro Insights#
$BTC Staying flat makes the most sense for me right now.
Spot bags are printing. Swing long is printing. So why chase any trades here?
However, there are two scenarios from here where I would want to enter another trade.
The first would be a rejection from the HTF resistance zone we’re currently retesting, followed by a bearish market structure shift on lower timeframes. In that case, I’d look to enter a short targeting the $81.2K region, where price would retest the recent breakout from the range highs.
The second, and currently much more interesting setup to me, would be a long from a successful retest of those highs.
Price broke above the range with a lot of momentum, and yesterday’s daily close came in well above $81.2K.
Considering that the move was also strongly supported by spot buying, this looks much more like a genuine
breakout to me than a simple liquidity grab or fakeout.
If price comes back into that area and starts showing strength again, I’ll look to enter another long targeting the major swing high around $97K.
Until either of these setups presents itself, I see no reason to force a trade. #BTC Price Analysis# #Macro Insights#
Spot bags are printing. Swing long is printing. So why chase any trades here?
However, there are two scenarios from here where I would want to enter another trade.
The first would be a rejection from the HTF resistance zone we’re currently retesting, followed by a bearish market structure shift on lower timeframes. In that case, I’d look to enter a short targeting the $81.2K region, where price would retest the recent breakout from the range highs.
The second, and currently much more interesting setup to me, would be a long from a successful retest of those highs.
Price broke above the range with a lot of momentum, and yesterday’s daily close came in well above $81.2K.
Considering that the move was also strongly supported by spot buying, this looks much more like a genuine
breakout to me than a simple liquidity grab or fakeout.
If price comes back into that area and starts showing strength again, I’ll look to enter another long targeting the major swing high around $97K.
Until either of these setups presents itself, I see no reason to force a trade. #BTC Price Analysis# #Macro Insights#
40
·
--
Übersetzung ansehen
$BTC It's Time to Pay Attention.
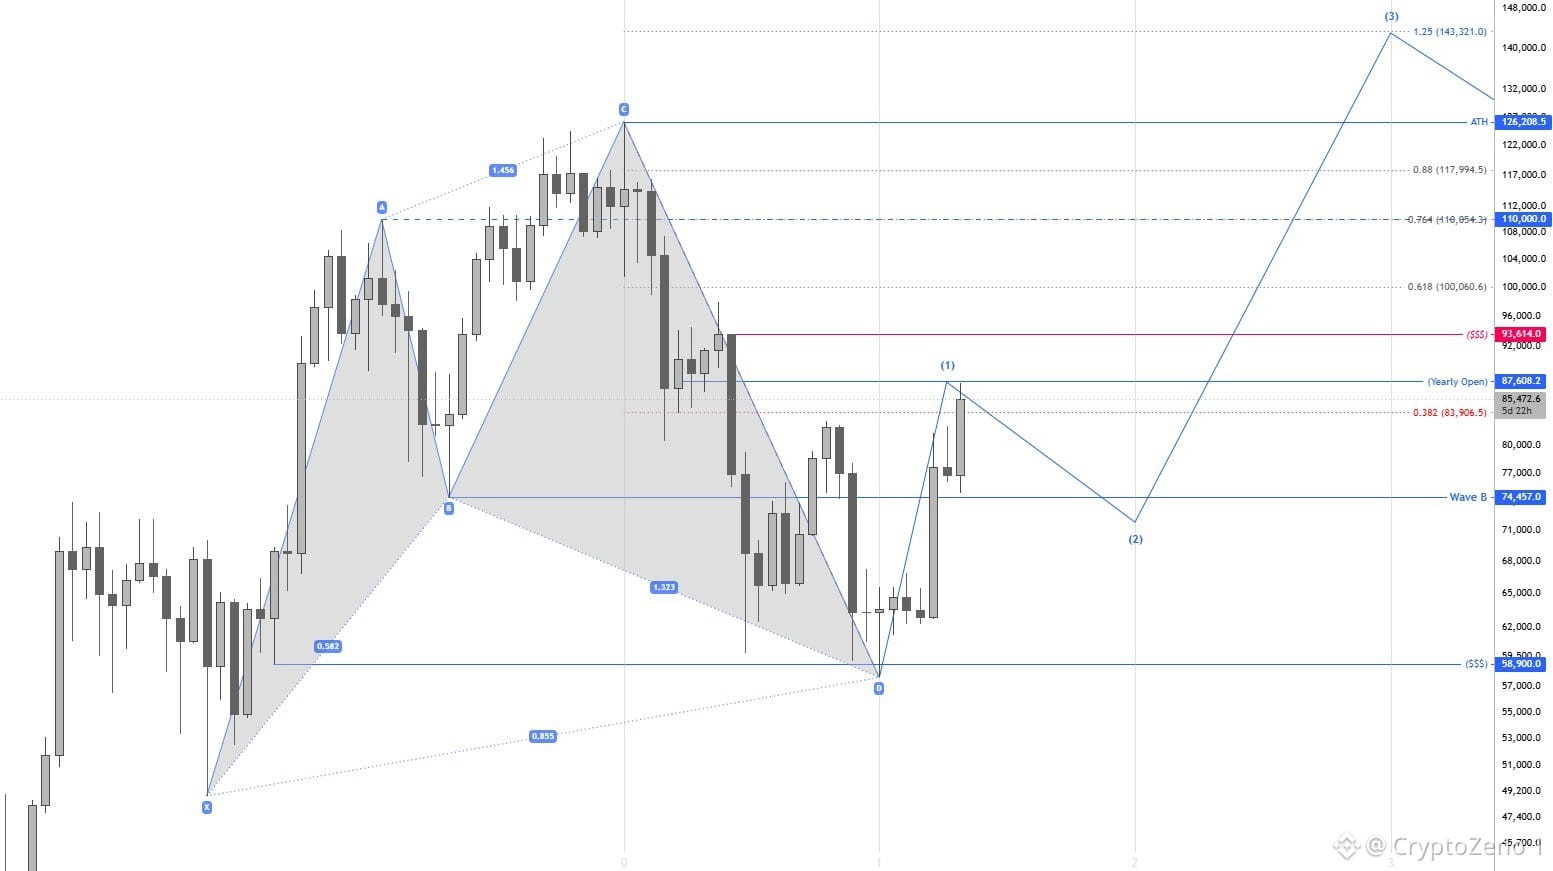
We're rejecting from the 87.6K region, which was our POI for completion of HTF Wave 1.
I still think there's room for a push higher into 93.6K, especially if we manage to hold the 84.6K-82.8K region on the revisit.
A small pullback before continuation towards the upside is what I'm expecting for now. #BTC Price Analysis# #Macro Insights#
$BTC It's Time to Pay Attention.
We're rejecting from the 87.6K region, which was our POI for completion of HTF Wave 1.
I still think there's room for a push higher into 93.6K, especially if we manage to hold the 84.6K-82.8K region on the revisit.
A small pullback before continuation towards the upside is what I'm expecting for now. #BTC Price Analysis# #Macro Insights#
We're rejecting from the 87.6K region, which was our POI for completion of HTF Wave 1.
I still think there's room for a push higher into 93.6K, especially if we manage to hold the 84.6K-82.8K region on the revisit.
A small pullback before continuation towards the upside is what I'm expecting for now. #BTC Price Analysis# #Macro Insights#
76
·
--
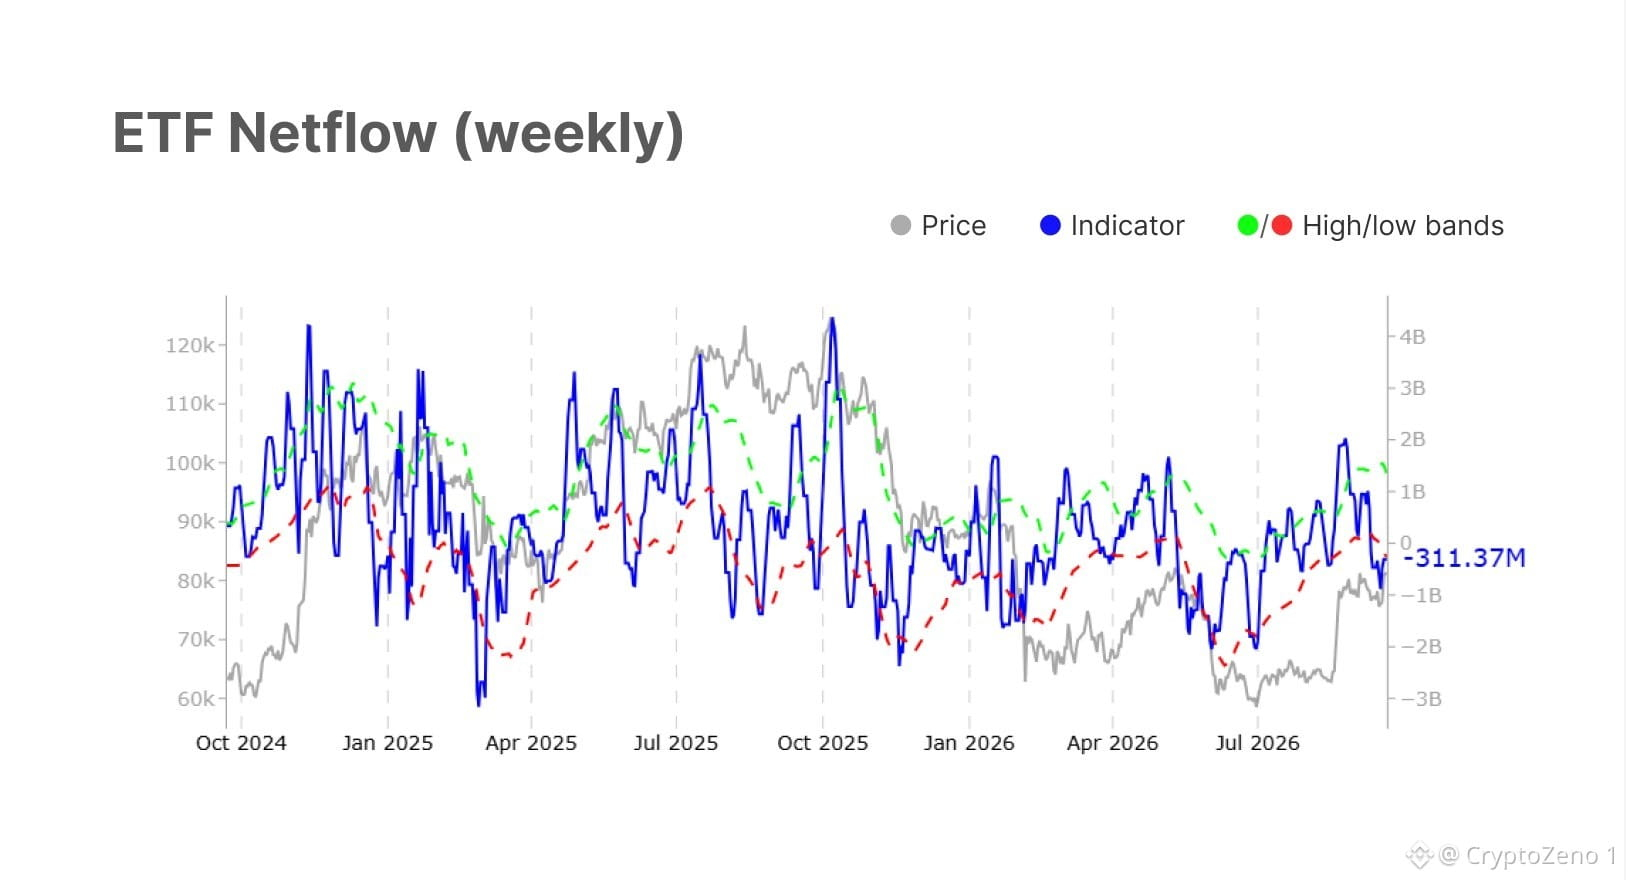
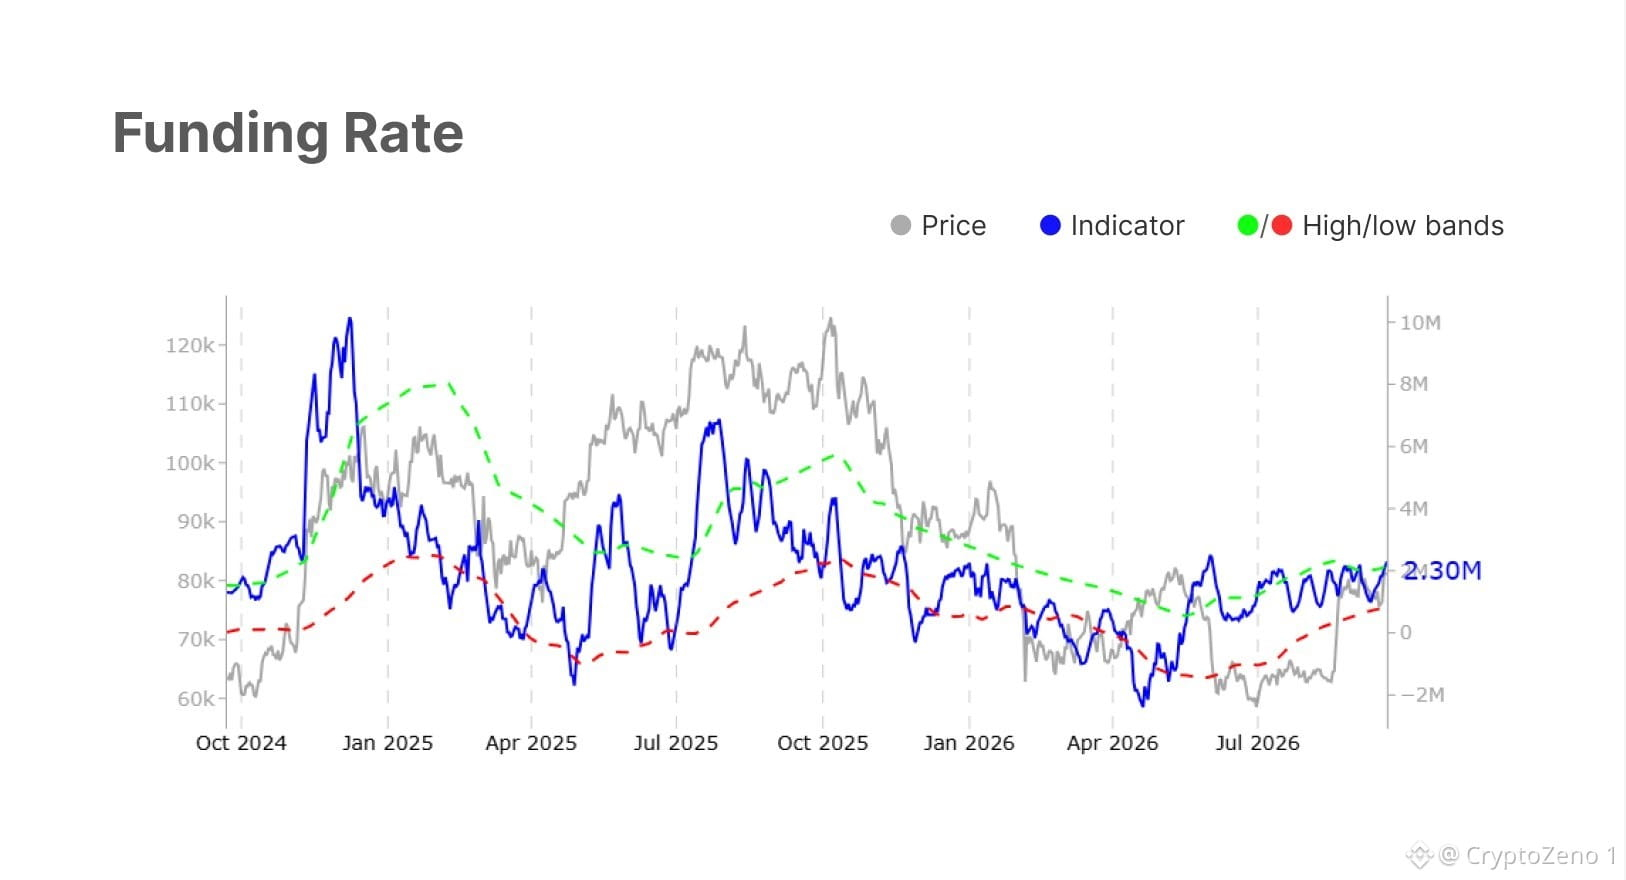
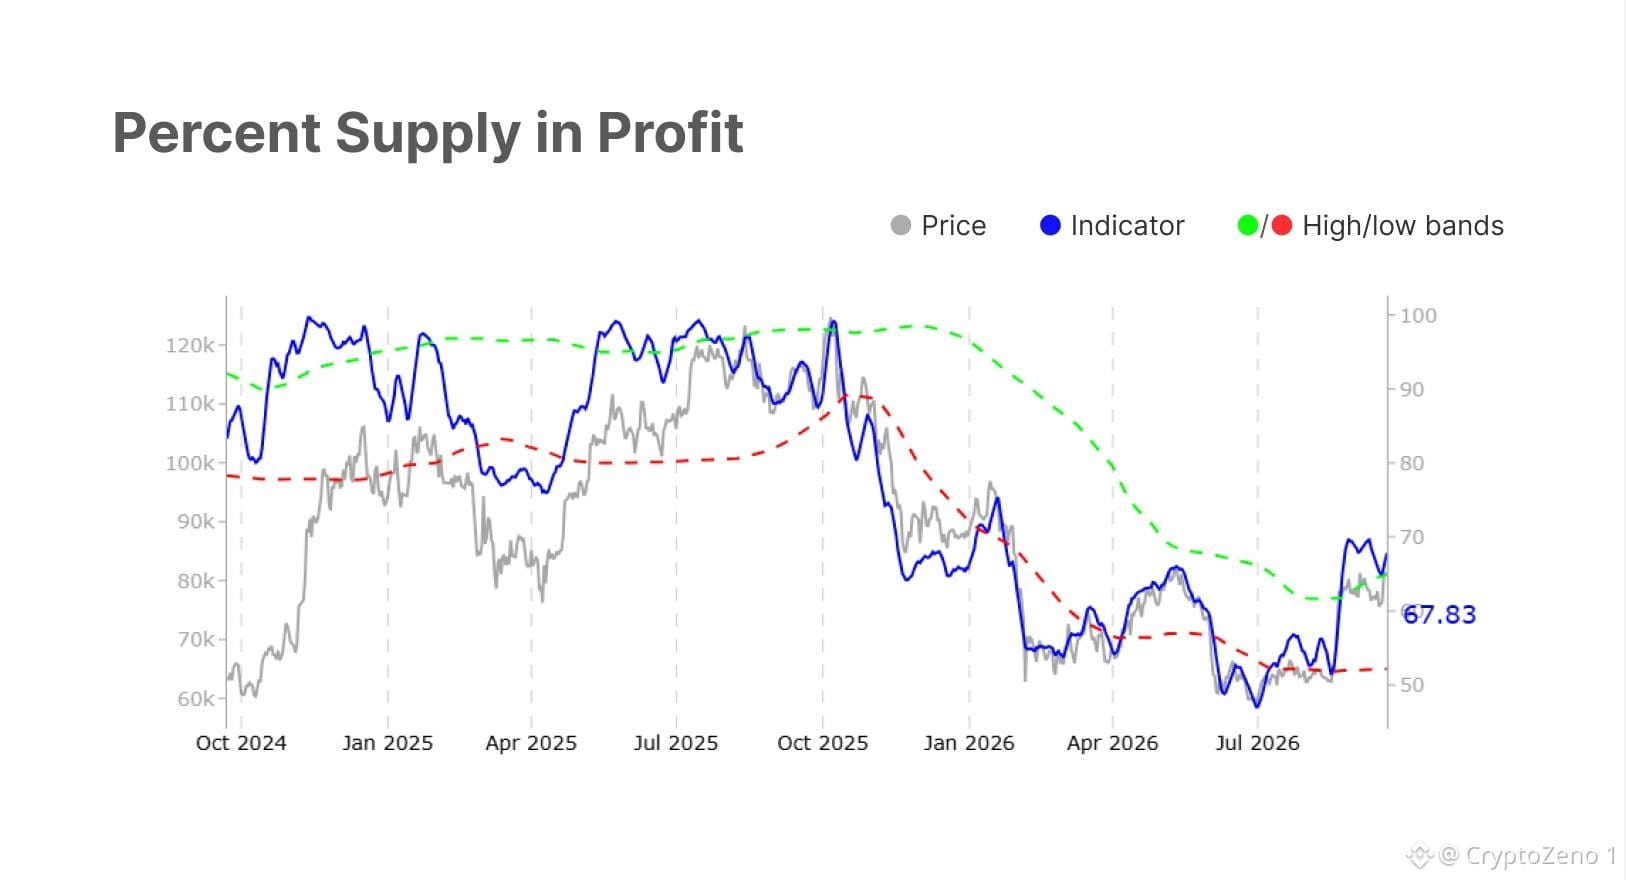
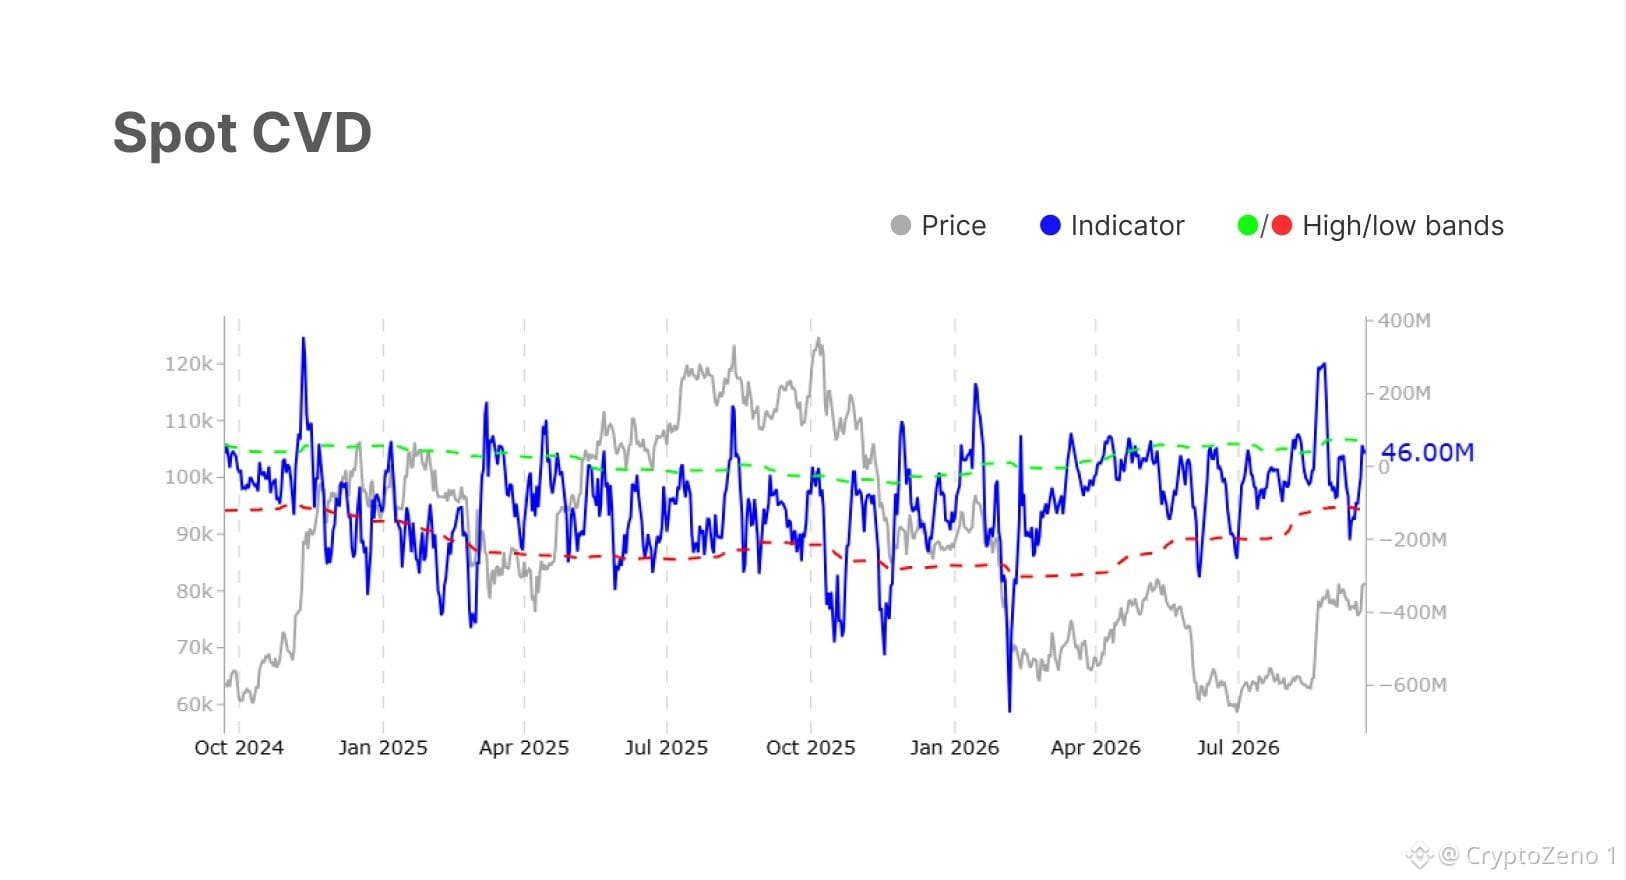
$BTC berührt $86.000 und liegt damit über 10% über dem Schlusskurs von letztem Sonntag.
Spot- und Perpetual-Käufer führen, während Leverage und Gewinnmitnahmen langsam mit dem Preis ansteigen.
ETF-Zuflüsse sind die eine Kennzahl, die weiterhin in die andere Richtung zeigt. #BTC Price Analysis# #Macro Insights#
$BTC berührt $86.000 und liegt damit über 10% über dem Schlusskurs von letztem Sonntag.
Spot- und Perpetual-Käufer führen, während Leverage und Gewinnmitnahmen langsam mit dem Preis ansteigen.
ETF-Zuflüsse sind die eine Kennzahl, die weiterhin in die andere Richtung zeigt. #BTC Price Analysis# #Macro Insights#
Spot- und Perpetual-Käufer führen, während Leverage und Gewinnmitnahmen langsam mit dem Preis ansteigen.
ETF-Zuflüsse sind die eine Kennzahl, die weiterhin in die andere Richtung zeigt. #BTC Price Analysis# #Macro Insights#
46
·
--
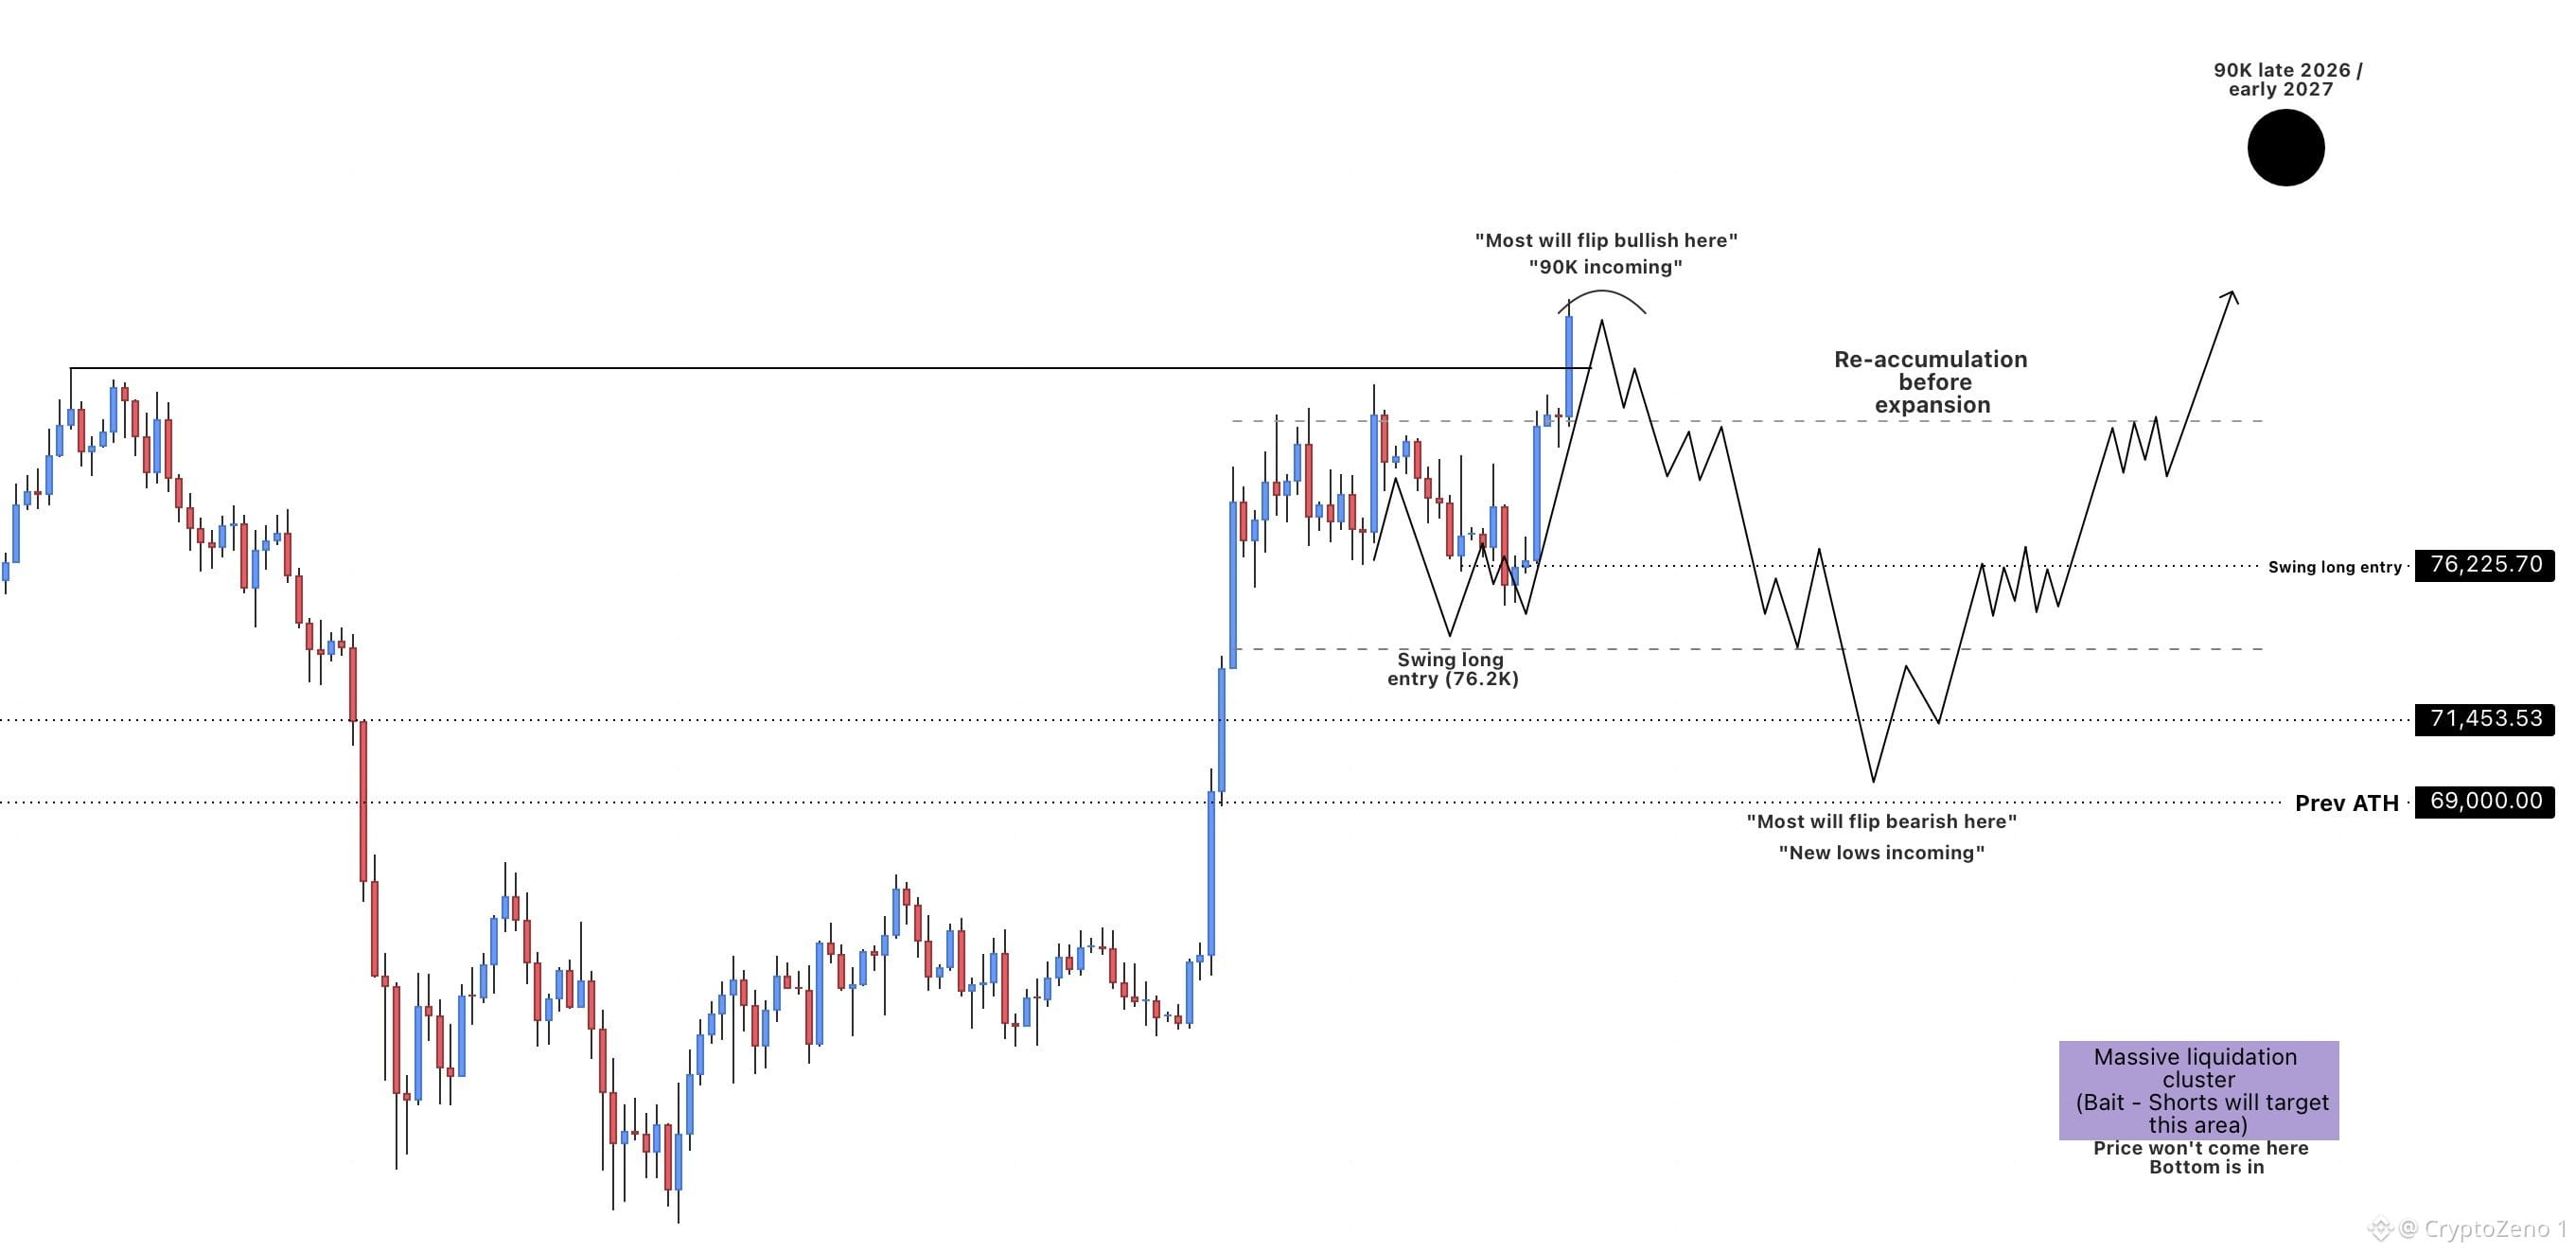
$BTC Bet. Gegen. Mich.
Absolut getroffen...
Ich gehe bei dieser Bewegung nicht short. Ich bleibe auf dem HTF-bullischen Kurs, aber wenn diese Korrektur kommt, wird das eine großartige Gelegenheit sein, um Longs hinzuzufügen. #BTC Preisanalyse# #Makro-Einblicke#
$BTC Bet. Gegen. Mich.
Absolut getroffen...
Ich gehe bei dieser Bewegung nicht short. Ich bleibe auf dem HTF-bullischen Kurs, aber wenn diese Korrektur kommt, wird das eine großartige Gelegenheit sein, um Longs hinzuzufügen. #BTC Preisanalyse# #Makro-Einblicke#
Absolut getroffen...
Ich gehe bei dieser Bewegung nicht short. Ich bleibe auf dem HTF-bullischen Kurs, aber wenn diese Korrektur kommt, wird das eine großartige Gelegenheit sein, um Longs hinzuzufügen. #BTC Preisanalyse# #Makro-Einblicke#
101
·
--
Übersetzung ansehen
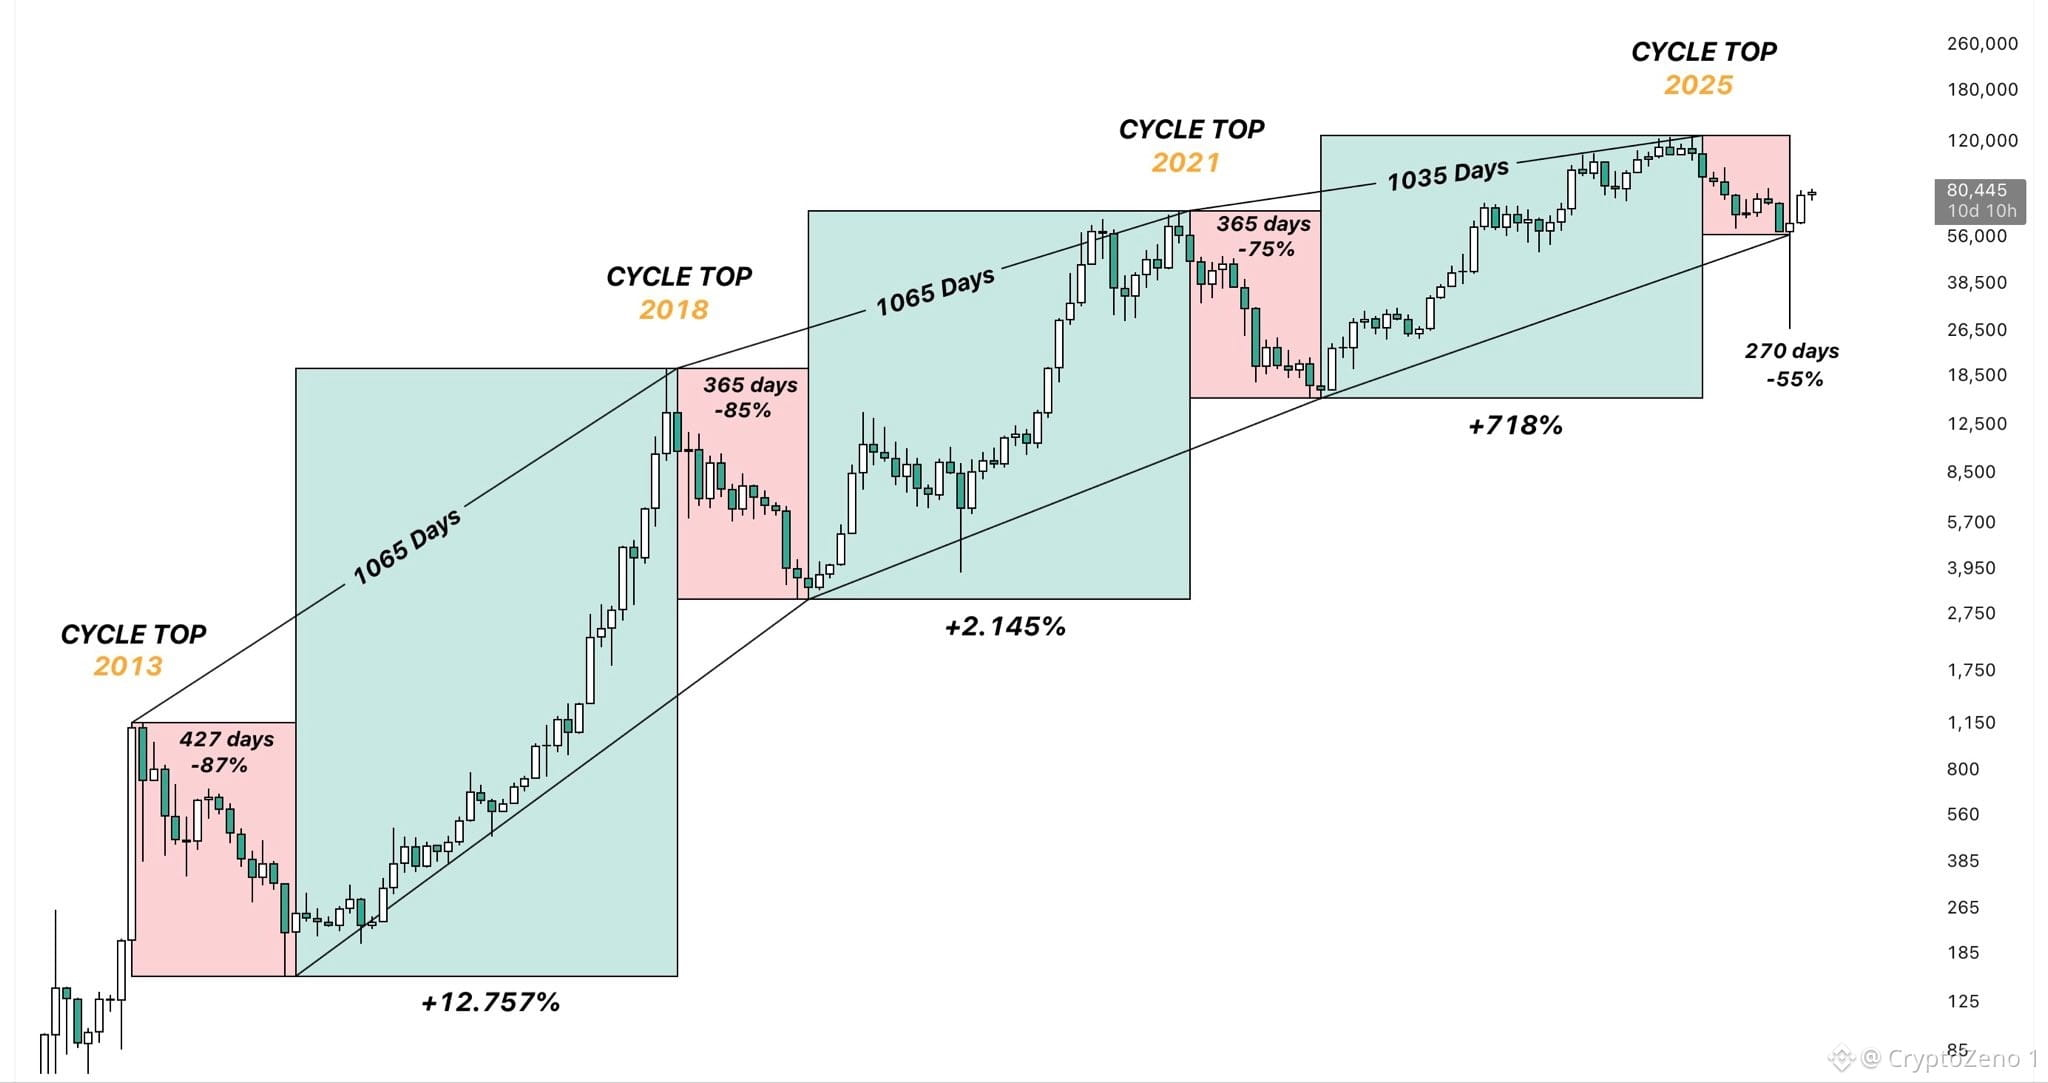
$BTC This graphic shows very clearly how Bitcoin’s cycles have evolved over time.
Until now, the duration of each bull and bear market has remained relatively consistent, while diminishing returns have already been clearly visible from cycle to cycle.
However, if the bottom is already in like I believe it is, something much more significant may have changed this time around.
Not only would this bear market have seen a substantially smaller drawdown than the previous ones, but it would also have been much shorter.
Previous bear markets lasted roughly a year, while this one would have ended after only around 270 days.
What makes this especially interesting is that both the duration and the drawdown declined by roughly 26% compared to the previous bear market.
That would be one of the clearest signs yet that Bitcoin’s cycle structure itself may have started to change.
If this trend continues, future cycles could become shorter while both upside returns and downside drawdowns continue to diminish.
At that point, the traditional 4-year cycle framework would become increasingly difficult to rely on, and traders would have to adapt much faster to changing market phases. #BTC Price Analysis# #Macro Insights#
$BTC This graphic shows very clearly how Bitcoin’s cycles have evolved over time.
Until now, the duration of each bull and bear market has remained relatively consistent, while diminishing returns have already been clearly visible from cycle to cycle.
However, if the bottom is already in like I believe it is, something much more significant may have changed this time around.
Not only would this bear market have seen a substantially smaller drawdown than the previous ones, but it would also have been much shorter.
Previous bear markets lasted roughly a year, while this one would have ended after only around 270 days.
What makes this especially interesting is that both the duration and the drawdown declined by roughly 26% compared to the previous bear market.
That would be one of the clearest signs yet that Bitcoin’s cycle structure itself may have started to change.
If this trend continues, future cycles could become shorter while both upside returns and downside drawdowns continue to diminish.
At that point, the traditional 4-year cycle framework would become increasingly difficult to rely on, and traders would have to adapt much faster to changing market phases. #BTC Price Analysis# #Macro Insights#
Until now, the duration of each bull and bear market has remained relatively consistent, while diminishing returns have already been clearly visible from cycle to cycle.
However, if the bottom is already in like I believe it is, something much more significant may have changed this time around.
Not only would this bear market have seen a substantially smaller drawdown than the previous ones, but it would also have been much shorter.
Previous bear markets lasted roughly a year, while this one would have ended after only around 270 days.
What makes this especially interesting is that both the duration and the drawdown declined by roughly 26% compared to the previous bear market.
That would be one of the clearest signs yet that Bitcoin’s cycle structure itself may have started to change.
If this trend continues, future cycles could become shorter while both upside returns and downside drawdowns continue to diminish.
At that point, the traditional 4-year cycle framework would become increasingly difficult to rely on, and traders would have to adapt much faster to changing market phases. #BTC Price Analysis# #Macro Insights#
52
·
--
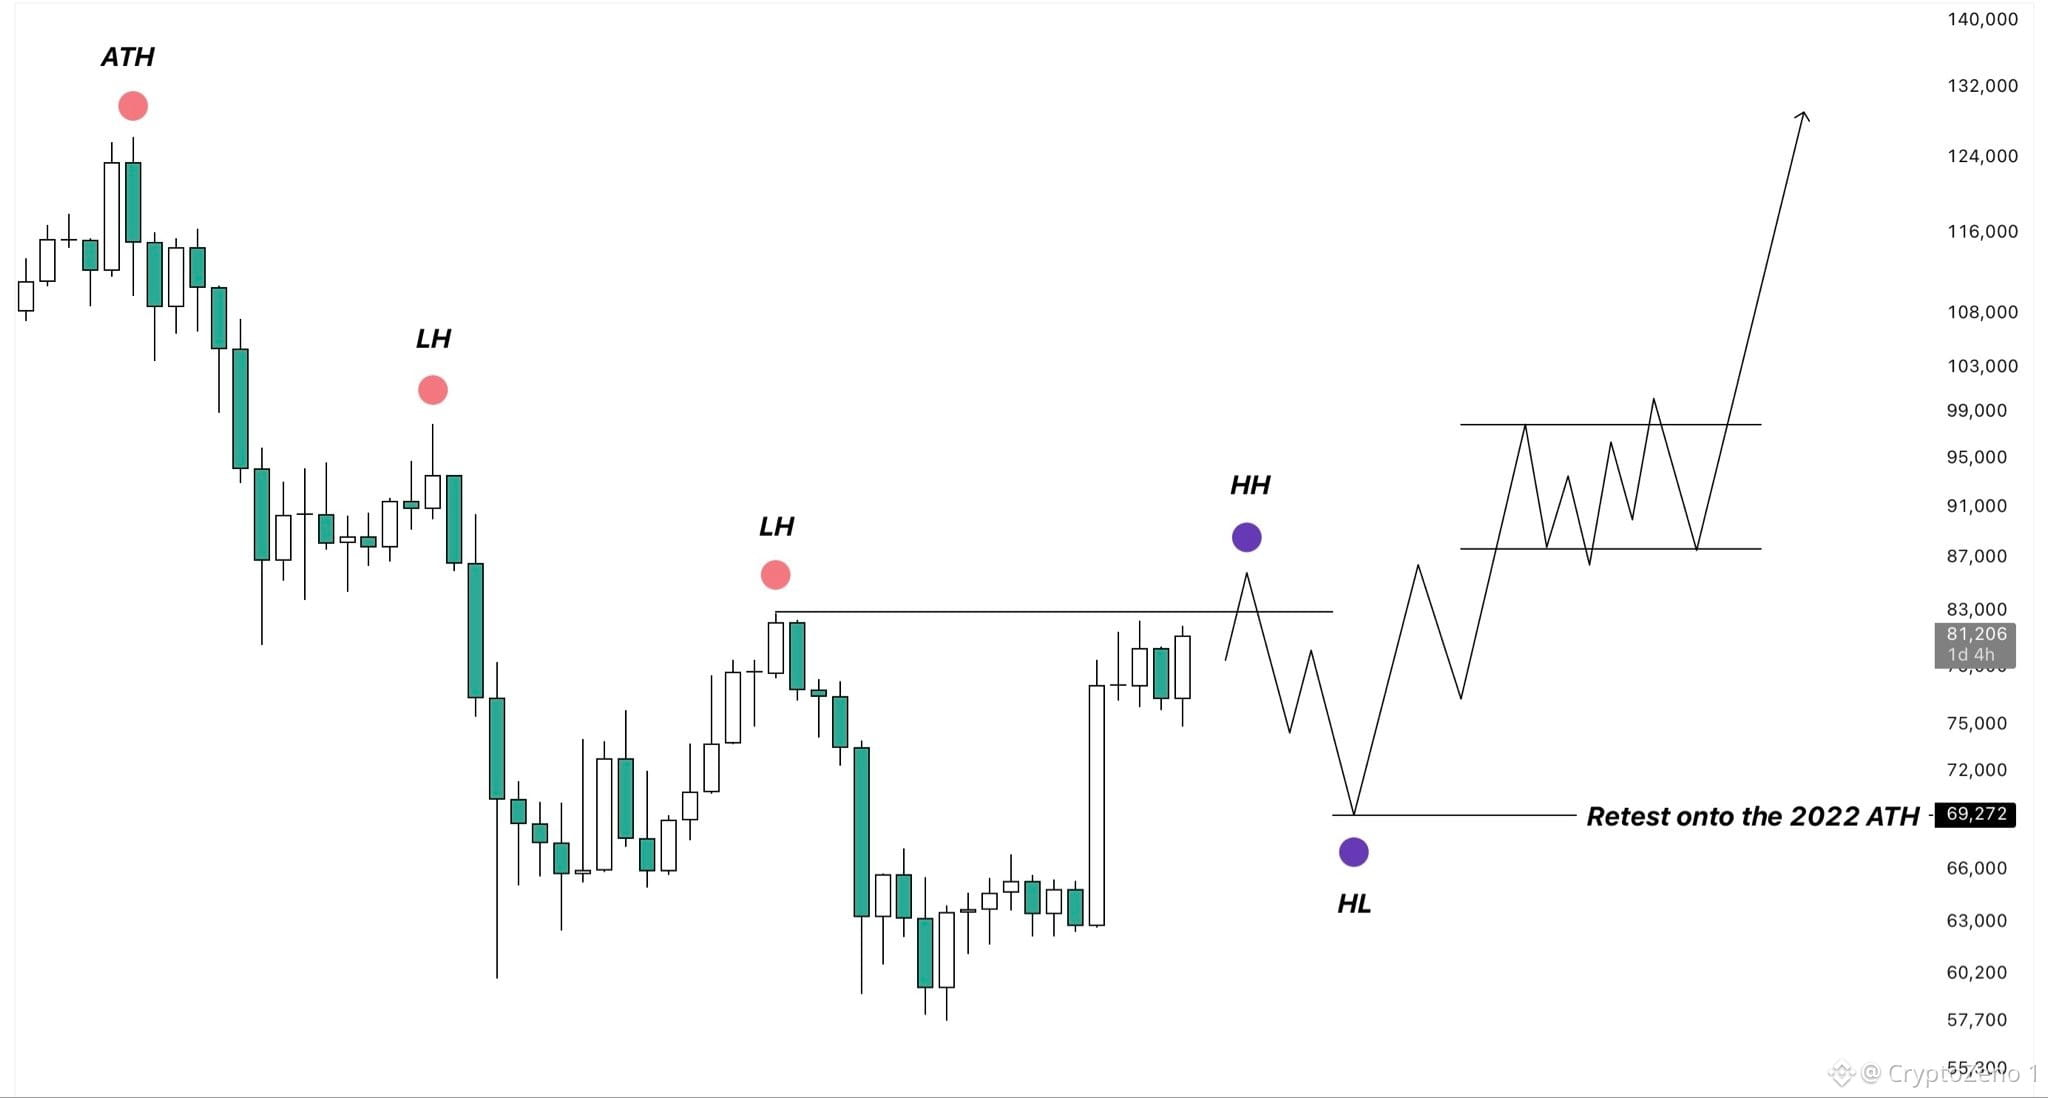
$BTC Alles, was wir brauchen, ist ein Push über $83k hinaus.
An dieser Stelle wird die bärische Struktur ungültig und die Bären werden endgültig abgewürgt.
Selbst wenn wir danach einen größeren Pullback bekommen, werde ich diese Gelegenheit einfach nutzen, um weiter in meine Spot-Position zu skalieren.
Tatsächlich wäre ein tieferer Retracement in Richtung des ATH des vorherigen Zyklus um $69k eines der besten Szenarien, um das ich bitten könnte.
Zu diesem Zeitpunkt wäre die Struktur bereits zugunsten der Käufer verschoben, während der Preis uns eine weitere Gelegenheit gibt, uns viel tiefer zu positionieren.
Von dort aus würde ich auf die nächste große Expansion achten, wobei der Bereich $90k–$95k die erste Zone ist, in die der Preis aus meiner Sicht arbeiten wird.
#BTC Preisanalyse# #Makro-Insights#
$BTC Alles, was wir brauchen, ist ein Push über $83k hinaus.
An dieser Stelle wird die bärische Struktur ungültig und die Bären werden endgültig abgewürgt.
Selbst wenn wir danach einen größeren Pullback bekommen, werde ich diese Gelegenheit einfach nutzen, um weiter in meine Spot-Position zu skalieren.
Tatsächlich wäre ein tieferer Retracement in Richtung des ATH des vorherigen Zyklus um $69k eines der besten Szenarien, um das ich bitten könnte.
Zu diesem Zeitpunkt wäre die Struktur bereits zugunsten der Käufer verschoben, während der Preis uns eine weitere Gelegenheit gibt, uns viel tiefer zu positionieren.
Von dort aus würde ich auf die nächste große Expansion achten, wobei der Bereich $90k–$95k die erste Zone ist, in die der Preis aus meiner Sicht arbeiten wird.
#BTC Preisanalyse# #Makro-Insights#
An dieser Stelle wird die bärische Struktur ungültig und die Bären werden endgültig abgewürgt.
Selbst wenn wir danach einen größeren Pullback bekommen, werde ich diese Gelegenheit einfach nutzen, um weiter in meine Spot-Position zu skalieren.
Tatsächlich wäre ein tieferer Retracement in Richtung des ATH des vorherigen Zyklus um $69k eines der besten Szenarien, um das ich bitten könnte.
Zu diesem Zeitpunkt wäre die Struktur bereits zugunsten der Käufer verschoben, während der Preis uns eine weitere Gelegenheit gibt, uns viel tiefer zu positionieren.
Von dort aus würde ich auf die nächste große Expansion achten, wobei der Bereich $90k–$95k die erste Zone ist, in die der Preis aus meiner Sicht arbeiten wird.
#BTC Preisanalyse# #Makro-Insights#
53
·
--
Übersetzung ansehen
$BTC
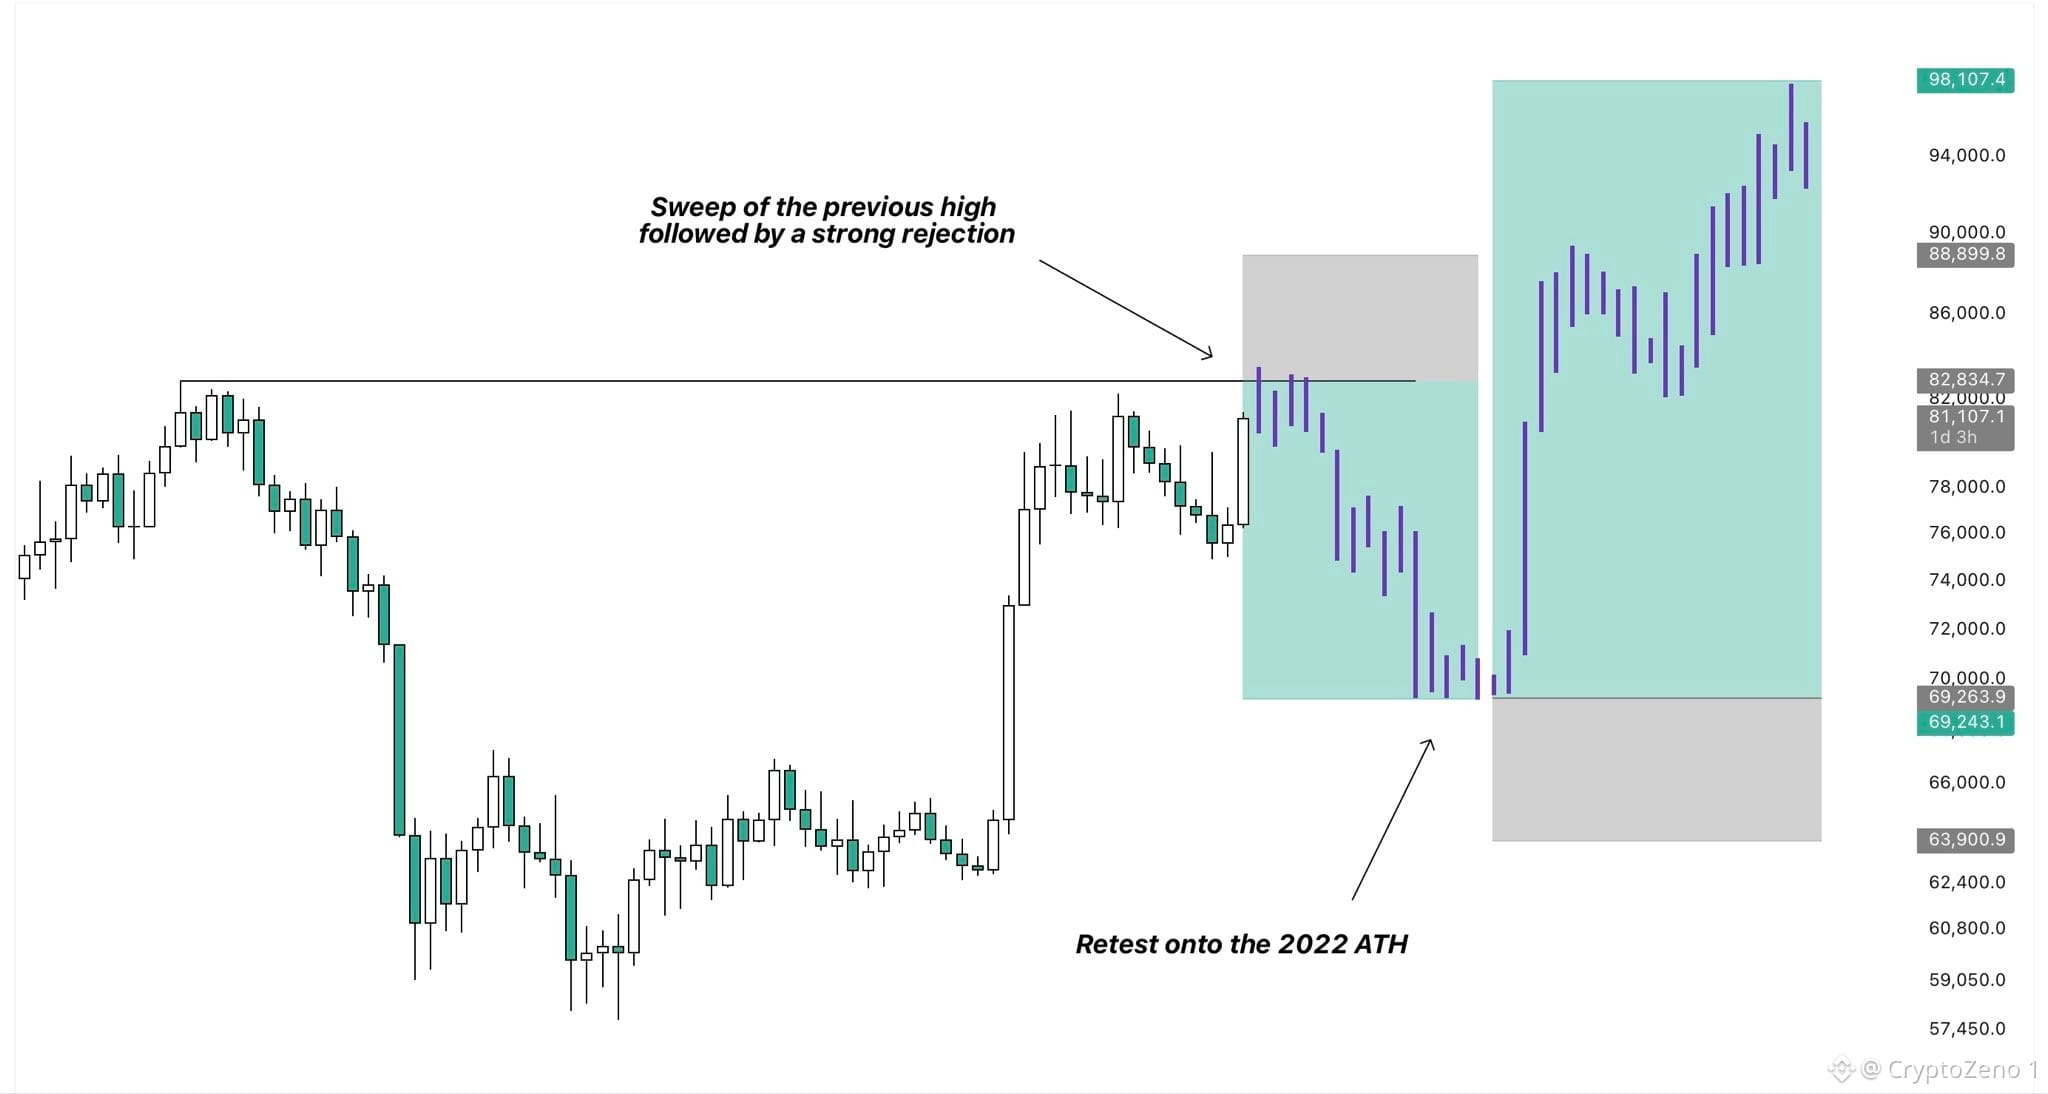
So far, this cycle has been mirroring the 2022 price action very closely.
If BTC continues to follow that same behavior, we should soon see a move toward $83K before another
larger pullback begins.
If that plays out, it could create two very interesting swing trade opportunities.
The first would be a potential short after price takes out the previous HTF high around $82.8k and shows signs of rejection. Based on the 2022 fractal, a realistic target for that pullback would be the 2022 all time high which sits at $69k.
If price eventually trades into that area, it could then offer the next major opportunity. This time for another
swing long aimed at catching the following expansion to the upside.
For that move, I’d be targeting the $90k–$95k region. #BTC Price Analysis# #Macro Insights#
$BTC
So far, this cycle has been mirroring the 2022 price action very closely.
If BTC continues to follow that same behavior, we should soon see a move toward $83K before another
larger pullback begins.
If that plays out, it could create two very interesting swing trade opportunities.
The first would be a potential short after price takes out the previous HTF high around $82.8k and shows signs of rejection. Based on the 2022 fractal, a realistic target for that pullback would be the 2022 all time high which sits at $69k.
If price eventually trades into that area, it could then offer the next major opportunity. This time for another
swing long aimed at catching the following expansion to the upside.
For that move, I’d be targeting the $90k–$95k region. #BTC Price Analysis# #Macro Insights#
So far, this cycle has been mirroring the 2022 price action very closely.
If BTC continues to follow that same behavior, we should soon see a move toward $83K before another
larger pullback begins.
If that plays out, it could create two very interesting swing trade opportunities.
The first would be a potential short after price takes out the previous HTF high around $82.8k and shows signs of rejection. Based on the 2022 fractal, a realistic target for that pullback would be the 2022 all time high which sits at $69k.
If price eventually trades into that area, it could then offer the next major opportunity. This time for another
swing long aimed at catching the following expansion to the upside.
For that move, I’d be targeting the $90k–$95k region. #BTC Price Analysis# #Macro Insights#
71
·
--
Übersetzung ansehen
$BTC Like clockwork...
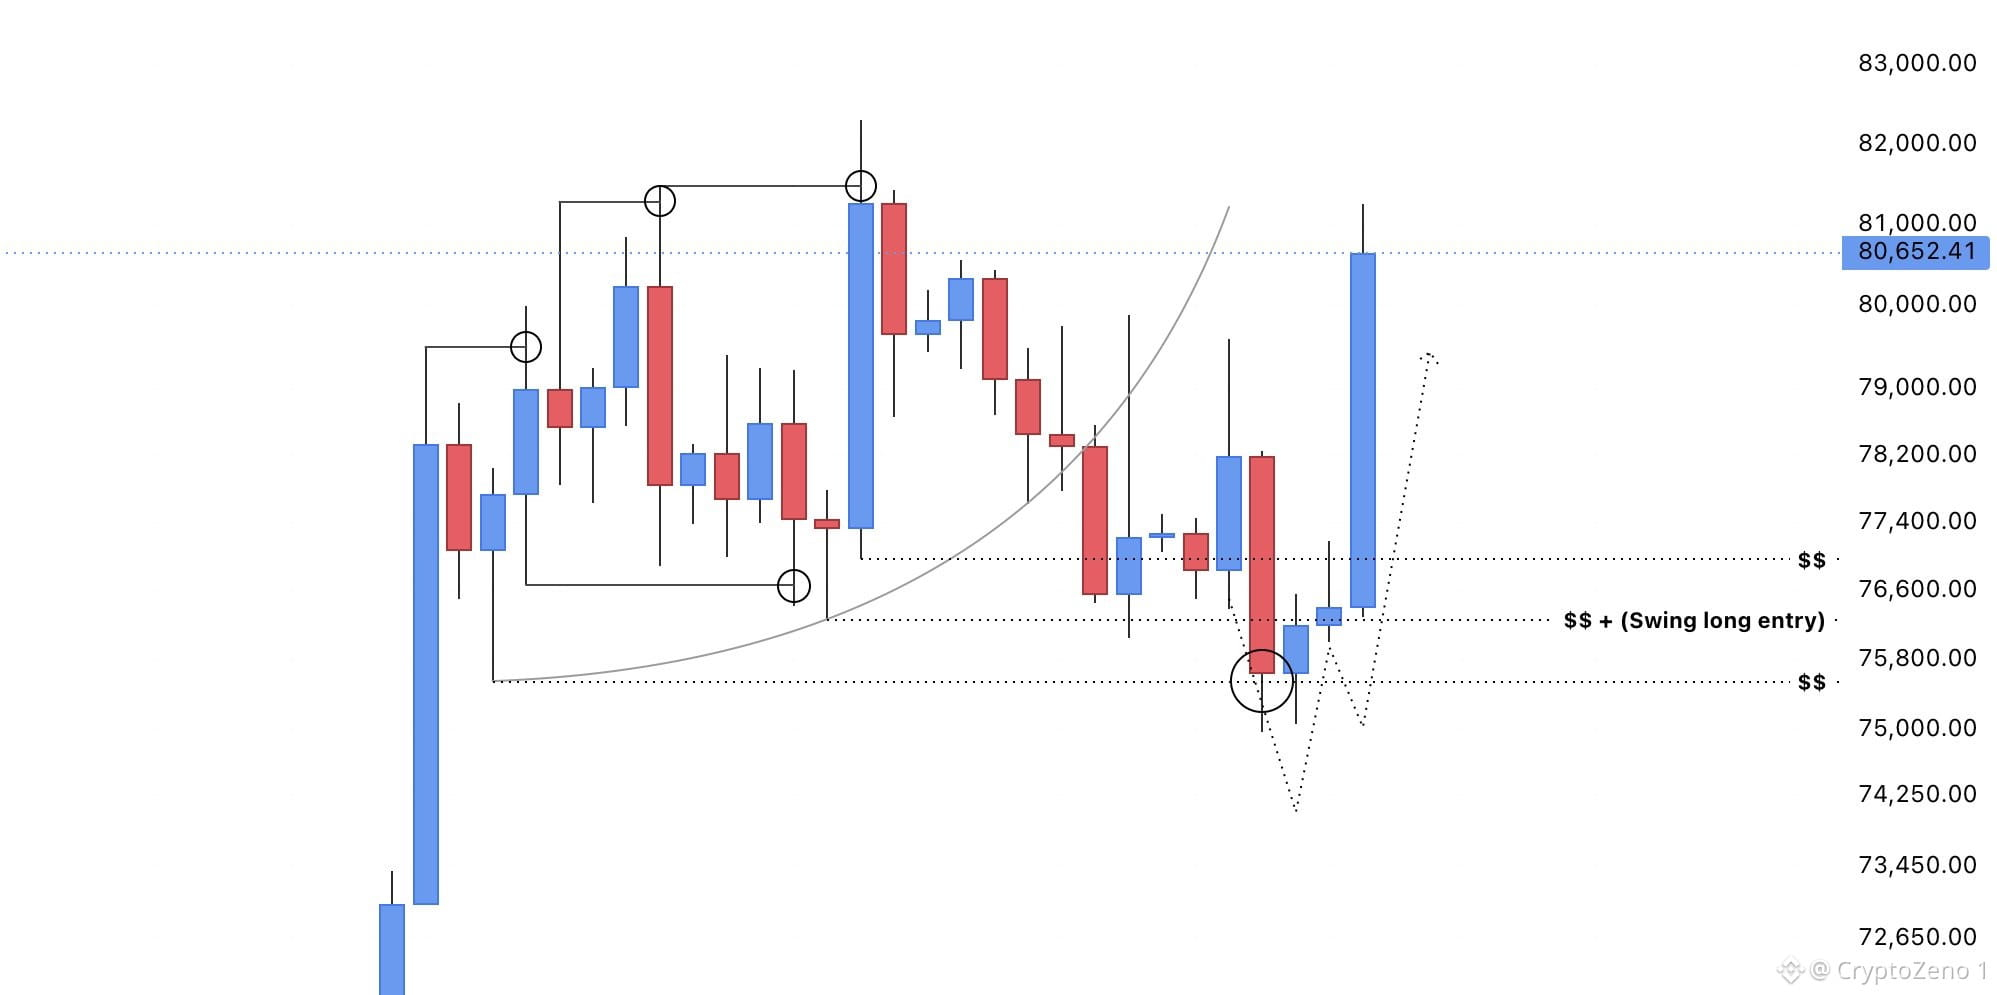
Bears got very bearish at the lows once again.
Study market sentiment. Most participants believed price was going lower, yet it clearly wasn't.
Price swept all the local lows while extremely bearish news came out at the range lows. That's exactly what gets people entering shorts and targeting much lower prices.
Yet price does the opposite.
Markets always tends to price in the news before it even comes out.
Lows swept, and I'm comfortably swing long from 76.2K.🃏 #BTC Price Analysis# #Macro Insights#
$BTC Like clockwork...
Bears got very bearish at the lows once again.
Study market sentiment. Most participants believed price was going lower, yet it clearly wasn't.
Price swept all the local lows while extremely bearish news came out at the range lows. That's exactly what gets people entering shorts and targeting much lower prices.
Yet price does the opposite.
Markets always tends to price in the news before it even comes out.
Lows swept, and I'm comfortably swing long from 76.2K.🃏 #BTC Price Analysis# #Macro Insights#
Bears got very bearish at the lows once again.
Study market sentiment. Most participants believed price was going lower, yet it clearly wasn't.
Price swept all the local lows while extremely bearish news came out at the range lows. That's exactly what gets people entering shorts and targeting much lower prices.
Yet price does the opposite.
Markets always tends to price in the news before it even comes out.
Lows swept, and I'm comfortably swing long from 76.2K.🃏 #BTC Price Analysis# #Macro Insights#
70
·
--
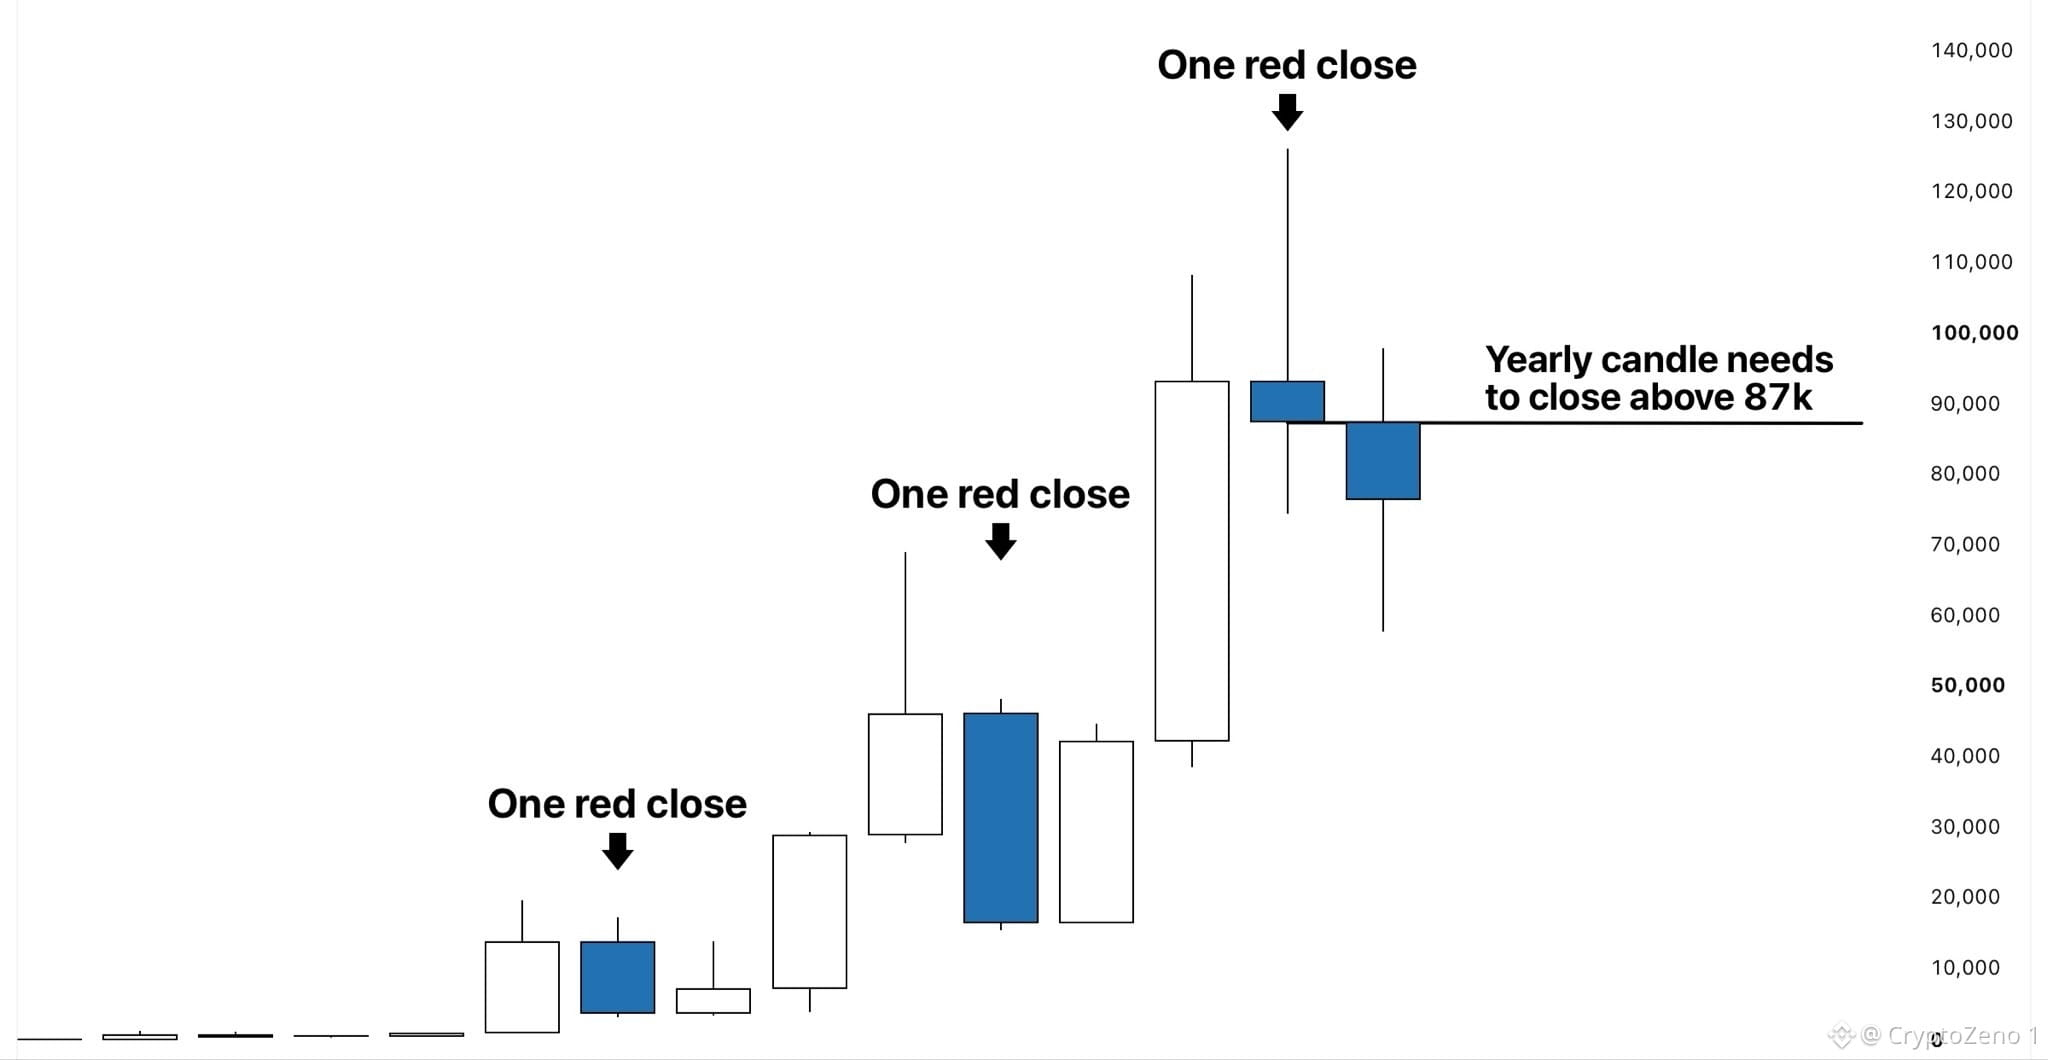
$BTC Die Leute fragen immer wieder, ob wir in diesem Jahr die 100.000 erreichen.
Das weiß ich nicht, aber das, was ich weiß, ist, dass laut der bisherigen Kursentwicklung die Wahrscheinlichkeit äußerst hoch ist, dass wir bis zum Jahresende über 87.000 handeln werden.
Wer weiß, wie hoch es darüber hinaus geht… #BTC Price Analysis# #Macro Insights#
$BTC Die Leute fragen immer wieder, ob wir in diesem Jahr die 100.000 erreichen.
Das weiß ich nicht, aber das, was ich weiß, ist, dass laut der bisherigen Kursentwicklung die Wahrscheinlichkeit äußerst hoch ist, dass wir bis zum Jahresende über 87.000 handeln werden.
Wer weiß, wie hoch es darüber hinaus geht… #BTC Price Analysis# #Macro Insights#
Das weiß ich nicht, aber das, was ich weiß, ist, dass laut der bisherigen Kursentwicklung die Wahrscheinlichkeit äußerst hoch ist, dass wir bis zum Jahresende über 87.000 handeln werden.
Wer weiß, wie hoch es darüber hinaus geht… #BTC Price Analysis# #Macro Insights#
55
·
--
$BTC
Hier sind meine aktuellen Gedanken zum Markt.
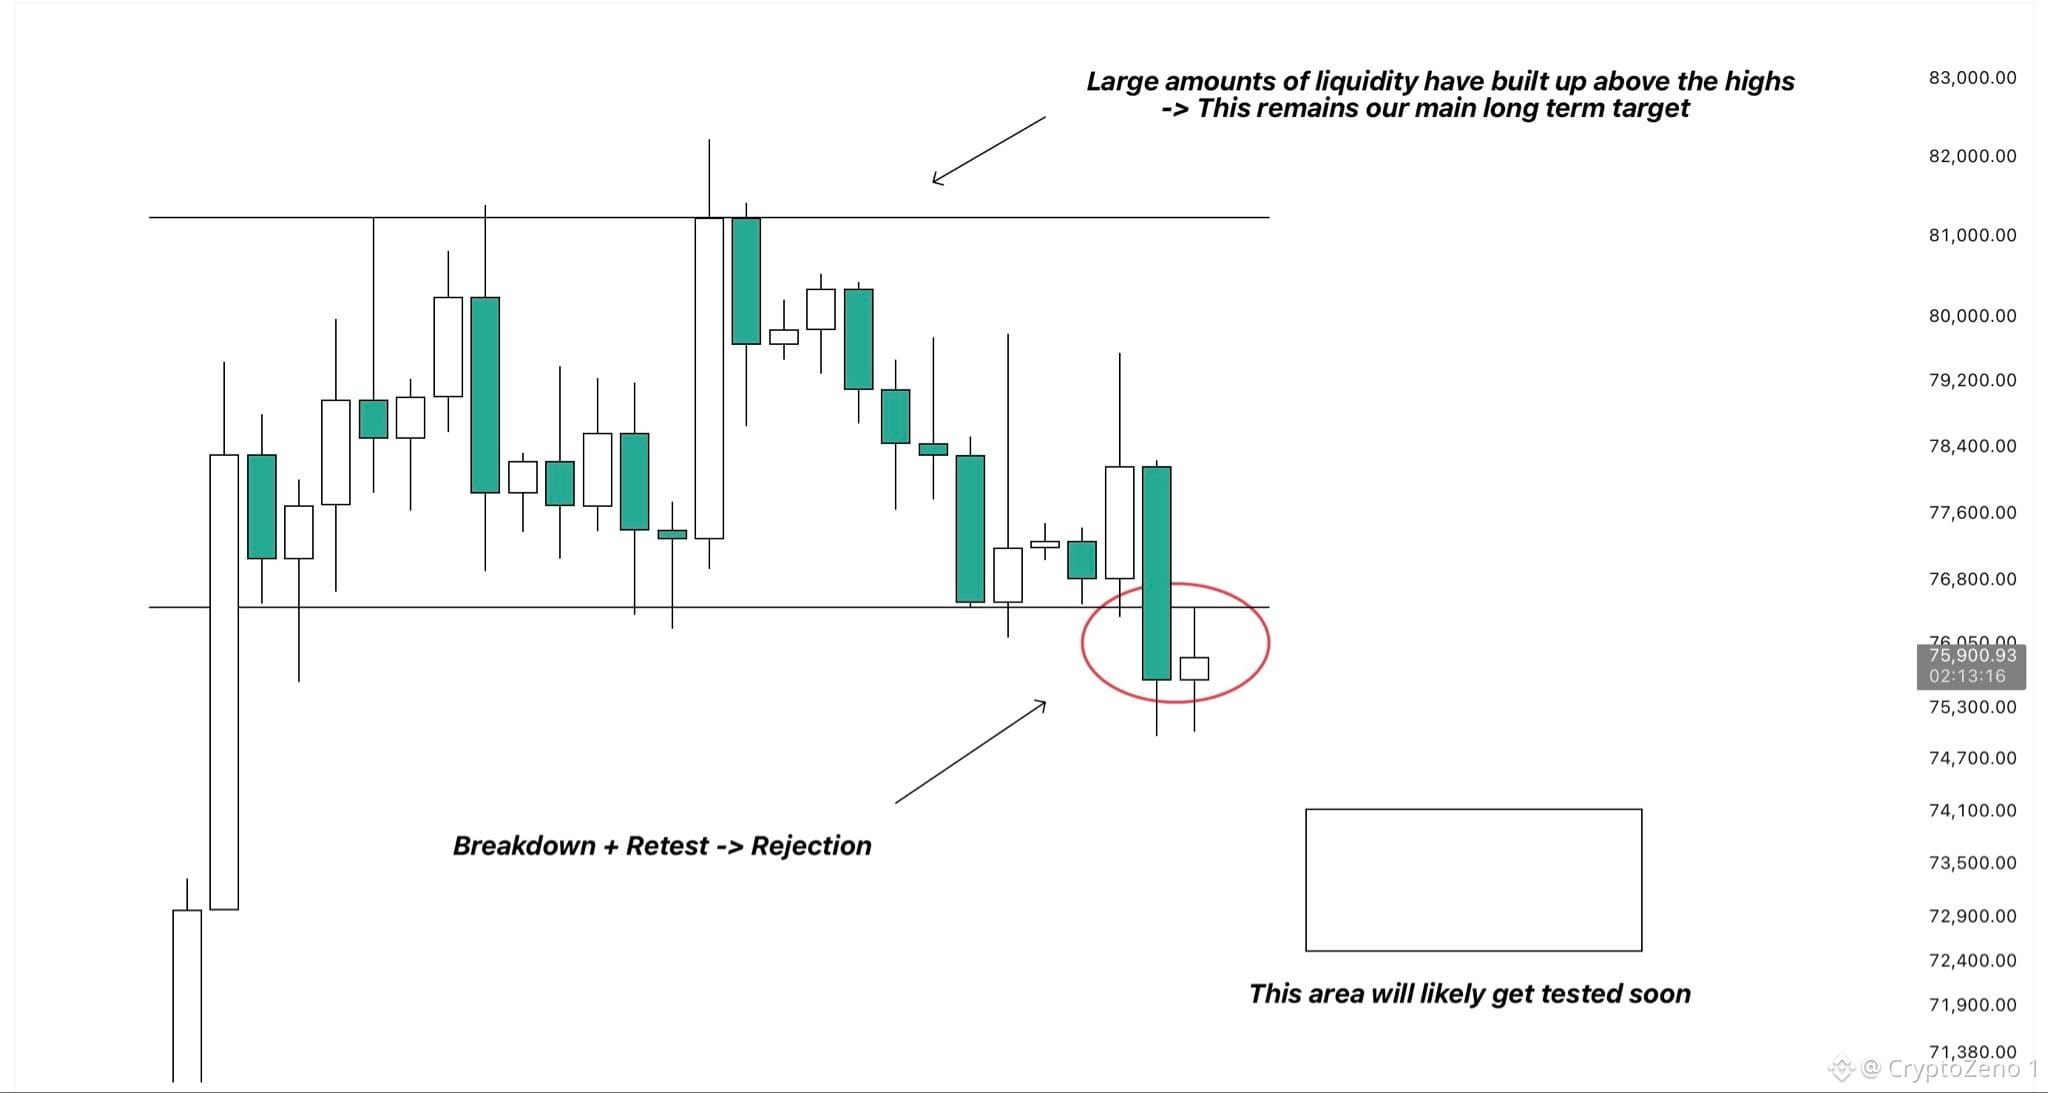
Die gescheiterte Abstimmung zum Clarity Act von gestern löste einen etwa 3%igen Abverkauf aus und wurde von einem täglichen Schlusskurs unterhalb der Range-Tiefs gefolgt.
Seitdem hat der Kurs die untere Grenze der Range erneut getestet und scheint sie als Widerstand zu respektieren.
Wenn die heutige Tageskerze nach diesem Retest wieder unter $76K schließt, erwarte ich, dass der Kurs tiefer in den Bereich $74K–$70K drückt. Dort plane ich auch, zu meinem bereits laufenden Swing-Long hinzuzukaufen.
Was ich als Nächstes beobachten werde, sobald der Kurs diese Zone erreicht hat, ist eine Rückeroberung der vorherigen Range.
Wenn das passiert, möchte ich den Fortsetzungs-Trade handeln, wobei mein Ziel die Hochs bei etwa $83K sind.
Das aktuelle Umfeld bleibt ziemlich schwierig zum Traden, daher ist es auch nicht verkehrt, kurzfristige Positionen erstmal zu meiden, bis der Markt eine klarere Richtung bietet.
Wenn du es dir einfach halten willst, glaube ich, dass das allmähliche Hinzufügen von Spot-Exposure bei tieferen Pullbacks von hier aus am sinnvollsten ist. #BTC Price Analysis# #Macro Insights#
$BTC
Hier sind meine aktuellen Gedanken zum Markt.
Die gescheiterte Abstimmung zum Clarity Act von gestern löste einen etwa 3%igen Abverkauf aus und wurde von einem täglichen Schlusskurs unterhalb der Range-Tiefs gefolgt.
Seitdem hat der Kurs die untere Grenze der Range erneut getestet und scheint sie als Widerstand zu respektieren.
Wenn die heutige Tageskerze nach diesem Retest wieder unter $76K schließt, erwarte ich, dass der Kurs tiefer in den Bereich $74K–$70K drückt. Dort plane ich auch, zu meinem bereits laufenden Swing-Long hinzuzukaufen.
Was ich als Nächstes beobachten werde, sobald der Kurs diese Zone erreicht hat, ist eine Rückeroberung der vorherigen Range.
Wenn das passiert, möchte ich den Fortsetzungs-Trade handeln, wobei mein Ziel die Hochs bei etwa $83K sind.
Das aktuelle Umfeld bleibt ziemlich schwierig zum Traden, daher ist es auch nicht verkehrt, kurzfristige Positionen erstmal zu meiden, bis der Markt eine klarere Richtung bietet.
Wenn du es dir einfach halten willst, glaube ich, dass das allmähliche Hinzufügen von Spot-Exposure bei tieferen Pullbacks von hier aus am sinnvollsten ist. #BTC Price Analysis# #Macro Insights#
Hier sind meine aktuellen Gedanken zum Markt.
Die gescheiterte Abstimmung zum Clarity Act von gestern löste einen etwa 3%igen Abverkauf aus und wurde von einem täglichen Schlusskurs unterhalb der Range-Tiefs gefolgt.
Seitdem hat der Kurs die untere Grenze der Range erneut getestet und scheint sie als Widerstand zu respektieren.
Wenn die heutige Tageskerze nach diesem Retest wieder unter $76K schließt, erwarte ich, dass der Kurs tiefer in den Bereich $74K–$70K drückt. Dort plane ich auch, zu meinem bereits laufenden Swing-Long hinzuzukaufen.
Was ich als Nächstes beobachten werde, sobald der Kurs diese Zone erreicht hat, ist eine Rückeroberung der vorherigen Range.
Wenn das passiert, möchte ich den Fortsetzungs-Trade handeln, wobei mein Ziel die Hochs bei etwa $83K sind.
Das aktuelle Umfeld bleibt ziemlich schwierig zum Traden, daher ist es auch nicht verkehrt, kurzfristige Positionen erstmal zu meiden, bis der Markt eine klarere Richtung bietet.
Wenn du es dir einfach halten willst, glaube ich, dass das allmähliche Hinzufügen von Spot-Exposure bei tieferen Pullbacks von hier aus am sinnvollsten ist. #BTC Price Analysis# #Macro Insights#
62
·
--
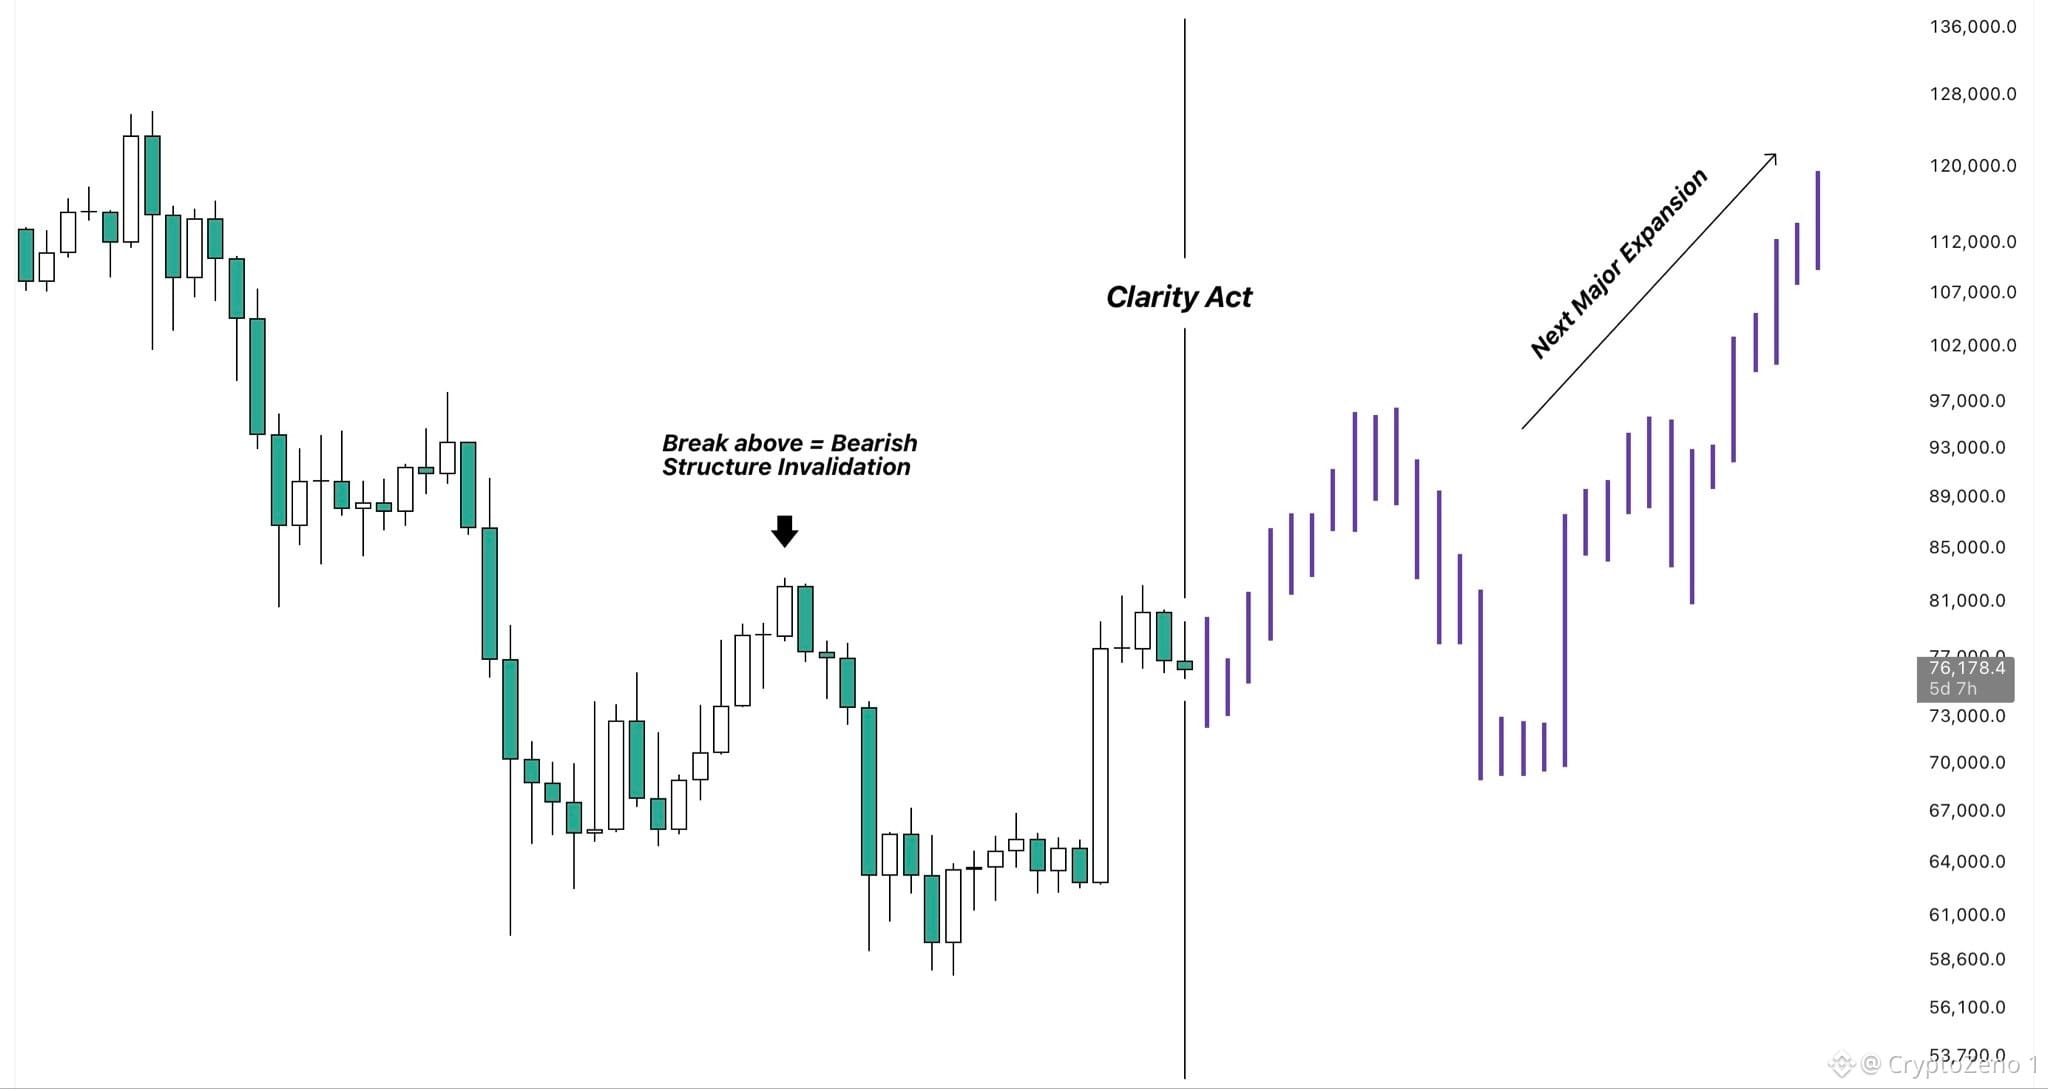
$BTC Könnte das heutige Abstimmungs-Ergebnis zum „Clarity Act“ den Beginn von BTCs nächster großer Expansion markieren?
Derzeit handelt der Kurs weit unter dem Niveau, das zurückerobert werden müsste, um die bärische Struktur zu invalidieren, daher erwarte ich nicht, dass ein einzelnes News-Ereignis BTC plötzlich über $83K drückt.
Ereignisse wie dieses können jedoch der Auslöser sein, der den Schwung verlagert und eine größere Bewegung startet.
Wenn die heutige Reaktion starken Kaufdruck zurück in den Markt bringt, könnte das der erste Schritt sein, um das vorherige Hoch zurückzuerobern und schließlich die bärische HTF-Struktur zu invalidieren. #BTC Price Analysis# #Macro Insights#
$BTC Könnte das heutige Abstimmungs-Ergebnis zum „Clarity Act“ den Beginn von BTCs nächster großer Expansion markieren?
Derzeit handelt der Kurs weit unter dem Niveau, das zurückerobert werden müsste, um die bärische Struktur zu invalidieren, daher erwarte ich nicht, dass ein einzelnes News-Ereignis BTC plötzlich über $83K drückt.
Ereignisse wie dieses können jedoch der Auslöser sein, der den Schwung verlagert und eine größere Bewegung startet.
Wenn die heutige Reaktion starken Kaufdruck zurück in den Markt bringt, könnte das der erste Schritt sein, um das vorherige Hoch zurückzuerobern und schließlich die bärische HTF-Struktur zu invalidieren. #BTC Price Analysis# #Macro Insights#
Derzeit handelt der Kurs weit unter dem Niveau, das zurückerobert werden müsste, um die bärische Struktur zu invalidieren, daher erwarte ich nicht, dass ein einzelnes News-Ereignis BTC plötzlich über $83K drückt.
Ereignisse wie dieses können jedoch der Auslöser sein, der den Schwung verlagert und eine größere Bewegung startet.
Wenn die heutige Reaktion starken Kaufdruck zurück in den Markt bringt, könnte das der erste Schritt sein, um das vorherige Hoch zurückzuerobern und schließlich die bärische HTF-Struktur zu invalidieren. #BTC Price Analysis# #Macro Insights#
33
·
--
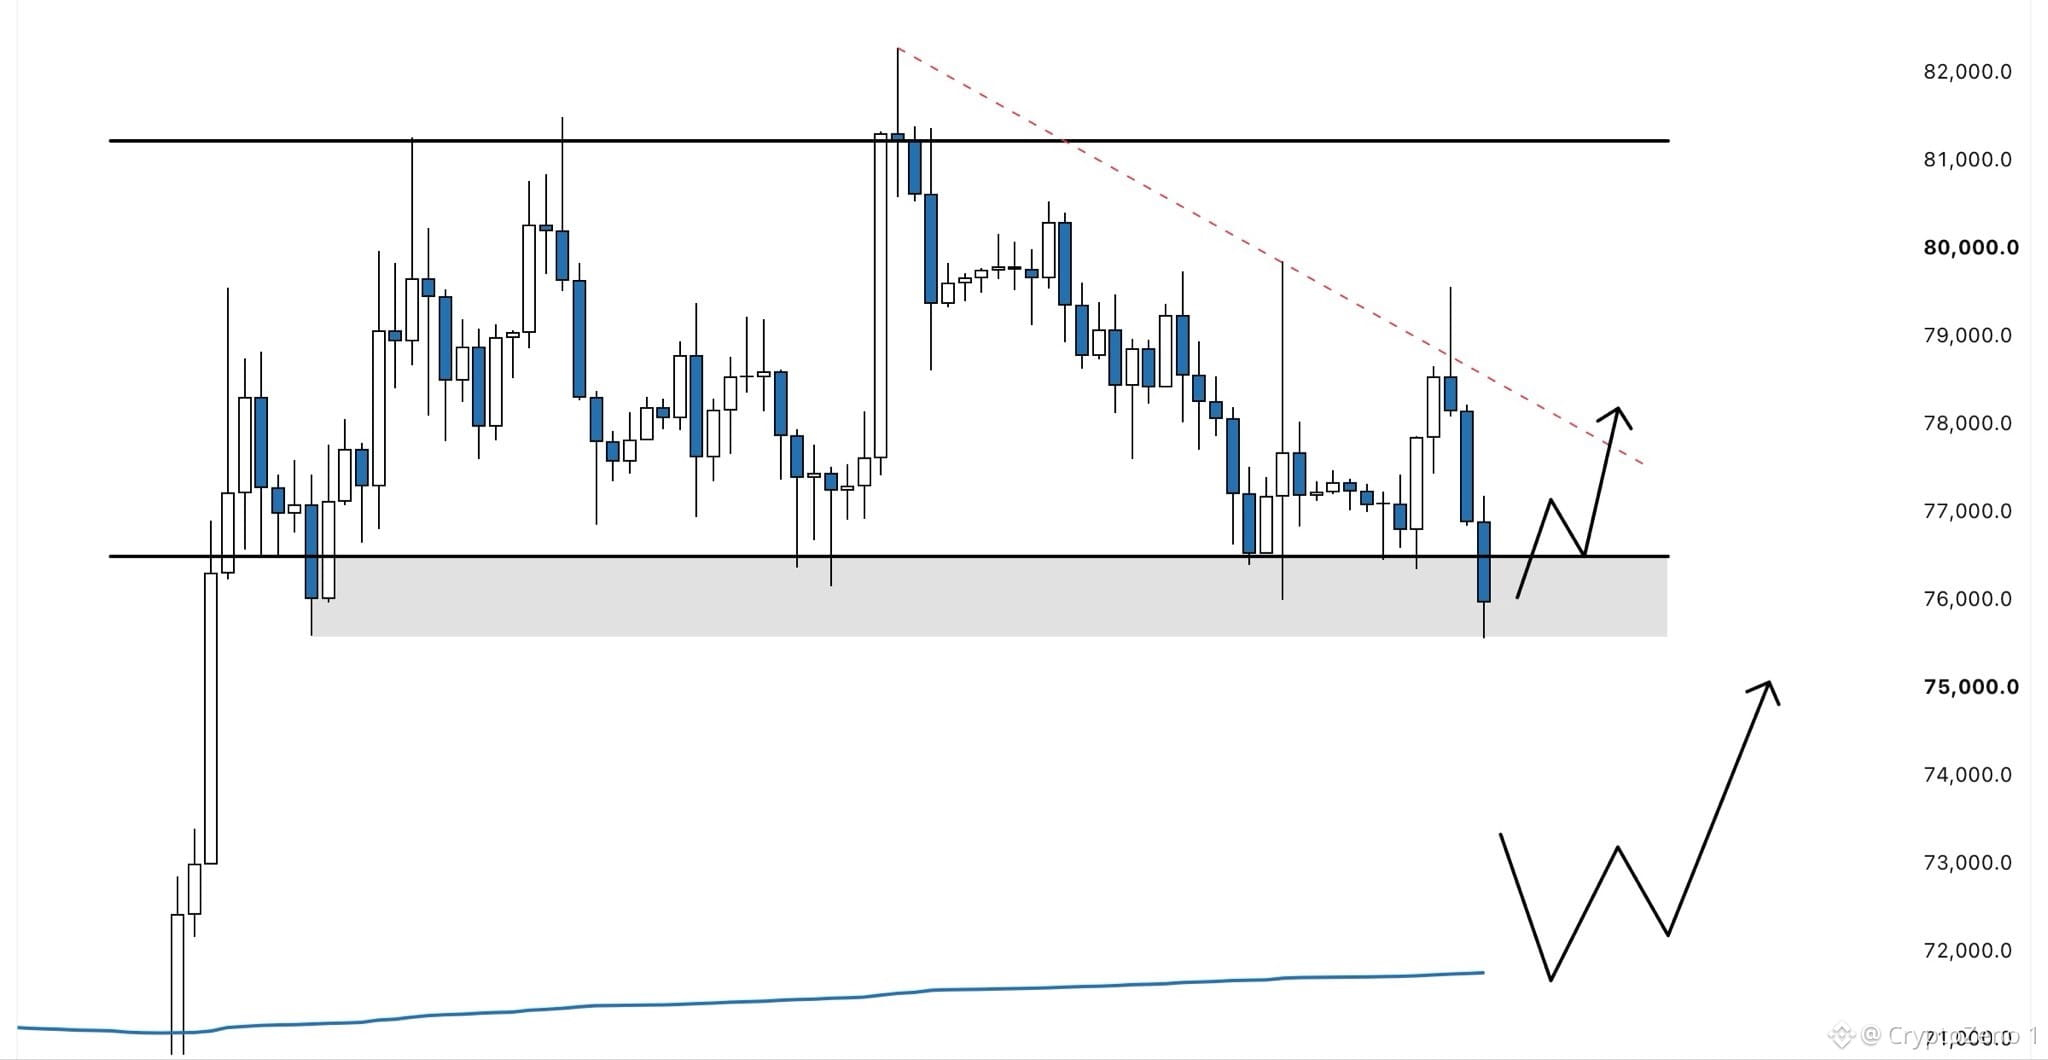
$BTC-Preis ist in die aktuelle Hauptunterstützung gefallen.
Wenn Käufer nicht stark genug sind und wir hier keinen Rebound sehen, erwarte ich einen Rücksetzer in Richtung der aVWAP bei etwa 72k.
Im Maximum erwarte ich, dass der Preis 70k erneut testet. Ich denke nicht, dass wir jemals wieder viel niedriger bei BTC sehen werden. #BTC Preisanalyse# #Makro-Einblicke# #Altcoin-Saison#
$BTC-Preis ist in die aktuelle Hauptunterstützung gefallen.
Wenn Käufer nicht stark genug sind und wir hier keinen Rebound sehen, erwarte ich einen Rücksetzer in Richtung der aVWAP bei etwa 72k.
Im Maximum erwarte ich, dass der Preis 70k erneut testet. Ich denke nicht, dass wir jemals wieder viel niedriger bei BTC sehen werden. #BTC Preisanalyse# #Makro-Einblicke# #Altcoin-Saison#
Wenn Käufer nicht stark genug sind und wir hier keinen Rebound sehen, erwarte ich einen Rücksetzer in Richtung der aVWAP bei etwa 72k.
Im Maximum erwarte ich, dass der Preis 70k erneut testet. Ich denke nicht, dass wir jemals wieder viel niedriger bei BTC sehen werden. #BTC Preisanalyse# #Makro-Einblicke# #Altcoin-Saison#
56
·
--
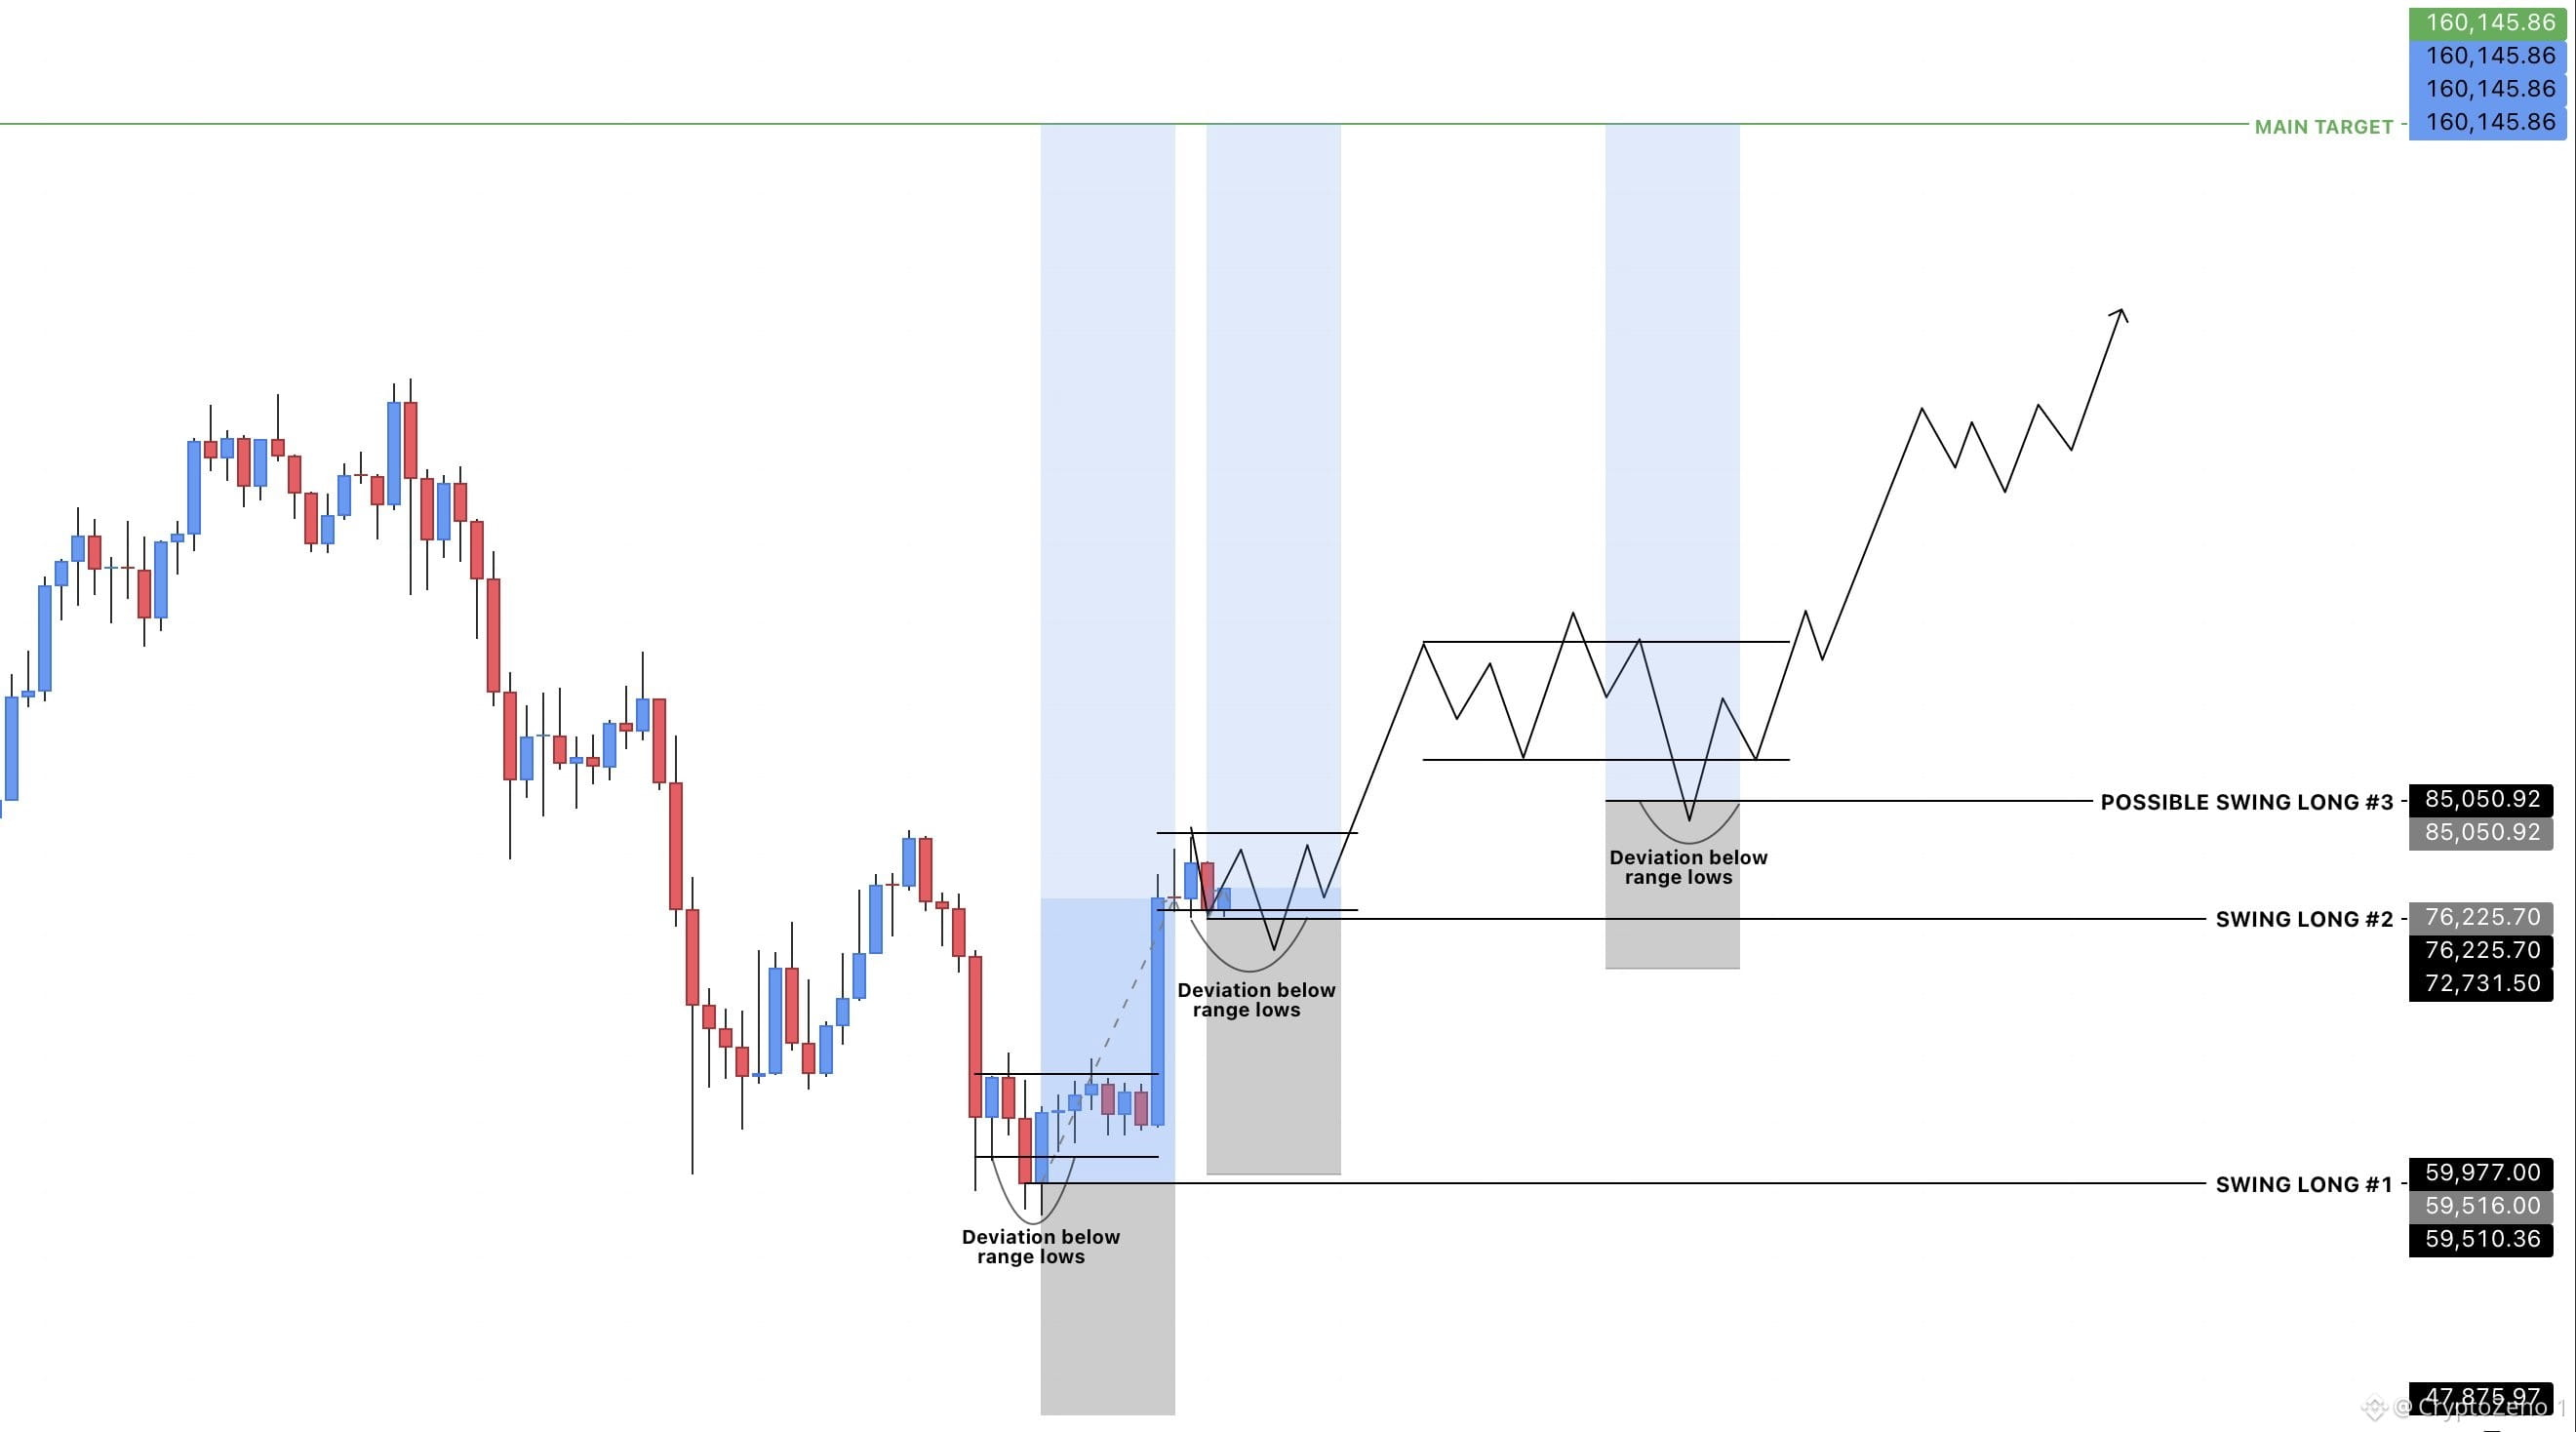
$BTC Handeln Sie dem Trend folgend...
Der Trend hat sich nach oben gedreht. Während eines Bullenmarkts lassen sich Abweichungen unterhalb der unteren Range-Grenzen oft gut ausnutzen und bieten häufig großartige Möglichkeiten, um Swing-Longs zu eröffnen.
Beide meiner Swing-Long-Positionen sind jetzt eröffnet, und ich plane, bis der Kurs 160K erreicht oder sich ihm nähert, keinen Gewinn mitzunehmen.
Ich werde weiterhin Swing-Longs eingehen, solange der Trend bullisch bleibt. Sobald es an der Zeit ist, wieder mit Short-Positionen zu starten, bin ich bereit.
Der Trend ist dein Freund.🃏 #BTC Kursanalyse# #Makro-Insights#
$BTC Handeln Sie dem Trend folgend...
Der Trend hat sich nach oben gedreht. Während eines Bullenmarkts lassen sich Abweichungen unterhalb der unteren Range-Grenzen oft gut ausnutzen und bieten häufig großartige Möglichkeiten, um Swing-Longs zu eröffnen.
Beide meiner Swing-Long-Positionen sind jetzt eröffnet, und ich plane, bis der Kurs 160K erreicht oder sich ihm nähert, keinen Gewinn mitzunehmen.
Ich werde weiterhin Swing-Longs eingehen, solange der Trend bullisch bleibt. Sobald es an der Zeit ist, wieder mit Short-Positionen zu starten, bin ich bereit.
Der Trend ist dein Freund.🃏 #BTC Kursanalyse# #Makro-Insights#
Der Trend hat sich nach oben gedreht. Während eines Bullenmarkts lassen sich Abweichungen unterhalb der unteren Range-Grenzen oft gut ausnutzen und bieten häufig großartige Möglichkeiten, um Swing-Longs zu eröffnen.
Beide meiner Swing-Long-Positionen sind jetzt eröffnet, und ich plane, bis der Kurs 160K erreicht oder sich ihm nähert, keinen Gewinn mitzunehmen.
Ich werde weiterhin Swing-Longs eingehen, solange der Trend bullisch bleibt. Sobald es an der Zeit ist, wieder mit Short-Positionen zu starten, bin ich bereit.
Der Trend ist dein Freund.🃏 #BTC Kursanalyse# #Makro-Insights#
55
·
--
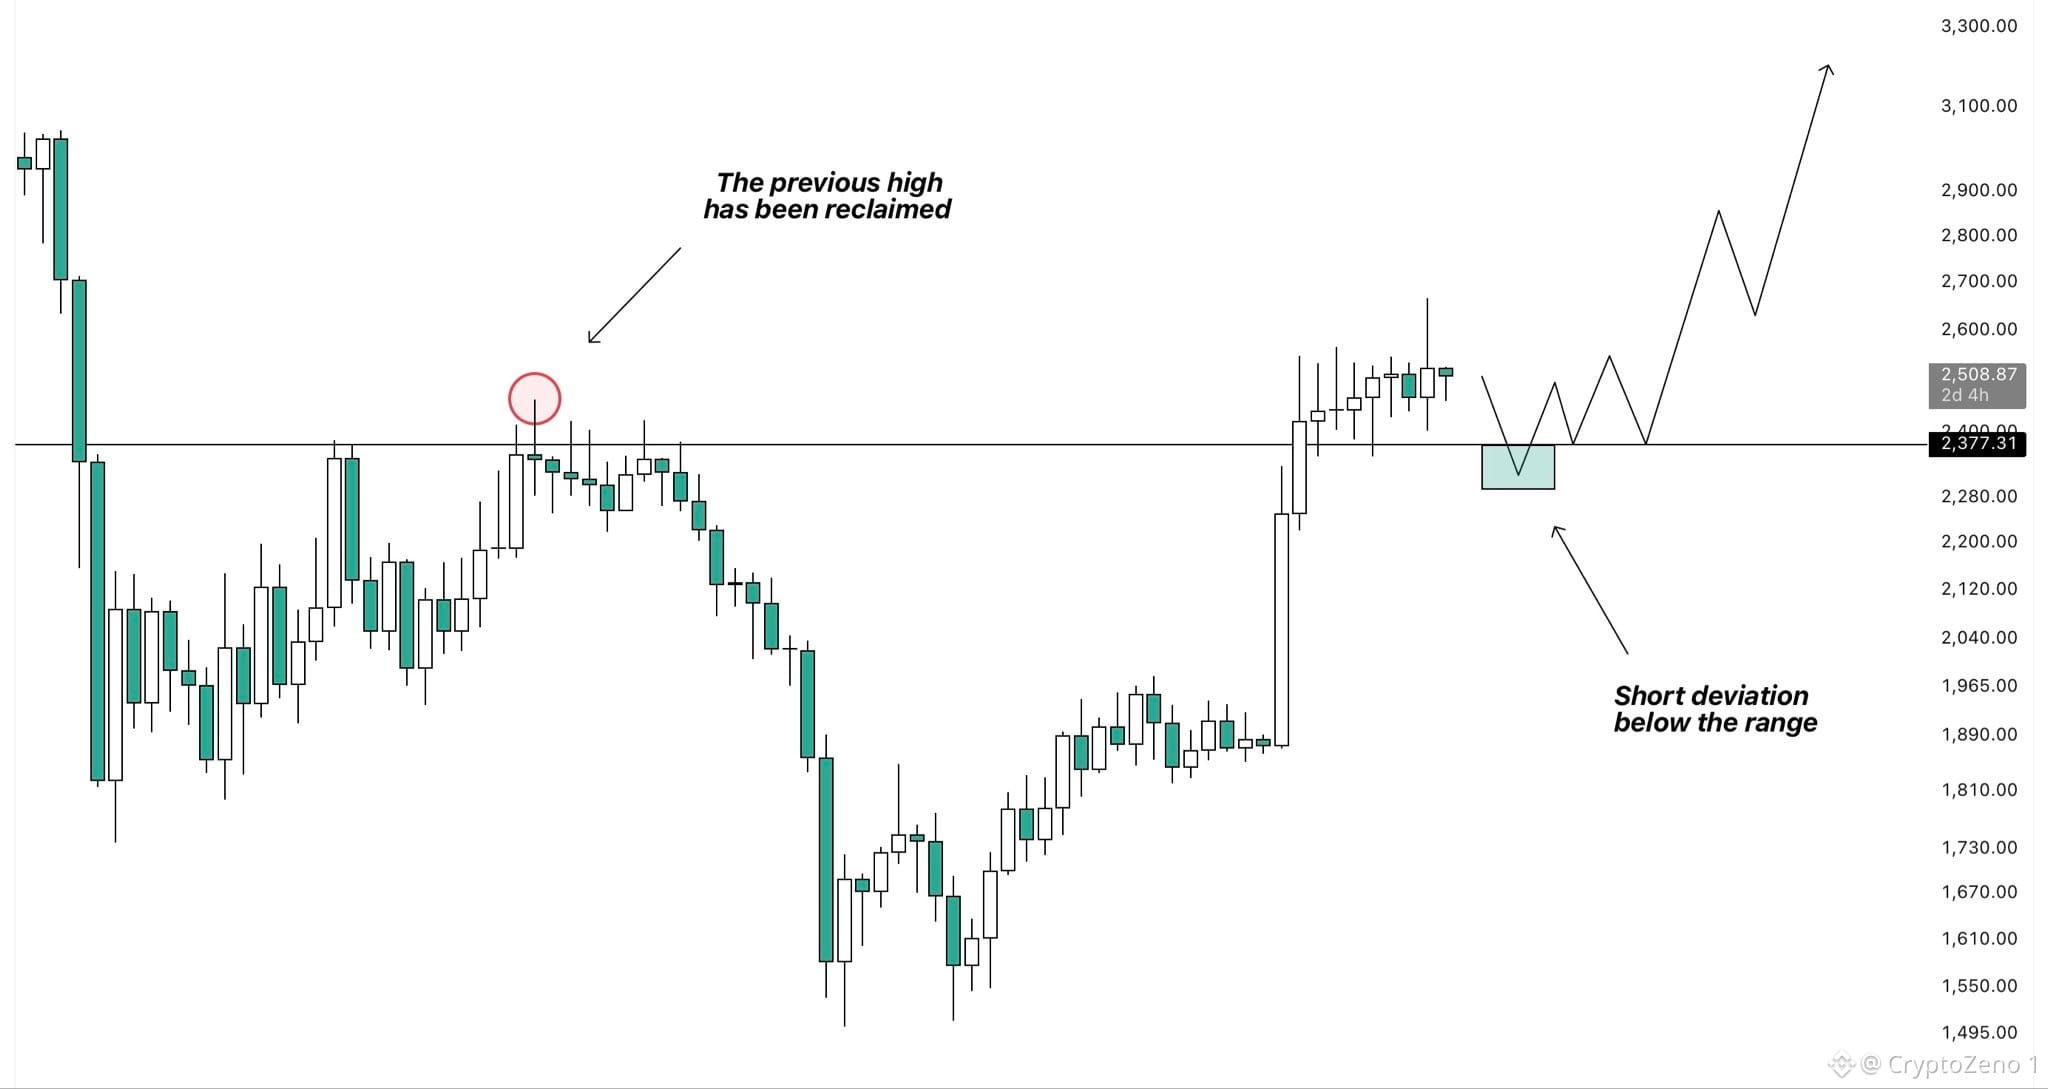
$ETH Für mich ist das definitiv ein Zeichen von Stärke.
Im Gegensatz zu BTC hat #Ethereum bereits seine bärische Struktur entkräftet, indem es das vorherige Hoch zurückerobert hat.
Der Kurs hält nun über $2.400 und ist in eine Phase der Wiederansammlung (Re-Accumulation) übergegangen.
Solange dieses Niveau weiterhin gehalten wird, halte ich die nächste größere Aufwärts-Ausdehnung für zunehmend wahrscheinlicher.
Selbst eine kurze Abweichung unter den Bereich würde mich nicht allzu sehr beunruhigen, solange der Kurs ihn schnell wieder zurückerobert. Tatsächlich könnte das sogar eine weitere gute Gelegenheit bieten, sich für die nächste Bewegung nach oben zu positionieren.
Im Moment ist das Wichtigste, worauf ich achte, ob ETH weiter Akzeptanz oberhalb des vorherigen Hochs aufbauen kann. Wenn das gelingt, wird eine Fortsetzung in Richtung $3.000 möglich. #Macro Insights# #Altcoin Season#
$ETH Für mich ist das definitiv ein Zeichen von Stärke.
Im Gegensatz zu BTC hat #Ethereum bereits seine bärische Struktur entkräftet, indem es das vorherige Hoch zurückerobert hat.
Der Kurs hält nun über $2.400 und ist in eine Phase der Wiederansammlung (Re-Accumulation) übergegangen.
Solange dieses Niveau weiterhin gehalten wird, halte ich die nächste größere Aufwärts-Ausdehnung für zunehmend wahrscheinlicher.
Selbst eine kurze Abweichung unter den Bereich würde mich nicht allzu sehr beunruhigen, solange der Kurs ihn schnell wieder zurückerobert. Tatsächlich könnte das sogar eine weitere gute Gelegenheit bieten, sich für die nächste Bewegung nach oben zu positionieren.
Im Moment ist das Wichtigste, worauf ich achte, ob ETH weiter Akzeptanz oberhalb des vorherigen Hochs aufbauen kann. Wenn das gelingt, wird eine Fortsetzung in Richtung $3.000 möglich. #Macro Insights# #Altcoin Season#
Im Gegensatz zu BTC hat #Ethereum bereits seine bärische Struktur entkräftet, indem es das vorherige Hoch zurückerobert hat.
Der Kurs hält nun über $2.400 und ist in eine Phase der Wiederansammlung (Re-Accumulation) übergegangen.
Solange dieses Niveau weiterhin gehalten wird, halte ich die nächste größere Aufwärts-Ausdehnung für zunehmend wahrscheinlicher.
Selbst eine kurze Abweichung unter den Bereich würde mich nicht allzu sehr beunruhigen, solange der Kurs ihn schnell wieder zurückerobert. Tatsächlich könnte das sogar eine weitere gute Gelegenheit bieten, sich für die nächste Bewegung nach oben zu positionieren.
Im Moment ist das Wichtigste, worauf ich achte, ob ETH weiter Akzeptanz oberhalb des vorherigen Hochs aufbauen kann. Wenn das gelingt, wird eine Fortsetzung in Richtung $3.000 möglich. #Macro Insights# #Altcoin Season#
47
·
--
$BTC Dieses Mal ist es nicht anders...
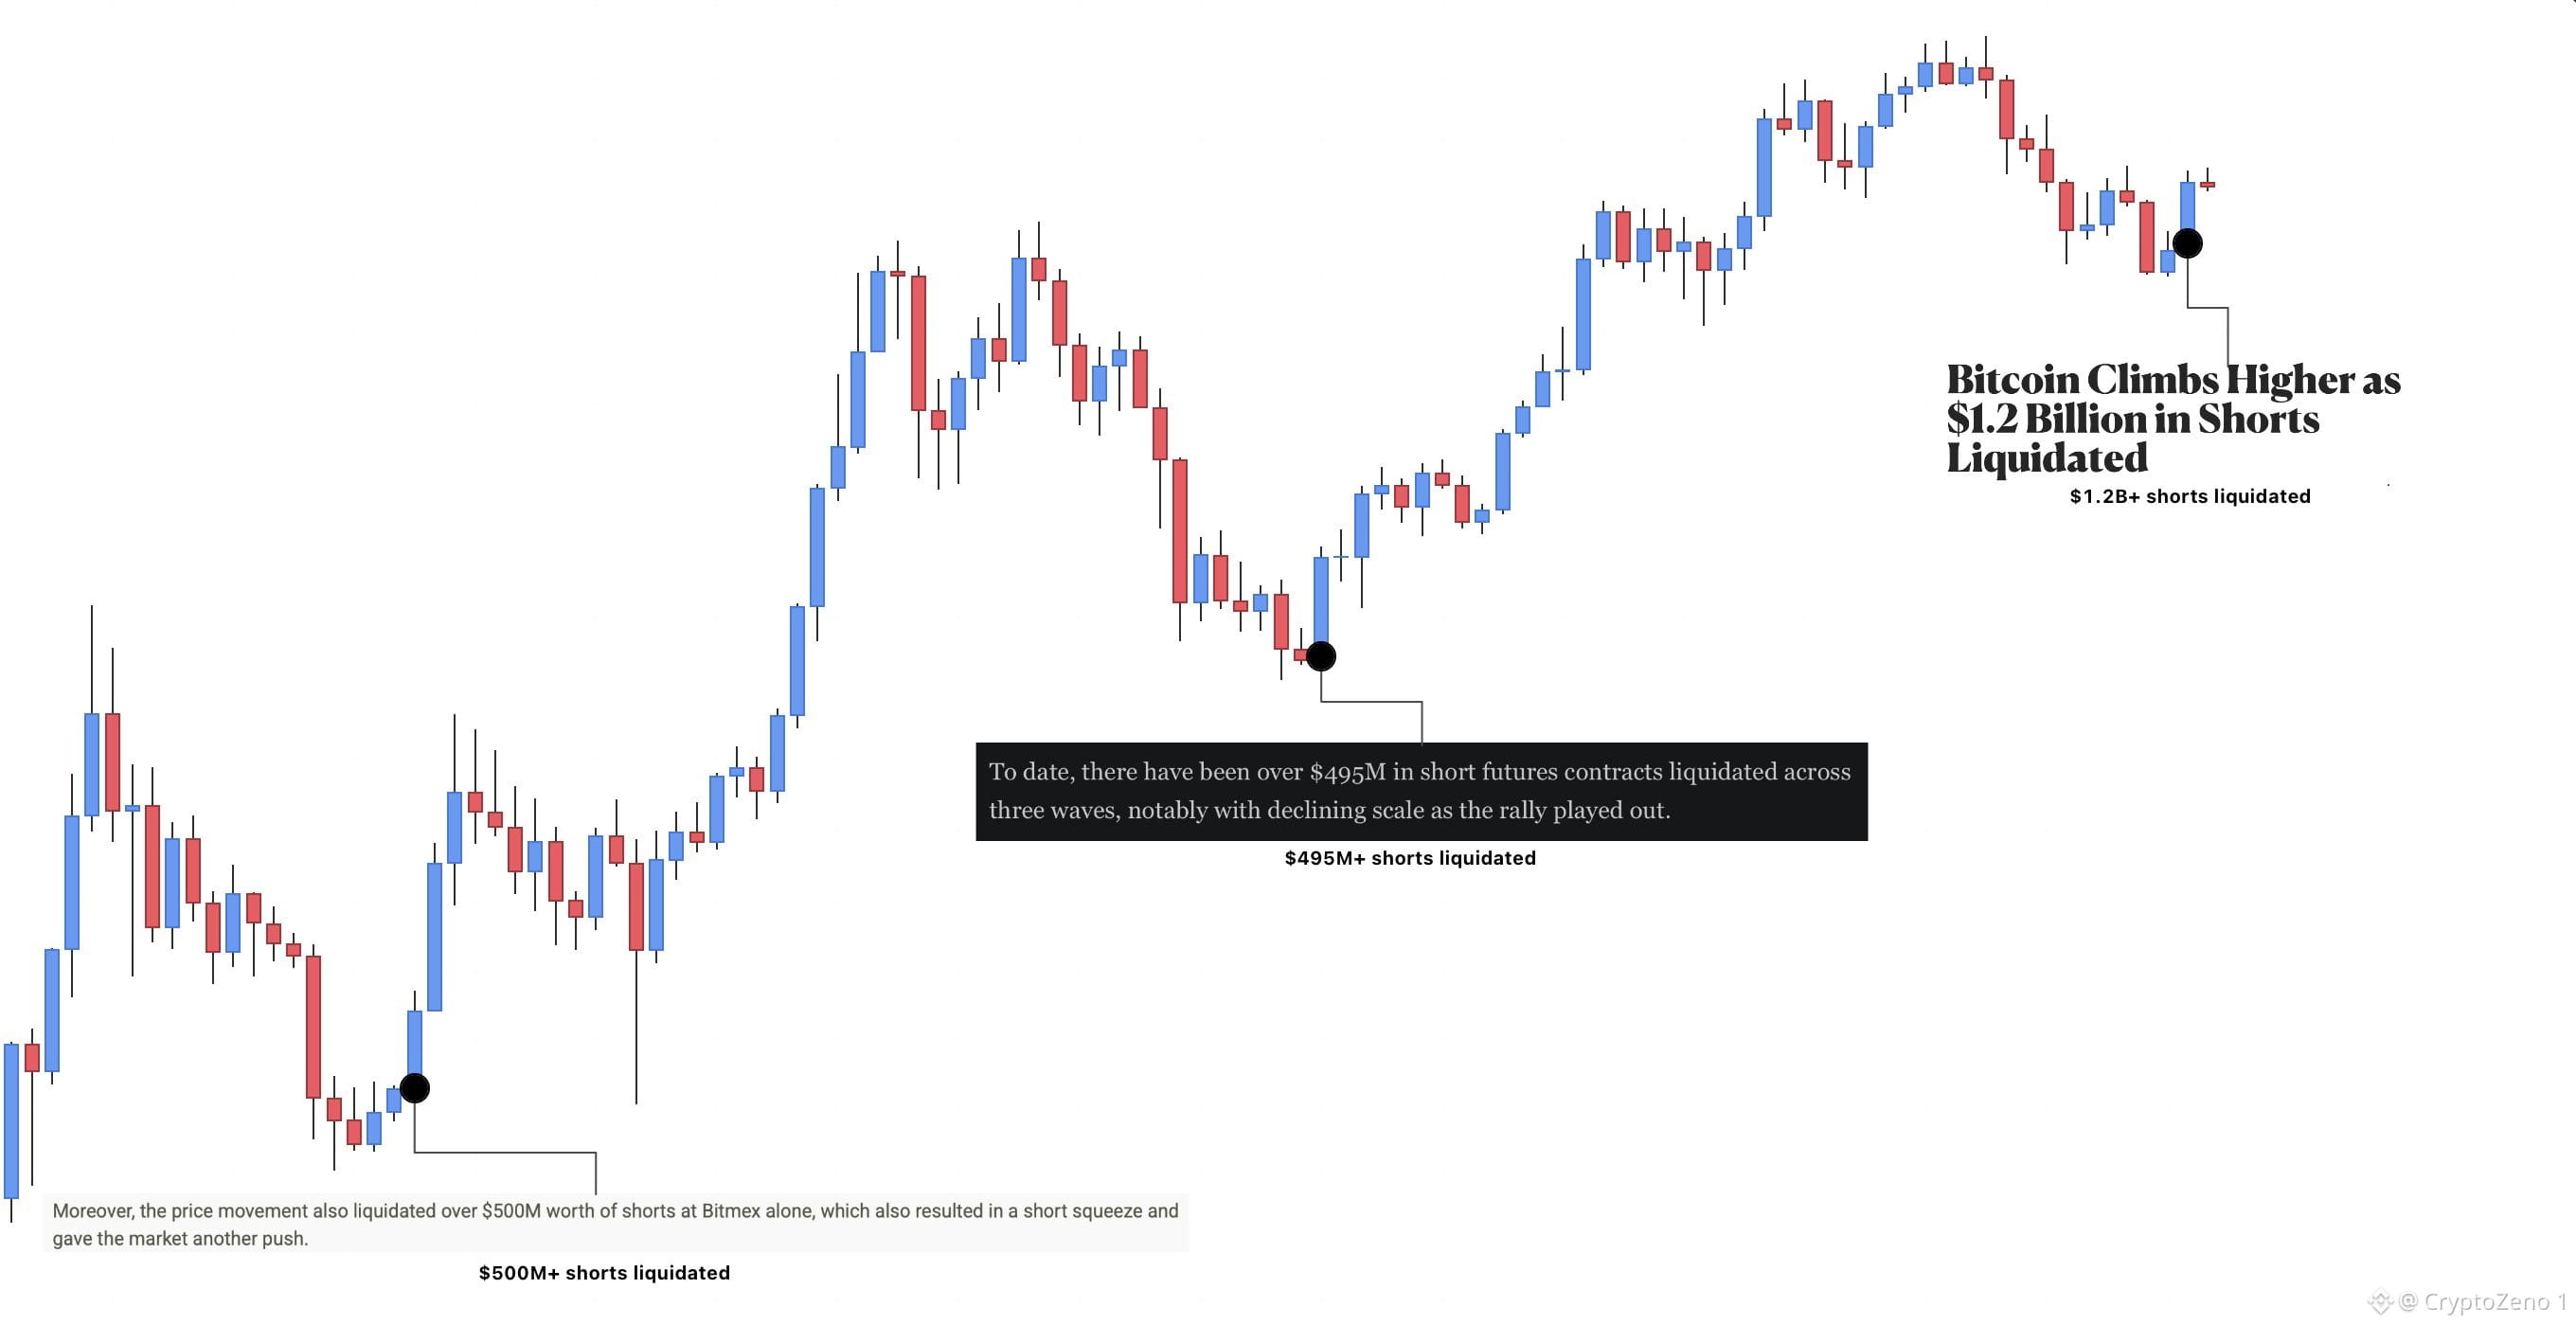
Bärenmarkt-Tiefs wurden immer durch ein großes Short-Liquidationsereignis bestätigt, das aus der Bodenbildungs-Range ausbricht.
Diese Moves werden selten von einem größeren Retracement gefolgt. Stattdessen bewegt sich der Kurs typischerweise seitwärts, bevor es wieder nach oben weitergeht.
Wettere gegen die Historie, wenn du willst. Neue Tiefs kommen nicht.
Es ist Zeit, nach Longs zu suchen. #BTC Preisanalyse# #Makro-Insights# #BNBChain#
$BTC Dieses Mal ist es nicht anders...
Bärenmarkt-Tiefs wurden immer durch ein großes Short-Liquidationsereignis bestätigt, das aus der Bodenbildungs-Range ausbricht.
Diese Moves werden selten von einem größeren Retracement gefolgt. Stattdessen bewegt sich der Kurs typischerweise seitwärts, bevor es wieder nach oben weitergeht.
Wettere gegen die Historie, wenn du willst. Neue Tiefs kommen nicht.
Es ist Zeit, nach Longs zu suchen. #BTC Preisanalyse# #Makro-Insights# #BNBChain#
Bärenmarkt-Tiefs wurden immer durch ein großes Short-Liquidationsereignis bestätigt, das aus der Bodenbildungs-Range ausbricht.
Diese Moves werden selten von einem größeren Retracement gefolgt. Stattdessen bewegt sich der Kurs typischerweise seitwärts, bevor es wieder nach oben weitergeht.
Wettere gegen die Historie, wenn du willst. Neue Tiefs kommen nicht.
Es ist Zeit, nach Longs zu suchen. #BTC Preisanalyse# #Makro-Insights# #BNBChain#
67
·
--
$BTC Die meisten machen noch immer den Fehler, auf das perfekte Re-Testen zu warten.
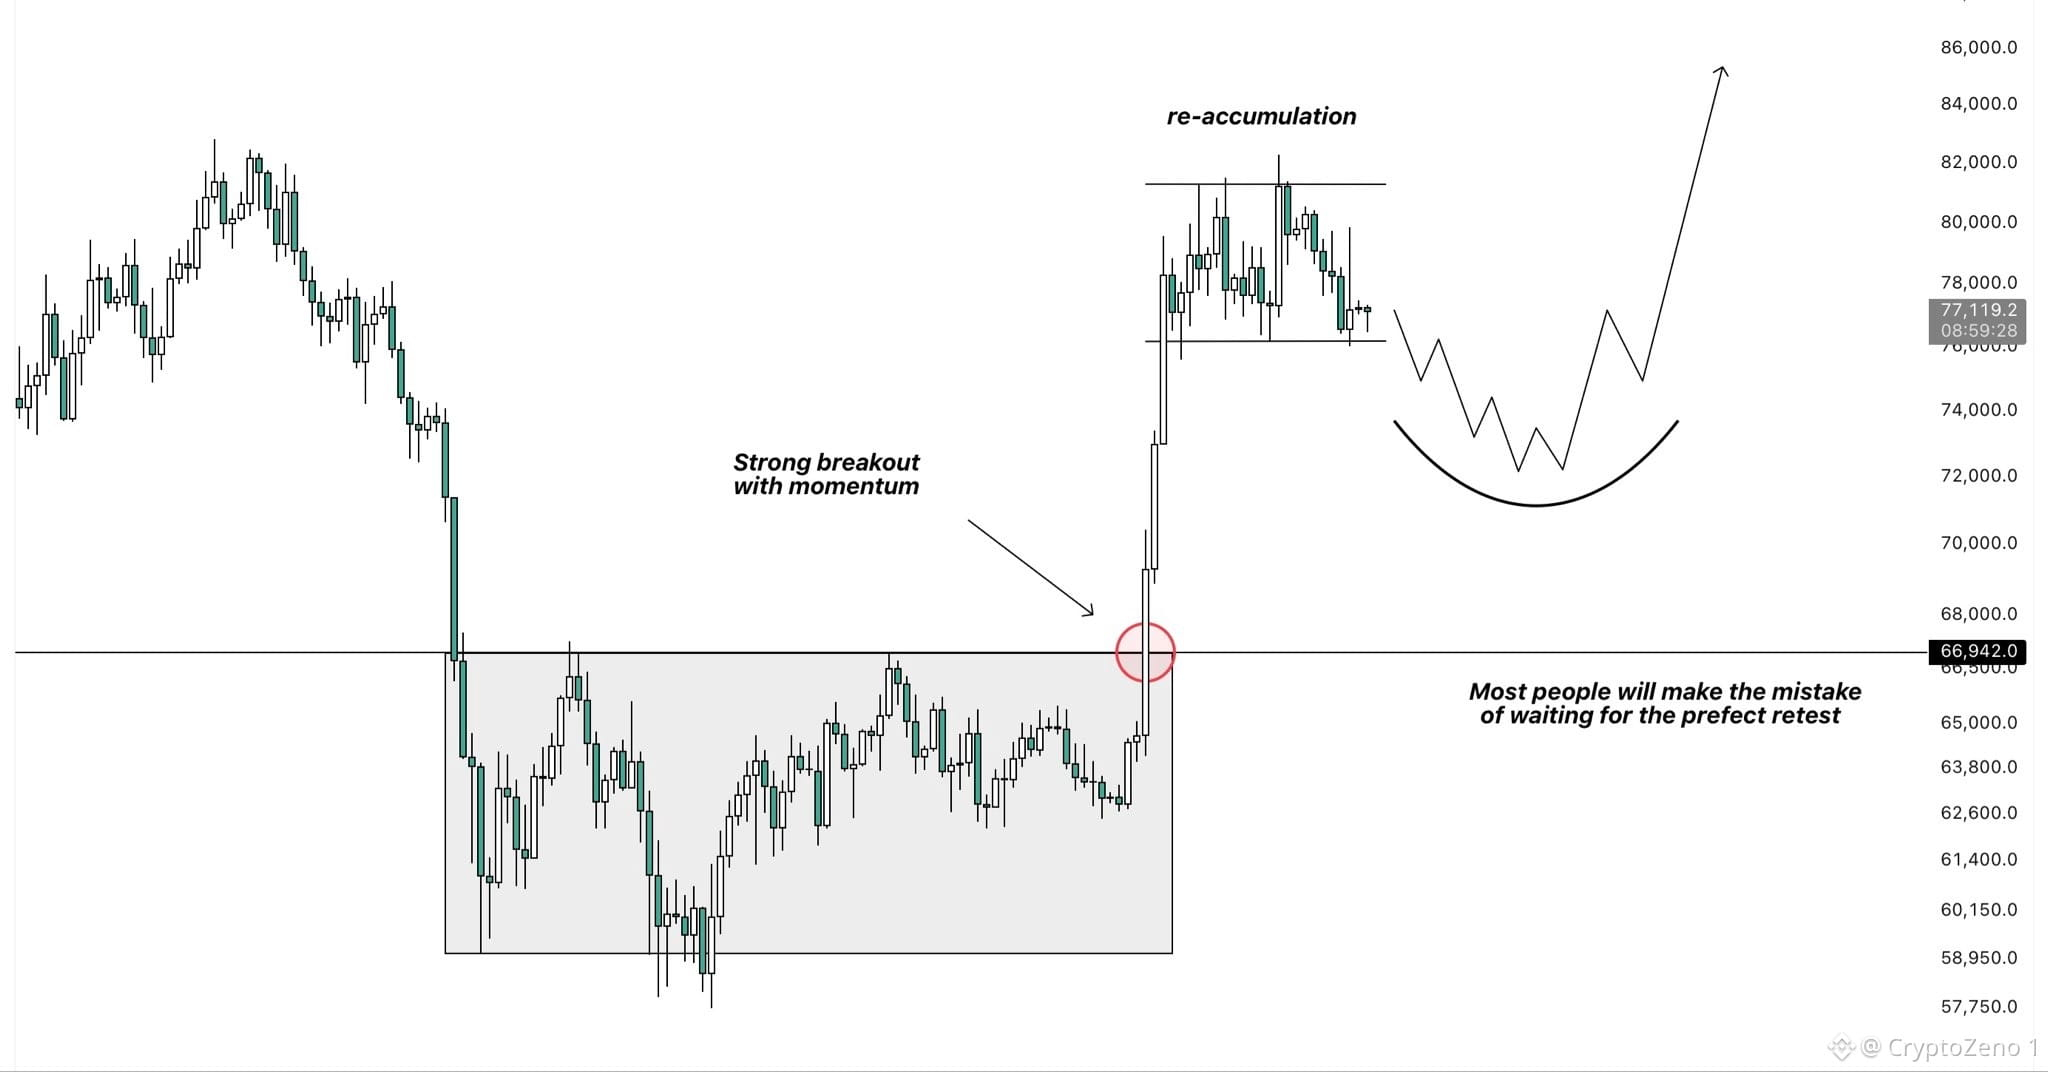
Nach dem explosiven Ausbruch über die Hochs der Bodenbildungs-Range ist der Kurs in eine Phase der erneuten Ansammlung eingetreten.
Bereits 2022 folgte BTC einem sehr ähnlichen Muster, das schließlich zu einer kleinen Manipulation unter die Range-Tiefs führte, bevor es zu dem nächsten größeren Anstieg nach oben kam.
Genau dafür bin ich aktuell positioniert. Anstatt auf den perfekten Re-Test der vorherigen Range-Hochs und einen Rücklauf in den Golden Pocket dieses Ausbruchs zu warten, beginne ich zu kaufen, sobald der Kurs in den Low-$70K-Bereich handelt.
Ich habe diesen Bereich in der Vergangenheit bereits mehrfach erwähnt, und er bleibt auch weiterhin mein wichtigster Bereich für weiteres Spot-Exposure.
Ich würde lieber damit beginnen, mich in diesem Bereich zu positionieren, statt das gesamte Move zu verpassen, während ich auf den perfekten Einstieg warte. #BTC Price Analysis# #Macro Insights# #BNBChain#
$BTC Die meisten machen noch immer den Fehler, auf das perfekte Re-Testen zu warten.
Nach dem explosiven Ausbruch über die Hochs der Bodenbildungs-Range ist der Kurs in eine Phase der erneuten Ansammlung eingetreten.
Bereits 2022 folgte BTC einem sehr ähnlichen Muster, das schließlich zu einer kleinen Manipulation unter die Range-Tiefs führte, bevor es zu dem nächsten größeren Anstieg nach oben kam.
Genau dafür bin ich aktuell positioniert. Anstatt auf den perfekten Re-Test der vorherigen Range-Hochs und einen Rücklauf in den Golden Pocket dieses Ausbruchs zu warten, beginne ich zu kaufen, sobald der Kurs in den Low-$70K-Bereich handelt.
Ich habe diesen Bereich in der Vergangenheit bereits mehrfach erwähnt, und er bleibt auch weiterhin mein wichtigster Bereich für weiteres Spot-Exposure.
Ich würde lieber damit beginnen, mich in diesem Bereich zu positionieren, statt das gesamte Move zu verpassen, während ich auf den perfekten Einstieg warte. #BTC Price Analysis# #Macro Insights# #BNBChain#
Nach dem explosiven Ausbruch über die Hochs der Bodenbildungs-Range ist der Kurs in eine Phase der erneuten Ansammlung eingetreten.
Bereits 2022 folgte BTC einem sehr ähnlichen Muster, das schließlich zu einer kleinen Manipulation unter die Range-Tiefs führte, bevor es zu dem nächsten größeren Anstieg nach oben kam.
Genau dafür bin ich aktuell positioniert. Anstatt auf den perfekten Re-Test der vorherigen Range-Hochs und einen Rücklauf in den Golden Pocket dieses Ausbruchs zu warten, beginne ich zu kaufen, sobald der Kurs in den Low-$70K-Bereich handelt.
Ich habe diesen Bereich in der Vergangenheit bereits mehrfach erwähnt, und er bleibt auch weiterhin mein wichtigster Bereich für weiteres Spot-Exposure.
Ich würde lieber damit beginnen, mich in diesem Bereich zu positionieren, statt das gesamte Move zu verpassen, während ich auf den perfekten Einstieg warte. #BTC Price Analysis# #Macro Insights# #BNBChain#
33
·
--
$BTC Aktualisierung des Akkumulationsplans:
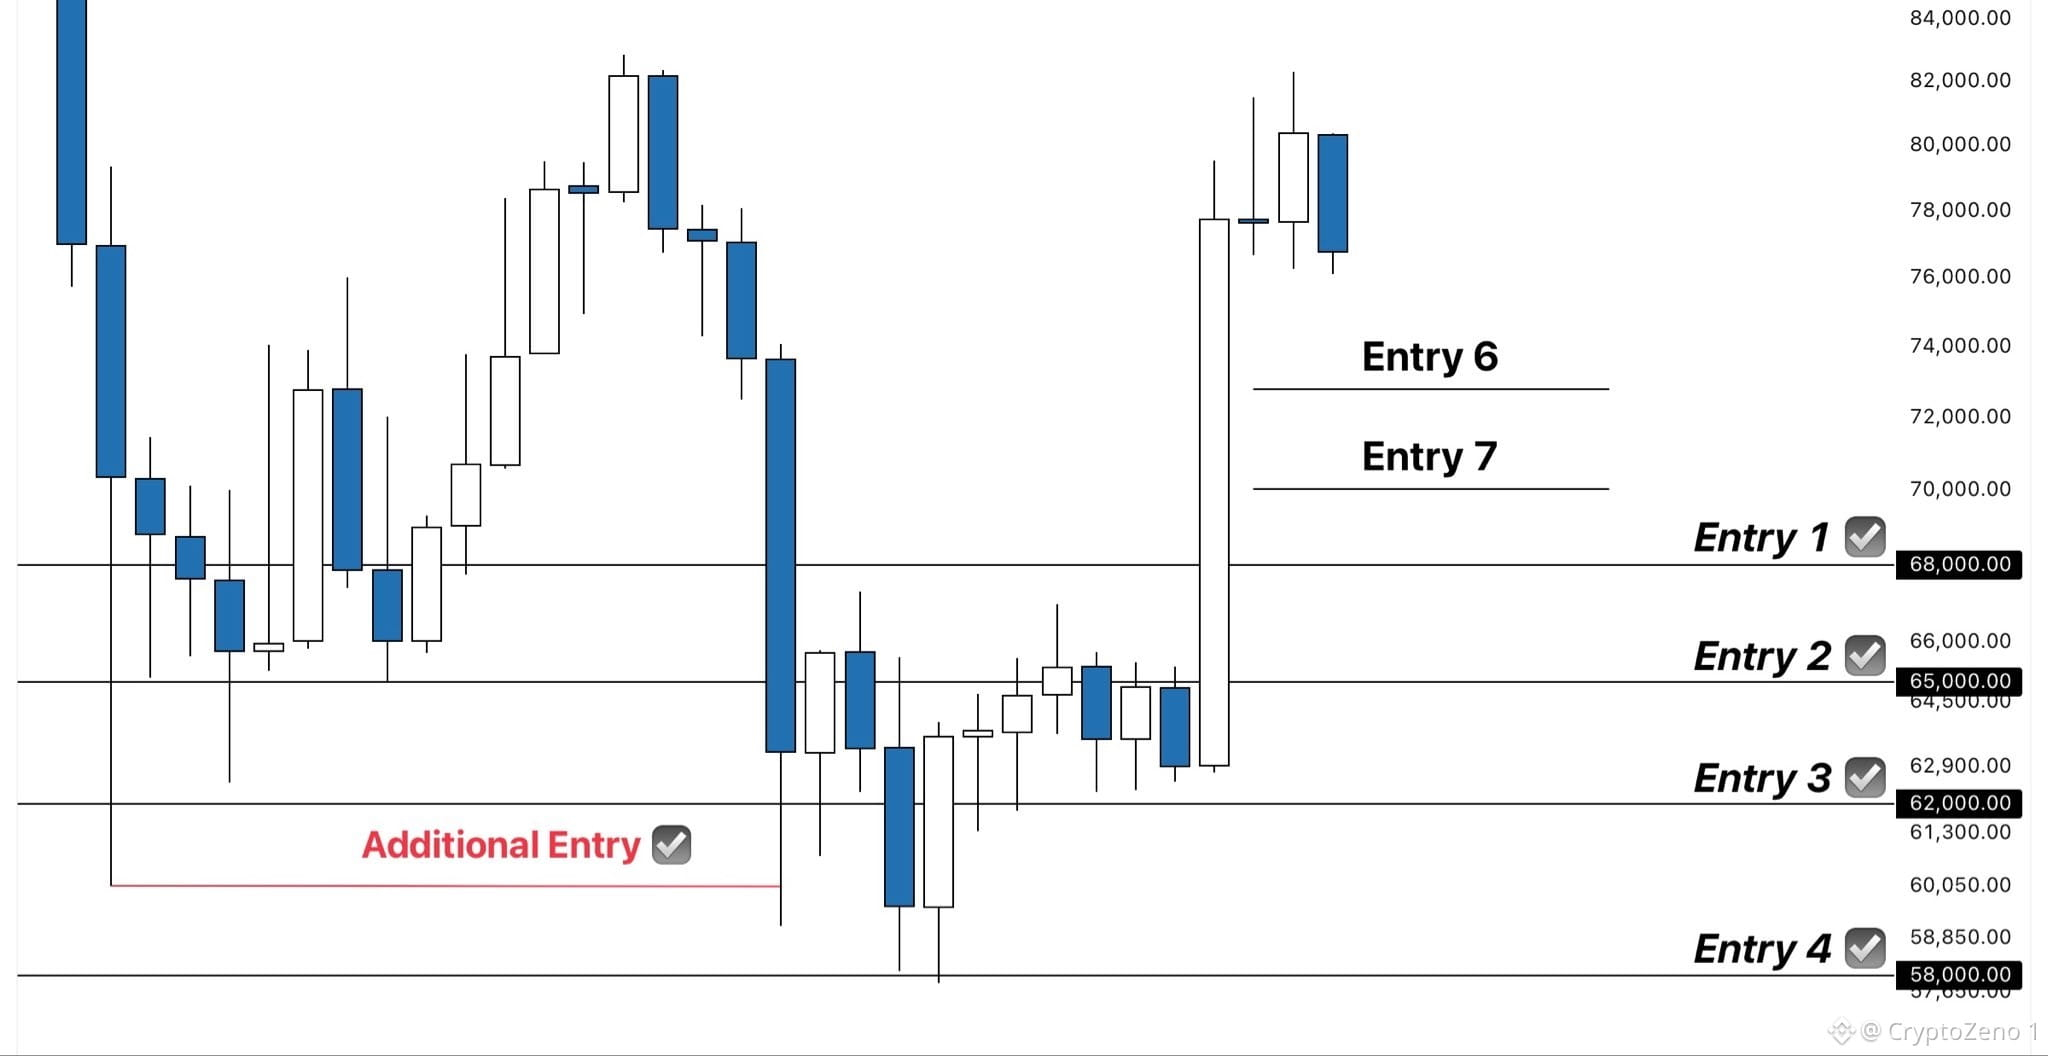
Bisher wurden vier meiner anfänglichen Einstiege sowie mein zusätzlicher Spot-Einstieg getroffen.
Da der Bärenmarkt langsam zu Ende geht und ein Großteil meines Kapitals bereits investiert ist, habe ich zwei weitere Limits gesetzt, falls wir von hier aus noch einmal einen Rücksetzer sehen.
Das erste liegt bei 72,8k und das zweite beim vorherigen ATH um 69k.
Die Zeit läuft langsam ab, wenn du akkumulieren möchtest. Also warte nicht auf tiefere Tiefs. #BTC Preisanalyse# #Makro-Einblicke#
$BTC Aktualisierung des Akkumulationsplans:
Bisher wurden vier meiner anfänglichen Einstiege sowie mein zusätzlicher Spot-Einstieg getroffen.
Da der Bärenmarkt langsam zu Ende geht und ein Großteil meines Kapitals bereits investiert ist, habe ich zwei weitere Limits gesetzt, falls wir von hier aus noch einmal einen Rücksetzer sehen.
Das erste liegt bei 72,8k und das zweite beim vorherigen ATH um 69k.
Die Zeit läuft langsam ab, wenn du akkumulieren möchtest. Also warte nicht auf tiefere Tiefs. #BTC Preisanalyse# #Makro-Einblicke#
Bisher wurden vier meiner anfänglichen Einstiege sowie mein zusätzlicher Spot-Einstieg getroffen.
Da der Bärenmarkt langsam zu Ende geht und ein Großteil meines Kapitals bereits investiert ist, habe ich zwei weitere Limits gesetzt, falls wir von hier aus noch einmal einen Rücksetzer sehen.
Das erste liegt bei 72,8k und das zweite beim vorherigen ATH um 69k.
Die Zeit läuft langsam ab, wenn du akkumulieren möchtest. Also warte nicht auf tiefere Tiefs. #BTC Preisanalyse# #Makro-Einblicke#
58
Anmelden und weiter Inhalte entdecken
Krypto-Nutzer weltweit auf Binance Square kennenlernen
⚡️ Bleib in Sachen Krypto stets am Puls.
💬 Die weltgrößte Kryptobörse vertraut darauf.
👍 Erhalte verlässliche Einblicke von verifizierten Creators.
E-Mail-Adresse/Telefonnummer
Trendthemen
AIStocksWhatNext
1.1M Aufrufe
7,189 Kommentare
Teile & gewinne Traffic-Rewards in unserer angesagten Hashtag-Kampagne
✨Thema: Welche anderen Investitionsmöglichkeiten gibt es noch, während KI-Aktien weiter steigen?
👉So machst du mit:
Veröffentliche einen kurzen Beitrag oder Artikel mit dem Hashtag #AIStocksWhatNext
Teile, ob du bullisch oder bärisch bist, und poste deine KI-Aktienbestände oder Trades – die Nutzung des Trade-Widgets kann deine Berechtigung verbessern.
Du kannst deinen Beitrag auch stärken, indem du Daten oder Diagramme teilst und KI-generierte Bilder vermeidest.
✍️Erstelle Inhalte basierend auf den folgenden Blickwinkeln:
- Nvidia sagt, dass sich der Chip-Umsatz im nächsten Jahr verdoppeln wird, und die führenden KI-Unternehmen erreichen weiterhin Rekordumsätze – der Rechenaufwand dahinter ist ebenso beeindruckend. Verläuft die Nachfrage nach KI wirklich gerade erst so richtig, oder geht es nur noch eine Weile weiter? KI-Aktien steigen derzeit branchenweit. Ist das ein echter Ausbruch oder nur ein kurzfristiger Rückprall?
- Branchenführer fordern dazu auf, die Entwicklung von KI zu verlangsamen, während Trump plant, eine „AI Force“ aufzubauen, und behauptet, KI könne in der Zukunft 25% des US-BIP ausmachen. Auf welcher Seite stehst du? Wird staatliche Unterstützung ein langfristiger Gewinn für KI-Aktien sein?
- Kaufst du KI-Aktien? Teile deinen KI-bezogenen Trade/deine Bestände mit unserem Trade-Sharing-Widget.
⏰Kampagnenzeitraum:
- 2026-09-22 7:00 - 2026-09-24 4:00 UTC
🎁Belohnung:
- Qualifizierte Beiträge, die die oben genannten Richtlinien einhalten und mehr als 100 Wörter enthalten, werden überprüft und können möglicherweise einen zufälligen Traffic-Boost von 500 bis 3.000 Views erhalten. Du erhältst eine Benachrichtigung von deiner Feed-Sekretärin, wenn dein Beitrag ausgewählt wurde.
- Erhalte die Chance, dass dein Artikel auf Binance Square Official vorgestellt wird
Brauchst du Ideen für deinen Beitrag? Besuche die Thema-Seite #AIStocksWhatNext oder die Square Guide on How to Post for Better Reach.
Binance Square Official
·620 Likes
·1.8M Aufrufe
SpotBitcoinETFsInflow$2.31BInFourDays
0 Aufrufe
0 Kommentare
BitcoinRejectedAt$87,300Twice
0 Aufrufe
0 Kommentare