$DOT: Interpreting the daily Move
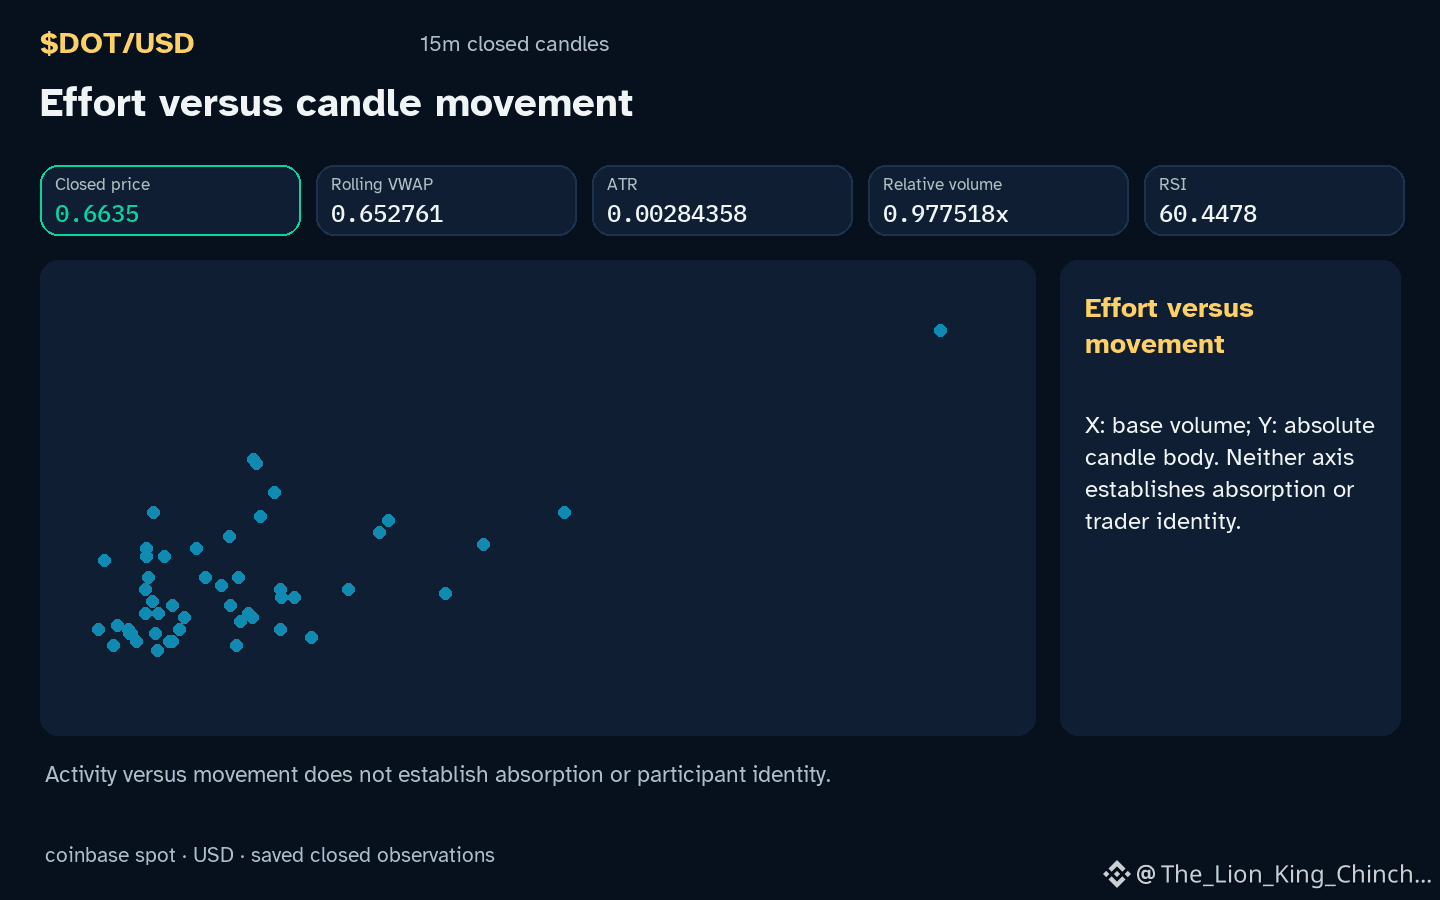
Why does $DOT show a daily change while staying inside its recorded range? The observation notes an up hourly direction, volume not above baseline, and a daily change 1.09706%.
One possible clue is that a modest daily gain could simply reflect a short‑term bias that does not breach the local support 0.655 or resistance 0.6661. In this scenario the price may be drifting upward because the recent candle pattern aligns with a slight momentum indicated by RSI 60.4 near the middle of its scale. The relative volume 0.98x baseline suggests that trading activity is typical, so the move might be a natural continuation rather than a breakout.
An alternative reading is that the same daily percentage could be a statistical fluctuation within a range‑bound market. If the underlying volatility measured by ATR 0.00284358 remains low, the observed change may not carry predictive weight. In this case the up direction could reverse as soon as a new candle forms with volume above baseline, weakening the momentum clue.
Both interpretations are limited by the fact that only a single closed‑candle window is available. Future evidence that would weaken the first reading includes a daily change that narrows to zero or turns negative while volume spikes above baseline. Conversely, a sudden drop in RSI 60.4 or a rise in ATR 0.00284358 would challenge the second reading and suggest that the current move lacks resilience.
Probabilistic market research, not a recommendation or guaranteed return.
#DOT #MarketAnalysis #CryptoLearning
Why does $DOT show a daily change while staying inside its recorded range? The observation notes an up hourly direction, volume not above baseline, and a daily change 1.09706%.
One possible clue is that a modest daily gain could simply reflect a short‑term bias that does not breach the local support 0.655 or resistance 0.6661. In this scenario the price may be drifting upward because the recent candle pattern aligns with a slight momentum indicated by RSI 60.4 near the middle of its scale. The relative volume 0.98x baseline suggests that trading activity is typical, so the move might be a natural continuation rather than a breakout.
An alternative reading is that the same daily percentage could be a statistical fluctuation within a range‑bound market. If the underlying volatility measured by ATR 0.00284358 remains low, the observed change may not carry predictive weight. In this case the up direction could reverse as soon as a new candle forms with volume above baseline, weakening the momentum clue.
Both interpretations are limited by the fact that only a single closed‑candle window is available. Future evidence that would weaken the first reading includes a daily change that narrows to zero or turns negative while volume spikes above baseline. Conversely, a sudden drop in RSI 60.4 or a rise in ATR 0.00284358 would challenge the second reading and suggest that the current move lacks resilience.
Probabilistic market research, not a recommendation or guaranteed return.
#DOT #MarketAnalysis #CryptoLearning