🚨 WALL STREET FACES A CRITICAL MONDAY. HISTORY SAYS THE NEXT MOVE COULD GO EITHER WAY.
The global AI selloff has wiped out more than $9 TRILLION from world stocks since August.
The S&P 500 has lost $6 TRILLION in market value in just 5 trading days.
Now all eyes are on Monday's opening bell.
But here's what history tells us:
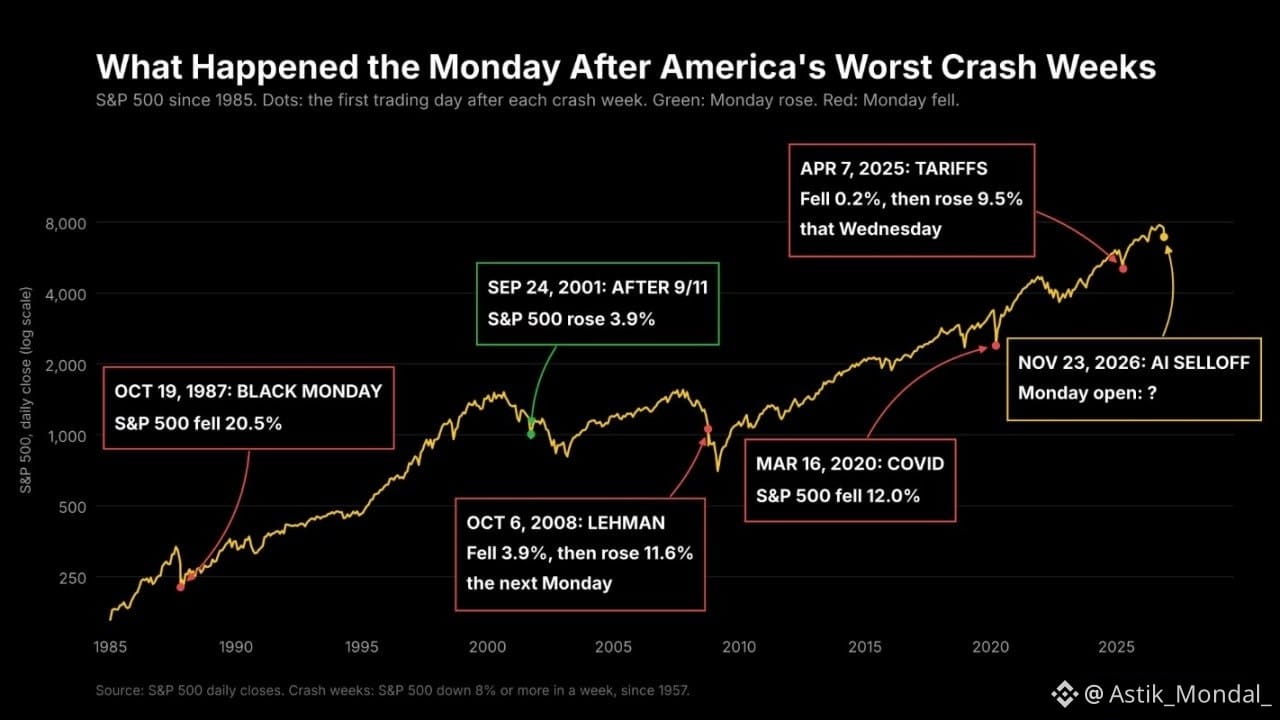
After some of America's worst crash weeks, the following Monday delivered completely different outcomes.
📉 October 1987 (Black Monday): S&P 500 plunged 20.5%.
🟢 September 2001 (After 9/11): S&P 500 rebounded 3.9%.
📉 October 2008 (Lehman Crisis): Fell 3.9%, then surged 11.6% the following Monday.
📉 March 2020 (COVID Crash): S&P 500 dropped 12.0%.
⚡ April 2025 (Tariff Shock): Fell just 0.2%, then rallied 9.5% that Wednesday.
But there's an even more interesting historical pattern.
Since 1957, the S&P 500 experienced 12 other weeks with similarly severe declines.
The following Monday?
6 times UP. 6 times DOWN.
However, one month later, the market was higher in 8 out of those 12 cases.
Here's where markets stand heading into Monday:
🔻 S&P 500: -8.6%
🔻 Nasdaq 100: -10.4%
🔻 Semiconductor stocks: -17.1%
🟢 Bitcoin: Back above $60,000.
The key question isn't whether markets will bounce. It's whether the AI selloff has finally found buyers or whether another wave of forced selling is coming.
Monday's opening could set the tone for the entire week.
Watch liquidity, institutional positioning, semiconductor stocks, and Bitcoin closely.
History doesn't guarantee a recovery. But it shows why panic and opportunity can exist at the same time.
#StockMarket #SP500 #Nasdaq #Bitcoin #AI
The global AI selloff has wiped out more than $9 TRILLION from world stocks since August.
The S&P 500 has lost $6 TRILLION in market value in just 5 trading days.
Now all eyes are on Monday's opening bell.
But here's what history tells us:
After some of America's worst crash weeks, the following Monday delivered completely different outcomes.
📉 October 1987 (Black Monday): S&P 500 plunged 20.5%.
🟢 September 2001 (After 9/11): S&P 500 rebounded 3.9%.
📉 October 2008 (Lehman Crisis): Fell 3.9%, then surged 11.6% the following Monday.
📉 March 2020 (COVID Crash): S&P 500 dropped 12.0%.
⚡ April 2025 (Tariff Shock): Fell just 0.2%, then rallied 9.5% that Wednesday.
But there's an even more interesting historical pattern.
Since 1957, the S&P 500 experienced 12 other weeks with similarly severe declines.
The following Monday?
6 times UP. 6 times DOWN.
However, one month later, the market was higher in 8 out of those 12 cases.
Here's where markets stand heading into Monday:
🔻 S&P 500: -8.6%
🔻 Nasdaq 100: -10.4%
🔻 Semiconductor stocks: -17.1%
🟢 Bitcoin: Back above $60,000.
The key question isn't whether markets will bounce. It's whether the AI selloff has finally found buyers or whether another wave of forced selling is coming.
Monday's opening could set the tone for the entire week.
Watch liquidity, institutional positioning, semiconductor stocks, and Bitcoin closely.
History doesn't guarantee a recovery. But it shows why panic and opportunity can exist at the same time.
#StockMarket #SP500 #Nasdaq #Bitcoin #AI