
🚨 $EVAA CRASHES 44% IN ONE 4H CANDLE — IS ANOTHER MAJOR DUMP COMING? 📉
Remember when we discussed EVAA's massive bullish rally? Well, things have changed dramatically, and the latest 4-hour chart is showing something seriously concerning!
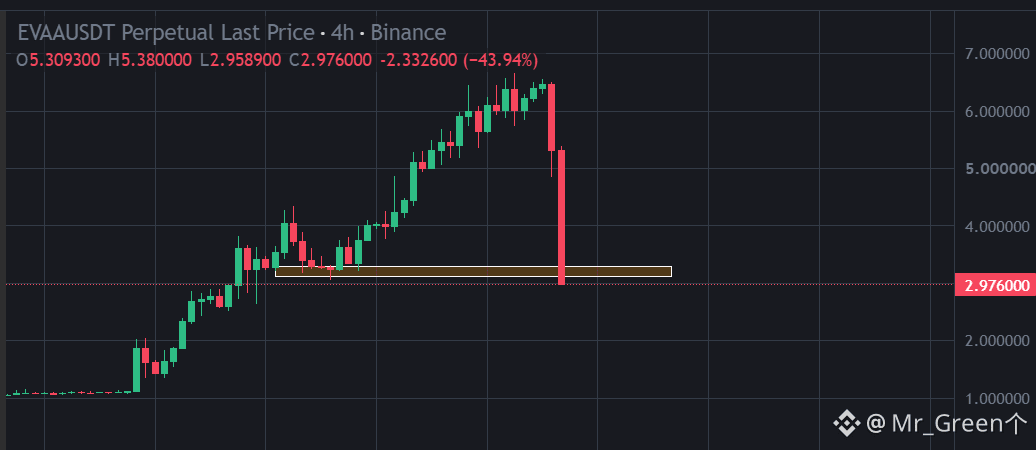
EVAA recently experienced an explosive rally from around $1.00 to approximately $6.60. However, after reaching those highs, the market suddenly reversed, and sellers took complete control. The latest 4H candle shows an incredible 43.94% decline, with price collapsing from $5.31 to around $2.98!
But here's what concerns me even more. 👀
The $3.15–$3.30 region was previously an important consolidation and support zone. Buyers defended this area before the major rally toward $6.60. Now, EVAA has fallen below that same level, suggesting that the previous bullish structure is under serious pressure.
📉 WHAT COULD HAPPEN NEXT?
If the 4-hour candle closes below $3.15 and buyers fail to reclaim the $3.15–$3.30 region, I believe another bearish move becomes increasingly possible.
My first downside area to watch is $2.50–$2.70. If selling pressure continues, the next potential demand region could be around $2.00–$2.20, where price previously accelerated during its bullish expansion.
However, after such an aggressive decline, a temporary relief bounce is also possible. A recovery toward $3.15–$3.30 followed by bearish rejection could offer stronger confirmation of continued selling pressure.
⚠️ MY TAKE:
I'm bearish on EVAA's immediate structure, but I wouldn't blindly chase a short after a nearly 44% candle. Sharp crashes can produce equally aggressive short-term rebounds.
What I'm watching is simple: can buyers reclaim $3.30, or will the previous support turn into resistance?
If sellers successfully defend that zone, I think EVAA could experience another downward leg.
Remember, a big crash doesn't automatically mean the bottom is in!
What do you think, buddies? 👀 Will $EVAA recover above $3.30, or are we heading toward $2.50 and possibly $2.00?
Let the charts do the talking! 🎯
Remember when we discussed EVAA's massive bullish rally? Well, things have changed dramatically, and the latest 4-hour chart is showing something seriously concerning!
EVAA recently experienced an explosive rally from around $1.00 to approximately $6.60. However, after reaching those highs, the market suddenly reversed, and sellers took complete control. The latest 4H candle shows an incredible 43.94% decline, with price collapsing from $5.31 to around $2.98!
But here's what concerns me even more. 👀
The $3.15–$3.30 region was previously an important consolidation and support zone. Buyers defended this area before the major rally toward $6.60. Now, EVAA has fallen below that same level, suggesting that the previous bullish structure is under serious pressure.
📉 WHAT COULD HAPPEN NEXT?
If the 4-hour candle closes below $3.15 and buyers fail to reclaim the $3.15–$3.30 region, I believe another bearish move becomes increasingly possible.
My first downside area to watch is $2.50–$2.70. If selling pressure continues, the next potential demand region could be around $2.00–$2.20, where price previously accelerated during its bullish expansion.
However, after such an aggressive decline, a temporary relief bounce is also possible. A recovery toward $3.15–$3.30 followed by bearish rejection could offer stronger confirmation of continued selling pressure.
⚠️ MY TAKE:
I'm bearish on EVAA's immediate structure, but I wouldn't blindly chase a short after a nearly 44% candle. Sharp crashes can produce equally aggressive short-term rebounds.
What I'm watching is simple: can buyers reclaim $3.30, or will the previous support turn into resistance?
If sellers successfully defend that zone, I think EVAA could experience another downward leg.
Remember, a big crash doesn't automatically mean the bottom is in!
What do you think, buddies? 👀 Will $EVAA recover above $3.30, or are we heading toward $2.50 and possibly $2.00?
Let the charts do the talking! 🎯