$ORCA: Macro Liquidity vs. Micro Bursts: What Does Relative Volume Really Tell Us?
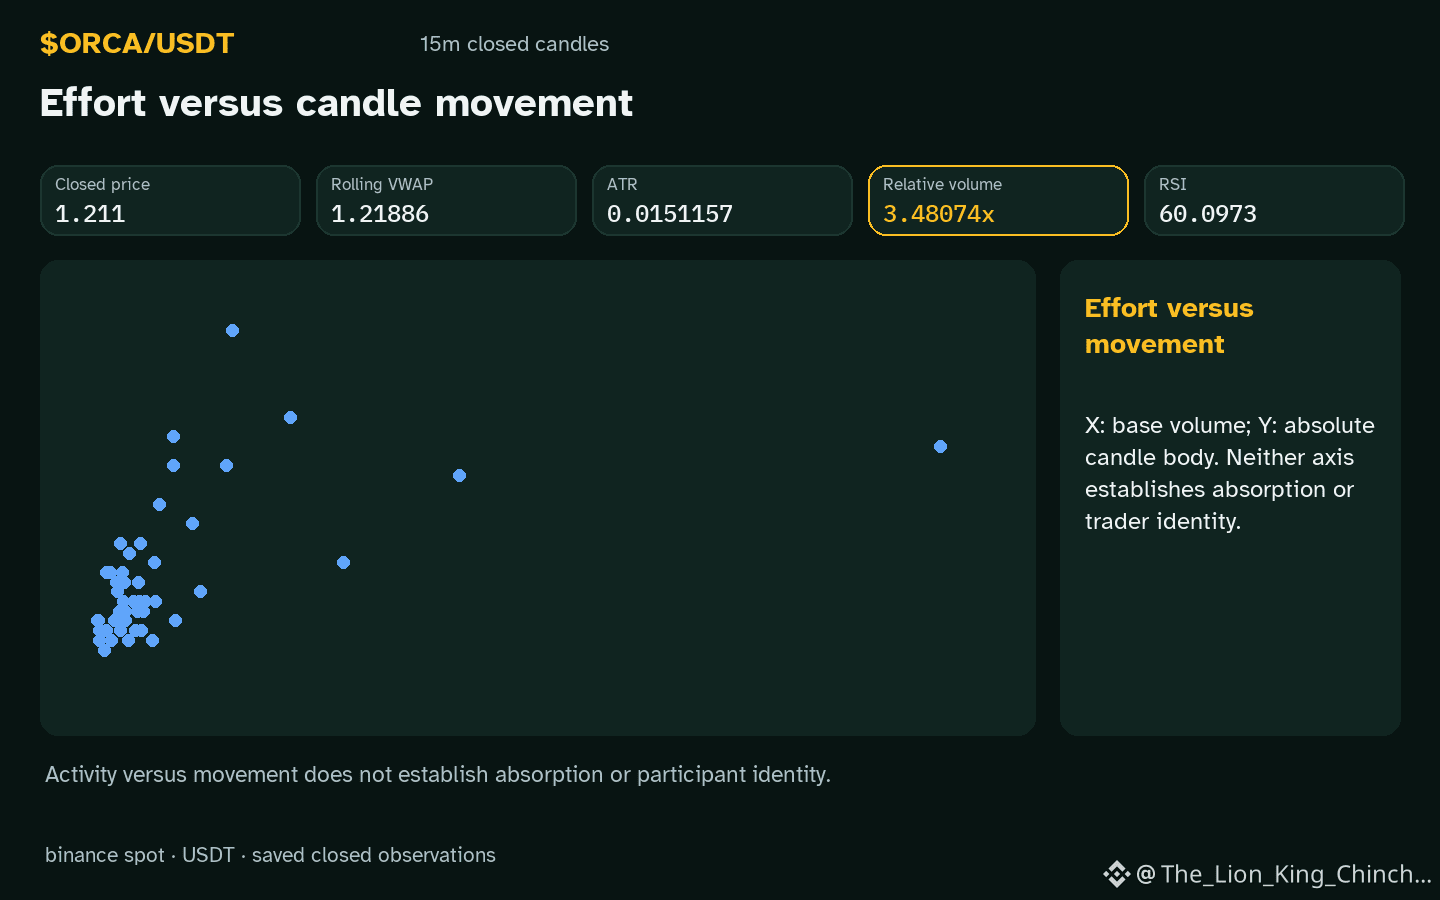
$ORCA: The question is whether a spike in relative volume simply reflects macro liquidity or a micro‑participation burst.
Observation: The hourly direction is up and the relative volume is 3.48x baseline.
Clue: Relative volume measures how many bars are packed into a fixed time period compared to the preceding window. A high ratio can mean either sustained buying across the market or a short, intense push.
Interpretation A: Macro liquidity. If many traders trade at similar times, the market fills quickly, generating many small ticks and a higher volume ratio. Evidence would be a steady price rise over several hours.
Interpretation B: Micro burst. A sudden, concentrated block of orders can produce a handful of high‑volume bars in a short span, raising the ratio but leaving the price largely unchanged or even pulling it back.
Weakening signals:
• If the hourly price change is 2.19409% but the daily change is 13.6023%, a macro‑driven move would likely show alignment across both horizons.
• If the price remains inside the recorded range 1.174–1.221 without a clear directional trend, a micro burst is more plausible.
Reassess by watching the next two hourly bars. A sustained upward trend would support Interpretation A; a rapid reversal or consolidation would favor Interpretation B. This conditional test keeps the analysis objective and grounded in the supplied observation.
Probabilistic market research, not a recommendation or guaranteed return.
A clean close or a retest: which would add evidence?
#ORCA #MarketAnalysis #CryptoLearning
$ORCA: The question is whether a spike in relative volume simply reflects macro liquidity or a micro‑participation burst.
Observation: The hourly direction is up and the relative volume is 3.48x baseline.
Clue: Relative volume measures how many bars are packed into a fixed time period compared to the preceding window. A high ratio can mean either sustained buying across the market or a short, intense push.
Interpretation A: Macro liquidity. If many traders trade at similar times, the market fills quickly, generating many small ticks and a higher volume ratio. Evidence would be a steady price rise over several hours.
Interpretation B: Micro burst. A sudden, concentrated block of orders can produce a handful of high‑volume bars in a short span, raising the ratio but leaving the price largely unchanged or even pulling it back.
Weakening signals:
• If the hourly price change is 2.19409% but the daily change is 13.6023%, a macro‑driven move would likely show alignment across both horizons.
• If the price remains inside the recorded range 1.174–1.221 without a clear directional trend, a micro burst is more plausible.
Reassess by watching the next two hourly bars. A sustained upward trend would support Interpretation A; a rapid reversal or consolidation would favor Interpretation B. This conditional test keeps the analysis objective and grounded in the supplied observation.
Probabilistic market research, not a recommendation or guaranteed return.
A clean close or a retest: which would add evidence?
#ORCA #MarketAnalysis #CryptoLearning