



Market Phases and Trend Structure
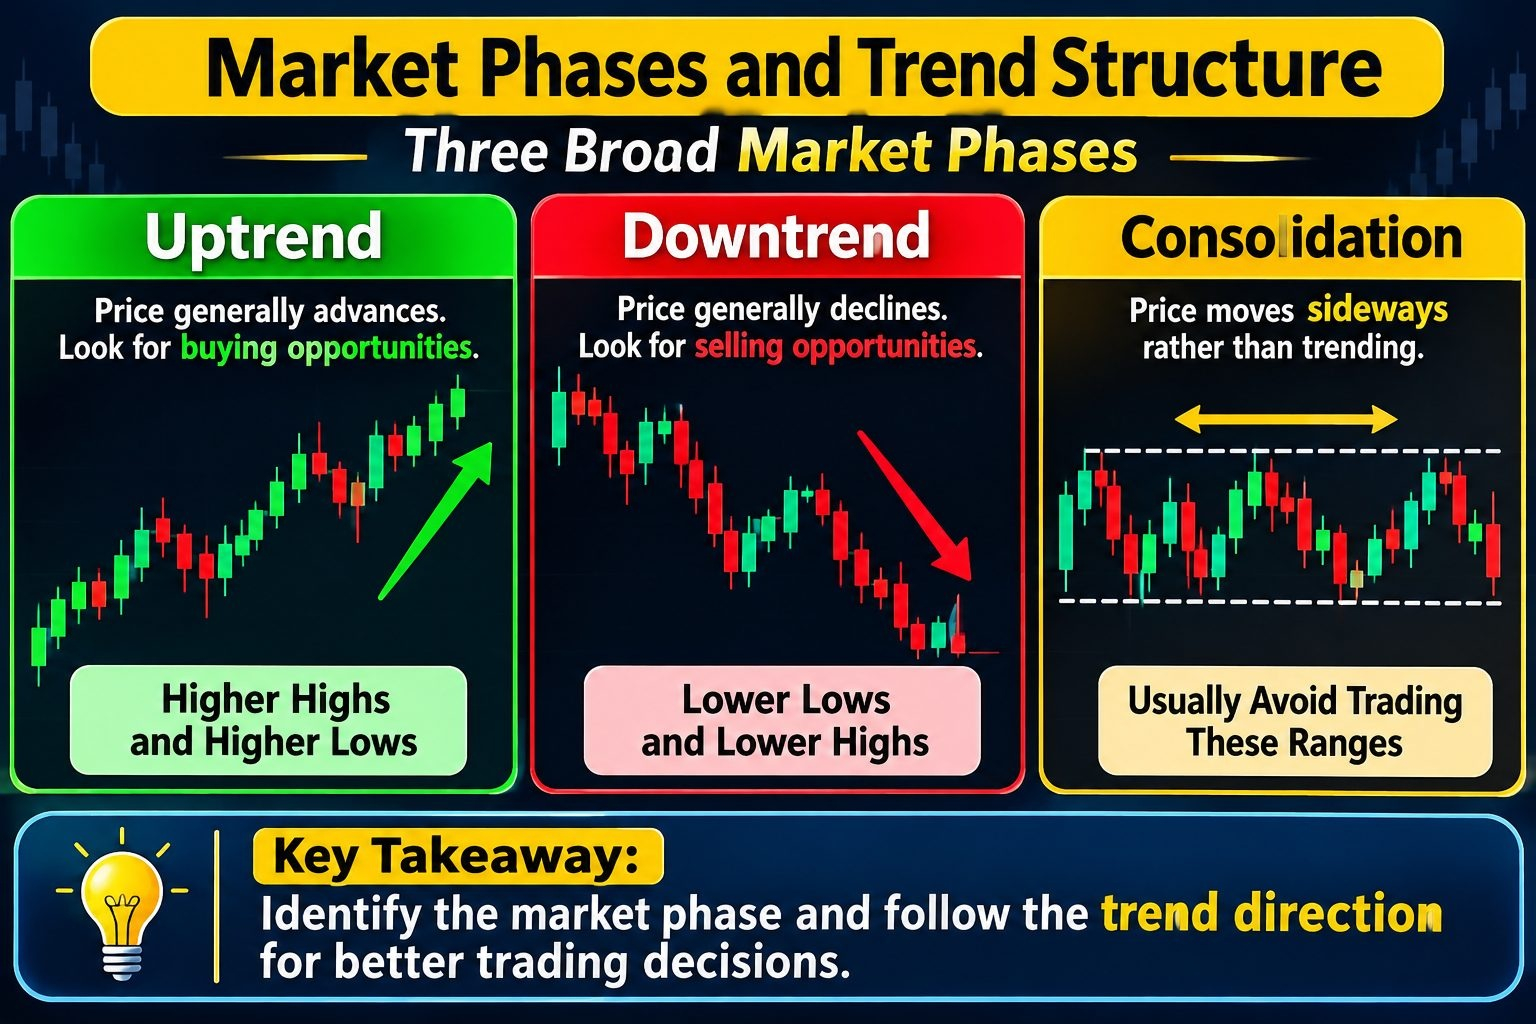
Three broad market phases
The source distinguishes three phases:
Uptrend: price generally advances. The directional bias described is to look for buying opportunities.
Downtrend: price generally declines. The directional bias is to look for selling opportunities.
Consolidation: price moves sideways rather than progressing clearly in either direction. The approach presented generally avoids trading these ranges and focuses on identifiable trends.
Reading highs and lows
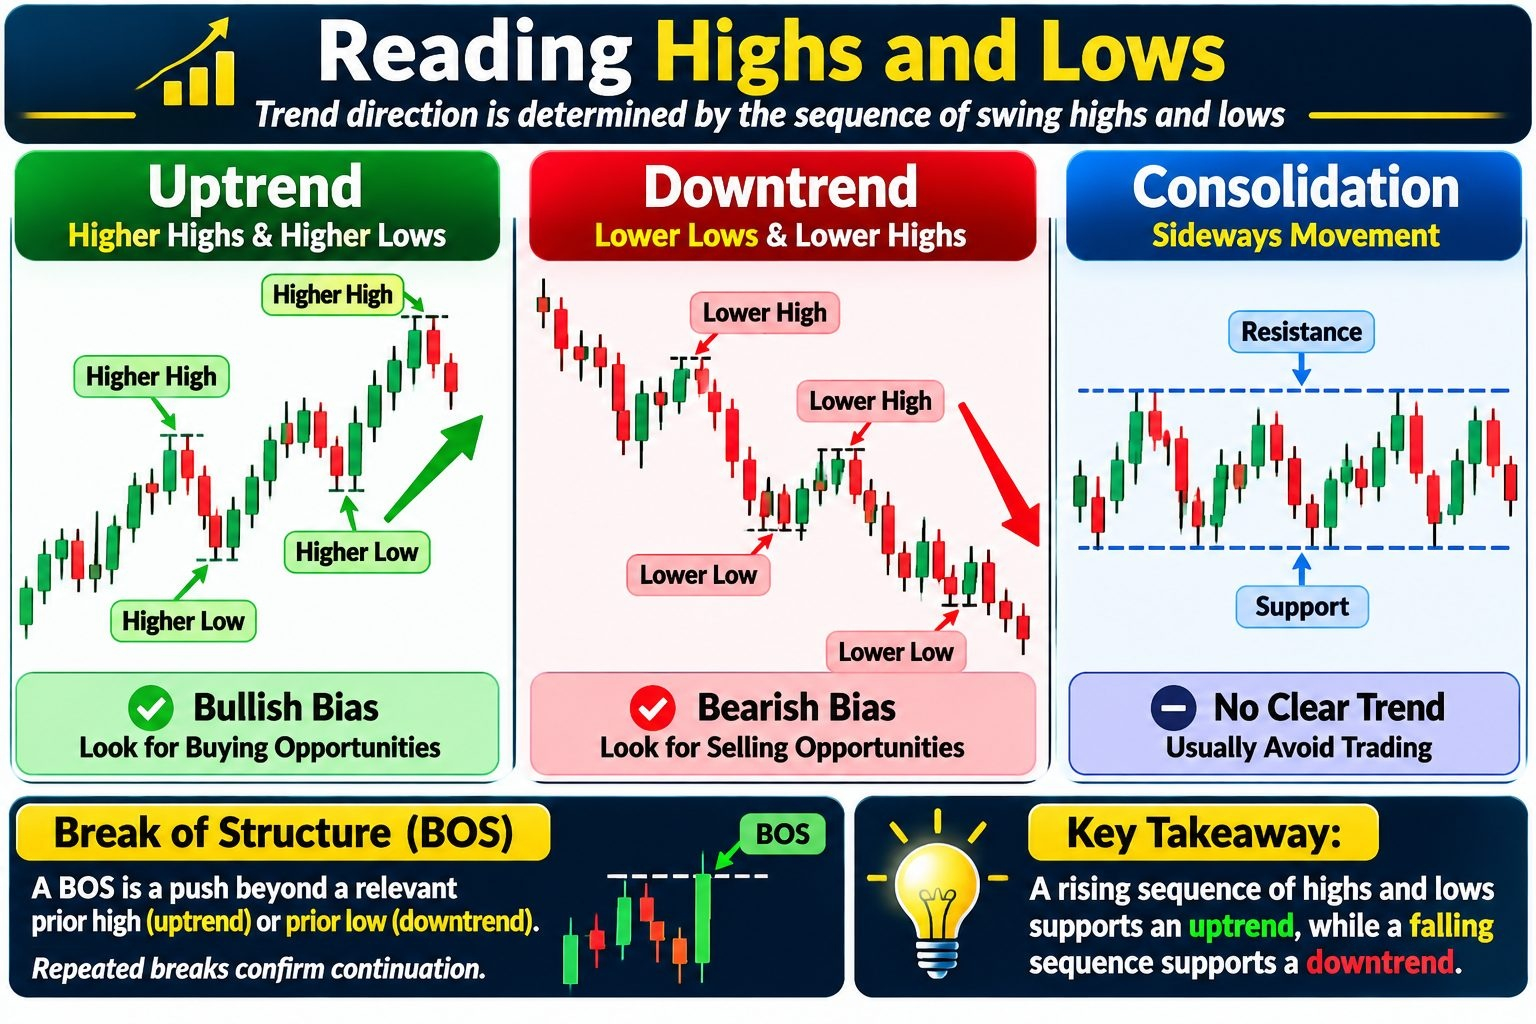
Trend direction is determined by the sequence of swing highs and lows, not simply by the latest candle:
Structure
Typical sequence
Directional interpretation
Uptrend
Higher highs and higher lows
Bullish
Downtrend
Lower lows and lower highs
Bearish
Consolidation
Sideways, overlapping movement
No clear trend direction
A break of structure (BOS), as used in the lesson, is a push beyond a relevant prior high in an uptrend or prior low in a downtrend. Repeated breaks in the trend direction provide evidence of continuation.
Key idea
The trend interpretation depends on the relationship between successive swing points: a rising sequence of highs and lows supports an uptrend; a falling sequence supports a downtrend.
Impulses and corrections
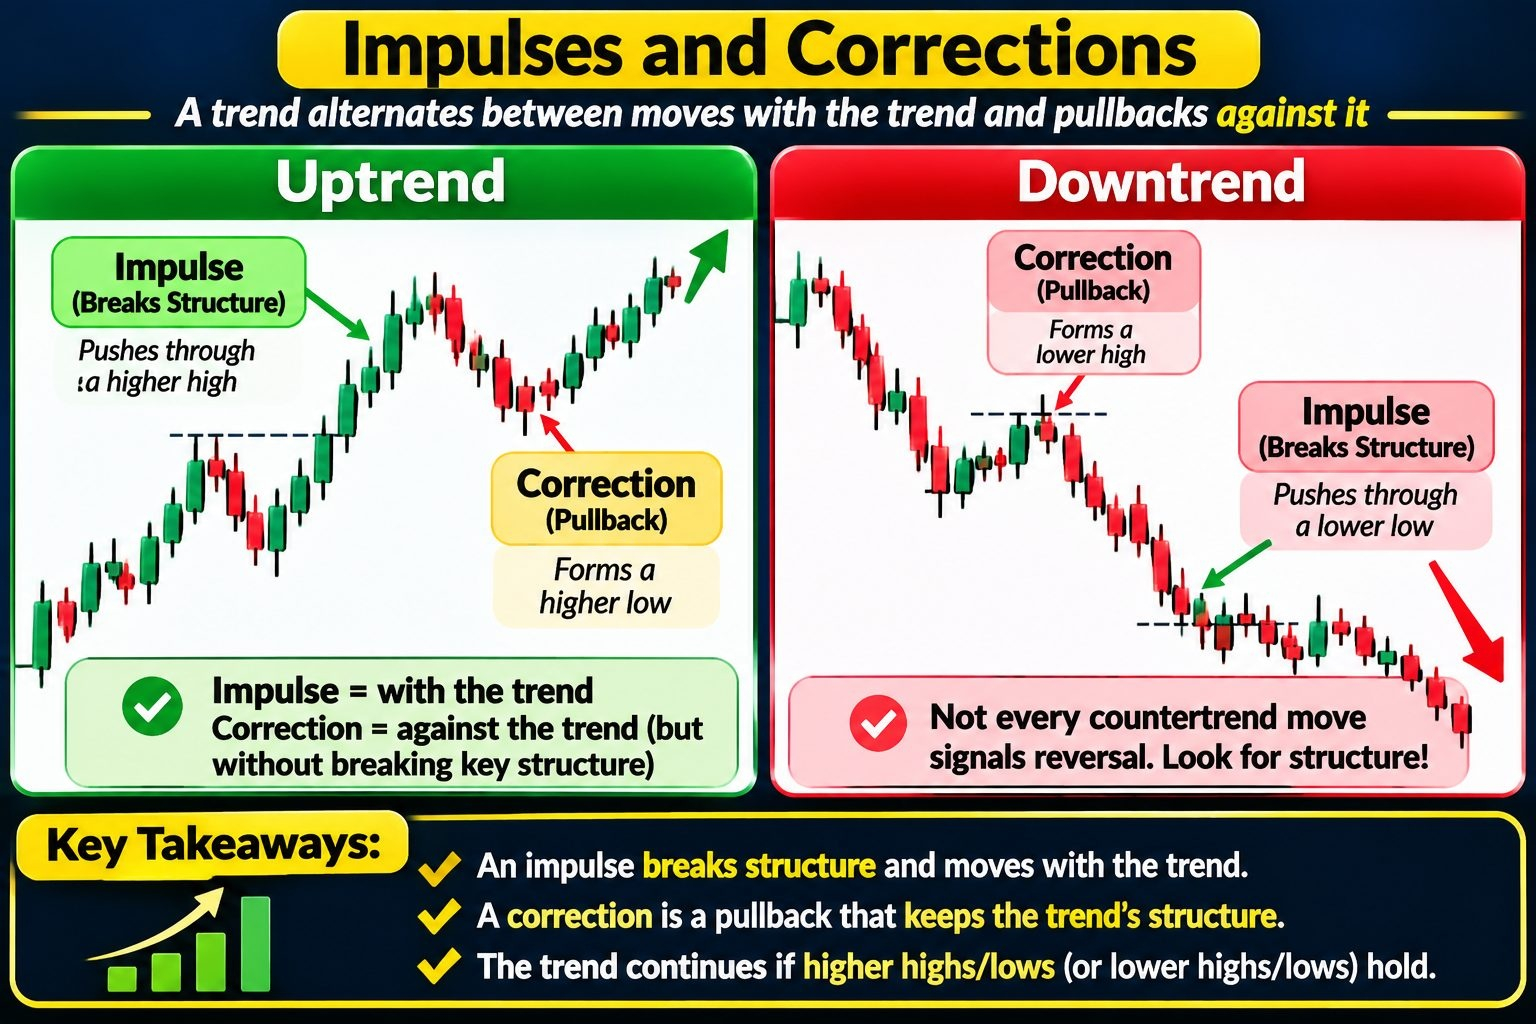
A trend typically alternates between two kinds of movement:
An impulse moves with the trend and breaks relevant structure. In an uptrend, it pushes through a previous higher high; in a downtrend, it pushes through a previous lower low.
A correction is a pullback against the trend that does not break the significant structure defining that trend. In an uptrend, a correction can form a higher low; in a downtrend, it can form a lower high.
The distinction matters because not every countertrend move signals reversal. A pullback that preserves the defining swing structure can be part of the existing trend.
Trend Reversal and Structural Change
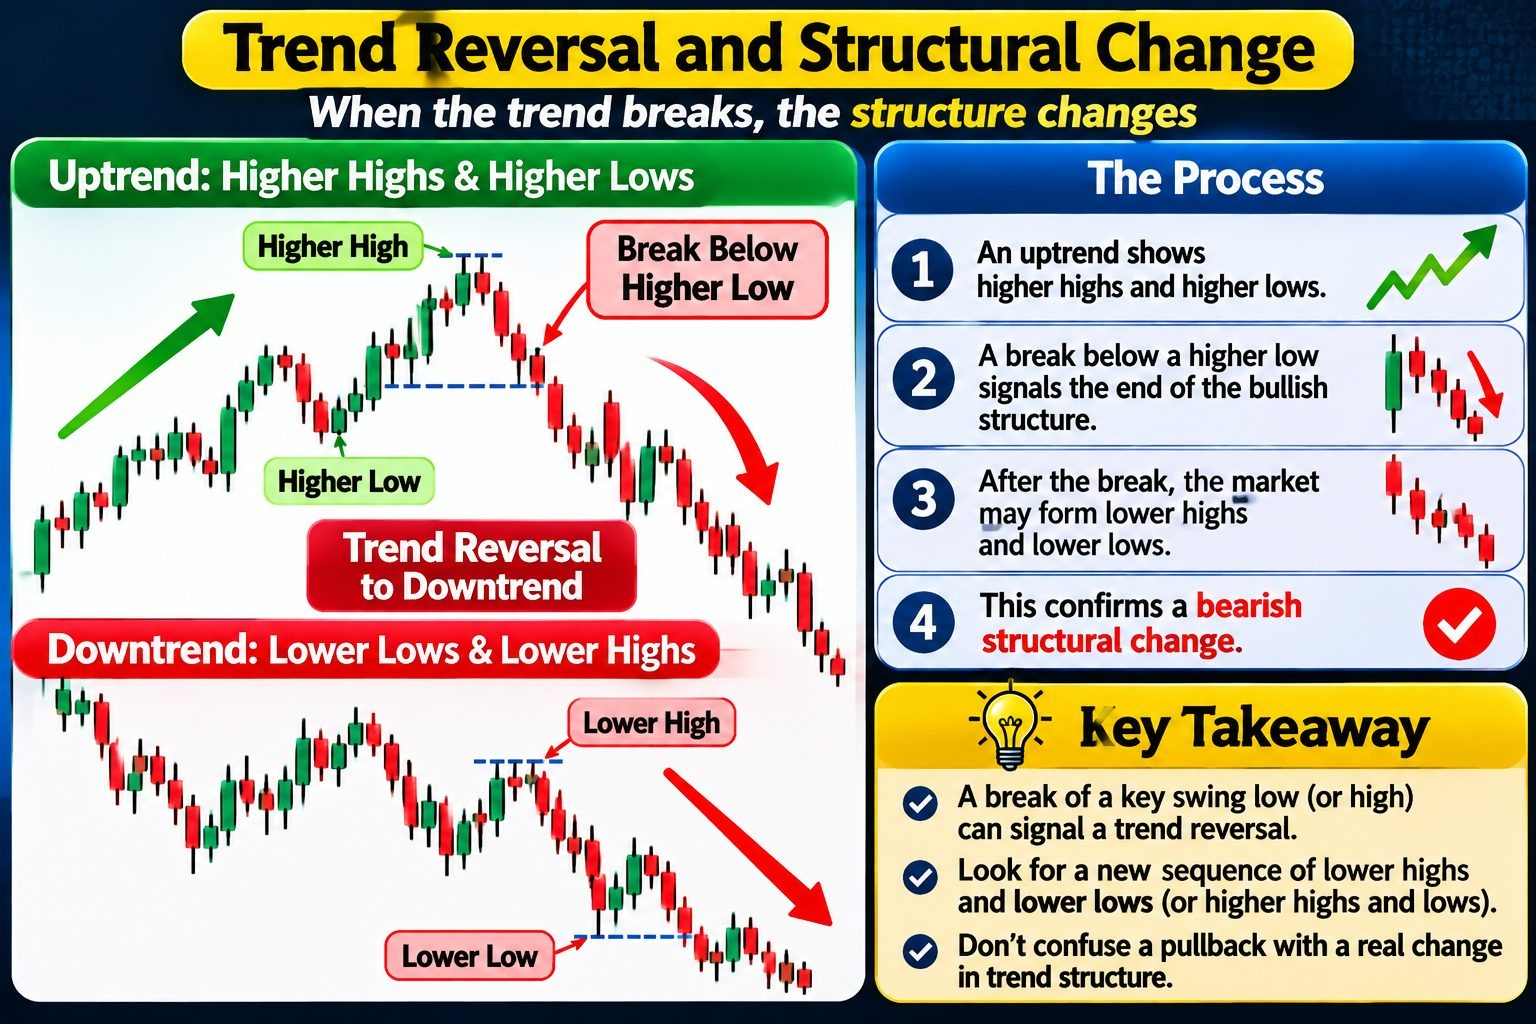
When an uptrend may end
An uptrend is supported by higher highs and higher lows. The lesson identifies a decisive break below a relevant higher low as evidence that this bullish structure has failed. The downward move through that low is treated as a bearish impulse because it breaks the structure that had maintained the uptrend.
After that change, the market may begin forming lower highs and lower lows. The important distinction is between a normal pullback, which preserves the trend's significant swing structure, and a break that invalidates that structure.
A structural transition
A simplified transition from bullish to bearish structure is:
Price forms higher highs and higher lows.
Price breaks below a relevant higher low, producing a bearish structural move.
A rebound forms a lower high.
A subsequent decline makes a lower low, supporting continued bearish structure.
The inverse reasoning applies when a bearish market transitions to a bullish one, although the lesson's main worked setup is bearish.
Keep consolidation distinct from reversal
Sideways pauses can produce messy, intermediate swings. The example later in the lesson treats a sideways interval within a larger bearish move as consolidation rather than as a meaningful trend reversal. A structural judgment should therefore prioritize significant swings and breaks, rather than treating every short-term fluctuation as a new trend.
Liquidity Around Swing Highs and Lows
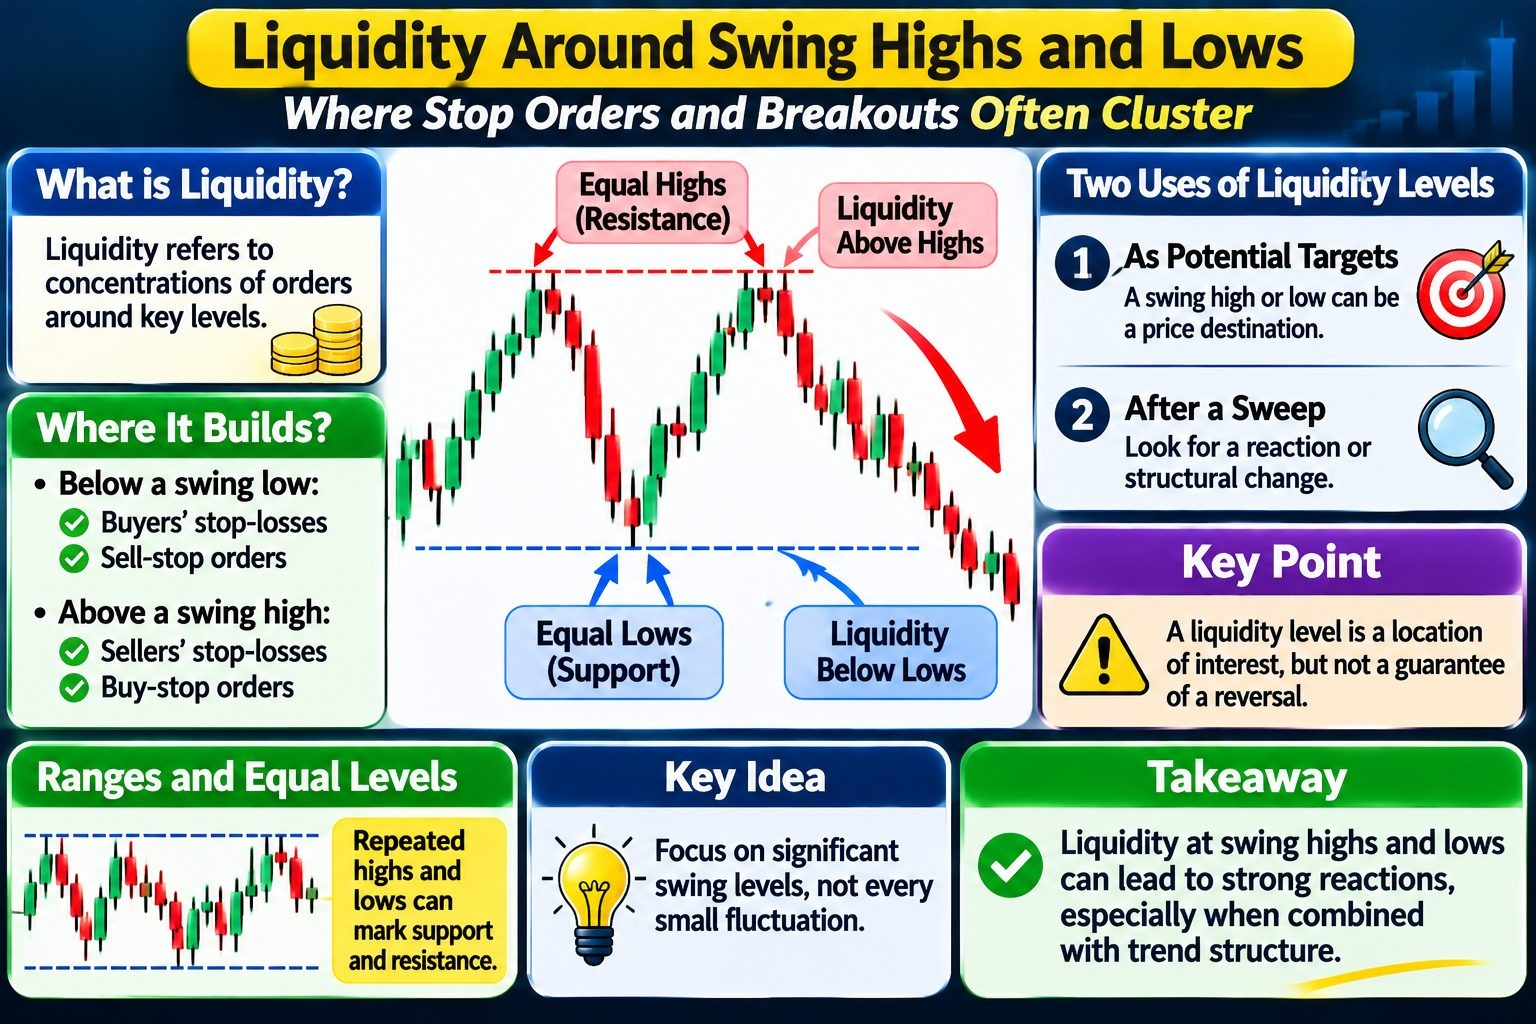
What the lesson means by liquidity
The lesson uses liquidity to describe concentrations of orders around notable price levels. Its explanation is that traders commonly place protective stop-loss orders beyond swing points, while breakout traders may place stop orders to enter if those points are crossed.
For example:
Below a swing low, the source expects stop-losses from buyers and sell-stop orders from traders seeking a downside breakout.
Above a swing high, it expects stop-losses from sellers and buy-stop orders from traders seeking an upside breakout.
Thus, highs and lows can become areas where many orders are positioned. The lesson argues that price may react significantly when these areas are reached because orders there can be triggered. This is the source's trading model, not a guarantee that every level will produce a reversal.
Equal highs, equal lows, and ranges
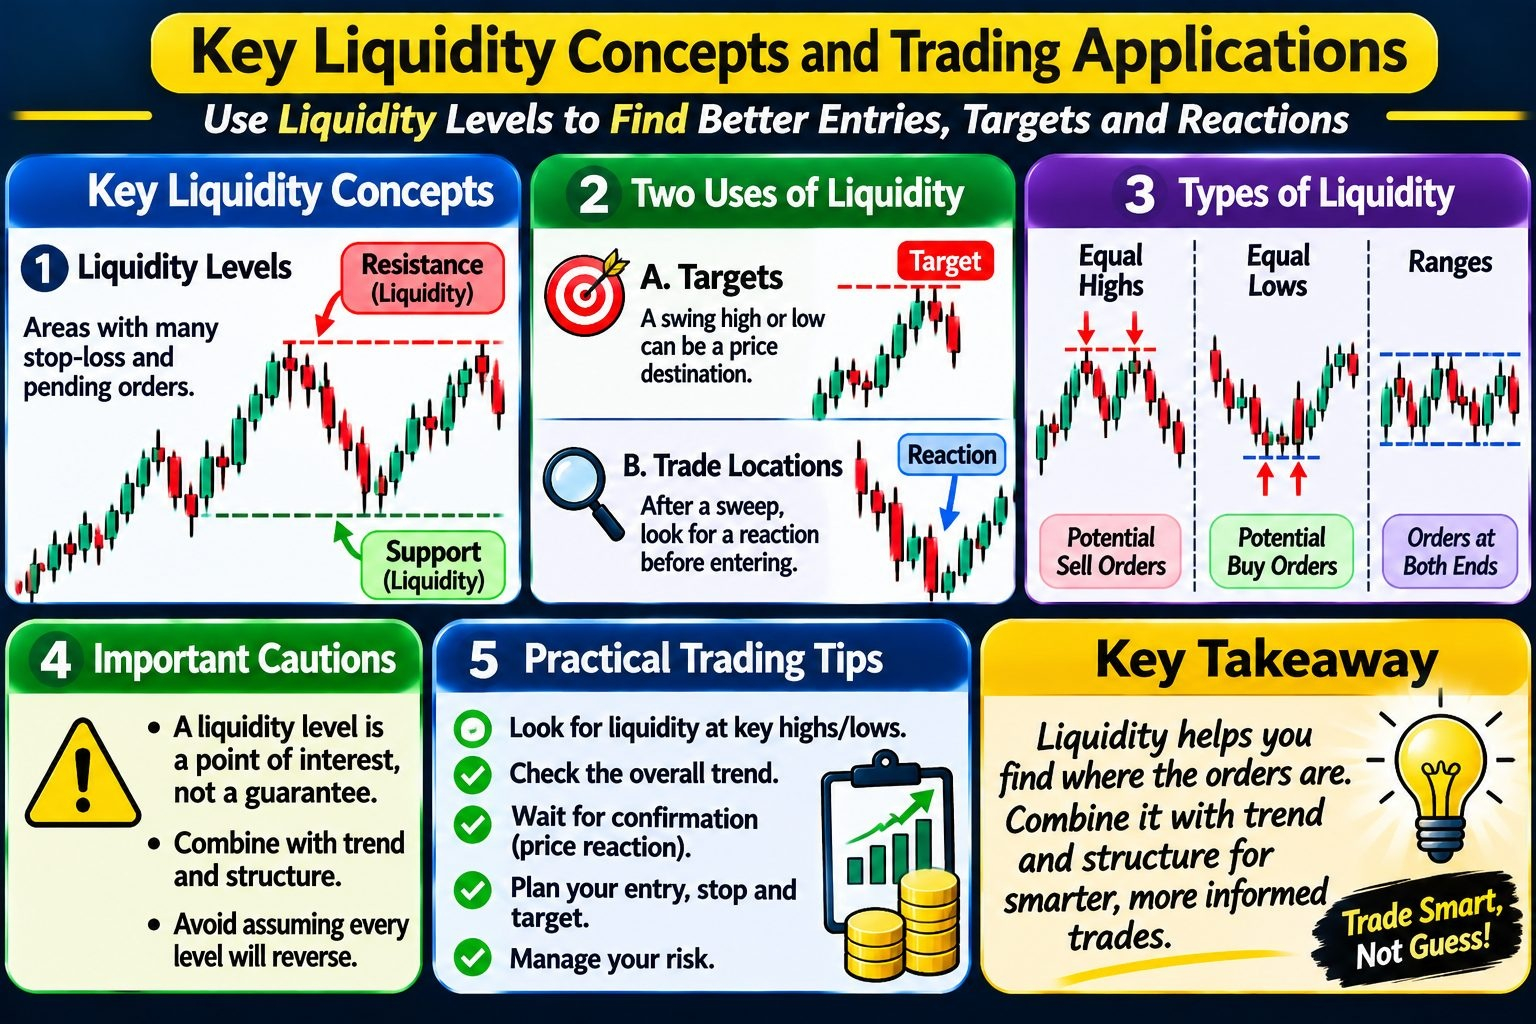
Repeated highs near the same level can define resistance and a potential pool of orders above the highs. Repeated lows can similarly mark support and potential orders below the lows. The levels need not match to the exact pip in the source's example, but they should be close enough to be reasonably identified as a shared level or range.
The source contrasts these areas with the middle of a slow-moving range: it treats the range's extremes as more useful places to watch for concentrated orders and possible reactions.
Two uses of liquidity levels
Liquidity levels can inform both targets and trade locations:
A trader may consider a swing high or low as a potential price destination if price is moving toward that pool of orders.
After price sweeps a level, a trader may look for evidence of a reaction or structural change before considering a trade in the opposite direction.
Caution
A liquidity level identifies a location of interest in this framework. It does not, on its own, establish that price will reverse there; the lesson combines liquidity with market structure and other entry criteria.
Combining Trend Structure with Liquidity Sweeps
The bearish setup
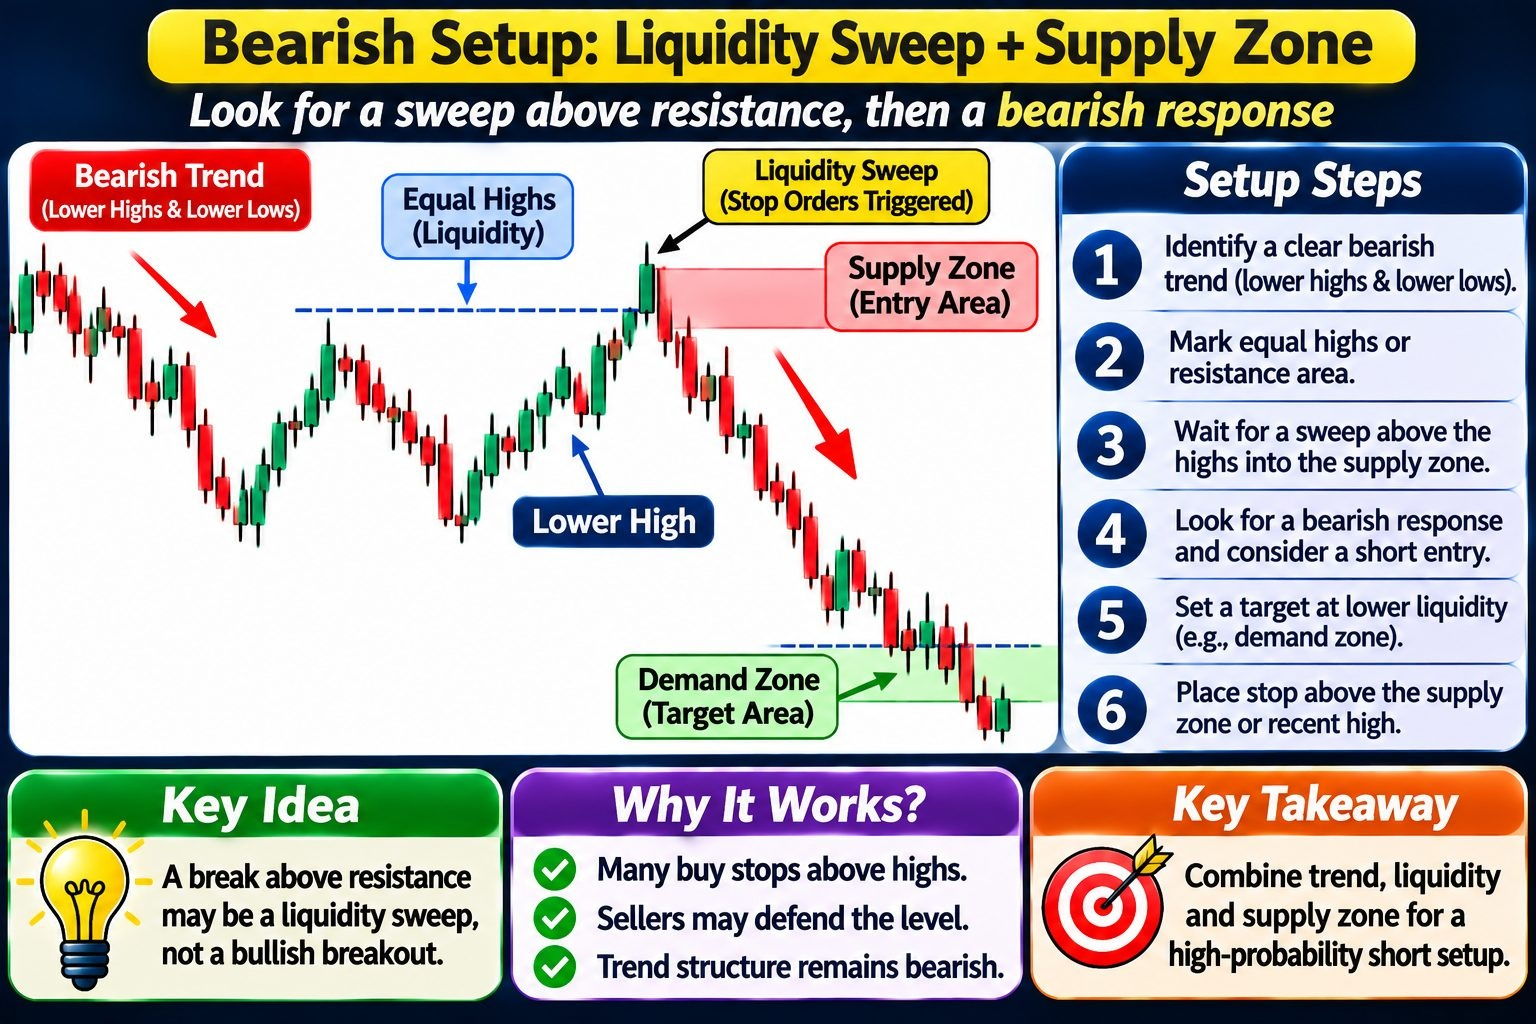
The central entry model combines a bearish trend with liquidity above repeated highs. The intended sequence is:
Identify a clear bearish market with lower lows and lower highs, including bearish impulses and corrective rebounds.
Mark equal or near-equal highs, or a resistance area, within that broader bearish structure. The lesson associates this area with potential buy stops and sellers' protective stops above it.
Wait for price to break above the highs and enter the area where those orders may be concentrated.
Look for a possible bearish response and use the specified supply area to plan a short entry.
Consider lower liquidity or a demand zone as a potential target.
The setup's logic is that a move above resistance may be a liquidity sweep rather than a genuine bullish continuation, particularly when the broader bearish structure remains intact. A trader should not infer that every break of resistance is a sweep; the context and subsequent price behavior matter.
Sweep versus trend continuation
A break beyond a previous high or low can look like a break of structure. In this model, the interpretation depends partly on whether that break runs into an identifiable concentration of liquidity, such as equal highs or resistance. With such a level present and the wider bearish trend still intact, the lesson considers a failed break and reversal plausible. Without that liquidity context, the same upward break could be interpreted as genuine bullish structure-breaking movement.
The key distinction is not simply “price crossed a high.” It is whether the move occurs at a significant liquidity level and whether the broader structure supports treating it as a sweep rather than a trend change.
Key idea
The bearish setup does not sell merely because a market is bearish. It waits for a move into liquidity above highs and uses the supply area as an additional entry location.
Mirrored bullish version
The lesson says the model can be applied in the opposite direction: in a new uptrend, traders can look for equal lows and a demand zone to support a potential long setup. The directional trend must match the trade idea; the bearish example uses bearish structure, highs swept, and supply, while the bullish version reverses those relationships.
Supply and Demand Zones for Entry and Targets
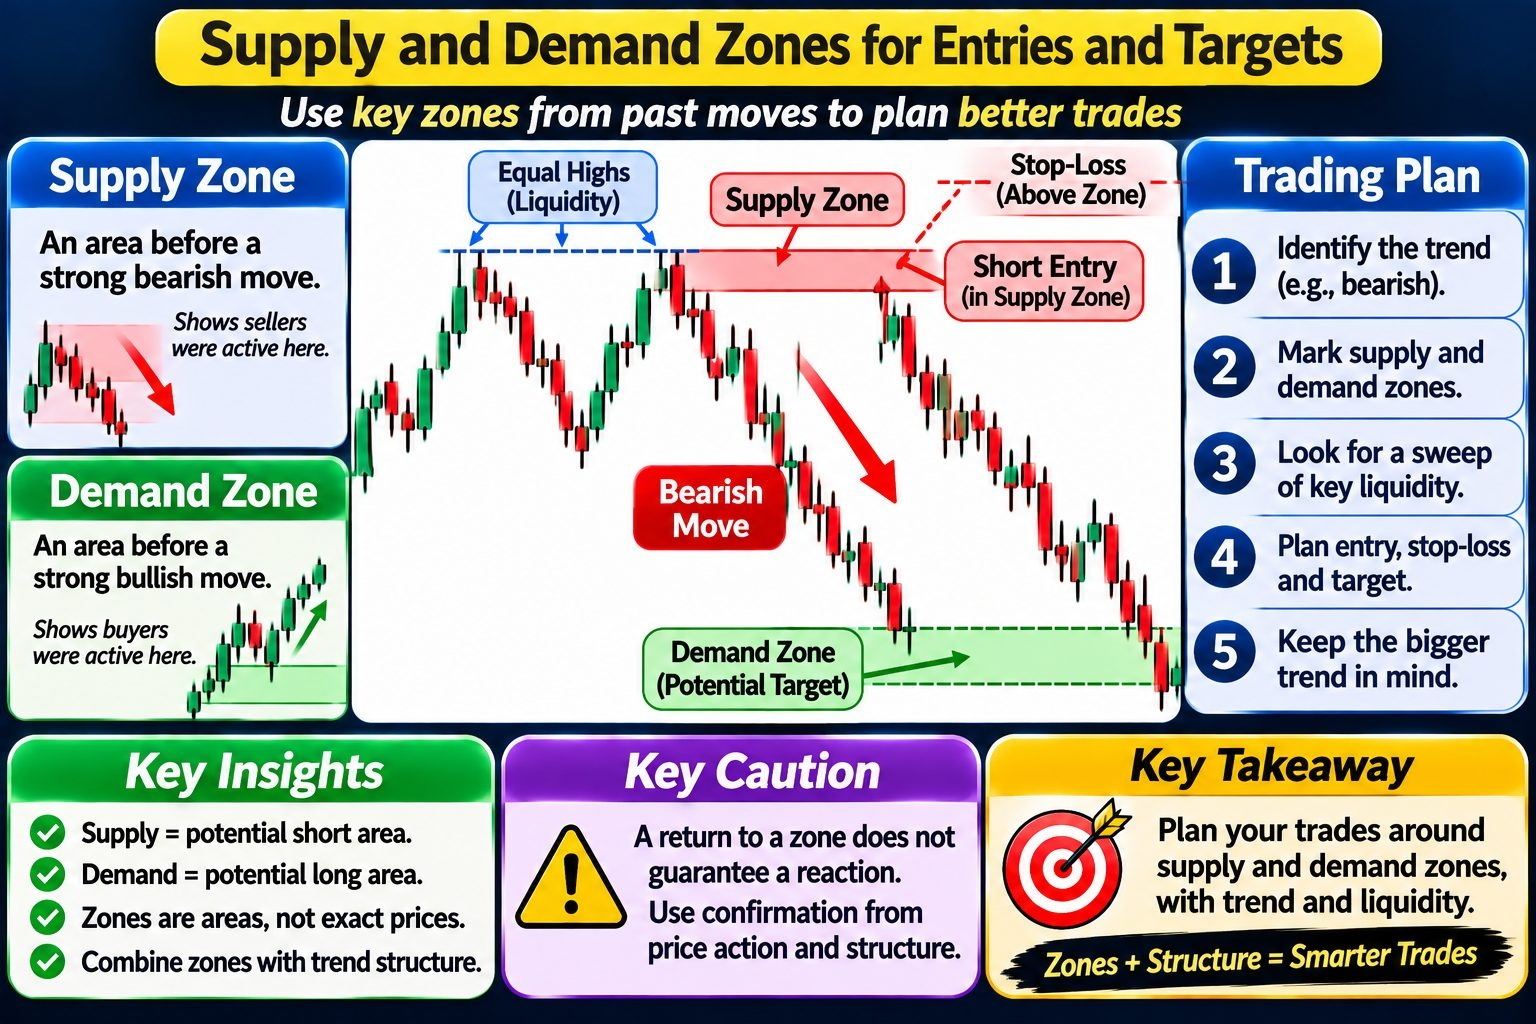
A supply zone is described as an area immediately before a large bearish impulsive move. The lesson interprets a strong prior selloff from an area as evidence that sellers accepted that price as a suitable level to sell from. If price returns to the area, a trader may consider it a potential short-entry location.
A demand zone is the converse: a consolidation area before a large upward move. In the worked bearish trade, demand below the entry is considered as a possible target because it marks an area associated with a previous upward move.
These are areas, not necessarily exact single prices. The example identifies a consolidation or last candle before the impulse, then uses the region as the zone. The lesson does not establish that a return to either zone must cause a reaction.
Combining zones with liquidity
For the bearish setup, the supply area is used after price sweeps equal highs. The trader looks for price to reach the zone and considers a sell limit there. The proposed stop is placed above the supply zone or above the relevant high; in the example, the presenter prefers clearing the high to allow for a wick.
Potential downside targets include:
A swing low or another identified liquidity level.
A demand zone, described as the consolidation before a strong upward move.
The general plan is to select a target in an open area below the short entry while remaining consistent with the bearish trend.
Worked Chart Example, Order Placement, and Trade Evaluation
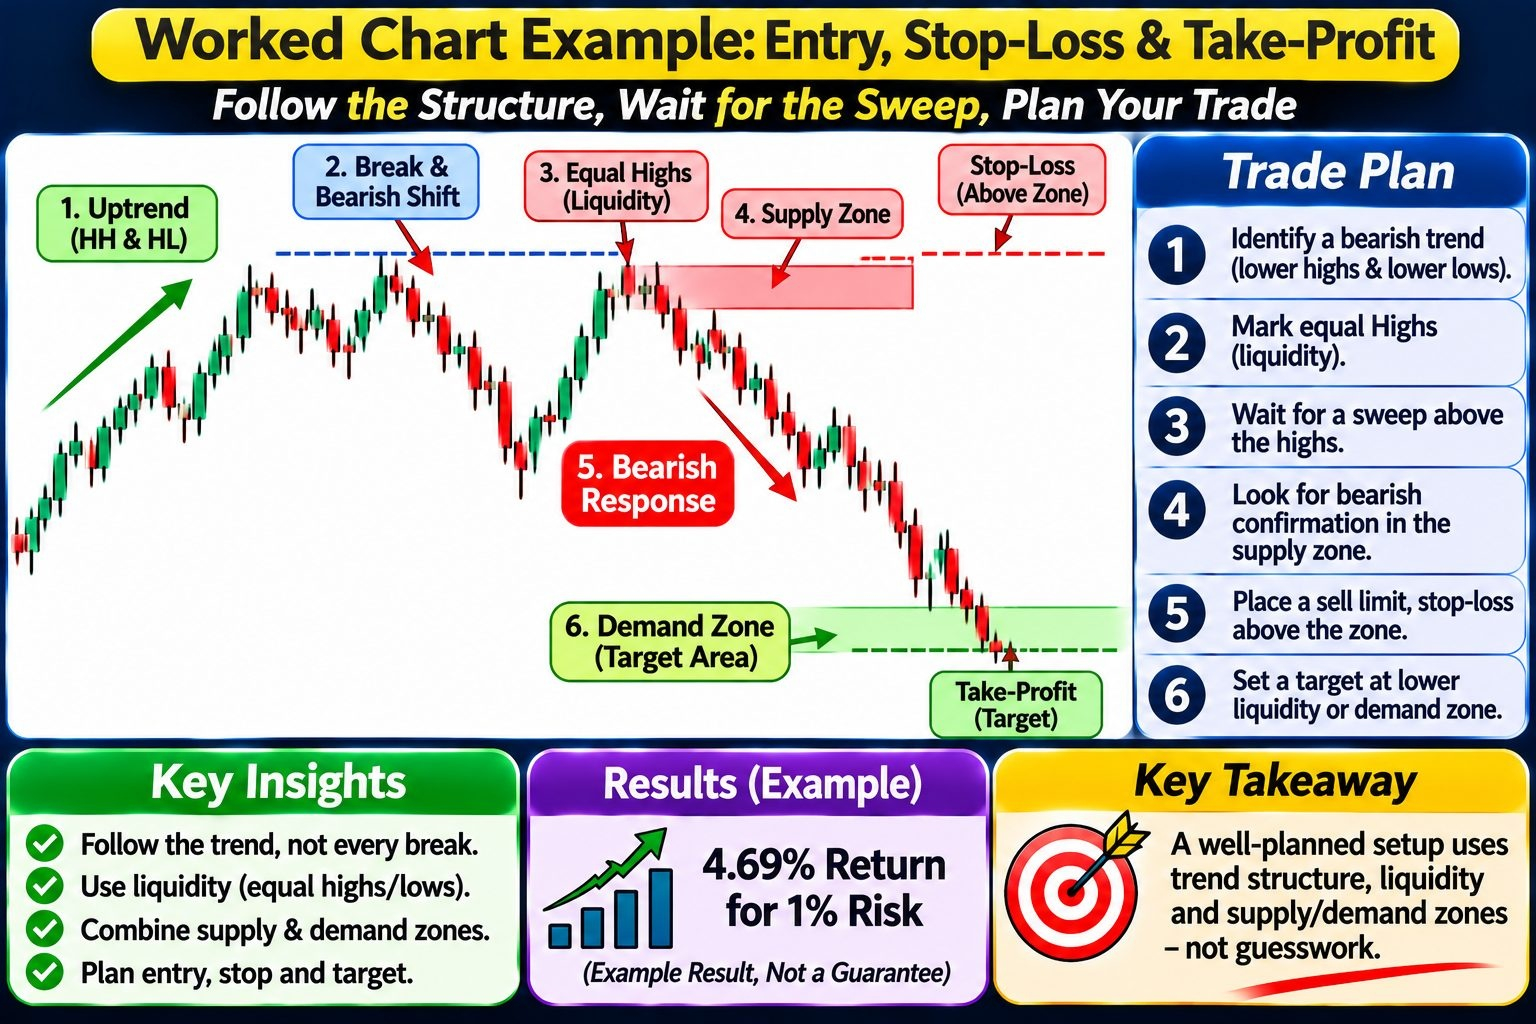
Reading the example in sequence
The worked chart first shows an upward sequence of higher highs and higher lows, then a break that shifts structure into lower lows. The source treats this break as the start of a bearish market. It then identifies a bearish swing high and low, a lower high, and a new lower low. A sideways interval within the larger move is treated as consolidation rather than as a separate trend to trade.
Within that pause, several highs are close together. The lesson marks them as relative equal highs or resistance, despite a small difference of about one pip in the illustration. The point is that they are sufficiently close to define a recognizable level or area; exact equality is not required by the example.
The chart then supplies the setup's other components:
Bearish trend structure.
Equal-high liquidity above the consolidation.
A supply zone identified around the area before the bearish impulse that broke structure.
A lower demand area, formed before a strong upward move, considered as a possible target.
Illustrative order plan from the source
Wait for price to sweep above the equal highs and enter the supply area.
Consider a sell limit at the planned supply level. In the lesson, the limit order triggers a sell if price reaches that level; it does not mean the trade is guaranteed to reverse.
Place the protective stop above the supply zone or above the high. The presenter chooses above the high to allow room for a wick rather than placing the stop too close to the level.
Set a potential target at lower liquidity, such as a swing low, or at the demand zone.
Assess the result relative to the risk and the planned trade. The source reports an example return of 4.69% for every 1% risked; this is a result claimed for that illustration, not a general performance expectation.
The same framework is described as applicable to a bullish reversal or uptrend using equal lows and demand, with the direction of the setup reversed.
Caution
The source presents a trade model, not a validated guarantee. Its closing remarks recommend turning a model into a strategy and testing, journaling, and validating it, including examining win rate and other relevant metrics, before live use.