

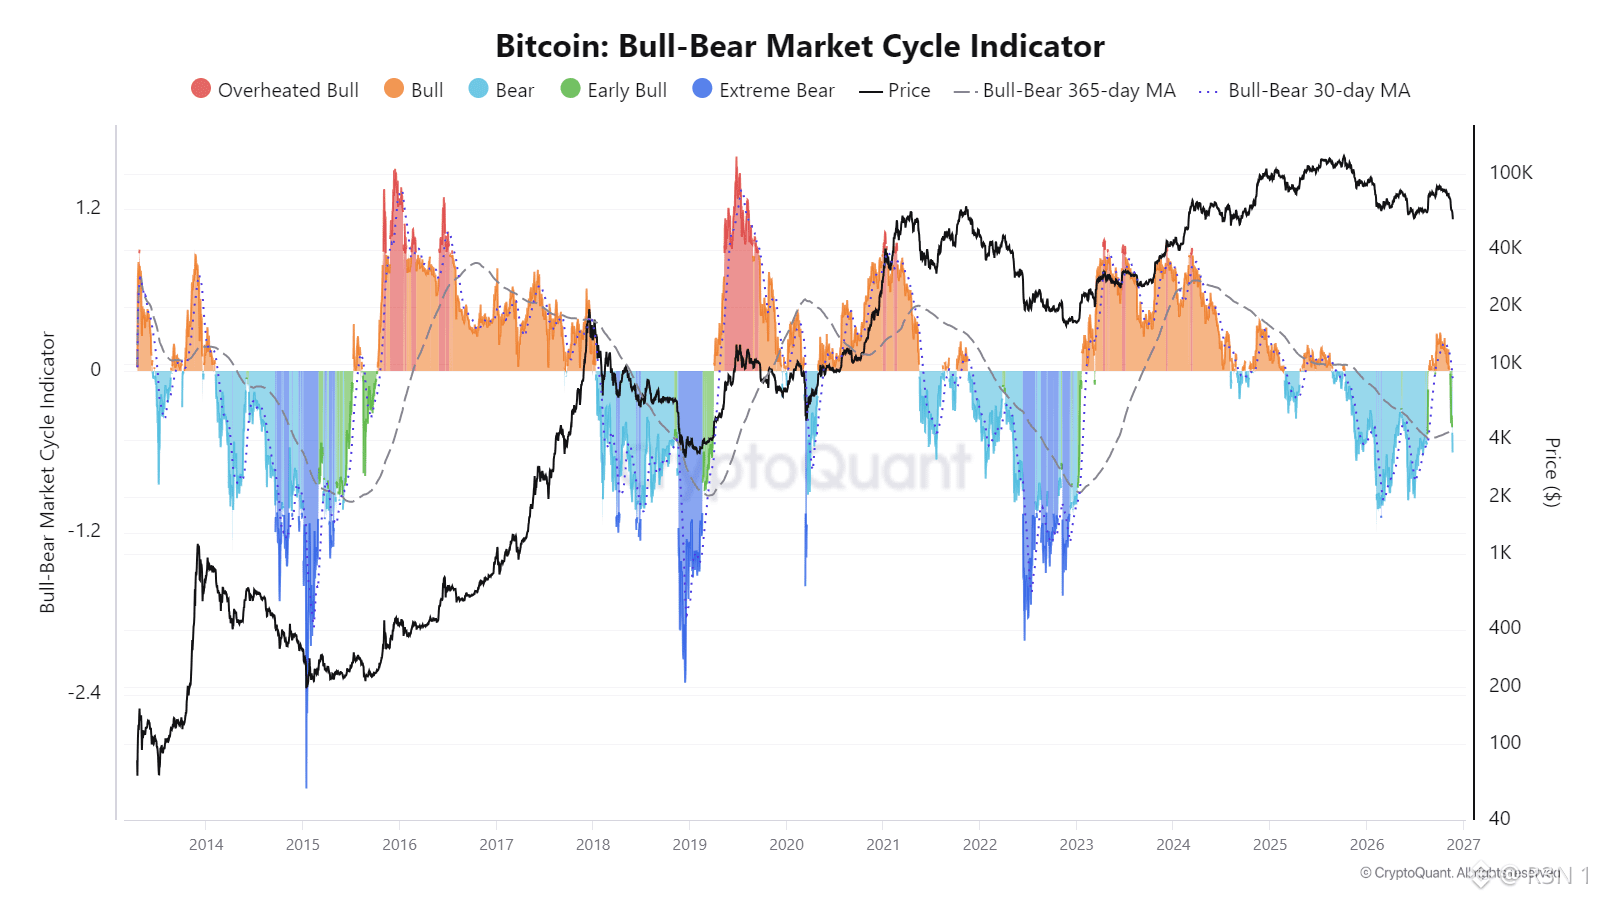
The Bull-Bear Cycle Indicator has flipped back below zero, and it's still far from past cycle extremes. CryptoQuant's Bull-Bear Market Cycle Indicator has dropped back into bear territory, with the latest reading near -0.5 as Bitcoin trades near $60K. It ended a short stretch of positive readings from late summer. Compare the depth with previous lows. The indicator reached about -2.4 in 2015, about -1.8 around the 2018 to 2019 lows, and about -2.0 during the 2022 bottom. In the first half of 2026, the low was about -1.2. The current move is shallower than each of those. The 365-day moving average, the dashed line, sits near the same area as the latest reading. That means price momentum is roughly in line with its long-term trend, not far below it, which is different from the sharp breaks seen at past capitulation lows. Taken with other data we've seen this month, ETF outflows, shrinking stablecoin supply, and extreme fear in sentiment, the indicator suggests a slow, grinding bear phase, not a final washout. The indicator doesn't time bottoms. It describes phase. Historically, the lowest readings clustered near cycle lows, but this cycle's readings have been less extreme, so past depth may not apply. The risk is a move toward -1 or lower, which would signal deeper stress. The supportive case is a gradual recovery as the readings stop falling. The phase tells you where you are. It doesn't tell you when you'll leave. $ONDO #Macro Insights# #Altcoin Season# $BTC
Krypto-Nutzer weltweit auf Binance Square kennenlernen
⚡️ Bleib in Sachen Krypto stets am Puls.
💬 Die weltgrößte Kryptobörse vertraut darauf.
👍 Erhalte verlässliche Einblicke von verifizierten Creators.
E-Mail-Adresse/Telefonnummer