

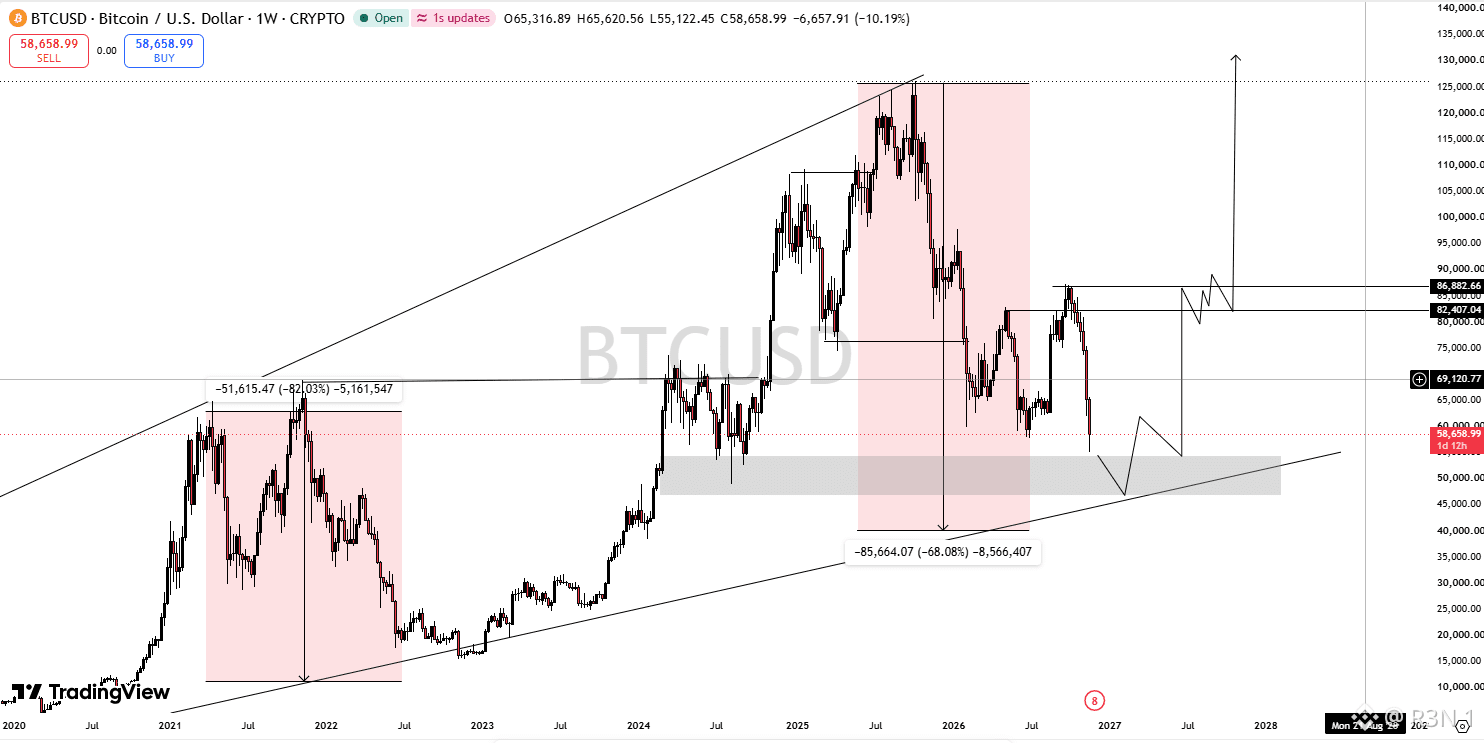
Bitcoin broke below $60K, and the long-term chart is asking where the real floor is. On the weekly chart, Bitcoin trades near $58,900 after a drop of nearly 10% this week and a low near $55,100. That puts it about 53% below its high near $126K (my math, levels read by eye). It’s painful to watch, especially after the confidence of 2025. The chart shows two things worth separating. In the last cycle, Bitcoin fell far deeper, by roughly 77% from its 2021 high to its 2022 low. This time the drop so far is around 56% at the weekly low. Each cycle’s decline has been shallower than the last, but that’s a pattern with only a few examples, not a rule. The area I’m watching is the grey zone around $47,000 to $54,000. It’s where Bitcoin traded in 2024 before breaking higher, and it lines up with the long-term rising trendline drawn from earlier cycles. When a past breakout level and a long-term trendline meet, buyers have tended to show up. That’s a possibility, not a promise. On the upside, $82,400 and $86,900 are the levels Bitcoin would need to reclaim to show the downtrend is over. Until then, rallies are bounces. The mood explains the pressure. ETFs have lost billions this month, including a record outflow from BlackRock’s fund, and fear is extreme. Long-term charts are good at showing where the market has turned before, and bad at saying when. My view is that Bitcoin may still test lower before a lasting base forms, but that’s an expectation, not advice. The risk is a break below the grey zone, which would mean the old support failed. The supportive case is a deep, washed-out market near long-term support. Which feels harder to you: watching Bitcoin fall, or waiting for it to recover? #BTC Price Analysis# $BTC #Bitcoin Price Prediction: What is Bitcoins next move?#
Krypto-Nutzer weltweit auf Binance Square kennenlernen
⚡️ Bleib in Sachen Krypto stets am Puls.
💬 Die weltgrößte Kryptobörse vertraut darauf.
👍 Erhalte verlässliche Einblicke von verifizierten Creators.
E-Mail-Adresse/Telefonnummer