$QQQ: mutual funds were underweight AI before Friday's rout — and it is paying off.
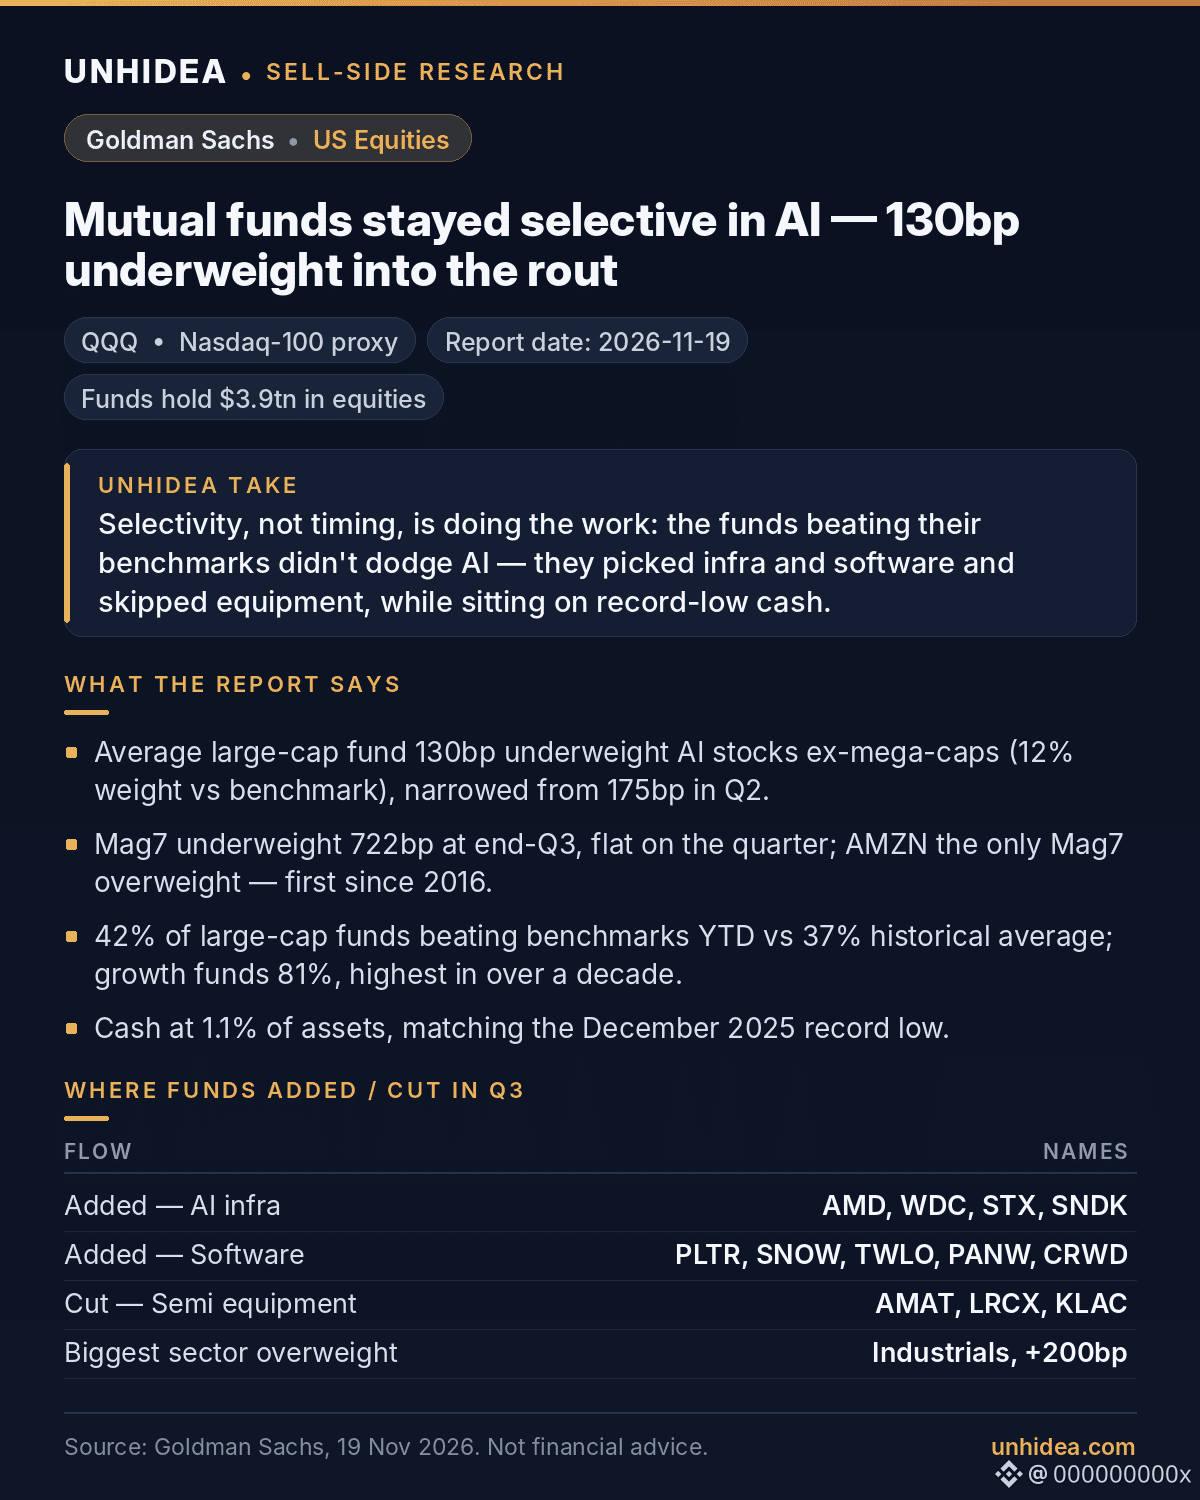
- Goldman Sachs, 19 Nov: the average large-cap fund was 130bp underweight AI-exposed stocks ex-mega-caps (12% weight vs benchmark), narrowed from 175bp in Q2. Including mega-caps: 34% vs a 40% benchmark weight.
- Mag7: funds were 722bp underweight at end-Q3, flat on the quarter. AMZN is the only Mag7 overweight — the first since 2016. Most funds cut GOOGL and AAPL the most.
- In Q3 funds added AI infra (AMD, WDC, STX, SNDK) and software (PLTR, SNOW, TWLO, PANW, CRWD), and cut semi-equipment (AMAT, LRCX, KLAC).
- 42% of large-cap funds are beating benchmarks YTD vs a 37% historical average; growth funds 81% — the highest in over a decade. Value funds returned +14% YTD but only 4% beat.
- Cash sits at 1.1% of assets, matching the December 2025 record low. Active funds saw ~$350bn of outflows YTD, on track for a 12th straight year, vs ~$960bn into US equity ETFs.
Unhidea take: selectivity, not timing, is doing the work — the funds beating their benchmarks didn't dodge AI, they picked infra and software and skipped equipment.
Unhidea take: cash at a record low means no dry powder for the dip. The marginal buyer is ETF flow — ~$210bn into US equity ETFs since Q4 began.
Post-report market data, 20 Nov: Nasdaq -5.28%, S&P 500 -3.7%; NVDA -14%, AMD -13%.
Risks: AI capex slowdown, Mag7 concentration, ETF flows reversing, narrow breadth.
Source: Goldman Sachs, 19 Nov 2026. Not financial advice.
- Goldman Sachs, 19 Nov: the average large-cap fund was 130bp underweight AI-exposed stocks ex-mega-caps (12% weight vs benchmark), narrowed from 175bp in Q2. Including mega-caps: 34% vs a 40% benchmark weight.
- Mag7: funds were 722bp underweight at end-Q3, flat on the quarter. AMZN is the only Mag7 overweight — the first since 2016. Most funds cut GOOGL and AAPL the most.
- In Q3 funds added AI infra (AMD, WDC, STX, SNDK) and software (PLTR, SNOW, TWLO, PANW, CRWD), and cut semi-equipment (AMAT, LRCX, KLAC).
- 42% of large-cap funds are beating benchmarks YTD vs a 37% historical average; growth funds 81% — the highest in over a decade. Value funds returned +14% YTD but only 4% beat.
- Cash sits at 1.1% of assets, matching the December 2025 record low. Active funds saw ~$350bn of outflows YTD, on track for a 12th straight year, vs ~$960bn into US equity ETFs.
Unhidea take: selectivity, not timing, is doing the work — the funds beating their benchmarks didn't dodge AI, they picked infra and software and skipped equipment.
Unhidea take: cash at a record low means no dry powder for the dip. The marginal buyer is ETF flow — ~$210bn into US equity ETFs since Q4 began.
Post-report market data, 20 Nov: Nasdaq -5.28%, S&P 500 -3.7%; NVDA -14%, AMD -13%.
Risks: AI capex slowdown, Mag7 concentration, ETF flows reversing, narrow breadth.
Source: Goldman Sachs, 19 Nov 2026. Not financial advice.