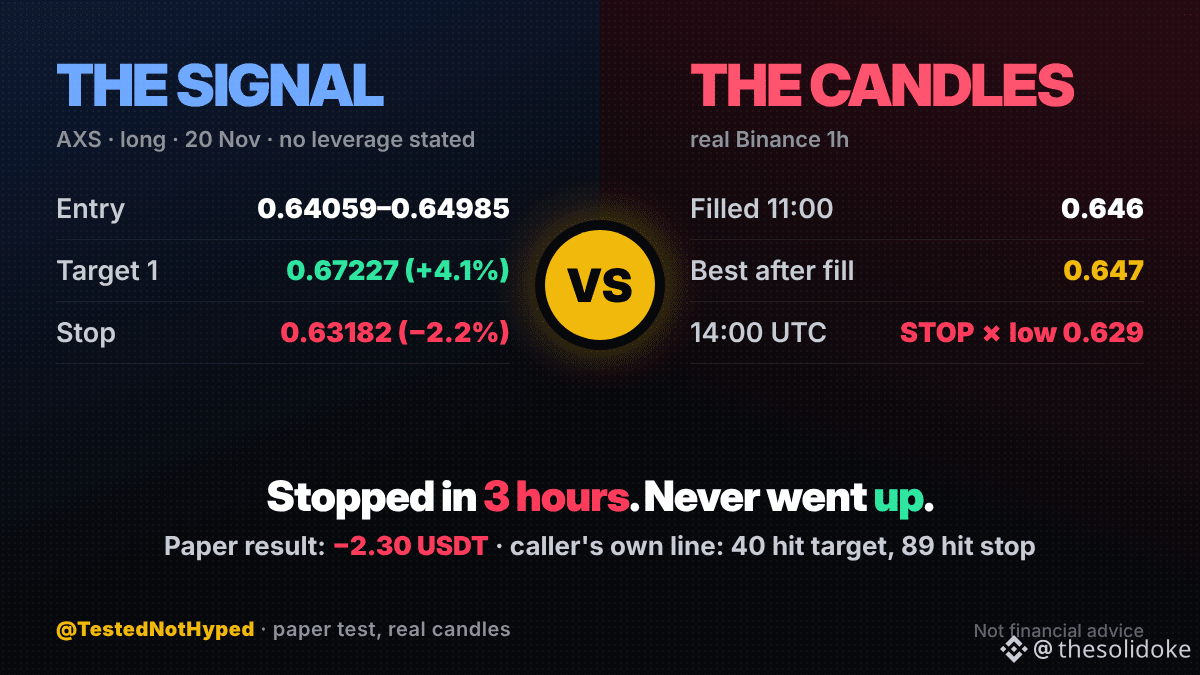
Paper test of an AXS long signal from Square: −2.30 USDT on 10 USDT margin. Stopped out in 3 hours.
The levels as posted (today, about 10:40 UTC): entry 0.64059–0.64985, stop 0.63182, targets 0.67227 / 0.68845 / 0.71271. No leverage stated, so I used 10x. I added it to my tracker before the result.
On paper this one was set up better than most: the stop was 2.2% away and the first target 4.1%.
What the real 1h candles did: filled at 0.646 in the 11:00 UTC hour. The best it ever got was 0.647. It slid every hour after that, and at 14:00 a candle hit 0.629, through the stop. An hour later AXS was at 0.608.
The caller's own post said: in the last 7 days, 40 of their calls hit target and 89 hit stop. That's a 31% hit rate. With the first target about 1.9 times the stop, break-even is around 35%. Close, but under.
Tracker: 21 closed, 10 wins, net −1.80 USDT.
What hit rate would you need to see before following a caller? 👇
Not financial advice. Paper results, real Binance prices.
#TradingSignals #TradingBots #crypto #cryptotrading #Write2Earn $BTC
The levels as posted (today, about 10:40 UTC): entry 0.64059–0.64985, stop 0.63182, targets 0.67227 / 0.68845 / 0.71271. No leverage stated, so I used 10x. I added it to my tracker before the result.
On paper this one was set up better than most: the stop was 2.2% away and the first target 4.1%.
What the real 1h candles did: filled at 0.646 in the 11:00 UTC hour. The best it ever got was 0.647. It slid every hour after that, and at 14:00 a candle hit 0.629, through the stop. An hour later AXS was at 0.608.
The caller's own post said: in the last 7 days, 40 of their calls hit target and 89 hit stop. That's a 31% hit rate. With the first target about 1.9 times the stop, break-even is around 35%. Close, but under.
Tracker: 21 closed, 10 wins, net −1.80 USDT.
What hit rate would you need to see before following a caller? 👇
Not financial advice. Paper results, real Binance prices.
#TradingSignals #TradingBots #crypto #cryptotrading #Write2Earn $BTC