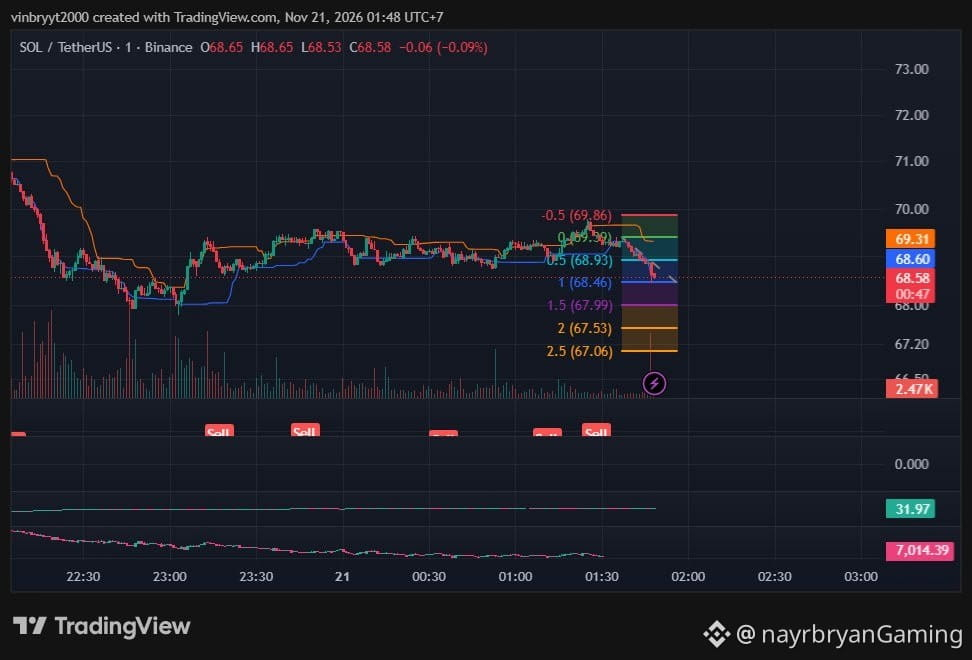
LIGHT ANALYSIS / CHART SETUP — SOL/USDT
📈 STRUCTURE OVERVIEW
Market phase:
Consolidation → Rejection below 0 Fib → Lower supports in focus
Current price: 68.58
Immediate resistance: 68.93 – 69.00
Major resistance: 69.86
Key support: 68.46 → 67.99
Lower extension reference: 67.06
📌 WHAT I’M WATCHING
Scenario A — Bearish Continuation
If SOL loses 68.46 and fails to reclaim it, price may extend toward:
67.99 → 67.53 → 67.06
Scenario B — Relief Bounce
If SOL holds 68.46 and reclaims 68.93, a short-term bounce toward 69.86 becomes possible.
Only a sustained break above the orange resistance line would improve the structure.
📊 INDICATOR CHECK
Short-term guides (blue/orange): Price trading below both
Momentum indicator: Near 31.97 — weakening
Price structure: Lower highs + loss of 0 Fib
Bearish confirmation: Break below 68.46
Bullish confirmation: Reclaim of 68.93 + orange line
Note: This is a chart framework, not a trade recommendation. One-minute candles are highly sensitive to short-term volatility.
— @nayrbryanGaming
#SOLAnalysis #ChartSetup #PriceAction #Fibonacci #CryptoTrading #DYOR #NFA
📈 STRUCTURE OVERVIEW
Market phase:
Consolidation → Rejection below 0 Fib → Lower supports in focus
Current price: 68.58
Immediate resistance: 68.93 – 69.00
Major resistance: 69.86
Key support: 68.46 → 67.99
Lower extension reference: 67.06
📌 WHAT I’M WATCHING
Scenario A — Bearish Continuation
If SOL loses 68.46 and fails to reclaim it, price may extend toward:
67.99 → 67.53 → 67.06
Scenario B — Relief Bounce
If SOL holds 68.46 and reclaims 68.93, a short-term bounce toward 69.86 becomes possible.
Only a sustained break above the orange resistance line would improve the structure.
📊 INDICATOR CHECK
Short-term guides (blue/orange): Price trading below both
Momentum indicator: Near 31.97 — weakening
Price structure: Lower highs + loss of 0 Fib
Bearish confirmation: Break below 68.46
Bullish confirmation: Reclaim of 68.93 + orange line
Note: This is a chart framework, not a trade recommendation. One-minute candles are highly sensitive to short-term volatility.
— @nayrbryanGaming
#SOLAnalysis #ChartSetup #PriceAction #Fibonacci #CryptoTrading #DYOR #NFA