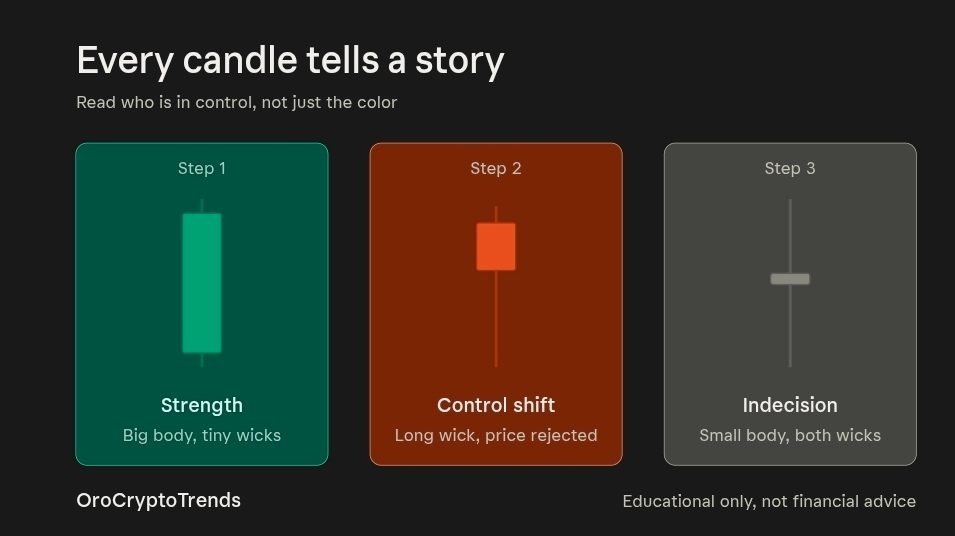


A green candle is not automatically bullish, and a red candle is not automatically bearish. What matters is who controlled the market while the candle formed. Once you learn to read that, a chart stops being random and starts looking like a record of a fight between buyers and sellers.
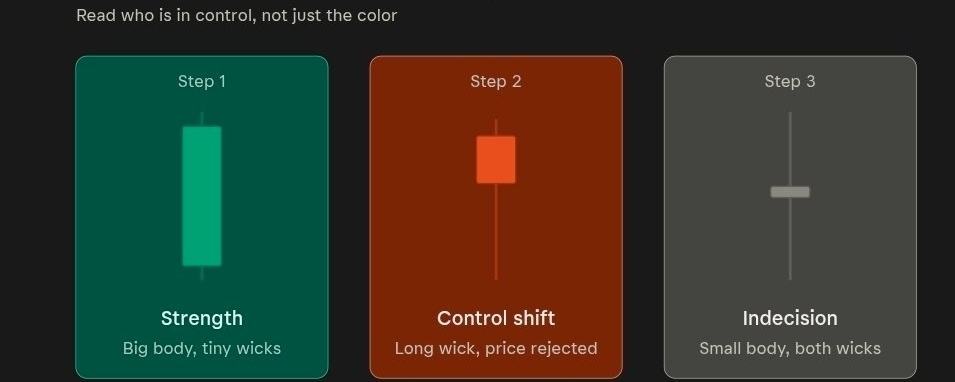
According to JeaFx, nearly every candle falls into one of three types: strength, control shift, and indecision. Here is how each works, step by step.
Step 1: Strength candles (who is dominating?)
A strength candle has a large body and very small wicks. A bullish one opens near its low and closes near its high, which means buyers were in control the whole period. A bearish one is the mirror image.
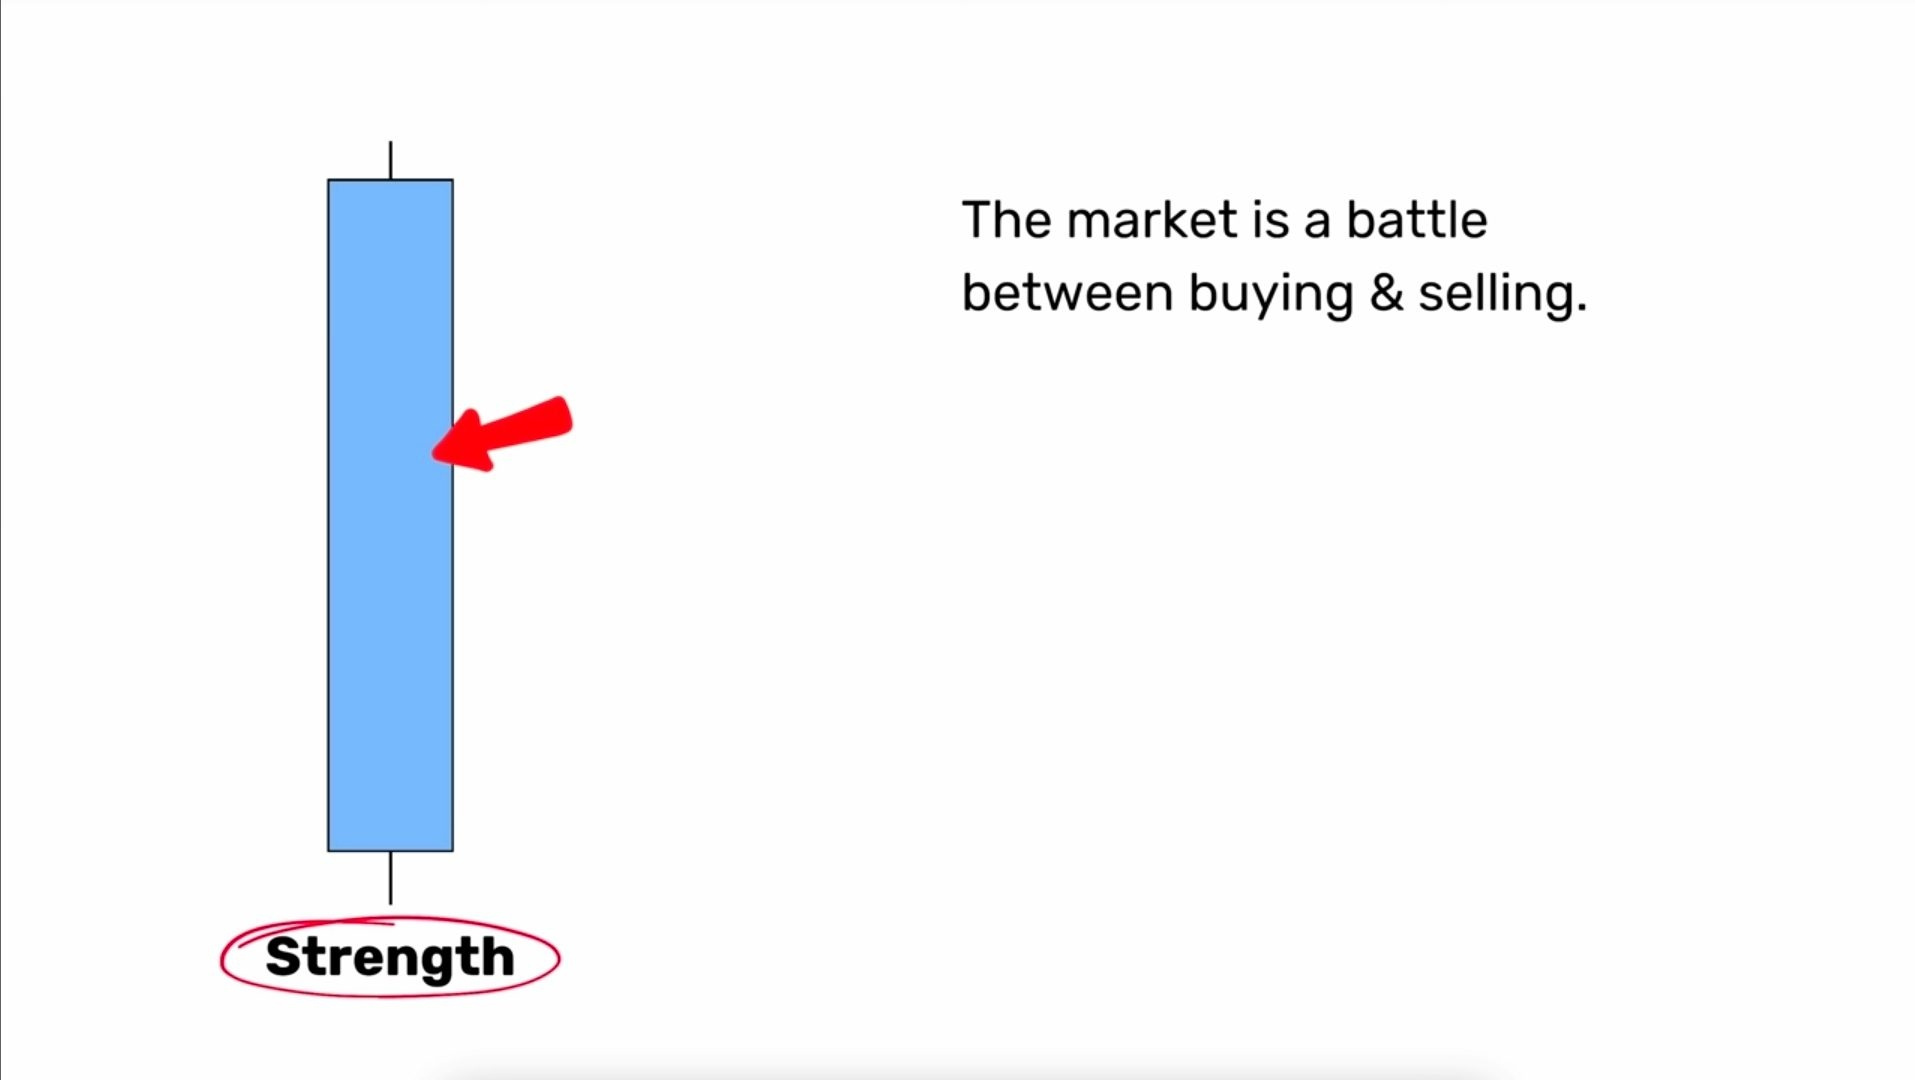
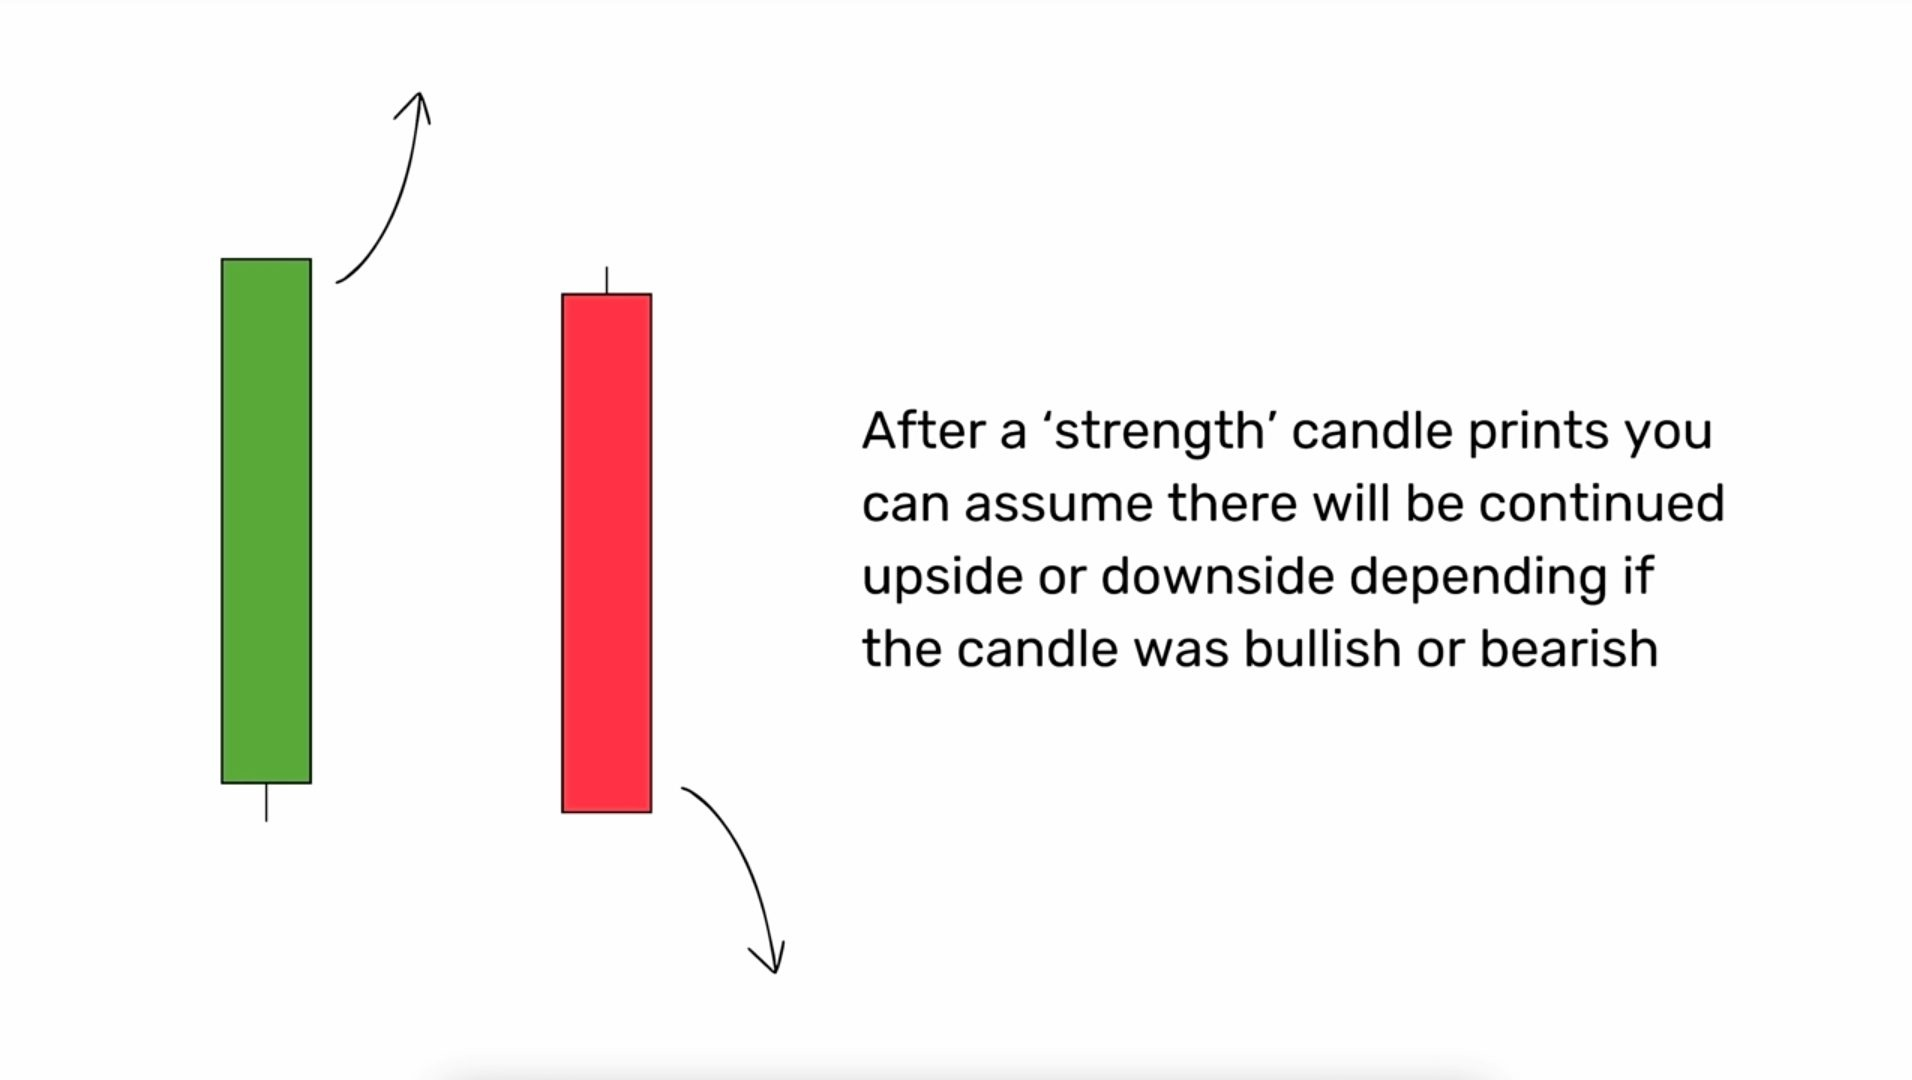
Body size matters more than color. A big body with tiny wicks shows one side overwhelmed the other, and these candles often mark areas where large buyers or sellers entered.
Step 2: Control shift candles (who is taking over?)
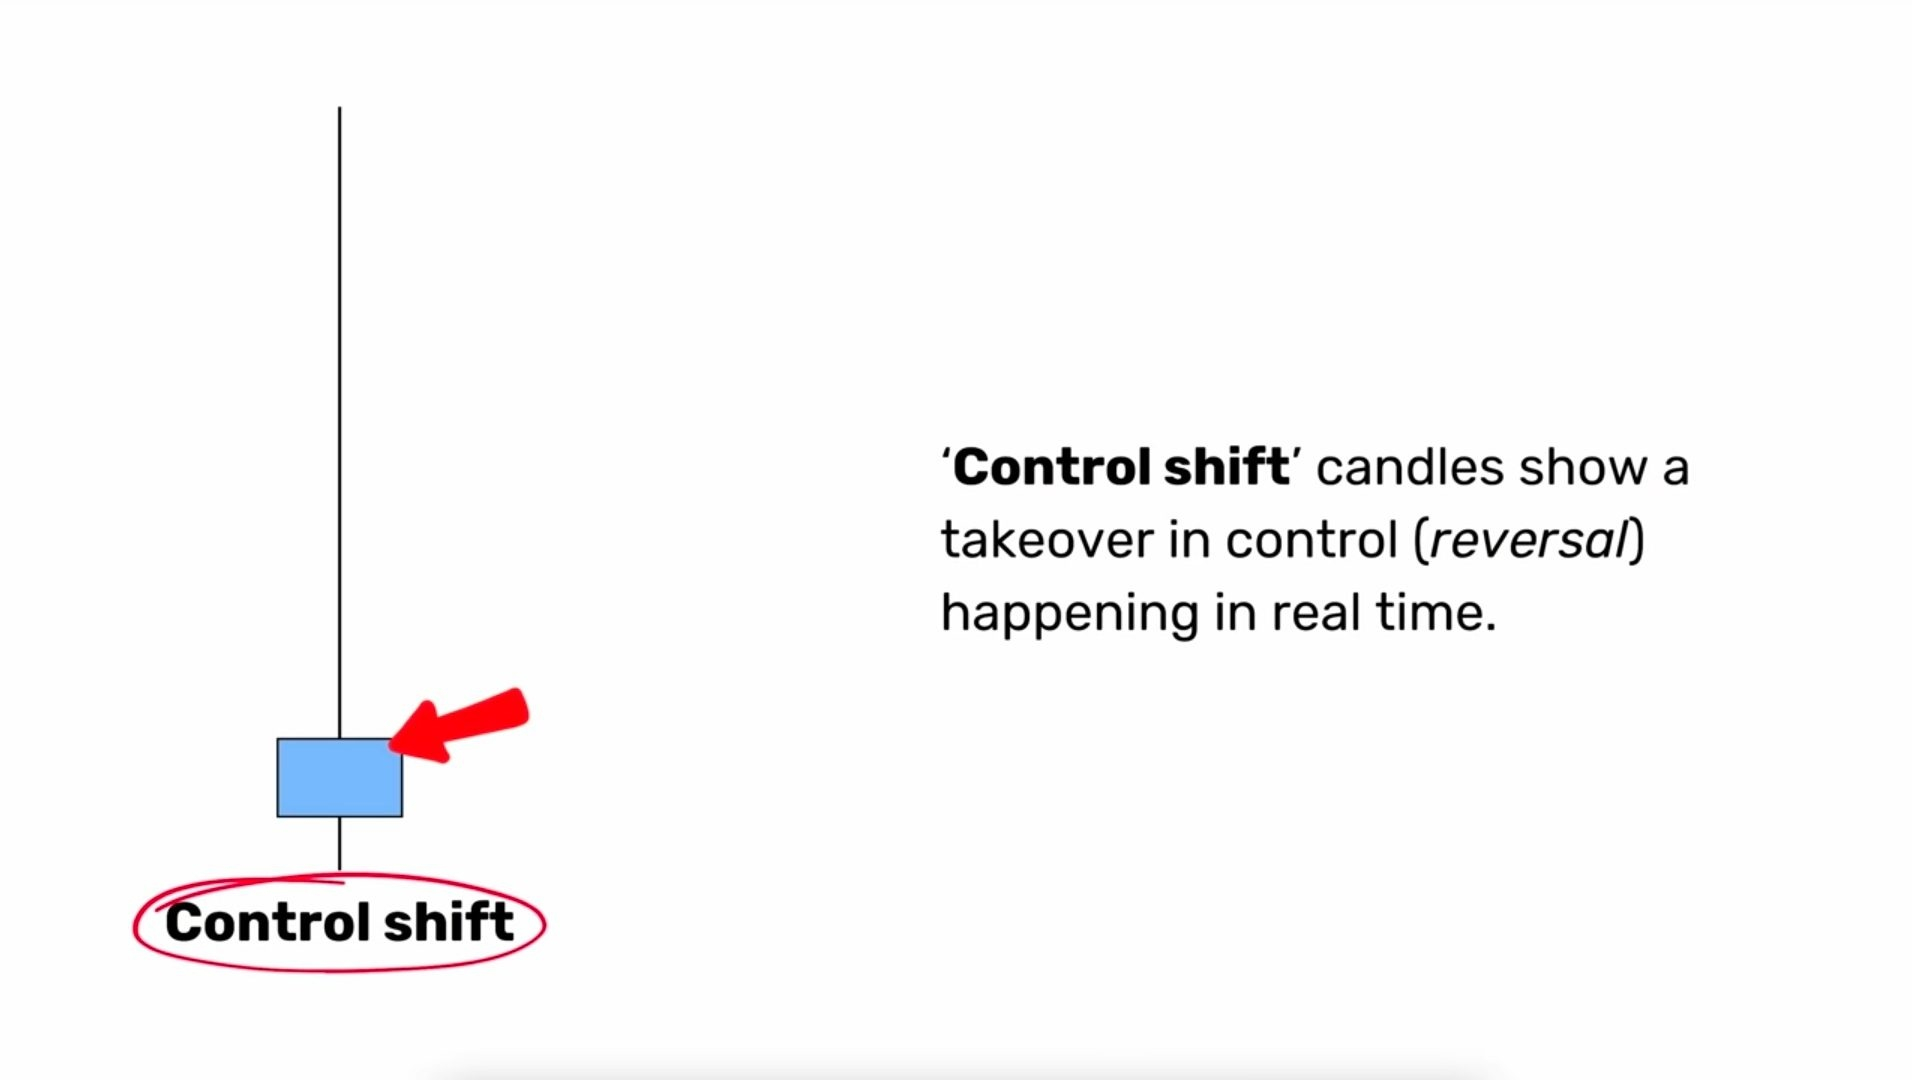
These candles show control moving from one side to the other. The clearest sign is a long wick. Price pushed hard in one direction, got rejected, and closed back the other way.
Two common examples:
Pin bar: a long wick shows rejected prices, and a close away from the wick shows the other side won.
Engulfing candle: one candle covers several previous candles, which shows a takeover.
The key is context. A control shift at a meaningful area tells you much more than the same candle in the middle of nowhere.
Step 3: Indecision candles (nobody is winning)
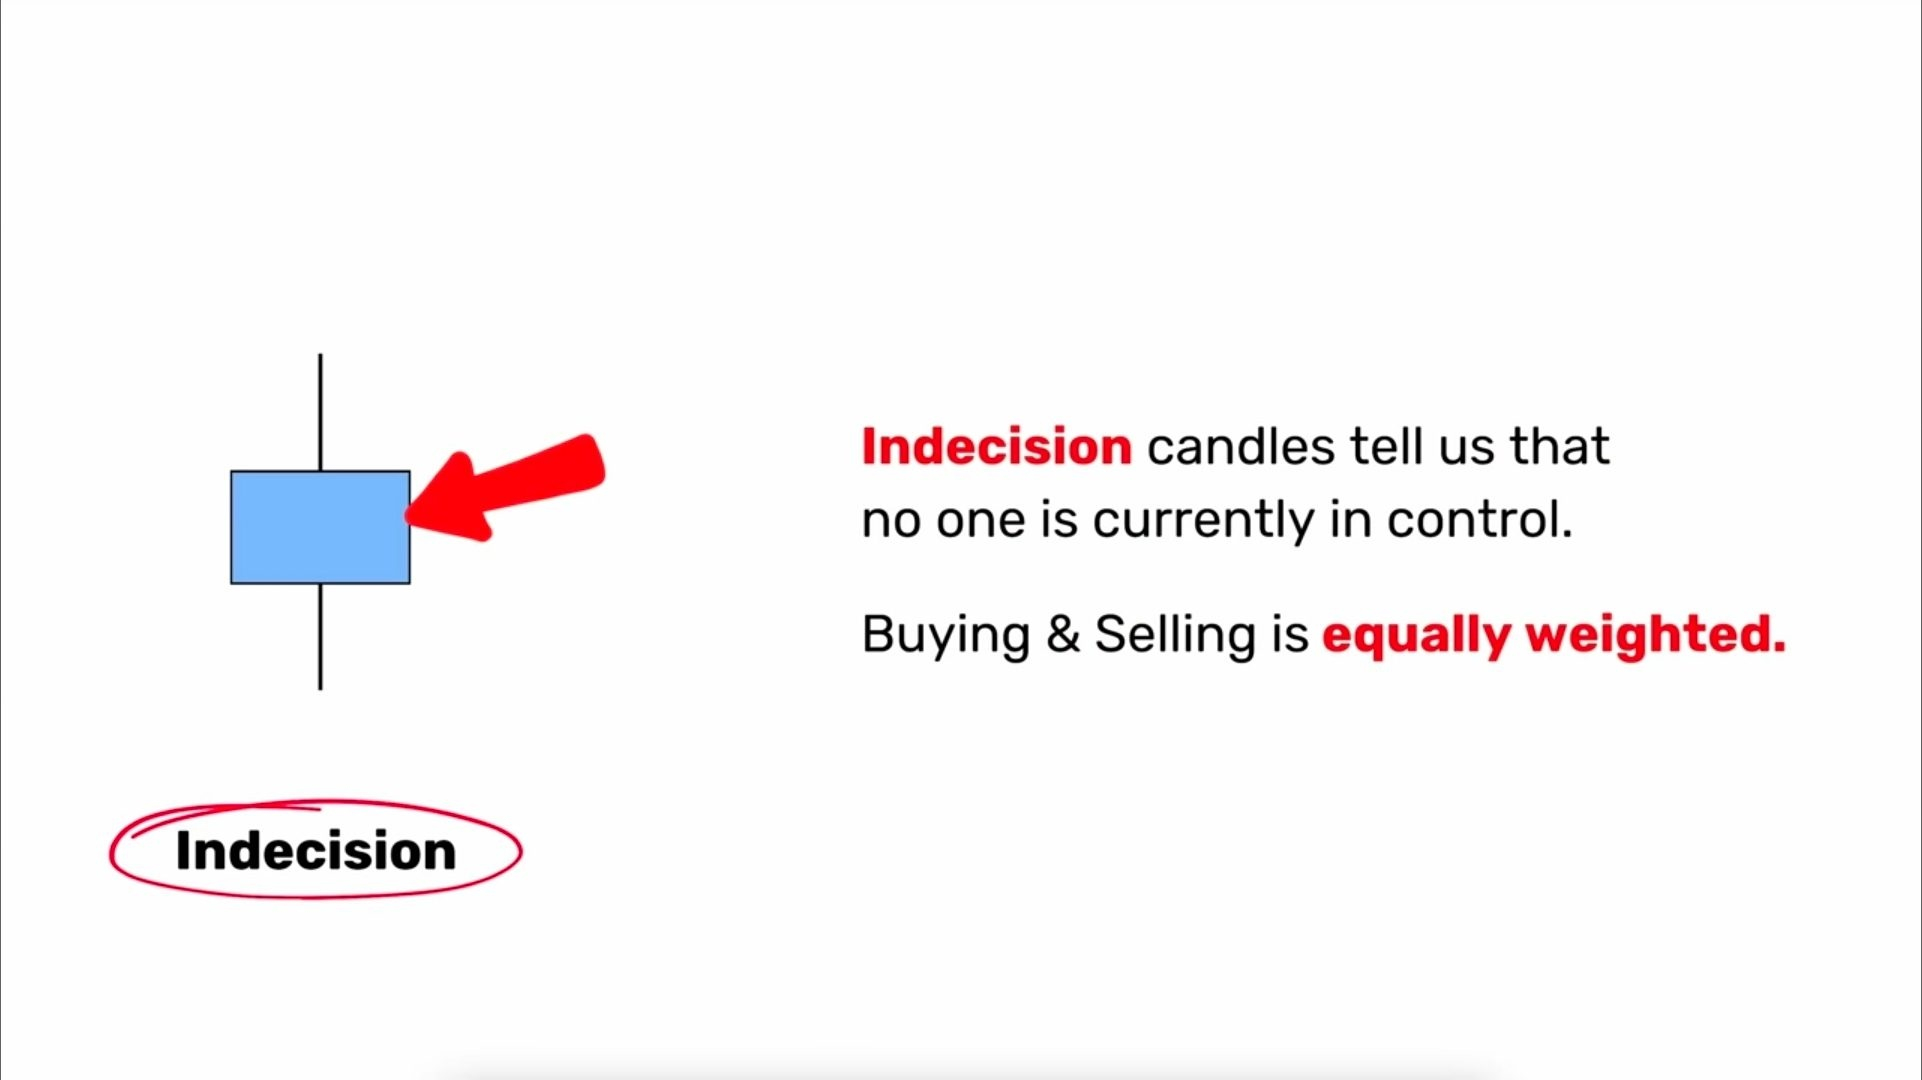
Small bodies with wicks on both sides mean buyers and sellers are balanced. These candles tend to appear during consolidation.
Don’t trade the indecision candle itself. Treat it as a warning that a decision is coming, and wait for a strength candle to show which side wins.
Step 4: Put the candles in market context
Look for strength candles that launched a big move. The area where they began is often a demand or supply zone. When price returns there, watch how the candles behave. If strong candles in your favor appear again, that confirms the area is still respected.
Step 5: Build a trade idea
Mark the area of interest where a strong move began.
Wait for price to return. Don’t chase.
Look for a strength or control shift candle that confirms the area.
Use previous swing highs or lows as logical targets.
Place your stop beyond the zone, so the idea is invalid if price breaks through.
Candles show who is in control, where that control may be changing, and when the market is simply undecided. Learn those three signals, and every chart becomes easier to read.
Educational content only, not financial advice. Always manage your risk and do your own research.