$CYBER Breaks Out of Its Range, but Volatility Is Now the Main Story
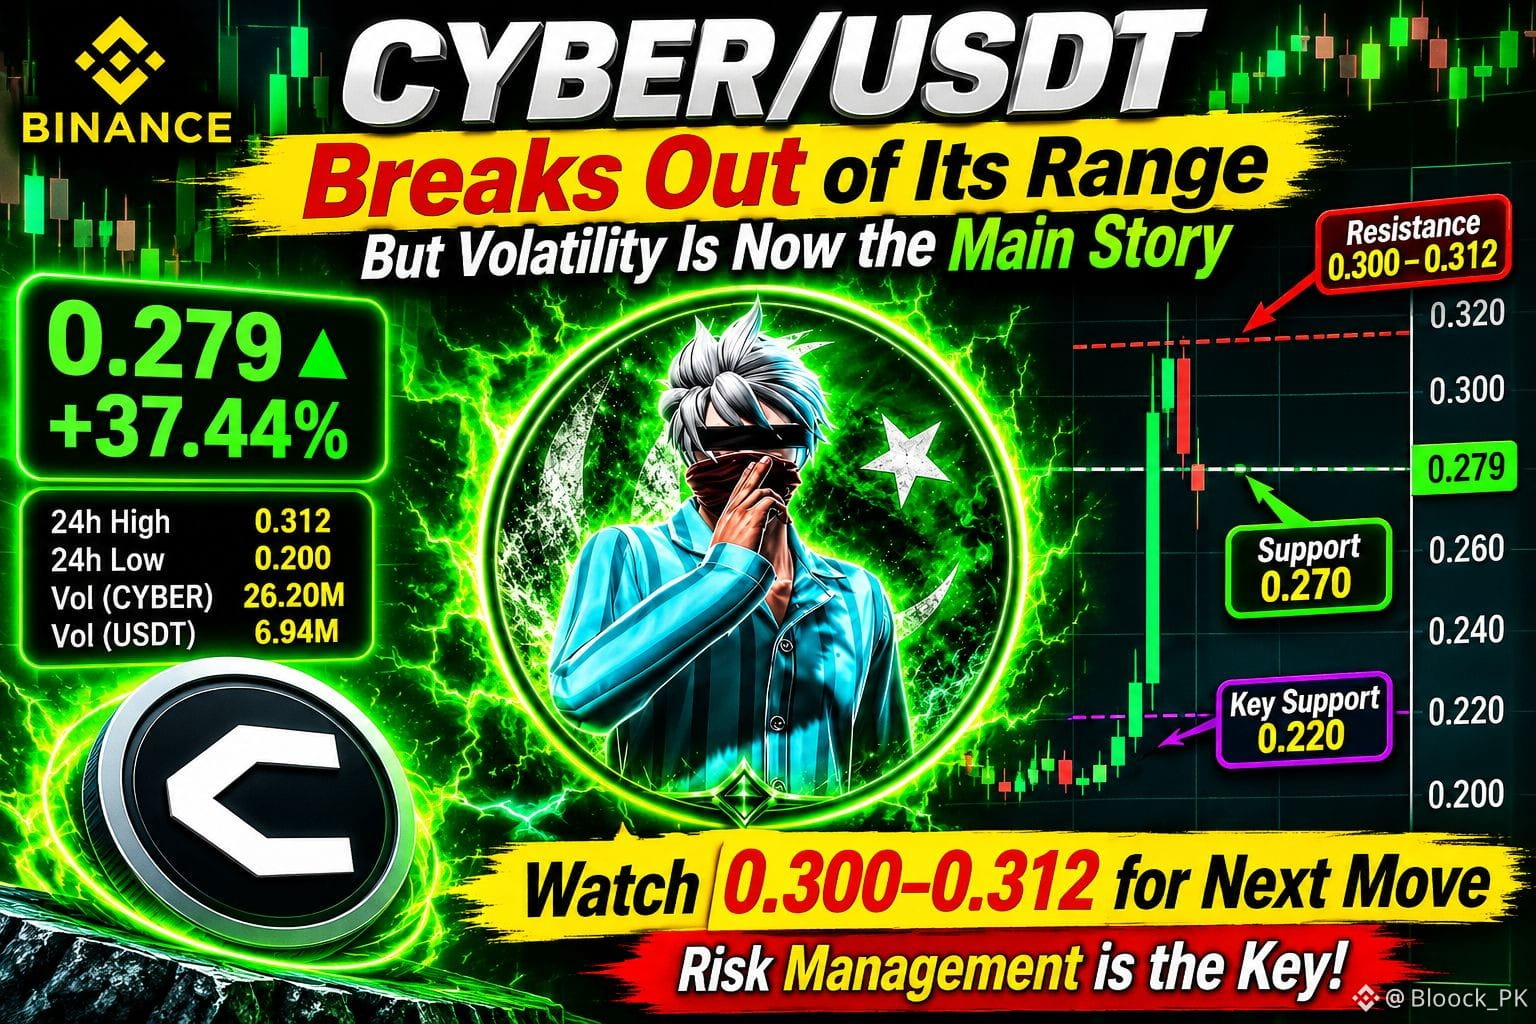
CYBER/USDT is showing a strong change in momentum on the Binance chart during this session. The pair is trading around 0.279 USDT, up 37.44%, after spending a long stretch moving sideways near the 0.200–0.220 area. That quiet structure has now been interrupted by a sudden upward move.
The chart’s most noticeable feature is the sharp green expansion from around 0.220 toward the 0.300 region. This move suggests buyers took control quickly, pushing price out of its earlier range. The 24-hour high is 0.312, while the low is 0.200, showing just how wide the session’s trading range has become. Reported volume stands at 26.20 million CYBER and 6.94 million USDT, indicating activity during the move.
However, the latest candles also show why it is important to separate a breakout from a confirmed continuation. After reaching the 0.300 area, price faced rejection and pulled back toward 0.279. The upper wick and red candle point to selling pressure near the intraday high. That does not erase the earlier breakout, but it does show that buyers need to prove they can defend the higher range.
The 0.300–0.312 zone is the resistance area visible on this chart. A sustained move above it would show that demand is strong. On the downside, the 0.270 area is a nearby level to watch, followed by the former breakout region around 0.220. A deeper return toward the old range would weaken the breakout structure.
CYBER has delivered an impressive momentum move, but the next phase depends on whether price can stabilize after the surge. Watch how candles behave around these levels rather than assuming one large green move guarantees another. High volatility cuts both ways, so risk awareness matters. This is chart commentary, not financial advice.
#CanGTA6'sLaunchLiftTTWOShares? #NvidiaBoardReportedlySplitOverHuang’sReturn #BTCRemainsUnderPressureAfterHawkishFOMCMinutes
CYBER/USDT is showing a strong change in momentum on the Binance chart during this session. The pair is trading around 0.279 USDT, up 37.44%, after spending a long stretch moving sideways near the 0.200–0.220 area. That quiet structure has now been interrupted by a sudden upward move.
The chart’s most noticeable feature is the sharp green expansion from around 0.220 toward the 0.300 region. This move suggests buyers took control quickly, pushing price out of its earlier range. The 24-hour high is 0.312, while the low is 0.200, showing just how wide the session’s trading range has become. Reported volume stands at 26.20 million CYBER and 6.94 million USDT, indicating activity during the move.
However, the latest candles also show why it is important to separate a breakout from a confirmed continuation. After reaching the 0.300 area, price faced rejection and pulled back toward 0.279. The upper wick and red candle point to selling pressure near the intraday high. That does not erase the earlier breakout, but it does show that buyers need to prove they can defend the higher range.
The 0.300–0.312 zone is the resistance area visible on this chart. A sustained move above it would show that demand is strong. On the downside, the 0.270 area is a nearby level to watch, followed by the former breakout region around 0.220. A deeper return toward the old range would weaken the breakout structure.
CYBER has delivered an impressive momentum move, but the next phase depends on whether price can stabilize after the surge. Watch how candles behave around these levels rather than assuming one large green move guarantees another. High volatility cuts both ways, so risk awareness matters. This is chart commentary, not financial advice.
#CanGTA6'sLaunchLiftTTWOShares? #NvidiaBoardReportedlySplitOverHuang’sReturn #BTCRemainsUnderPressureAfterHawkishFOMCMinutes