
Alright... $MMT pumped to $0.31, gave everyone that "to the moon" feeling 🚀😁 and now it's quietly pulling back, right back at the key level 👀
But but... this 1h chart is actually getting interesting.
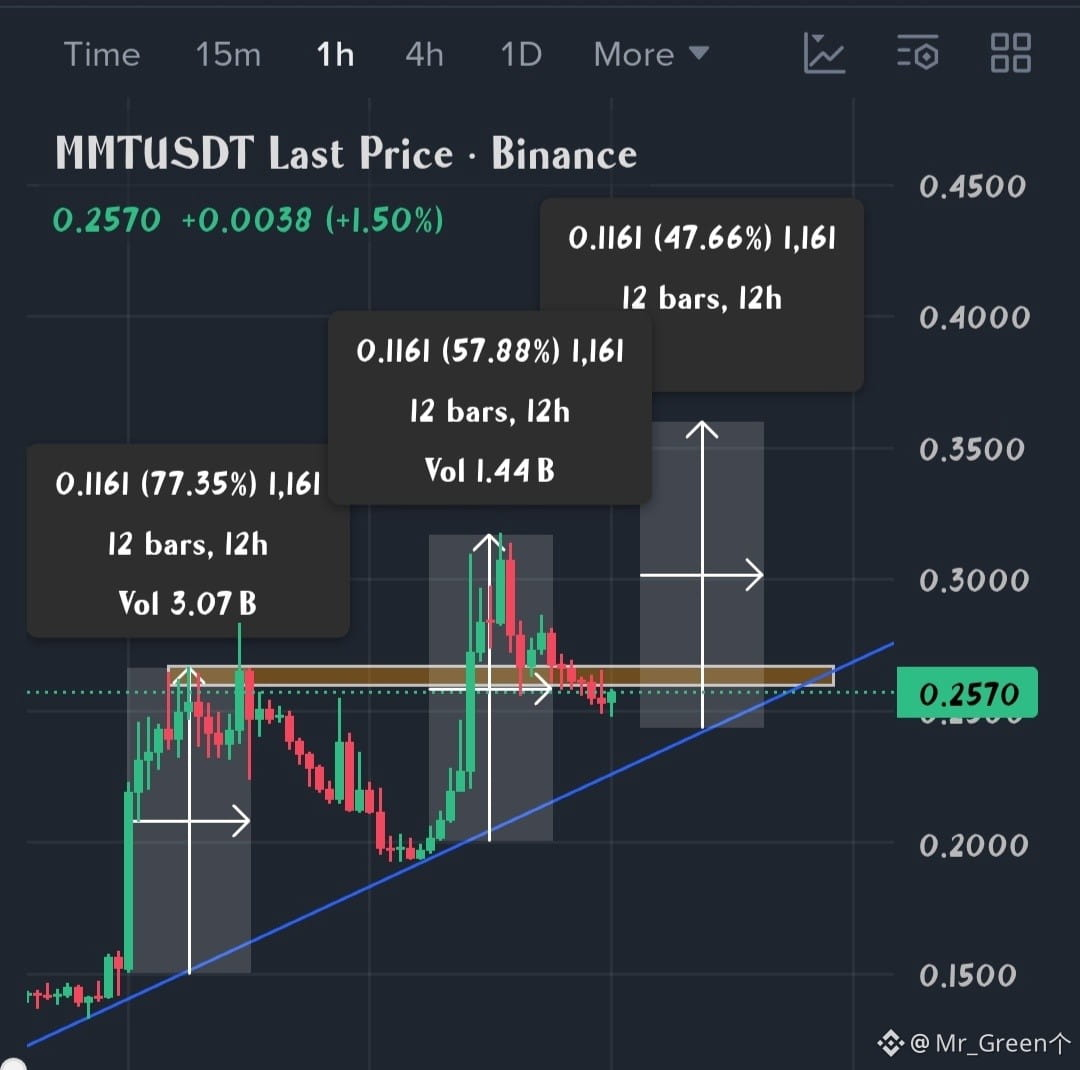
Price is sitting at $0.257, right on that $0.26-$0.265 zone, which has already acted as both resistance and support before. And look at the blue trendline sitting just below it. That's a nice confluence area 🎯
Twice before, price bounced from the trendline and pushed about 12 bars higher: first +77% and then +58%. Those two moves are the pattern I'm watching. The third leg is marked on the chart toward $0.36.
Personally, I am NOT jumping in blindly here... I'm watching how price reacts at this zone 👀
Support: $0.255-$0.26, then the blue trendline around $0.245-$0.25
Deeper support: $0.20-$0.21 where the last bounce started
Resistance: $0.265-$0.27, then the $0.31 high
Targets if buyers step in: $0.30, then $0.31-$0.32, and the extended target near $0.36
The confirmation I want is a strong 1h candle close above $0.27 with volume coming back ✅ That would flip this zone to support and keep the structure bullish.
But if the trendline breaks and we get a clean close below $0.245, the pattern is invalid 😅 Then I step aside and wait for a new setup instead of forcing a trade.
⚠️ Volume has been fading on each leg (3.07B, then 1.44B), so I want to see buyers actually return before getting excited. Patience pays more than FOMO 🧠
So what's your plan here? Will MMT bounce off the trendline and go for $0.36, or are we heading lower? 👇
Follow for more weekly chart analysis and trading opportunities 🔔
Not financial advice. Always DYOR and manage your risk.
Trade Here👇
$EVAA
$SNDK
#NvidiaBoardReportedlySplitOverHuang’sReturn #CanGTA6'sLaunchLiftTTWOShares?
But but... this 1h chart is actually getting interesting.
Price is sitting at $0.257, right on that $0.26-$0.265 zone, which has already acted as both resistance and support before. And look at the blue trendline sitting just below it. That's a nice confluence area 🎯
Twice before, price bounced from the trendline and pushed about 12 bars higher: first +77% and then +58%. Those two moves are the pattern I'm watching. The third leg is marked on the chart toward $0.36.
Personally, I am NOT jumping in blindly here... I'm watching how price reacts at this zone 👀
Support: $0.255-$0.26, then the blue trendline around $0.245-$0.25
Deeper support: $0.20-$0.21 where the last bounce started
Resistance: $0.265-$0.27, then the $0.31 high
Targets if buyers step in: $0.30, then $0.31-$0.32, and the extended target near $0.36
The confirmation I want is a strong 1h candle close above $0.27 with volume coming back ✅ That would flip this zone to support and keep the structure bullish.
But if the trendline breaks and we get a clean close below $0.245, the pattern is invalid 😅 Then I step aside and wait for a new setup instead of forcing a trade.
⚠️ Volume has been fading on each leg (3.07B, then 1.44B), so I want to see buyers actually return before getting excited. Patience pays more than FOMO 🧠
So what's your plan here? Will MMT bounce off the trendline and go for $0.36, or are we heading lower? 👇
Follow for more weekly chart analysis and trading opportunities 🔔
Not financial advice. Always DYOR and manage your risk.
Trade Here👇
$EVAA
$SNDK
#NvidiaBoardReportedlySplitOverHuang’sReturn #CanGTA6'sLaunchLiftTTWOShares?