Why are you looking for a SHORT when the bigger trend is still BULLISH? 📈
Look at $PIEVERSEUSDT before deciding your next trade.
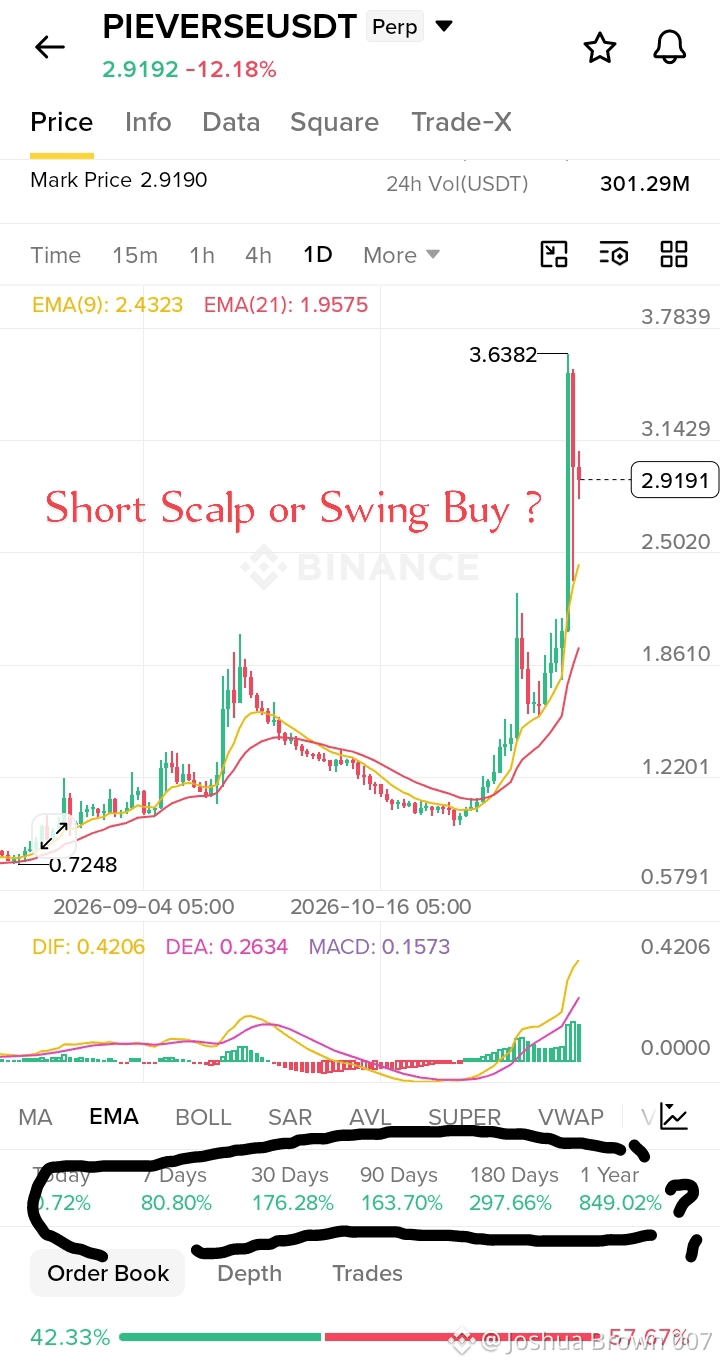
The 1D chart is showing something interesting:
Performance:
7 Days: +80.80%
30 Days: +176.28%
90 Days: +163.70%
180 Days: +297.66%
1 Year: +849.02%
Technical Structure:
👉EMA 9: $2.4323
👉EMA 21: $1.9575
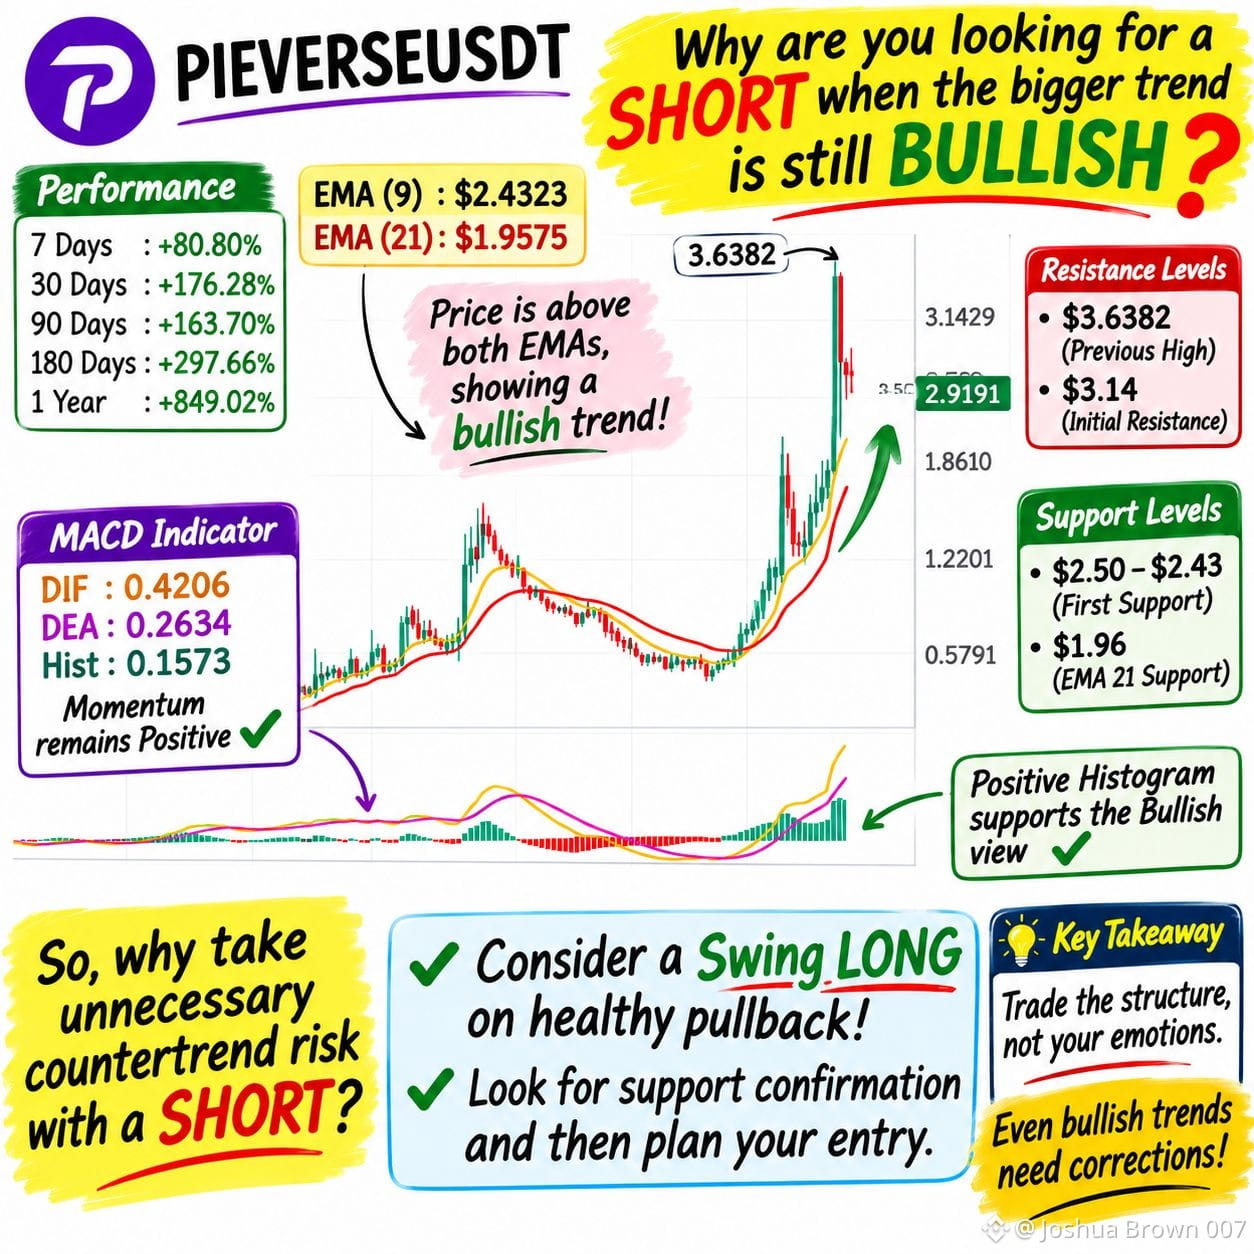
Price is trading above both EMAs, and EMA 9 is comfortably above EMA 21. That's a bullish daily trend structure.
👉MACD: DIF at 0.4206, DEA at 0.2634, with a positive histogram of 0.1573. Momentum remains positive, although the recent rejection from $3.6382 suggests some short-term cooling.
My Trading Perspective:
Yes, a short scalp can develop on a lower timeframe if bearish confirmation appears. But why take unnecessary countertrend risk when the daily structure is still bullish?
If the broader trend supports buyers, I would rather look for a healthy pullback, support confirmation and a potential swing LONG entry.
I would watch:
$2.50–$2.43: First important support area.
$1.96: Daily EMA 21 and deeper trend support.
$3.14: Initial recovery resistance.
$3.6382: Previous swing high.
These are observation levels, not guaranteed entry or target prices.
One question for traders:
If a token is showing +849% yearly performance and maintaining a bullish daily EMA structure, why keep fighting the trend with shorts instead of patiently identifying a better swing-buy opportunity?
Trade the structure, not your emotions. And remember: even bullish trends need corrections.
#PIEVERSE #CryptoTrading #SwingTrading . #TechnicalAnalysis #Binance
$EVAA
Look at $PIEVERSEUSDT before deciding your next trade.
The 1D chart is showing something interesting:
Performance:
7 Days: +80.80%
30 Days: +176.28%
90 Days: +163.70%
180 Days: +297.66%
1 Year: +849.02%
Technical Structure:
👉EMA 9: $2.4323
👉EMA 21: $1.9575
Price is trading above both EMAs, and EMA 9 is comfortably above EMA 21. That's a bullish daily trend structure.
👉MACD: DIF at 0.4206, DEA at 0.2634, with a positive histogram of 0.1573. Momentum remains positive, although the recent rejection from $3.6382 suggests some short-term cooling.
My Trading Perspective:
Yes, a short scalp can develop on a lower timeframe if bearish confirmation appears. But why take unnecessary countertrend risk when the daily structure is still bullish?
If the broader trend supports buyers, I would rather look for a healthy pullback, support confirmation and a potential swing LONG entry.
I would watch:
$2.50–$2.43: First important support area.
$1.96: Daily EMA 21 and deeper trend support.
$3.14: Initial recovery resistance.
$3.6382: Previous swing high.
These are observation levels, not guaranteed entry or target prices.
One question for traders:
If a token is showing +849% yearly performance and maintaining a bullish daily EMA structure, why keep fighting the trend with shorts instead of patiently identifying a better swing-buy opportunity?
Trade the structure, not your emotions. And remember: even bullish trends need corrections.
#PIEVERSE #CryptoTrading #SwingTrading . #TechnicalAnalysis #Binance
$EVAA