$MUB: MUB: The Dilemma of Invalidation Quality
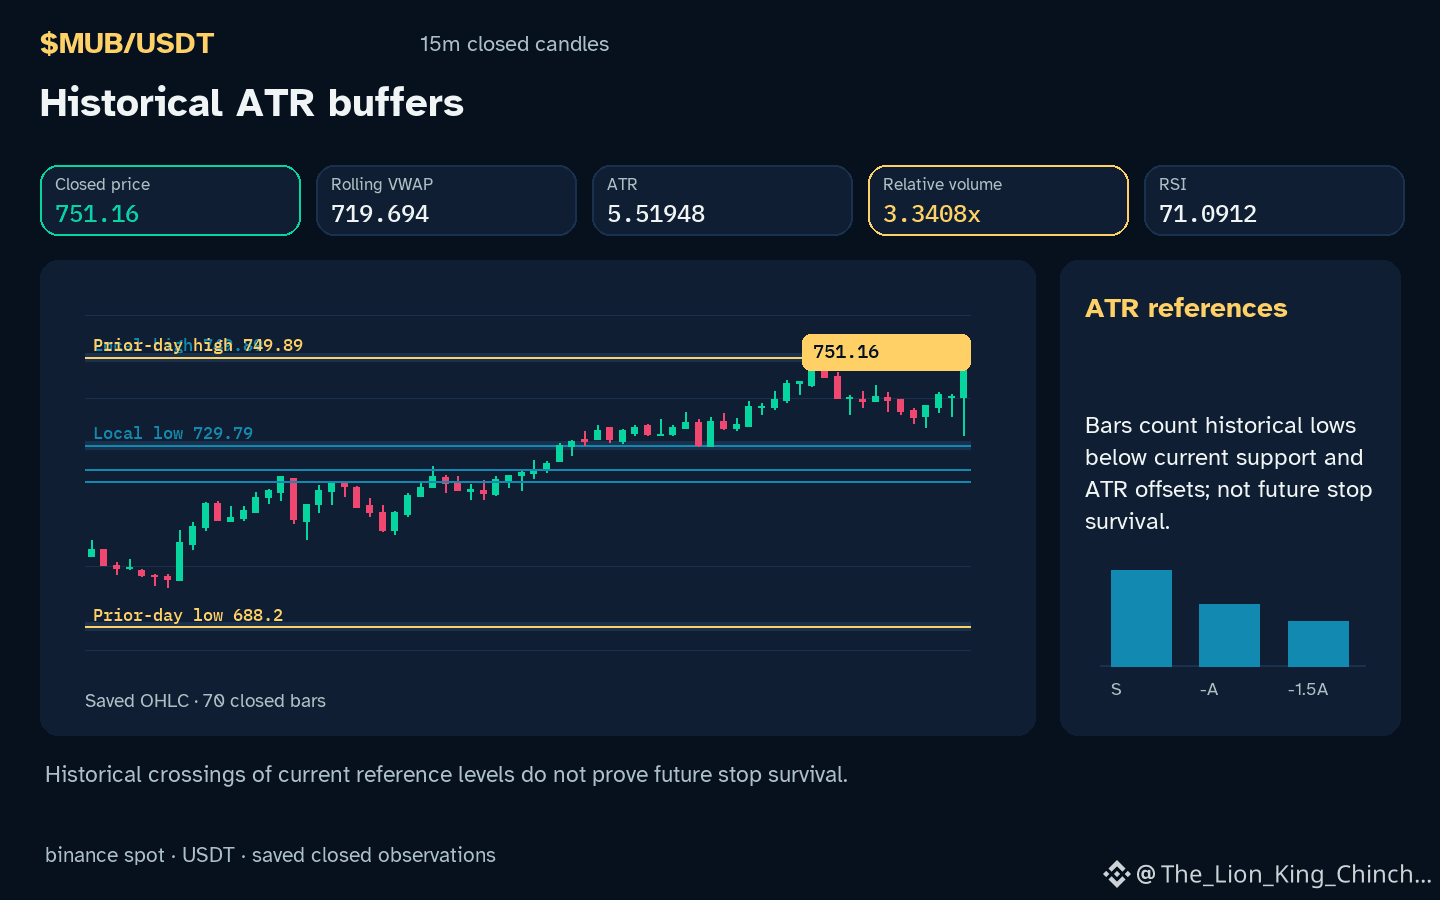
Does the local chart structure for $MUB offer a clear point of failure or merely a high-conviction visual pattern? With the hourly direction up and volume 3.34x the baseline, the current price sits above resistance. While upward momentum is visible, the feasibility of a trade often depends on the distance to a structural exit rather than the strength of the move itself.
Consider the trade-off between entry quality and invalidation distance. A hypothetical entry near the current level assumes the previous resistance 749.89 will now serve as a floor. If a trader waits for a deeper retracement toward support 729.79 to improve the potential reward ratio, they risk the asset continuing higher without them. Conversely, entering immediately creates a wider gap to a meaningful invalidation point. This gap represents the cost of certainty; a tighter stop might be triggered by noise, while a wider stop requires a larger price drop to prove the initial thesis wrong.
This tension highlights the limits of current observations. RSI 71.1 and daily change 6.98151% describe the recent window but do not forecast where buyers might return. A counterexample occurs when price drifts sideways: the lack of volatility makes the stop appear safe, yet the absence of momentum weakens the original reason for entry. If a closed hourly candle returns below the local support 729.79, the current interpretation of an upward trend would require immediate reassessment.
Probabilistic market research, not a recommendation or guaranteed return.
#MUB #RiskManagement #CryptoLearning
Does the local chart structure for $MUB offer a clear point of failure or merely a high-conviction visual pattern? With the hourly direction up and volume 3.34x the baseline, the current price sits above resistance. While upward momentum is visible, the feasibility of a trade often depends on the distance to a structural exit rather than the strength of the move itself.
Consider the trade-off between entry quality and invalidation distance. A hypothetical entry near the current level assumes the previous resistance 749.89 will now serve as a floor. If a trader waits for a deeper retracement toward support 729.79 to improve the potential reward ratio, they risk the asset continuing higher without them. Conversely, entering immediately creates a wider gap to a meaningful invalidation point. This gap represents the cost of certainty; a tighter stop might be triggered by noise, while a wider stop requires a larger price drop to prove the initial thesis wrong.
This tension highlights the limits of current observations. RSI 71.1 and daily change 6.98151% describe the recent window but do not forecast where buyers might return. A counterexample occurs when price drifts sideways: the lack of volatility makes the stop appear safe, yet the absence of momentum weakens the original reason for entry. If a closed hourly candle returns below the local support 729.79, the current interpretation of an upward trend would require immediate reassessment.
Probabilistic market research, not a recommendation or guaranteed return.
#MUB #RiskManagement #CryptoLearning