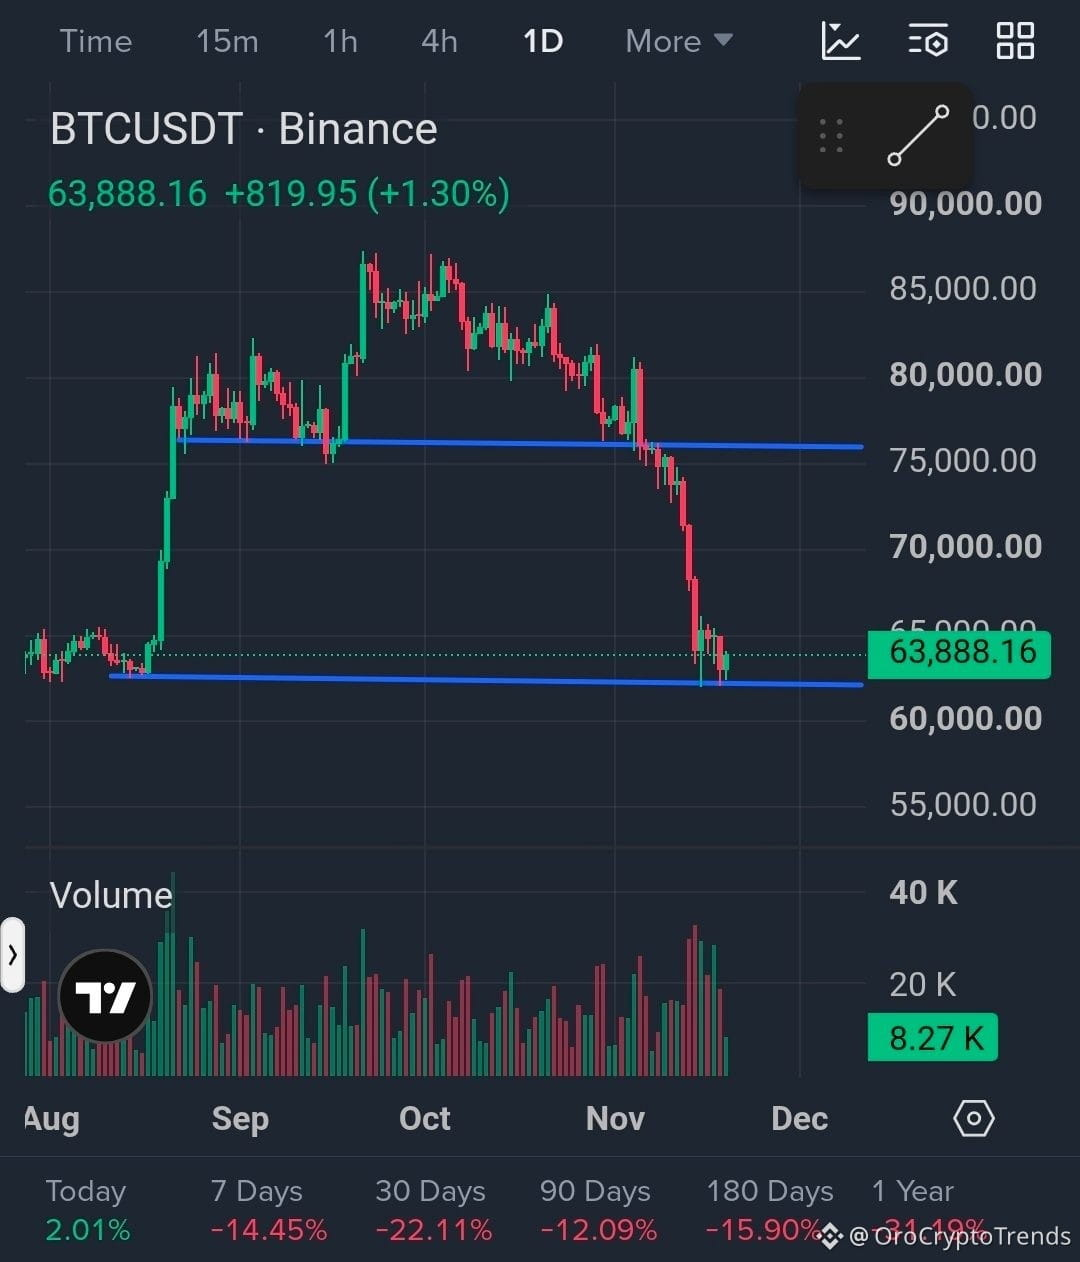

$BTC is back at the origin of the whole rally, and $62K is the line to watch. 📉
Bitcoin has given back its entire move from the August base, and price is now testing that level again. According to Binance’s BTC/USDT daily chart, BTC trades near $63,888, up about 2% today but still down about 14% over 7 days and 22% over 30 days.
What the chart shows:
🔻 Full retrace: BTC rallied from about $62K to $87K, ranged for roughly two months, and is now back at the starting point.
🔻 Range breakdown: The $76K base of the range failed in November. It is now resistance.
🔻 Measured move: The range was about $11K tall. Projected down from the $76K break, the target lands near $64K-$65K, and price has already reached it.
🔻 Momentum: The drop from $76K to $64K came as a run of large red candles with very little pullback. That is momentum selling.
🔻 Buyers defending: A high-volume green candle with a long lower wick appeared near $62K, which suggests buyers stepped in at the August base.
Key levels to watch:
🟥 Resistance: $65K-$66K, $68K-$70K, $76K
🟩 Support: $62K, then $60K, then $55K
Two scenarios:
Bullish: A daily close above $65K-$66K on rising volume would show the $62K defense is working, with $68K-$70K as the next area. Only a reclaim of $76K changes the trend structure.
Bearish: A daily close below $62K would break the August base and open the way to $60K, then likely $55K, since there is little structure between.
What I’m watching: the daily close relative to $62K, and whether this bounce comes on rising or fading volume. Today’s volume is still light, so I’m not treating it as confirmation yet. A bounce at support inside a downtrend is not a reversal.
No hype and no prediction, just levels and conditions. Let the chart confirm the move.
⚠️ This is a chart read, not financial advice. Support levels can fail, so manage your risk and do your own research.
What’s your read: does the August base hold or break? 👇
#BTC #Bitcoin #OroCryptoTrends
Bitcoin has given back its entire move from the August base, and price is now testing that level again. According to Binance’s BTC/USDT daily chart, BTC trades near $63,888, up about 2% today but still down about 14% over 7 days and 22% over 30 days.
What the chart shows:
🔻 Full retrace: BTC rallied from about $62K to $87K, ranged for roughly two months, and is now back at the starting point.
🔻 Range breakdown: The $76K base of the range failed in November. It is now resistance.
🔻 Measured move: The range was about $11K tall. Projected down from the $76K break, the target lands near $64K-$65K, and price has already reached it.
🔻 Momentum: The drop from $76K to $64K came as a run of large red candles with very little pullback. That is momentum selling.
🔻 Buyers defending: A high-volume green candle with a long lower wick appeared near $62K, which suggests buyers stepped in at the August base.
Key levels to watch:
🟥 Resistance: $65K-$66K, $68K-$70K, $76K
🟩 Support: $62K, then $60K, then $55K
Two scenarios:
Bullish: A daily close above $65K-$66K on rising volume would show the $62K defense is working, with $68K-$70K as the next area. Only a reclaim of $76K changes the trend structure.
Bearish: A daily close below $62K would break the August base and open the way to $60K, then likely $55K, since there is little structure between.
What I’m watching: the daily close relative to $62K, and whether this bounce comes on rising or fading volume. Today’s volume is still light, so I’m not treating it as confirmation yet. A bounce at support inside a downtrend is not a reversal.
No hype and no prediction, just levels and conditions. Let the chart confirm the move.
⚠️ This is a chart read, not financial advice. Support levels can fail, so manage your risk and do your own research.
What’s your read: does the August base hold or break? 👇
#BTC #Bitcoin #OroCryptoTrends