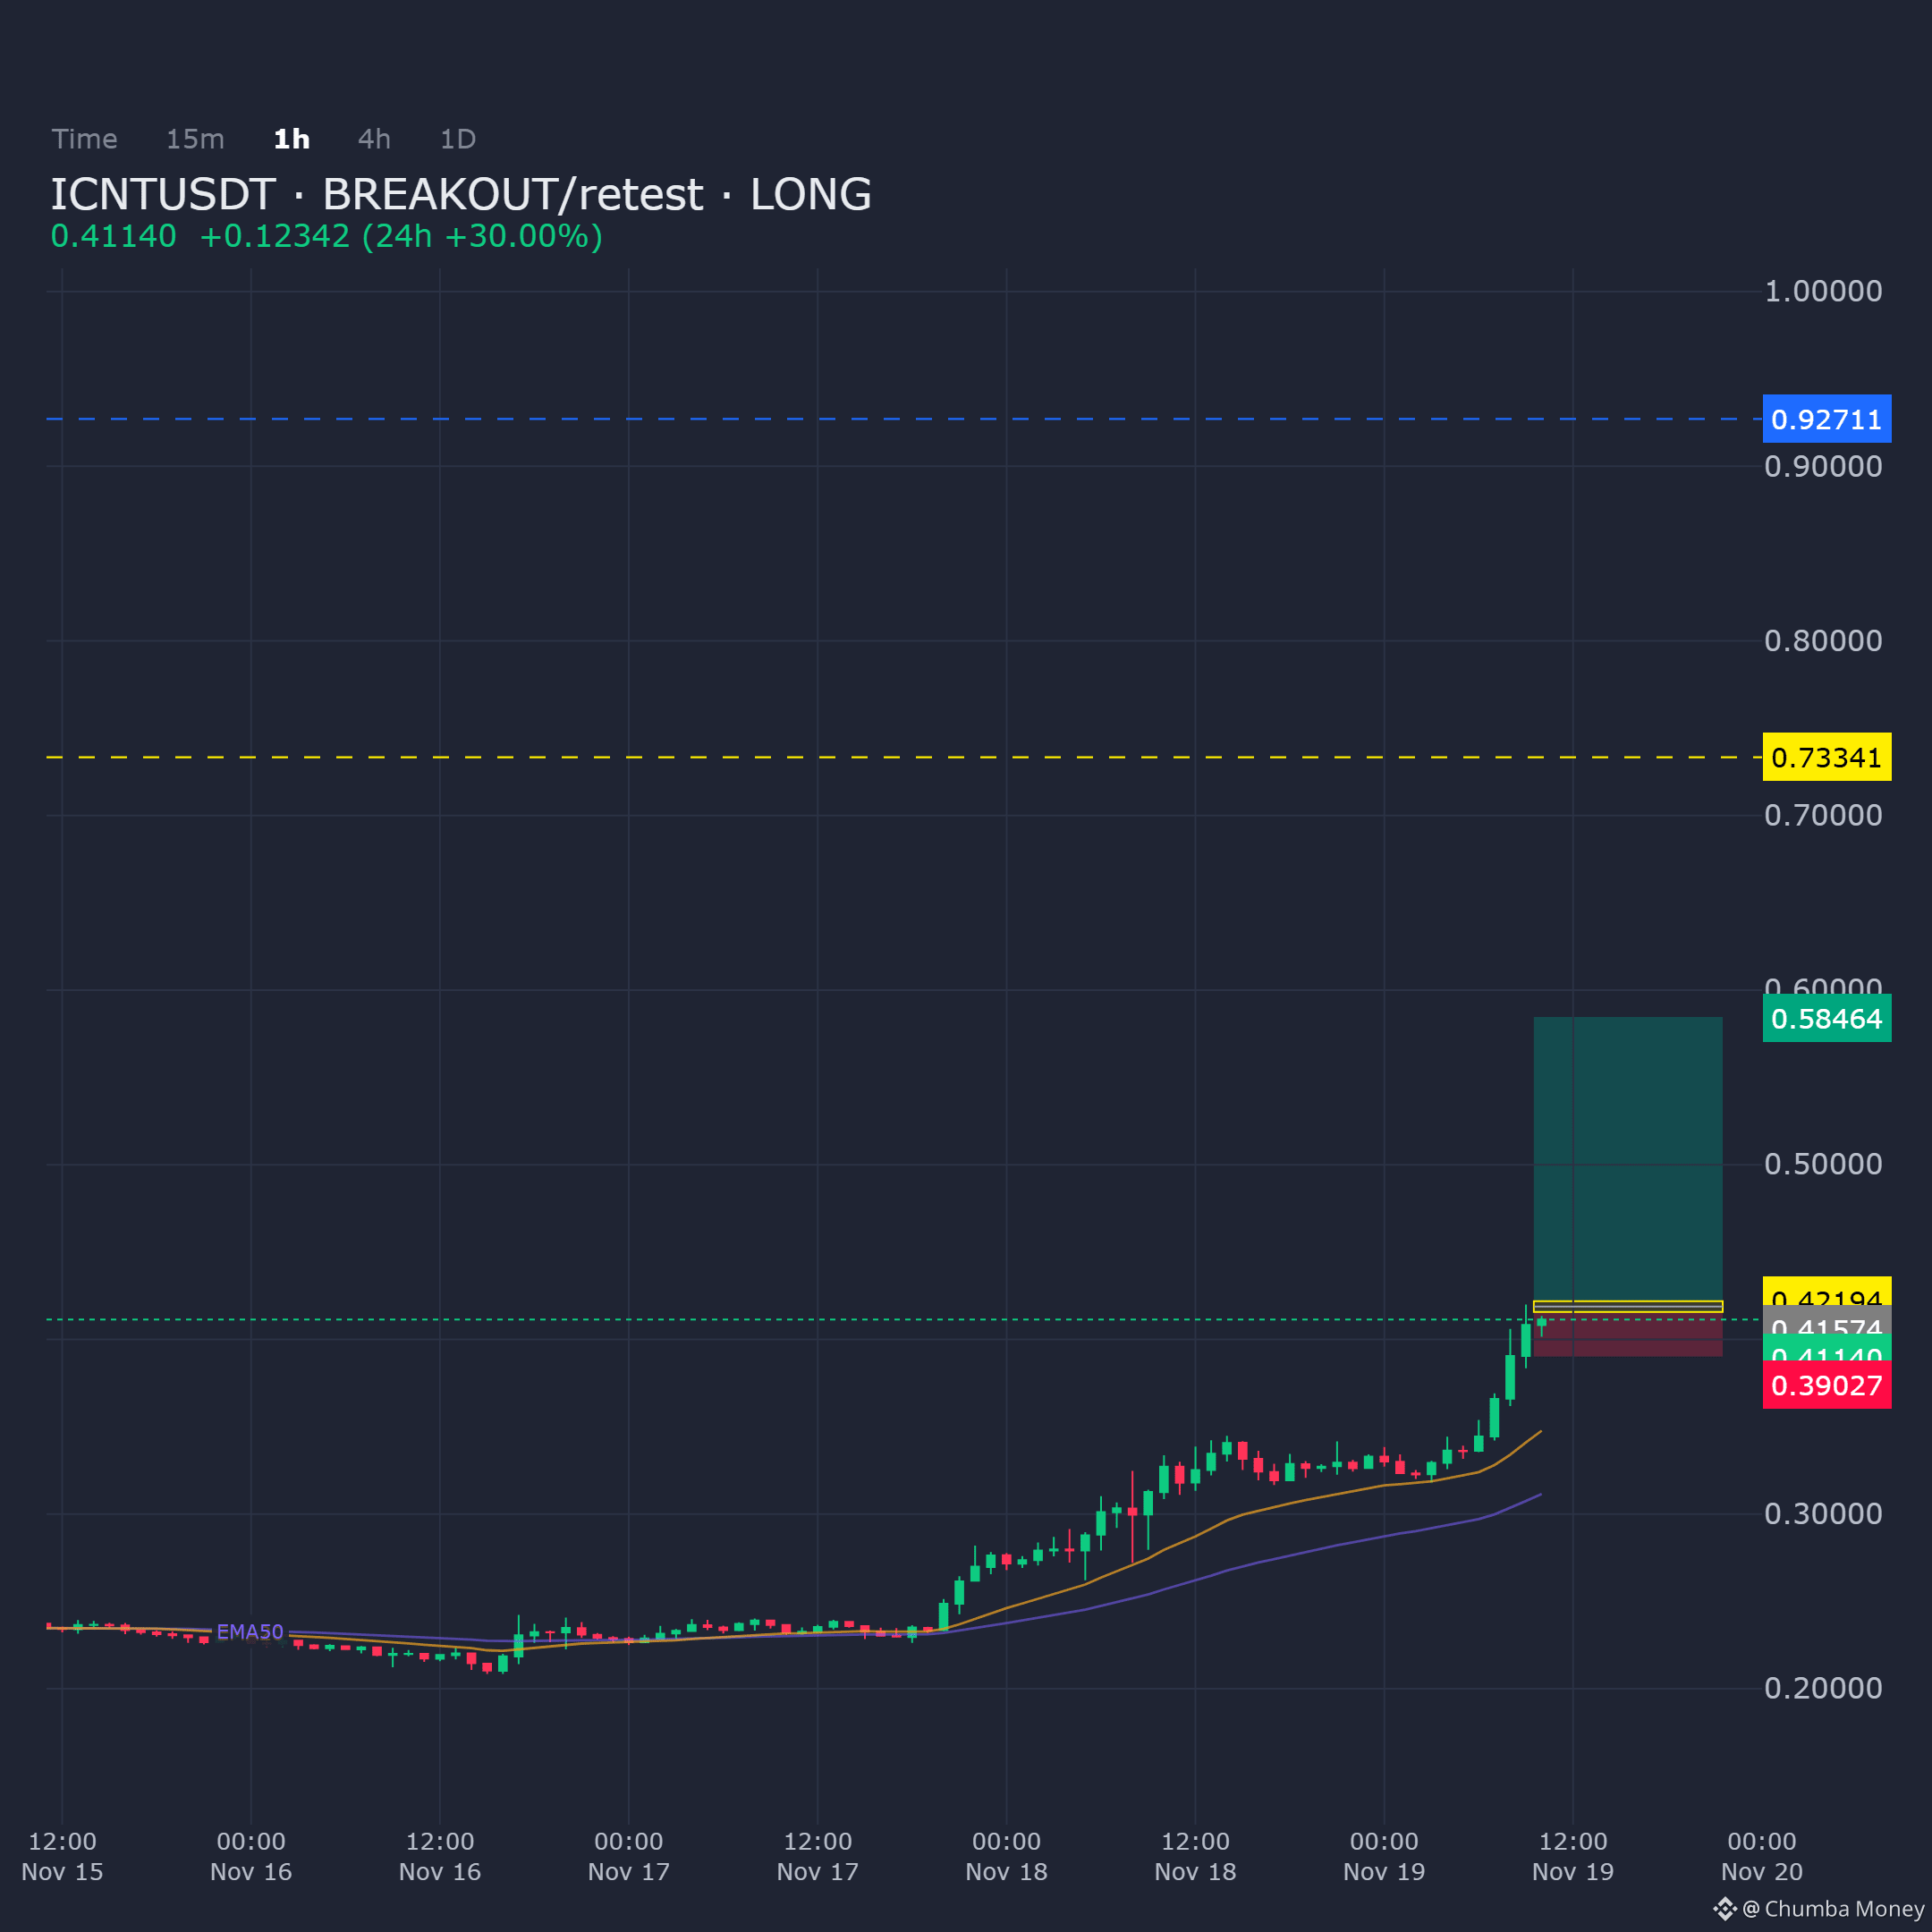

ICNTUSDT on the 1H chart shows price retracing into a demand zone following a breakout. The long bias remains intact provided this area continues to hold.
Entry: 0.415739 - 0.421937
Targets: TP1: 0.584645, TP2: 0.733407, TP3: 0.927107
Stop Loss: 0.390271
$ICNT
Entry: 0.415739 - 0.421937
Targets: TP1: 0.584645, TP2: 0.733407, TP3: 0.927107
Stop Loss: 0.390271
$ICNT