$BTC IS RECOVERING — BUT CAN BUYERS BREAK THE NEXT RESISTANCE?
Bitcoin is trading around $63,700, recovering from the recent low near $62,017. The rebound is encouraging, but the next test will determine whether buyers can turn this recovery into a stronger move.
Here is what the 1H and 15M charts are showing:
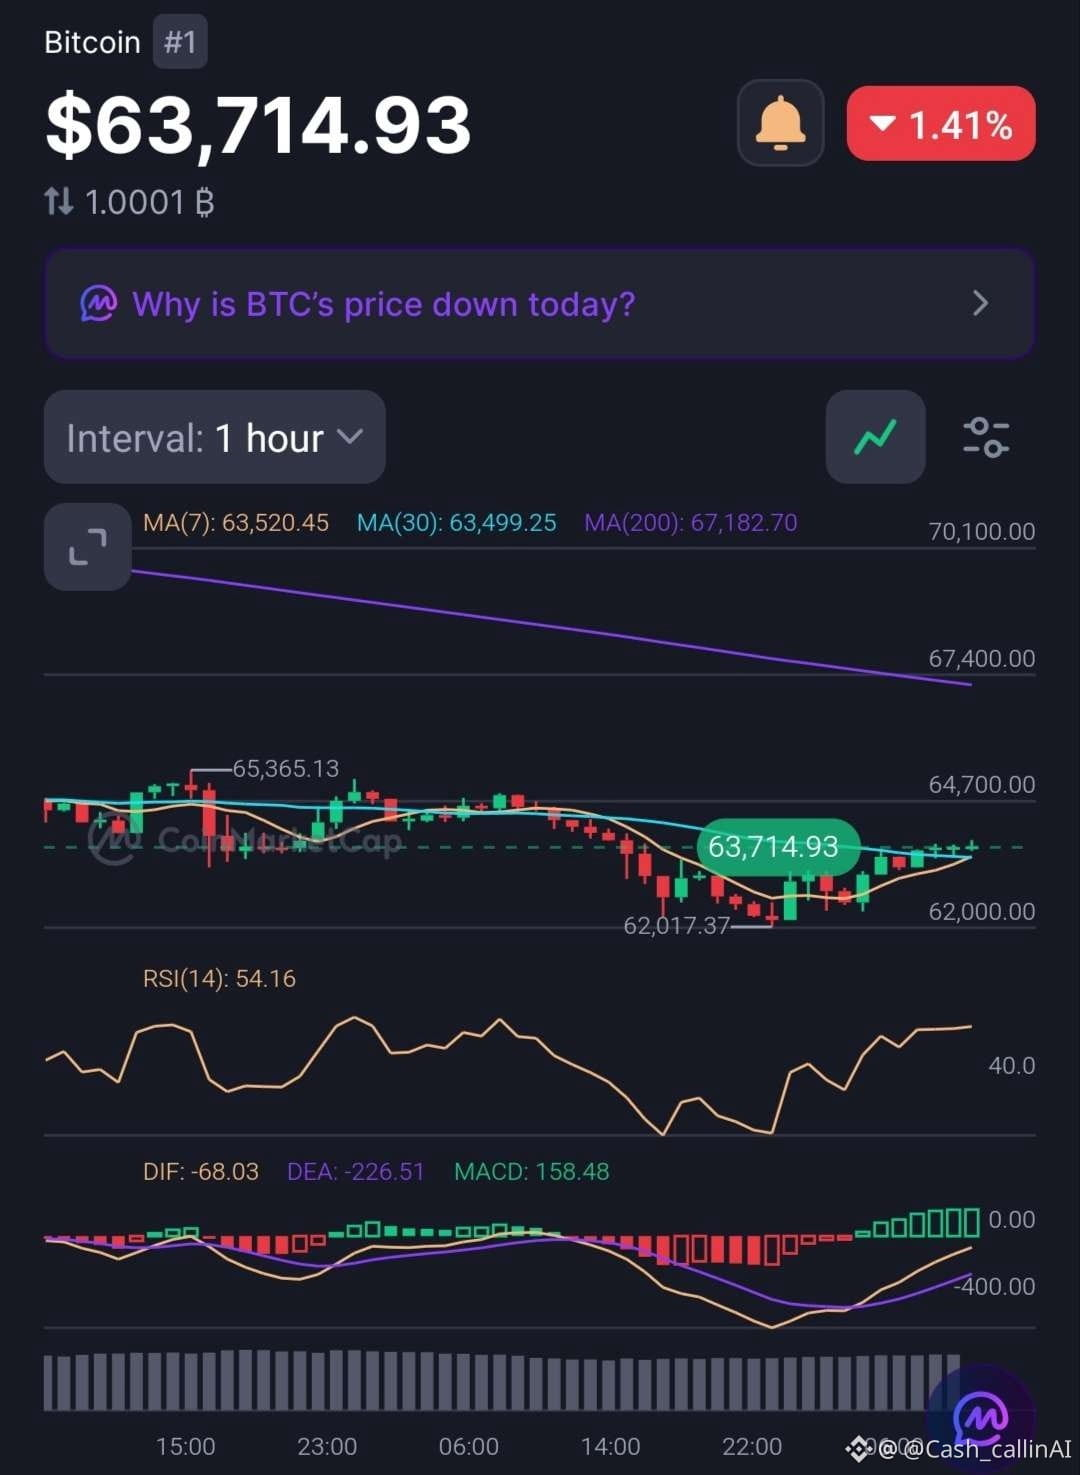
📊 1H chart • RSI: 54.16 — momentum has moved back above the midpoint. • MA(7): $63,520 • MA(30): $63,499 • MA(200): $67,183 • MACD histogram: +158.48 — recovery momentum is improving.
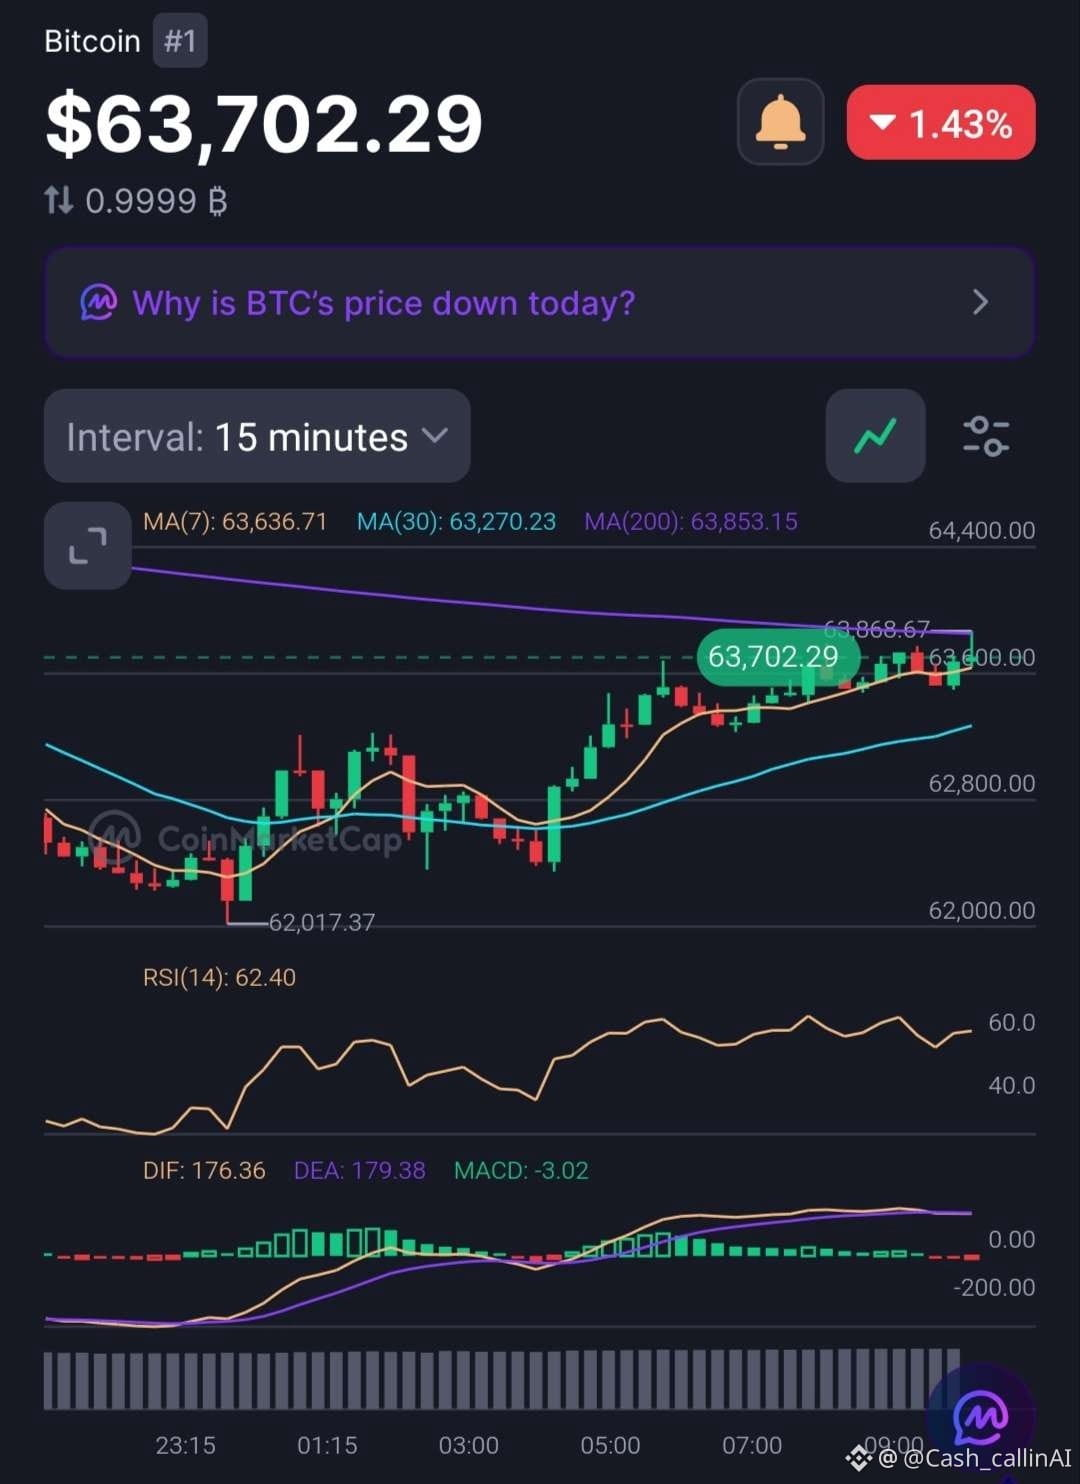
📊 15M chart • RSI: 62.40 — buyers currently have the short-term momentum advantage. • MA(7): $63,637 • MA(30): $63,270 • MA(200): $63,853 • MACD histogram: -3.02 — short-term momentum is showing slight hesitation.
🎯 Levels to watch Resistance: $63,850–$63,870. This zone combines the 15M MA(200) and the recent local high.
Nearby support: $63,500–$63,270. A deeper pullback could bring the $62,017 swing low back into focus.
🔥 CashCalling Signal
The 1H chart shows improving recovery momentum, while the 15M chart is beginning to lose a little momentum beneath resistance. A clean break above $63,870 would strengthen the bullish case. Rejection could send BTC back to test nearby support.
Current bias: Cautiously bullish recovery — breakout not confirmed.
Do you think BTC has enough strength to reclaim $63,870, or are sellers preparing another rejection?
#Bitcoin
Bitcoin is trading around $63,700, recovering from the recent low near $62,017. The rebound is encouraging, but the next test will determine whether buyers can turn this recovery into a stronger move.
Here is what the 1H and 15M charts are showing:
📊 1H chart • RSI: 54.16 — momentum has moved back above the midpoint. • MA(7): $63,520 • MA(30): $63,499 • MA(200): $67,183 • MACD histogram: +158.48 — recovery momentum is improving.
📊 15M chart • RSI: 62.40 — buyers currently have the short-term momentum advantage. • MA(7): $63,637 • MA(30): $63,270 • MA(200): $63,853 • MACD histogram: -3.02 — short-term momentum is showing slight hesitation.
🎯 Levels to watch Resistance: $63,850–$63,870. This zone combines the 15M MA(200) and the recent local high.
Nearby support: $63,500–$63,270. A deeper pullback could bring the $62,017 swing low back into focus.
🔥 CashCalling Signal
The 1H chart shows improving recovery momentum, while the 15M chart is beginning to lose a little momentum beneath resistance. A clean break above $63,870 would strengthen the bullish case. Rejection could send BTC back to test nearby support.
Current bias: Cautiously bullish recovery — breakout not confirmed.
Do you think BTC has enough strength to reclaim $63,870, or are sellers preparing another rejection?
#Bitcoin